Title Frame Module 15: The Jovian Planets Activity 1: Jupiter, the dominant Gas Giant.
44
Title Frame Module 15: The Jovian Planets Activity 1: Jupiter, the dominant Gas Giant
-
Upload
brian-young -
Category
Documents
-
view
224 -
download
3
Transcript of Title Frame Module 15: The Jovian Planets Activity 1: Jupiter, the dominant Gas Giant.

Title FrameModule 15:
The Jovian Planets
Activity 1: Jupiter, the dominant Gas Giant

Summary:
Jupiter is the first of four planets categorized as Jovian Gas
Giants. Jovian is derived from the Latin name for Jupiter.
In this Activity, we will investigate:(a) why Jupiter is an important planet for study,(b) Jupiter’s vital statistics,(c) properties,(d) space missions to Jupiter, and(e) Comet Shoemaker-Levy 9.

(a) Why is Jupiter an important planet to study?
This image provides some answers … (Earth added to scale)
Comparisons with Earth
Atmosphere properties
Long term features such as the Great Red Spot
Jupiter’s Satellites
Jupiter-sized planets have been found around other stars
Being the Sun’s largest planet, Jupiter might be expected to influence the trajectories of other planets, comets - and spacecraft! And more ...

Earth
Jupiter
~12 years1 year
Sun
Jupiter’s orbit
Different scales for size and distance
150 million km ( = 1 AU - Astronomical Unit )
a further 4.2 AU
Approximate values are initially used
(b) Vital Statistics

Jupiter’s size
Here is our familiar Earth and Jupiter and its brightest satellites as visible in a small telescope
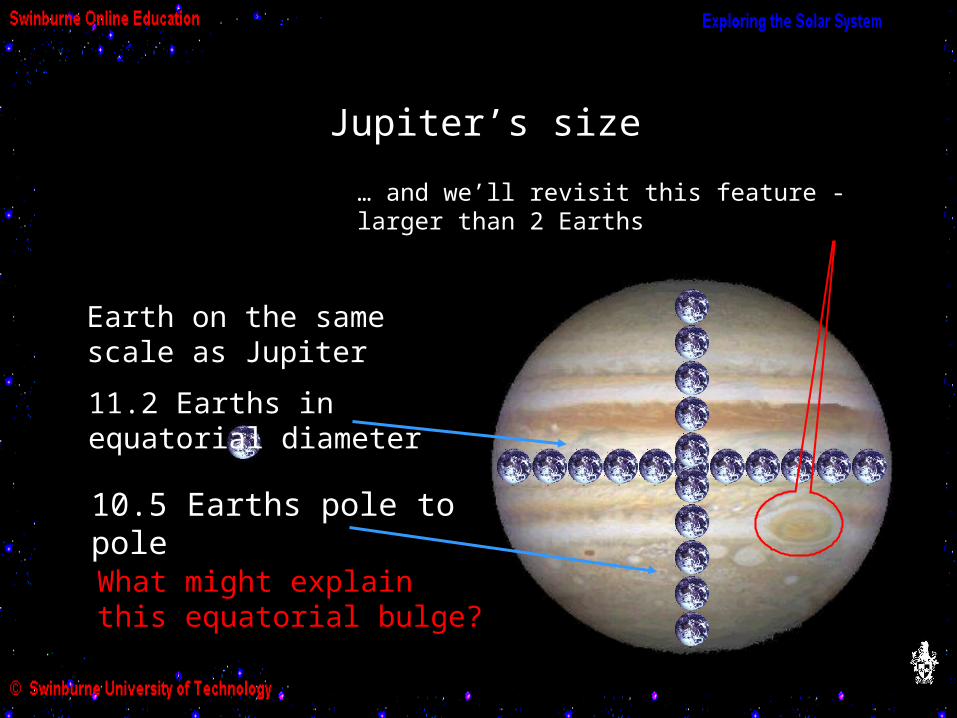
Jupiter’s size
Earth on the same scale as Jupiter
What might explain this equatorial bulge?
11.2 Earths in equatorial diameter
10.5 Earths pole to pole
… and we’ll revisit this feature - larger than 2 Earths
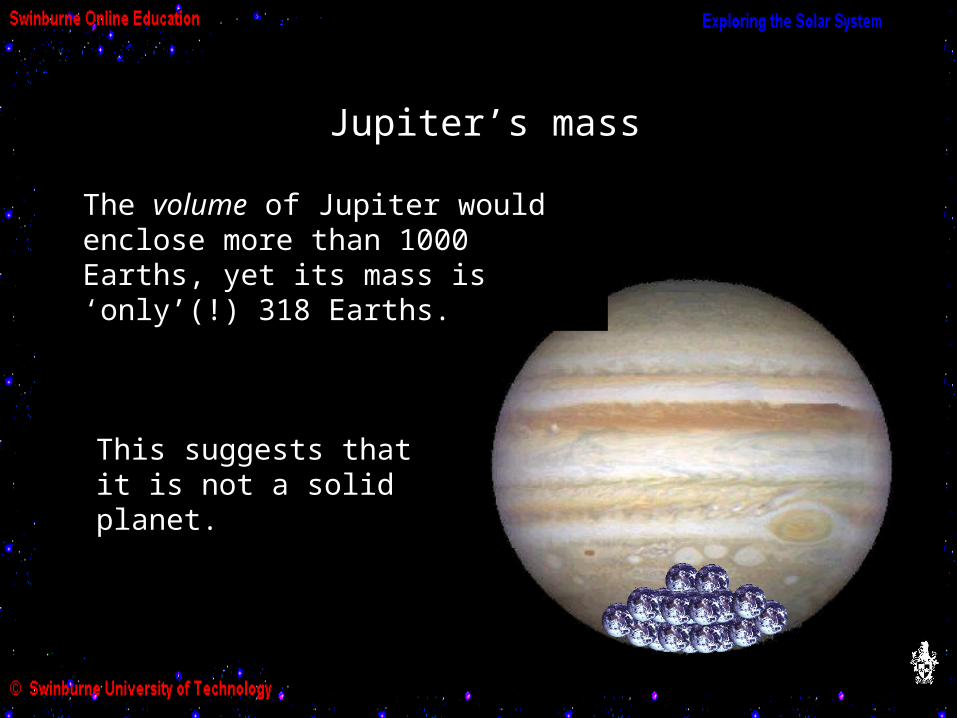
Jupiter’s mass
The volume of Jupiter would enclose more than 1000 Earths, yet its mass is ‘only’(!) 318 Earths.
This suggests that it is not a solid planet.

Jupiter’s Rotation
Its large equatorial bulge from the rapid rotation further suggests that Jupiter has a non-solid structure. (Along with the ‘low’ mass mentioned in the last frame.)
A non-rotating planet might be expected to be spherical
Jupiter rotates in just 9 hours 50 minutes at its equator
Yet to unfold: What other factors might contribute to the complex atmospheric patterns we observe on Jupiter?
at a tilt of 3° to its orbital plane

Jupiter’s Structure
Rocky Core
Liquid metallic Hydrogen
Liquid Hydrogen
1000 km thick atmosphere
Let’s dissect Jupiter to see what structure might explain the factors mentioned in the last two frames . . .
Overall, Jupiter appears to be around 71% hydrogen, 24% helium and about 5% heavier elements
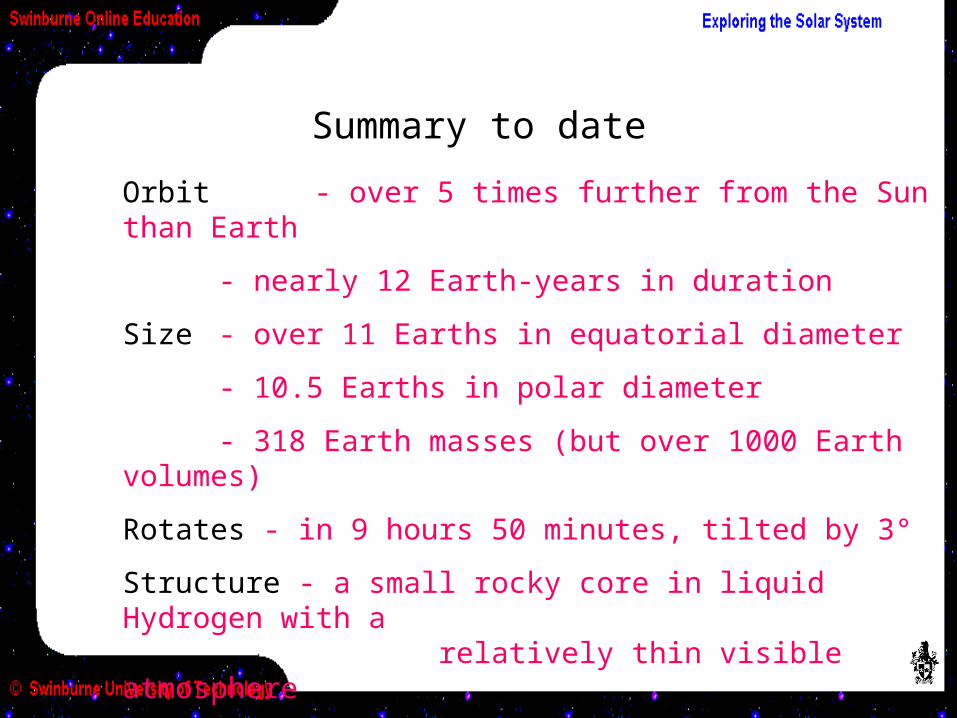
Summary to date
Orbit - over 5 times further from the Sun than Earth
- nearly 12 Earth-years in duration
Size - over 11 Earths in equatorial diameter
- 10.5 Earths in polar diameter
- 318 Earth masses (but over 1000 Earth volumes)
Rotates - in 9 hours 50 minutes, tilted by 3°
Structure - a small rocky core in liquid Hydrogen with a relatively thin visible atmosphere
Overall ~71% hydrogen, ~24% helium, ~5% heavier elements

Markings are called ...
andzones for the lighter bandsbelts for the darker bands
Hemispheres: The southern hemisphere (closest to your southern horizon as you view it) is characterised by the Great Red Spot
So the Great Red Spot is in the N/S? region? belt/zone?
Jupiter’s visible details
North
South and this is the?
plus light (mainly in S) and dark (N)ovals and eddies
north tropical zone
south equatorial belt
Equatorial
RegionPolar
Tropical Temperate s
(c) Properties

Jupiter’s Temperature
The temperature at Jupiter’s cloud tops is around -110°C
Jupiter emits nearly twice the amount of radiation it receives from sunlight. It thus has its own internal heat source. This could arise from:
- slow cooling since its original formation
- slow gravitational contraction
- frictional motion of deep internal material
(Unlike Earth) Jupiter has no great variation in temperature from polar to equatorial regions.

Motions in Jupiter’s atmosphere
Winds blowing at different strengths and in different directions cause the swirling eddies at the edges of belts and zones.
Higher west to east winds in Jupiter’s equatorial region makes this region appear to rotate faster (in
9 hours 50 minutes) than the interior and the rest of the planet (9 hours 55 minutes).
East

Zones are regions of falling gas, lower pressure
Convection currents, from the variation in temperature with depth, lead to zones and belts having different vertical motions.
The convection process is shown in animations in the next slide . . .
Belts are regions of rising gas, higher pressure
For 50 years, it has generally been thought that belts are regions of falling gas and zones are regions of rising gas. Recent Cassini data now suggests it is the other way around. For more details, see:http://saturn.jpl.nasa.gov/news/press-releases-03/20030306-pr-a.cfm

Convective currents
The belt and zone pattern is driven by convective currents due to the temperature gradient from Jupiter’s interior.
belts
zones
increasingtemperature

Composition of atmosphere
Spectroscopic fingerprinting of Jupiter’s upper atmosphere indicates three main layers of clouds:
Frozen ammonia crystals
Frozen water crystals
Ammonium hydrosulphide crystals

Normally the crystals in all three layers are white. Apparently temperature differences at different depths, (plus molecules including elements such as sulphur and phosphorus, which can assume many colours under different conditions of temperature and ultraviolet sunlight), produce the many colours seen in Jupiter’s atmosphere.
Colours at different depths are indicated above: brown - deepest, warmest; and red - highest, coolest.The turbulent circulation in Jupiter’s atmosphere reveals the colours at different depths - producing the zones,
belts, ovals and eddies.
Frozen ammonia crystals
Frozen water crystals
Ammonium hydrosulphide crystals

The most famous example of Jupiter’s markings is the Great Red Spot, which has persisted for over 300 years.
Earth to scale
It is an anti-cyclonic storm rotating between opposed winds in ~6 days.
Its cooler, higher altitude clouds appear redder than surrounding regions.
The Great Red Spot
With 600+ km/hr winds, a turbulent region indeed . . .

(d) Space Missions to JupiterMuch of our information about our own planet is from our first hand experience of it.
Our knowledge about Jupiter comes from:
- photographs - from Earth (ground and orbit) and from spacecraft
- spectroscopic information from reflected sunlight
- theory - e.g. size, mass and rotation leads to conclusion about internal structure
- two additional first hand sources of information:
the Galileo spacecraft probe into Jupiter’s atmosphere
the 1994 entry of Comet Shoemaker Levy 9 into Jupiter’s atmosphere

The Pioneer 10 & 11, Voyager 1 & 2, Galileo and Cassini spacecraft missions are summarised in the next frames . . .

The Pioneer space probes
Pioneer 10, launched May 1972, passed Jupiter at a distance of 130,000 km in December 1973. It photographed Jupiter and the Great Red Spot, satellites Europa, Ganymede and Callisto, and measured the extent of Jupiter’s radiation belts.
Pioneer 11, launched April 1973, passed 43,000 km below Jupiter’s south pole in December 1974, moving on to photograph the Saturnian system from September 1979.

Both crafts are heading out of the Solar System in opposite directions. Pioneer 10 was over 12 billion km from Earth in February 2004 (compared with Pluto’s mean distance from Sun of 5.85 billion km).

The Voyager spacecrafts
Voyager 1, launched September 1977, reached Jupiter in March 1979, closely photographing satellites Callisto, Ganymede, Europa and Io, before approaching 280,000 km from Jupiter. It went on to photograph Saturn (November 1980) before heading out of the Solar System.

Voyager 2, launched August 1977, reached Jupiter in July 1979, passing close to satellites Callisto, Ganymede and Europa before its 714,000 km approach to Jupiter. Most of the photos in this Unit are from Voyager 2. It went on to photograph Saturn (August 1981), Uranus (January 1986) and Neptune (August 1989), before heading out of the Solar System.

The Voyager flight paths
Note the use of gravity assists (most notably at Saturn) to deflect and assist craft on to the next target. Gravity assists are evident in the Galileo spacecraft flight path, 2 frames on . . .

Pioneer and Voyager ‘exit from Solar System’

The Galileo SpacecraftFeatures:
Launch inwards toward Venus
Close-up images of two asteroids
Gravity assists at Venus and Earth(2)
Asteroid Ida and its orbiting
1km sized companion
DactylArrived 1995

Images of Comet SL-9 impact out of sight from Earth (see later frame)
Descent of probe from Galileo(see next frame)

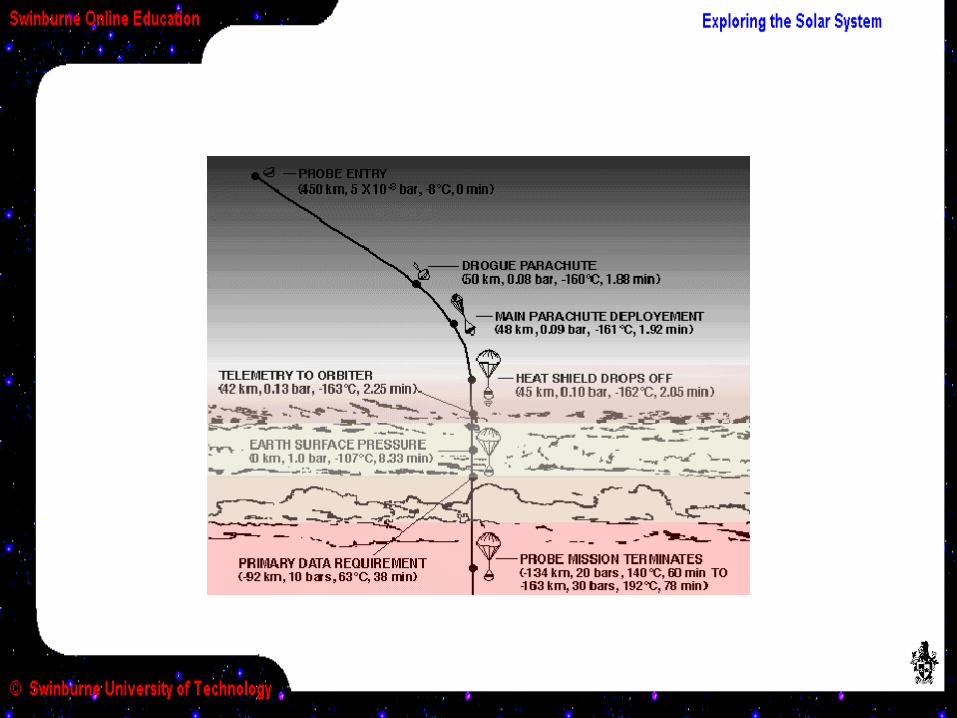
Probe descent from Galileo
A probe separated from the Galileo spacecraft and descended to its destruction through Jupiter’s atmosphere. In the next diagram, heights and pressures are given relative to a level where the pressure is the same as an Earth surface pressure of 1000 millibars (1 bar):
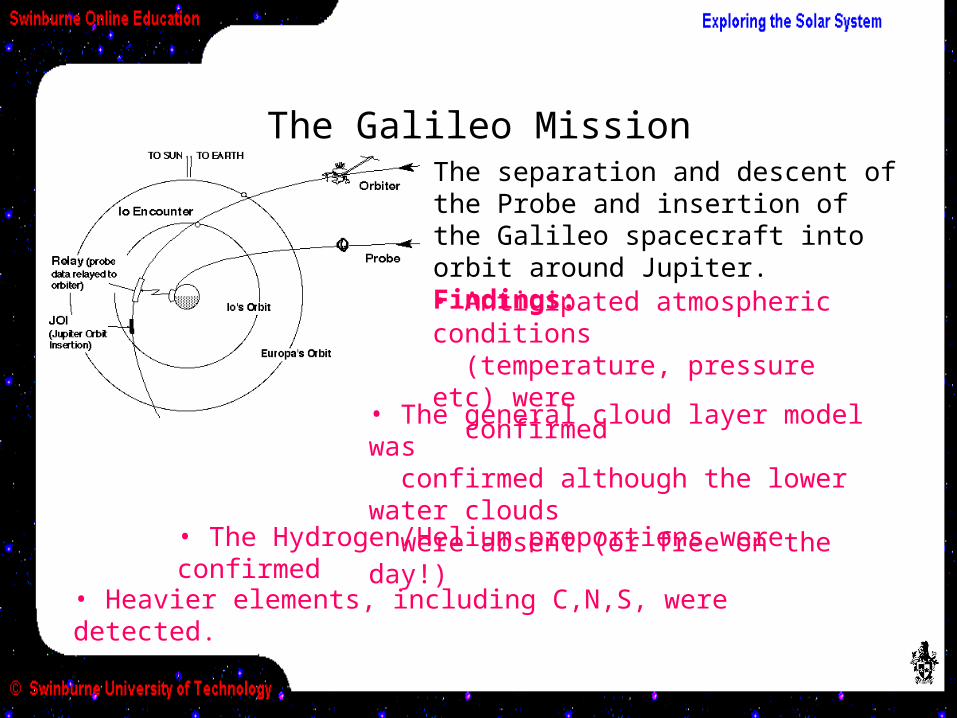
The separation and descent of the Probe and insertion of the Galileo spacecraft into orbit around Jupiter. Findings:
The Galileo Mission
• Anticipated atmospheric conditions (temperature, pressure etc) were confirmed
• The general cloud layer model was confirmed although the lower water clouds were absent (or free on the day!)
• The Hydrogen/Helium proportions were confirmed
• Heavier elements, including C,N,S, were detected.

This diagram shows Galileo’s 11 orbits amongst the satellites of Jupiter.
Many detailed photographs and information on the structure of natural satellites were obtained by Galileo (covered later in the Unit Satellites & Rings of the Jovian Planets)
The Galileo mission ended on 21 September 2003. Galileo’s propellant was almost depleted and the spacecraft was put in a collision course with Jupiter to avoid an impact with the satellite Europa (which is thought to be one of the best candidates for hosting life).

En route to Saturn, the Cassini orbiter did a Jupiter flyby in December 2000 as part of its “VVEJGA trajectory” (Venus-Venus-Earth-Jupiter Gravity Assist). Simultaneous observations were made with Galileo, Cassini and HST to return to highest ever resolution images of the Jupiter.
The Cassini Orbiter
True colour Cassini mosaic made from 27 images with a 60km resolution. Taken on 29 December 2000 during closest approach (at a distance of ~10 million km).

(e) Comet Shoemaker-Levy 9
Its orbit was calculated to be about Jupiter, not about the Sun. Jupiter had captured the comet on its entry to the inner Solar System and Jupiter’s tidal forces had broken the comet into a number of fragments.
Furthermore, calculations showed that on its next orbit it would impact with Jupiter in July 1994.
Carolyn and Eugene Shoemaker and David Levy discovered a comet in 1993 which appeared as a ‘string of pearls’.

A year after its discovery the Hubble Space Telescope showed the many fragments of Comet SL9, which were named ‘A’ to ‘W’
Months ahead of the impact, the mathematics leading to this artist’s portrayal of the impact site - just out of view from Earth - proved accurate to within minutes

This sequence (from bottom to top) show an impact followed by the changing appearance of its scattered material in Jupiter’s turbulent atmosphere (together with a previous impact site rotating into view)
Comet SL-9 Impact sites
[Hubble Space Telescope images from Earth-orbit]
As Jupiter rotated (left to right in each of the above images) impact sites progressively came into view a few minutes after the impact behind lower-left of Jupiter

Comet SL9 Impacts - other images
An infrared image from the MSSSO 2.3m telescope showing the actual K fragment fireball and the still-warm remains of three other sites
Hubble Space Telescope ultraviolet image showing the debris in the southern hemisphere (and Io in the north), labelled by fragment letters.
Though launched before SL-9’s discovery, the Galileo spacecraft was uniquely placed for a direct view of the impact site, as this sequence shows
A small sample from the hundreds of images obtained . . .
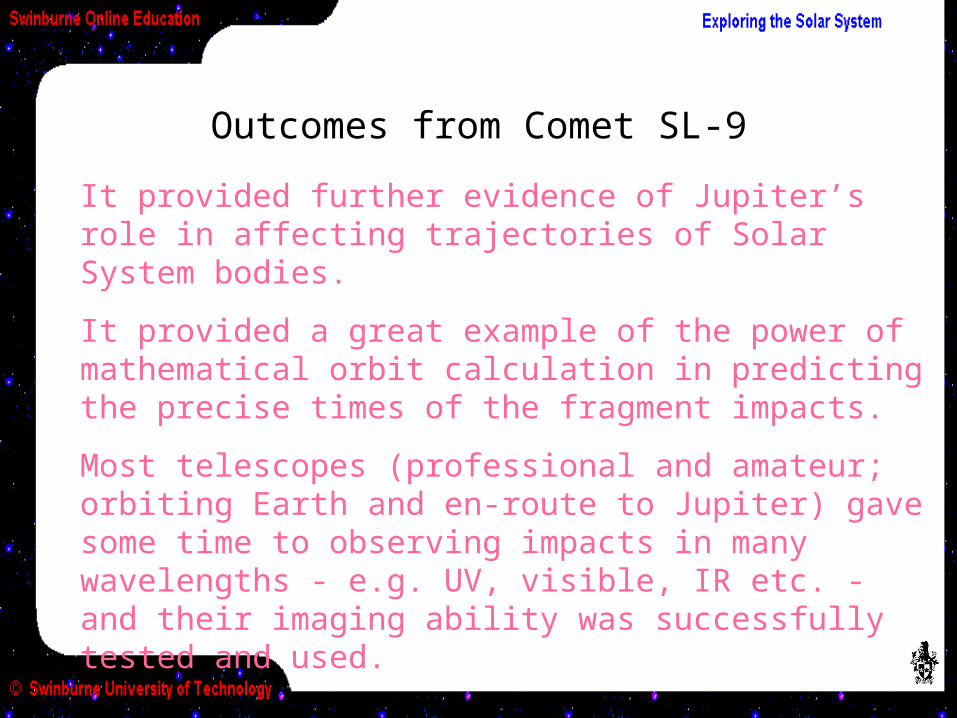
Outcomes from Comet SL-9
It provided further evidence of Jupiter’s role in affecting trajectories of Solar System bodies.
It provided a great example of the power of mathematical orbit calculation in predicting the precise times of the fragment impacts.
Most telescopes (professional and amateur; orbiting Earth and en-route to Jupiter) gave some time to observing impacts in many wavelengths - e.g. UV, visible, IR etc. - and their imaging ability was successfully tested and used.

Spectroscopic examination of the impact debris had the potential for information about the composition of Jupiter’s atmosphere - what produces its many colours, for example. Sulphur was detected but work continues to separate what might have been from Jupiter and what from the comet fragments!
SL-9’s direct impacts provided further information on the nature of Jupiter’s atmosphere - wind speeds and directions, density etc.

A final contemplation
Two Hollywood movies have (since SL-9) used the theme of a potential comet or asteroid impact with Earth.
Whether an Earth-approaching object could be destroyed or diverted is a question for discussion.
To at least maintain observations and information on potential Near Earth Objects would seem both wise and, like SL-9, good fields for scientific observation and research.
This image superimposes, to the same scale, one of the Comet SL-9 impact sites with our own planet.

In the next Activity we will look at the other Joviangas giant planets - Saturn, Uranus and Neptune.

NASA: http://www.nasa.gov
Indexed status of all NASA spacecrafthttp://www.hq.nasa.gov/office/oss/missions/index.htm
Hubble Space Telescope images indexed by subjecthttp://oposite.stsci.edu/pubinfo/subject.html
Cassini image of Jupiterhttp://photojournal.jpl.nasa.gov/catalog/PIA04866
Comet Shoemaker-Levy 9 Collision with Jupiterhttp://www.jpl.nasa.gov/sl9/sl9.html
View of Australiahttp://nssdc.gsfc.nasa.gov/image/planetary/earth/gal_australia.jpg
Image Credits

Now return to the Module 15 home page, and read more about Jupiter in the Textbook Readings.
Hit the Esc key (escape) to return to the Module 15 Home Page