Title Development of silica-based materials for ...
119
Title Development of silica-based materials for chromatographic separations in capillary liquid chromatography( 本文(Fulltext) ) Author(s) MAINA ESTHER WAMAITHA Report No.(Doctoral Degree) 博士(工学) 工博甲第575号 Issue Date 2020-03-25 Type 博士論文 Version ETD URL http://hdl.handle.net/20.500.12099/79342 ※この資料の著作権は、各資料の著者・学協会・出版社等に帰属します。
Transcript of Title Development of silica-based materials for ...

Title Development of silica-based materials for chromatographicseparations in capillary liquid chromatography( 本文(Fulltext) )
Author(s) MAINA ESTHER WAMAITHA
Report No.(DoctoralDegree) 博士(工学) 工博甲第575号
Issue Date 2020-03-25
Type 博士論文
Version ETD
URL http://hdl.handle.net/20.500.12099/79342
※この資料の著作権は、各資料の著者・学協会・出版社等に帰属します。

Development of silica-based materials for chromatographic
separations in capillary liquid chromatography
キャピラリー液体クロマトグラフィーにおけるクロマトグラフィ
ー分離のためのシリカ系材料の開発
MAINA ESTHER WAMAITHA
March, 2020

ii
Development of silica-based materials for chromatographic
separations in capillary liquid chromatography
キャピラリー液体クロマトグラフィーにおけるクロマトグラフィ
ー分離のためのシリカ系材料の開発
A dissertation submitted to Gifu University in partial fulfillment of
the requirements for the degree of Doctor of Philosophy in Material
Engineering
MAINA ESTHER WAMAITHA
Material Engineering Division
Graduate School of Engineering
Gifu University
JAPAN

Contents
i
Contents
Contents i
Preface vii
Chapter 1 1
Introduction 1
1.1Chromatography 1
1.1.1Paper chromatography (PC) 3
1.1.2 Thin-layer chromatography (TLC) 4
1.1.3 Ion-exchange chromatography (IEC) 4
1.1.4 Capillary liquid chromatography (CLC) 5
1.1.4.1Capillary liquid chromatography set-up 6
1.1.4.1.1Packed capillary columns 7
1.1.4.1.2 Monolithic capillary columns 8
1.1.5 Hydrophilic interaction liquid chromatography (HILIC) 10
1.1.6 Normal-phase liquid chromatography (NPLC) 10
1.1.7 Reversed-phase liquid chromatography (RPLC) 11
1.1.8 Size-exclusion chromatography (SEC) 11
1.2 Objectives of the present research 11
1.3 References 12
Chapter 2 15
Development of silica based chromium metal-organic framework materials
for chromatographic separations 15
2.1 Introduction 15
2.2 Experimental 17
2.2.1 Chemical reagents 17
2.2.2 Activation of silica gel 17
2.2.3 Preparation of chromium solution 17
2.2.4 Preparation of Si-Cr Composites 18
2.2.5 Synthesis of Si-Cr benzoylacetonate composites 18
2.2.6 Column packing and testing 19
2.2.7 Sample characterization 19
2.2.7.1 Elemental and scanning electron microscope (SEM) analyses 19
2.2.7.2 FT-IR characterization 19
2.2.7.3 BET adsorption isotherms 19
2.3 Results and discussions 20
2.3.1 Sample characterization 20
2.3.1.1 Si and Si-Cr elemental analysis 20
2.3.1.2 Si and Si-Cr-BA elemental analysis 21
2.3.1.3 Scanning electron microscope for both Si and Si-Cr samples 21

Contents
ii
2.3.1.4 The FT-IR spectra for both Si and Si-Cr samples 22
2.3.1.5 The FT-IR spectra for both Si and Si-Cr-BA samples 23
2.3.1.6 BET adsorption isotherms for both Si and Si-Cr samples 25
2.3.2 Chromatographic evaluation 26
2.3.2.1 Separation of mixed aromatic compounds 26
2.3.2.2 Separation of alkyl benzenes 27
2.3.2.3 Separation of parabens 28
2.4 Conclusions 31
2.5 References 32
Chapter 3 34
Development of a novel stationary phase for ion exchange liquid
chromatography via click reaction 34
3.1 Introduction 34
3.2 Experimental 37
3.2.1 Apparatus 37
3.2.2 Reagents and chemicals 37
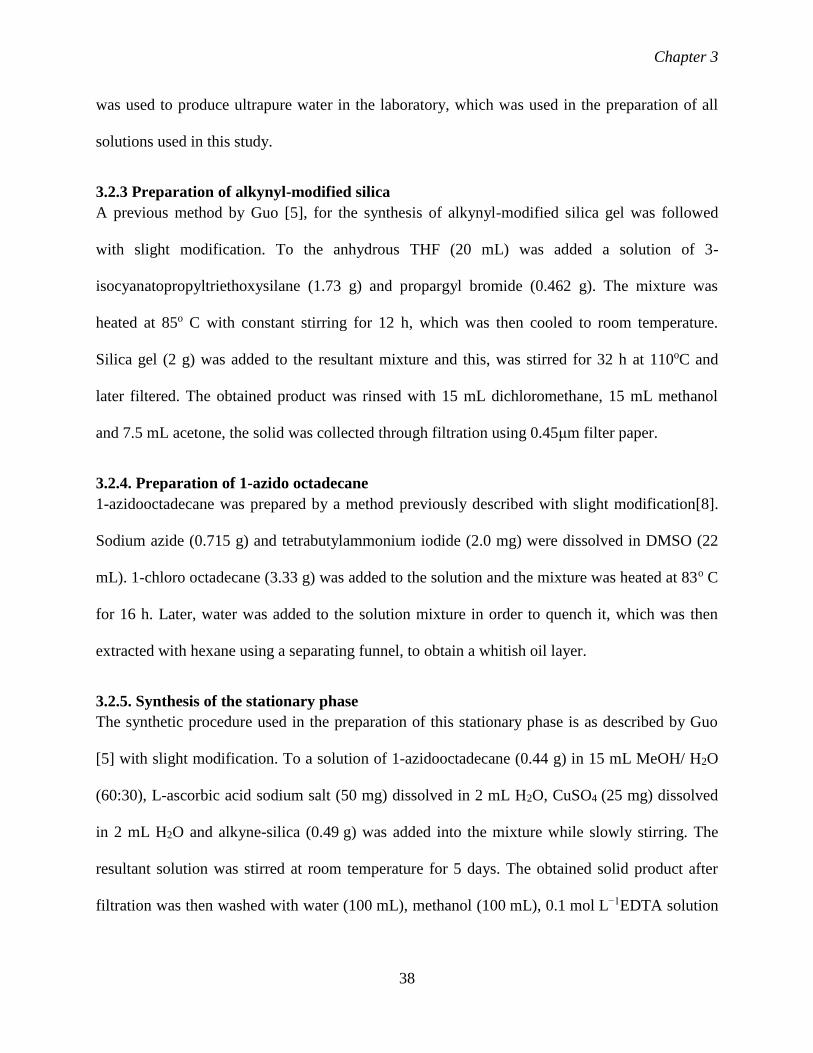
3.2.3 Preparation of alkynyl-modified silica 38
3.2.4. Preparation of 1-azido octadecane 38
3.2.5. Synthesis of the stationary phase 38
3.3. Results and discussions 39
3.3.1 FT-IR characterization 39
3.3.2 Inorganic anion’s retention behavior 41
3.3.3 The effect of eluent concentration 42
3.3.4 Repeatability tests 42
3.3.5 Column application 43
3.3.5.1 Gifu University laboratory tap water 43
3.3.5.2 Saliva sample analysis 44
3.4 Conclusions 45
3.5 References 45
Chapter 4 47
A novel covalently bonded 4-amino butyric acid silica stationary phase for
capillary ion chromatography 47
4.1 Introduction 47
4.2 Experimental 49
4.2.1 Apparatus 49
4.2.2 Reagents 50
4.2.3 Preparation of the stationary phase 50
4.3 Results and discussions 53
4.3.1 Inorganic anion’s retention behavior 53

Contents
iii
4.3.2. The effect of eluent concentration 54
4.3.3 Repeatability studies 54
4.3.4 Effect of eluent cation 57
4.3.5 Effect of pH 58
4.3.6 Column application 59
4.4 Conclusions 61
4.5 References 61
Chapter 5 64
A novel covalently bonded 7-amino heptanoic acid silica stationary phase for
capillary ion chromatography 64
5.1 Introduction 64
5.2 Experimental 66
5.2.1 Reagents 66
5.2.2 Apparatus 67
5.2.3 Preparation of stationary phases 67
5.3 Results and discussions 70
5.3.1 Retention behavior 70
5.3.2 The effect of eluent concentration 71
5.3.3 Repeatability tests 72
5.3.4 Effect of the flow rate 78
5.3.5 Effect of pH 79
5.3.6 Real sample application 80
5.3.6.1 Saliva sample analysis 80
5.3.6.2 Tap water sample assessment 80
5.3.6.3 Sea water sample assessment 81
5.4 Conclusions 82
5.5References 83
Chapter 6 85
Threonine-bonded silica stationary phase for capillary ion chromatography 85
6.1 Introduction 85
6.2 Experimental 86
6.2.1 Apparatus 86
6.2.2 Reagents 86
6.2.3 Preparation of stationary phases 87
6.3 Results and discussions 88
6.3.1 Inorganic anions retention behavior 88
6.3.2 The effect of eluent concentration 88
6.3.3 Repeatability tests 89
6.4 Conclusions 91

Contents
iv
6.5 References 91
Chapter 7 93
Conclusions and future perspectives 93
7.1 Conclusions 93
7.2 Future perspective 96
7.3 References 97
List of figures 98
List of tables 104
List of presentations 106
Curriculum vitae 108
Acknowledgments 109

Preface
vii
Preface
The modern society today is specifically interested in the art technologies in search of solutions
to the wide range of issues including industrial waste water management, food quality control,
screening of criminal investigations and environmental pollutants. Chromatography has been
one of the most extensively used analytical techniques for the analysis of these problems and
has been seen to offer satisfactory results.
Since its discovery in 1903 by a Russian scientist Mikhail Semonovich Tswett, as he
effectively separated green, orange and yellow plant pigments by use of filter paper extraction
through calcium carbonate packed open glass column, fellow scientists have greatly developed it
into liquid chromatography (LC), high performance liquid chromatography (HPLC) and gas
chromatography (GC). This was due to the need for better samples separation with reduced
time and solvent consumption.
HPLC became the preferred method of choice because it can withstand higher pressure,
has higher sample detection capabilities, not limited to volatile or non-volatile samples and also
has the possibility of achieving higher resolution during sample analysis. In the late 1980s, in
order to further improve the reproducibility of the HPLC system, the packing materials were
downsized (< 10 μm) with the packing being done at high pressure using slurry techniques.
These packing columns were further improved to monolithic columns that are sponge-
like structures, which supposedly offered shorter diffusion distances and several solute
dispersion paths. The backpressures experienced in the packing columns were overcome on
monolithic columns usage. However, silica packed columns still dominates in the market due
to their good chromatographic performance, ease of modification, mechanical strength and
availability.

Preface
viii
Capillary columns were used for the present study in order to achieve satisfactory results
with reduced analysis time, sample concentration and eluent consumption. The synthesized silica
based stationary phases were packed into capillary columns and were used to investigate the
retention mechanisms of the prepared samples under different eluent conditions.

Chapter 1
1
Chapter 1
Introduction
1.1 Chromatography
Chromatography has been observed to function as a bridge between science and discovery for
centuries. It was originally used in the study of colored plant materials, thus its name;
‘‘chromatographic analysis’’ and has since been developed for compounds’ separation [1].
Chromatography was clearly implemented by Mikhail Semenovich Tswett, a Russian chemist-
botanist, who for the very first time described the separation of plants’ pigments. When he
trapped calcium carbonate into a narrow glass tube and passed petroleum ether solution through
the adsorbent, the pigments resolved in accordance to adsorption sequence. Later, when all the
pigment solution had flowed through the glass tube, followed by a stream of pure solvent, the
separation was observed to be complete [2].
Chromatography, by definition is a method of identification and separation of closely
related complex compounds which are in a mixture. The basic principle involves passage of a
solution containing both the analyte and the mobile phase (eluent) on the stationary phase (SP)
such as immobilized silica on glass plates, paper or gels. The compounds with stronger affinity
for the SP are adsorbed while compounds with lesser affinity flow out of the column resulting to
separation. Over the past one hundred years, chromatographic techniques has been developed for
better samples separations.
Cost effective analytical techniques is one of the key, and with thus, they are in high
demand in many laboratories belonging in different research areas. In the field of any
chromatographic separation, the prepared column is the heart of the entire chromatographic set-
up, as it enables a better sample selectivity and resolution during samples separation.

Chapter 1
2
Moreover, separation of these compounds with matrices of both low and high molecular
weight and also compounds with different polarities can be very difficult. To solve this analytical
problem, methods with reduced sample analysis, robustness, high sensitivity and resolution have
been invented. For instance, high performance liquid chromatography (HPLC), ultra-high
performance liquid chromatography (UHPLC), normal phase liquid chromatography (NPLC),
hydrophilic interaction liquid chromatography (HILIC), monolithic and packed columns have
been reviewed as potential candidates [3].
As the name indicates, HPLC is a separation technique that uses pressurized pumps to
pass the eluent together with the sample mixture through the stationary phase material packed
in a column. In the column, the sample component differently interacts with the absorbent
material, which results in their differing elution strength and consequently their separation. Their
differences in intermolecular interactions and affinity between each of these analytes with the
stationary phase relative to the mobile phase determines the analyte’s retention time.
Isocratic elution and gradient elution modes exist as the two main HPLC elution modes
during the sample analysis. In case of isocratic elution, constant mobile phase strength is used
throughout the analysis where as for the gradient elution, the percentage of the organic
solvent being used as the mobile phase is gradually increased. When analyzing complex samples
containing polar analytes, gradient elution is the preferred mode of elution [4]. Thus, separation
of sample mixtures containing different compounds follows a differential migration flow
through a packed column.
Chromatography can be categorized based on the type i.e. the physical conditions of the
stationary phases and the type of interaction involved. The common and popular ones are based
on solid stationary phases, namely, paper chromatography, thin-layer chromatography (TLC),

Chapter 1
3
ion-exchange chromatography (IEC), liquid chromatography (LC), high-performance liquid
chromatography (HPLC), hydrophilic interaction liquid chromatography (HILIC), normal-
phase liquid chromatography (NPLC) and reversed-phase liquid chromatography (RPLC) as
shown in Table 1-1 below.
Table 1-11.1. Classification of chromatography
Type of chromatography Abbreviation Stationary
phase
Mobile
phase
Type of
interaction
Paper chromatography PC Solid Liquid Partition
Thin-layer chromatography TLC Solid Liquid Adsorption
Ion-exchange chromatography IEC Solid Liquid Adsorption
Capillary liquid chromatography CLC Solid Liquid Adsorption
High-performance liquid
chromatography
HPLC Solid Liquid Adsorption
Ultra-high performance liquid
chromatography
UPLC Solid Liquid Adsorption
Hydrophilic interaction liquid
chromatography
HILIC Solid Liquid Adsorption
Normal-phase liquid
chromatography
NPLC Solid Liquid Adsorption
Reversed-phase liquid
chromatography
RPLC Solid Liquid Adsorption
1.1.1 Paper chromatography (PC)
Paper chromatography (PC) is a simple separation technique used to separate and identify
compounds in a mixture. A paper is used as the stationary phase while a liquid solvent is used as
the mobile phase. During sample separation, a sample mixture is spotted on one edge of this
paper, which is then carefully immersed into the mobile phase tank. The mobile phase moves up
Chapter 1
4
the paper through capillary action along with the component mixtures with varying distances
depending on their affinity to both the stationary phase and the mobile phase [5].
1.1.2 Thin-layer chromatography (TLC)
TLC is a laboratory technique commonly used to assess organic compounds purity and also
monitor the reaction progress. It has similar characteristics to paper chromatography but has
relatively faster chromatography runs and better separations. Its stationary phase involves a polar
adsorbent material like silica gel thinly coated onto a sheet of plastic or glass to form a TLC plate.
A developing chamber which is half filled with the mobile phase is used as mobile phase’s
reservoir, and this plate is then carefully placed horizontally. In accordance to the targeted
compounds to be separated, the mobile phase is chosen. During separations, spotting of a small
amount of sample mixture is done near the bottom of this TLC plate, and due to the different
affinity with the mobile phase and the stationary phase, separation is achieved. Through capillary
action, the mobile phase rises slowly up the plate carrying along the sample in accordance to
their affinity with the stationary phase [6].
1.1.3 Ion-exchange chromatography (IEC)
Ion-exchange chromatography is a separation technique in which ionizable samples are separated
due to its stationary phase being specifically designed with charged or chargeable moieties. This
stationary phase consists of exchangeable counterions such as single-charged monatomic ions
(Na+ , K+ , Cl−),double-charged monoatomic ions (Ca2+, Mg2+), polyatomic inorganic ions (SO42−,
PO43−) and acids (COO−). Quaternary alkyl ammonium salts together with sulphonic groups are
used to prepare strong ion-exchangers, while the other charged groups are used as weak ion-
exchangers [7-8].
Depending upon the interaction affinities of the analyte molecules with the charged
stationary phases, these analytes are reversibly adsorbed where separation occurs with the mobile

Chapter 1
5
phase passage through the stationary phase. Therefore, it can effectively be applied for the
purification of peptides, amino acids, protein, and nucleic acids molecules. Due to its ease of
modification and a large capacity to hold sample, it is thus becoming a versatile tool which is
being widely used in LC.
1.1.4 Capillary liquid chromatography (CLC)
Analysis of a chemical sample mixture has complexity resulting from the mixture interaction
amongst the number of components present, which greatly reduce the chances of successfully
measuring analytes of interest. The most commonly employed analytical technique is HPLC. In
HPLC, separation of these compounds is accomplished using a column prior moving to the
detector.
Stainless steel packed column with an internal diameter range of0.5 to 1.0 mm was
developed by Horvath and his co-workers in the late 1960s [9, 10]. In 1970s, a micro column
liquid chromatography (µLC) was started at Nagoya University, Nagoya, Japan by Dr. Ishii’s
group.
From then on, µLC systems with injection valves having low dead volume, low flow
rates pumping system and detection volumes have been commercialized by number of
manufactures [11]. Based on separation methods, the history of capillary and their related
techniques was developed in accordance to the Table 1-2 below. A capillary LC consists of a
whole set-up that works hand in hand to bring about satisfactory results.
Chapter 1
6
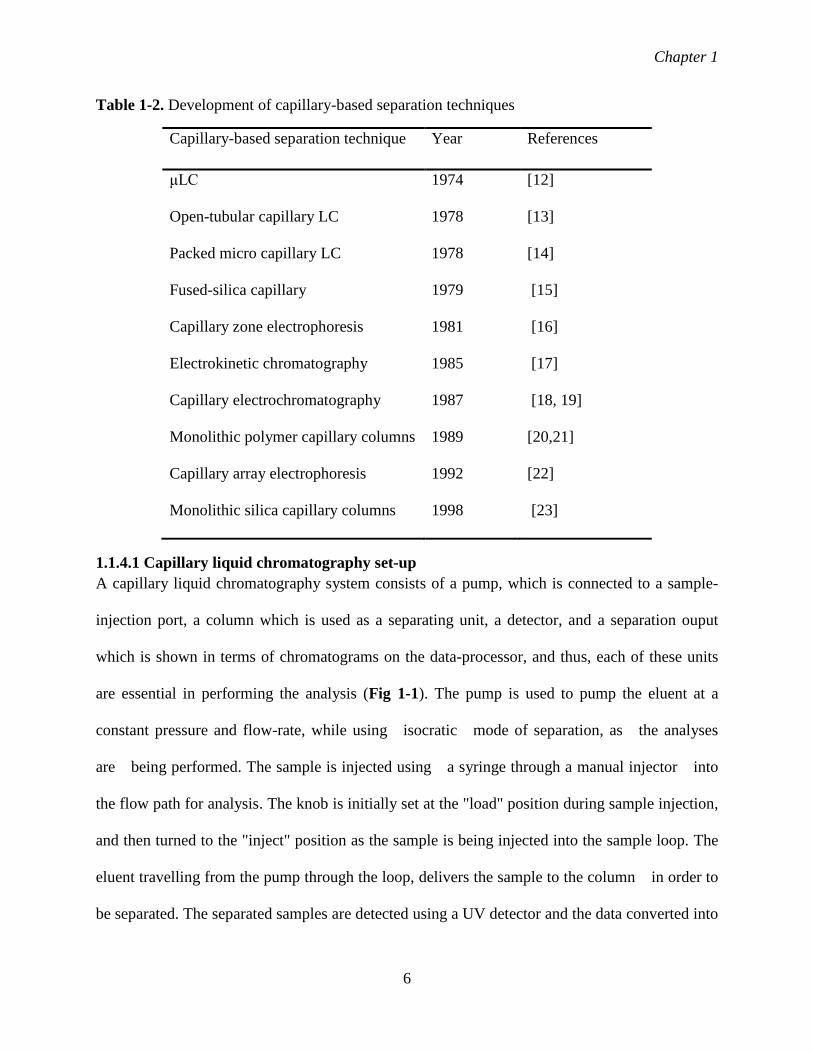
Table 1-2. Development of capillary-based separation techniques
Capillary-based separation technique Year References
μLC 1974 [12]
Open-tubular capillary LC 1978 [13]
Packed micro capillary LC 1978 [14]
Fused-silica capillary 1979 [15]
Capillary zone electrophoresis 1981 [16]
Electrokinetic chromatography 1985 [17]
Capillary electrochromatography 1987 [18, 19]
Monolithic polymer capillary columns 1989 [20,21]
Capillary array electrophoresis 1992 [22]
Monolithic silica capillary columns 1998 [23]
1.1.4.1 Capillary liquid chromatography set-up
A capillary liquid chromatography system consists of a pump, which is connected to a sample-
injection port, a column which is used as a separating unit, a detector, and a separation ouput
which is shown in terms of chromatograms on the data-processor, and thus, each of these units
are essential in performing the analysis (Fig 1-1). The pump is used to pump the eluent at a
constant pressure and flow-rate, while using isocratic mode of separation, as the analyses
are being performed. The sample is injected using a syringe through a manual injector into
the flow path for analysis. The knob is initially set at the "load" position during sample injection,
and then turned to the "inject" position as the sample is being injected into the sample loop. The
eluent travelling from the pump through the loop, delivers the sample to the column in order to
be separated. The separated samples are detected using a UV detector and the data converted into

Chapter 1
7
electrical signal which is then showcased on the screen. A novel column is the heart of the entire
system [24]. Capillary columns are classified into packed and monolithic columns.
Fig. 1-1. The capillary liquid chromatography set-up [25]
1.1.4.1.1Packed capillary columns
Packed columns are made up of fine particles fully packed in a column which is used as the
column bed for the chromatographic separations. These columns comprises of a capillary column,
packing materials and end plugs. A low mobile phase flow rate is used during separation due to
the increased pressure inside the columns. These LC packing materials are categorized into two
types; polymer and silica-based materials.
Polymer-based materials are more advantageous in comparison to silica-based materials,
in that, they are chemically stable, thus can be operated under wide range of pH. However, silica-
based packing materials still dominates in the market due to its availability, excellent physical
properties, ease on modification, high separation efficiency and rigidity than the polymeric
materials. The preparation of these materials is usually done through slight modification of the
already existing conventional LC materials.

Chapter 1
8
When packing these materials into the column, gases or liquids are used as medium of
transferring them from the external reservoir to column tubing, in order to form a homogeneous
and stable bed. A frit comprised of a glass wool is mounted at one of the capillary tube’s end,
and the packing particles are then pushed into the tube through the other end [26].
1.1.4.1.2Monolithic capillary columns
Monolithic columns are prepared through polymerization reactions of both the organic and
inorganic materials. This results to formation of a continuous skeleton as the stationary phase
and has superior porosity. The porosity of a monolithic column results to high permeability of
the mobile phase during chromatographic separations and hence rapid analysis and enhanced
selectivity. Monolithic columns are classified into three groups, i.e. organic monolithic columns,
inorganic monolithic columns and hybrid monolithic columns.
1.1.4.1.2.1Organic monolithic columns
Organic monolithic columns are normally prepared through one pot reaction in which all the
reagents; i.e. monomer, crosslinking agent, porogen and initiator are put in a capillary column or
glass tube for polymerization reaction to occur. Initiation of polymerization reaction can be
triggered by use of heat or UV irradiation. Optimization of polymer composition or reaction
conditions can result to enhanced monolith porosity. The prepared stationary phase can thus be
used for chromatographic separations [27-29].
1.1.4.1.2.2Inorganic monolithic columns
These monolithic columns are prepared through polymerization reactions like one-pot reaction or
sol gel process. One-pot polymerization reaction involves addition of all the reactant materials in
one pot/vial while sol gel polymerization involves two main processes; hydrolysis and
condensation reactions. For instance, tetramethoxysilane (TMOS) and tetraethoxysilane
(TEOS) being amongst the main reagents used, are first transformed into Si-O-Si from Si(OR)4,

Chapter 1
9
becoming silicon polymers and oligomers. A continuous skeleton made of silicone backbone
having large pores is formed. The prepared monolith is highly advantageous as it highly
permeable, has good mechanical stability and good thermal stability [30].
Other than silica, the oxides of alumina, zirconia, titania, hafnia, carbon, gold, silver,
ceria, germinia, iron and hydroxyapatite inorganic monoliths have also been successfully
prepared and used in chromatographic separations. The use of these inorganic monoliths together
with their modified composites is still in its early stages and with thus, this field is inevitable,
and a great deal of development is being made [31].
Both the organic and inorganic monolithic columns have some disadvantages like poor
mechanical stability, sample retention reproducibility and repeatability, and also short column
lifetime. This is so because certain reaction steps like cladding of the rods and drying is very
difficult to achieve in an academic laboratory. In that case, combining the merits of both the
organic and inorganic monolithic columns was realized as a way to enhance column’s efficiency.
1.1.4.1.2.3Hybrid monolithic columns
Hybrid monolithic columns are commonly synthesized through a sol gel process, and due to the
incorporation of an organic moiety onto an inorganic surface, they have an enhanced separation
capabilities, therefore creating a great deal of attention. Their advantages include; enhanced
solvent resistance and good mechanical stability. For instance, Yan and his co-workers were able
to effectively prepare a hybrid monolithic column consisting of both n-octyltriethoxysilane C8-
TEOS) and tetraethoxysilane (TEOS) in order to form octyl-hybrid monolithic column. The
prepared monolith had about 180,000 plates, column efficiency during the separation of phenols
and aromatic hydrocarbons (PAHs) [32].

Chapter 1
10
1.1.5 Hydrophilic interaction liquid chromatography (HILIC)
Hydrophilic interaction liquid chromatography (HILIC) has been evolving for the past few years
as an efficient chromatographic technique used for separating of both polar and neutral
analytes which are retained poorly in a reversed phase stationary phase. Polar stationary phases
i.e. un-bonded silica is used as the adsorbent material while applying eluents similarly used
during reversed phase separations. During separation, the hydrophobic eluent with water having
relatively higher eluting strength is used to elute the analytes [33]. The complexity of HILIC
stationary phase provides multiple interaction modes between stationary phase, eluent, analytes
and stagnant water layers trapped within the stationary phase as observed by Gregor and his
coworkers [34].
According to Hanai [35], the mechanism of HILIC is a combination of hydrophilic,
hydrophobic, shape selectivity, hydrogen bonding and dipole-dipole interactions. However, some
of these interactions are dependent on each other resulting to having some overlapping properties.
For instance, electrostatic force and hydrogen bonding contributes to hydrophilic interactions
while electrostatic force contributes to ion exchange interactions. Localized electrons contribute
to both the π-π and dipole-dipole interactions. Thus, HILIC can be used as both normal and
reversed-phase liquid chromatography.
1.1.6 Normal-phase liquid chromatography (NPLC)
In normal-phase liquid chromatography (NPLC), separation of compounds is done through
adsorption on a polar stationary phase i.e. silica gel while using organic solvents as eluents. The
selection of eluent determines the retention of analytes. NPLC have similar mechanism of
interactions to HILIC. HILIC explains the retention mechanism of samples while NPLC explains
the balance in polarity of the stationary phase and the eluent. Thus both terms can be used to
describe the same liquid chromatography [35].

Chapter 1
11
1.1.7 Reversed-phase liquid chromatography (RPLC)
RPLC is a powerful tool for chromatographic separations of moderately polar compounds, non-
polar compounds, and amino acids. It is characterized by a non-polar stationary phase and a
more polar mobile phase. Chronically in accordance to the chromatographic modes of separation,
it was the second mode of separation after normal phase. Normal phase uses a polar stationary
phase and a non-polar mobile phase hence ‘straight’, while the opposite was reversed-phase
chromatography. These phases commonly consist of silica as the base material, which is
chemically bonded to a hydrophobic surface amongst many other phases [36].
1.1.8 Size-exclusion chromatography (SEC)
In this type of a system, the column is filled with controlled pores size and the analyte is
separated according to its molecular size. The smaller molecules are retained inside the pores of
the packing materials while the larger molecules are washed out causing separation.
1.2 Objectives of the present research
Capillary liquid chromatography is a simple and powerful analytical technique used for
compound’s separation and identification which has greatly contributed to science and discovery.
The present study presents capillary liquid chromatography columns that were used at low
solvent consumption with high column efficiency and good sensitivity.
Chapter 2 describes the use of chromium alkoxide precursors as a modifier onto silica
surface. Chromium is a very stable transitional element which exists as a hexavalent ion in
solution forming complexes with other compounds. With thus, a need rose for incorporation of
ligands, in order to effectively capture and close the chromium sites which could be interacting
with the analytes that were being separated. Synthesis of metal organic framework silica (MOF-
Si) was successful, however, the immobilization reaction was found to be a physical process.

Chapter 1
12
Chapter 3 describes the preparation of a novel silica based stationary phase through click
chemistry and the stationary phase formed was used for inorganic anions’ separation.
Chapter 4 describes the retention of anions on a chemically bonded 4-amino butyric acid on the
surface of silica gel. A simple 2-step reaction was followed in order to effectively synthesize the
material. Selection of a suitable eluent resulted to the retention and separation of anions and thus,
it worked as the anion-exchange stationary phase.
Chapter 5describes the retention of anions on a silica gel immobilized with 7-amino heptanoic
acid. Selection of a suitable mobile phase resulted to the separation of targeted anions, and the
prepared column also worked as the anion-exchange stationary phase.
1.3References
[1] K. R. Williams, J. Chem. Ed., 79, (2002,) 922-923.
[2] G. M. Gaucher, J. Chem. Ed., 46, (1969),729-733.
[3] L. Nováková, H. Vlčková, Anal. Chim. Acta.,656, (2009), 8–35.
[4] M. R. Fletcher,‘‘The Effect of Flow Rate on High Performance Liquid Chromatography
Column Re-equilibration after Gradient Elution’’, Master Thesis, Drexel University,
Philadelphia, Pennsylvania, U.S.A, 2016.
[5] A. A. Bele, A. Khale, IJPSR, 2, (2011), 256-267.
[6] Mandeep, IJCS, 6(2018), 276-279.
[7] S. Kumar, K. Jyotirmayee, M. SarangiInt, J. Pharm. Sci. Rev. Res., 1 (2013),18-24.
[8] H. U. Khan, the Role of Ion Exchange Chromatography in Purification and Characterization
of Molecules Chapter 14, Open access peer-reviewed 2012.
[9] C. Horváth, B. A. Preis, S. R. Lipsky, Anal. Chem.,39, (1967),1422-1428.
[10] C. Horváth, S. R. Lipsky, Anal. Chem.,41,(1969), 1227-1234.
[11] T. Takeuchi, Chromatogr., 26, (2005), 7-10.

Chapter 1
13
[12] D. Ishii, Jasco Report, 11,(1974),1-7.
[13] K. Hibi, D. Ishii, I. Fujishima, T. Takeuchi, T. Nakanishi, J. High Resolut. Chromatogr.
Chromatogr. Commun., 1(1978), 21-27.
[14] T. Tsuda, M. V. Novotny, Anal. Chem.,50(1978), 632-634.
[15] R. D. Dandeneau, E. H. Zerenner, J. High Resolut. Chromatogr. Chromatogr.
Commun.,2(1979), 351-356.
[16] J. W. Jorgenson, K. D. Lukacs, Anal. Chem.,3,(1981), 1298-1302.
[17] S. Terabe, K. Otsuka, T. Ando, Anal. Chem.,57,(1985), 834-841.
[18] T. Tsuda, Anal. Chem.,59,(1987), 521-523.
[19] J. H. Knox, I. H. Grant, Chromatographia,24,(1987), 135-143.
[20] S. Hjerten,J.-L. Liao, R. Zhang, J. Chromatogr.,473,(1989), 273-275.
[21] T. B. Tennikova, B. G. Belenkii, F. Svec, J. Liq. Chromatogr.,13,(1990), 63-70.
[22] A. R. Mathies, C. X. Huang, Nature,359,(1992), 167-169.
[23] N. Ishizuka, H. Minakuchi, K. Nakanishi, N. Soga, N. Tanaka, J. High Resolut.
Chromatogr.,21,(1998), 477-479.
[24] D. Guillarme, S. Heinisch, Sep Purif Rev, 34,(2005), 181-216.
[25] A. Kurnia, L. W. Lim, and T. Takeuchi, Makara J. Sci.,20/4 (2016), 173-180.
[26] F. M. Lancas, J. C. Rodrigues, S. Freitas, J. Sep. Sci.,27, (2004), 1475 -1482.
[27] F. Svec, J. Sep. Sci.,27, (2004), 747-766.
[28] P. Hemstrom, K. Irgum, J. Sep. Sci.,29, (2006), 1784-1821.
[29] G. Guiochon, J. Chromatogr. A, 1168, (2007), 101-168.
[30] B. Yu, H. Zhang, H. Cong, G. Chen, T. Xu, Y. Liu, Rev. Adv. Mater. Sci.,48, (2017), 58-
67.

Chapter 1
14
[31] Z.Walsh, B. Paull, M. Macka, Anal. Chim. Acta,750,(2012,)28-47.
[32] L. J. Yan, Q. H. Zhang, Y. Q. Feng, J. Chromatogr., A,1121 (2006) 92–98
[33] R.D. Arrua, M. Talebi, T.J. Causon, Anal. Chim. Acta.,738 (2012) 1
[34] H. P. Gregor, F. C. Collins, M. Pope, J. Colloid Sci.,6 (1951) 304 – 322
[35] T. Hanai, Mass Spectrom Purif Tech., 4, (2018), 1-6.
[36] S. Boonchiangma, P. Ratchakrut, S. Chanthai, S. Srijaranai, Chromatographia, 10, (2015),
1-5.
Chapter 2
15
Chapter 2
Development of silica based chromium metal-organic framework
materials for chromatographic separations
2.1 Introduction
Heavy metal is a term used to describe metals with approximately 4.0 or higher specific gravity
and is commonly distributed in rocks and soil. For industrial production of machineries,
thermometers, batteries and blood pressure gauges, these metals are extracted from the earth’s
surface. Chromium is amongst the heavy metals which are used in various fields like in cement
steel industries. However, these metals ions are heavily discharged into river streams posing a
serious environmental and health concerns [1].
On the other hand, silica is widely used for liquid chromatographic separation due to its
availability, excellent physical properties and ease on modification. However, silica based
stationary phases have limited usable pH which results to residual silanols groups that causes
peak tailing during chromatographic separations. Measures in order to extend its stability have
been taken. For instance, Silva and his colleagues [2] were able to successfully incorporate
titanium protective layer onto silica surface, which was able to improve the stability of silica
surface on high pH eluent’s applications. According to Hoth [3], oxides of zirconium, aluminum,
titanium, iron and copper have been extensively used for chromatographic separations as they
offer more pronounced chemical and thermal stability than silica and organic polymers. However,
oxides of chromium have not been greatly researched on, which could also offer selective
adsorbents for chromatographic separations [4, 5].
The surface of silica gel contains silanol groups which react with metal oxides to produce
oxide surfaces which are associated with high thermal and chemical stability. Moreover,

Chapter 2
16
modification of silica with organic functional groups could enhance the sorption capabilities of
silica gel for chromium ions as they act as linkers.
Sorption process could either be physical sorption or chemical sorption. Physical sorption
is where the organic linker is physically adsorbed whereas in chemical sorption processes, the
organic linkers are chemically adsorbed onto the silica surface [6, 7]. According to Chmielarz’s
group [8], acetylacetone ligands can be used to deposit the metal’s active site on mesoporous
silica. This is so because they are highly reactive towards the silanols through two different
mechanism (i) hydrogen bonding mechanism: π-electrons of the acetylacetone ligand with the
proton on the surface of the silanol groups by hydrogen-bonding and (ii) ligand exchange
mechanism: where the acetylacetone ligand interacts with surface silanol groups resulting to the
formation of covalent bond between the metal and surface oxygen which results in loss of a
ligand. These methods have been shown to guarantee high and uniform dispersion of the active
components in comparison to other methods like impregnation.
Coordination of these hybrids, i.e. organic linkers and transitional metals, is used in
the formation of metal organic frameworks (MOF). These structures are having applications in
different fields like separation, magnetism, gas storage and in catalysis. The coordination sites or
bridging anions is often O- and N-resulting to formation of very stable, large surface area and
open channels without the collapse of the framework. Most of these MOF organic linkers are
rigid aromatic carboxylates, COO- or N- containing aromatic ligands [9]. Thus exploration of a
ligand family with sufficient electrons for ligation purposes produces stable complexes [10].
The novelty of this research is the use of chromium alkoxide precursors onto silica
surface in order to increase the silica column’s lifetime for liquid chromatographic separations.
Chromium is a stable transitional element which exists as a hexavalent ion in solution forming
Chapter 2
17
complexes with other compounds [11]. Therefore, it is crucial for incorporation of ligands, in
order to effectively capture and close the chromium sites which could be interacting with the
analytes that were being separated. MOF-Si synthesis for chromatographic separation was
successful, however, it was found to be a physical process.
2.2 Experimental
2.2.1 Chemical reagents
Silica gel (5µm), L-column silica (5µm), chromium (III) chloride hexahydrate (CrCl3.6H2O),
toluene, acrylic acid, urea, distilled water, ethanol (EtOH), hydrochloric acid (HCl, 99%),
toluene, methanol, isopropanol, polyethylene glycol (PEG, 10,000) were received from Wako
Pure Chemicals Limited, Japan. Polypropylene glycol (PPG) was obtained from Sigma-Aldrich
while Chromium (III) benzoylacetonate (C30H27CrO6) was obtained from Gelest (Morrisville,
Japan). These chemicals were used without further purification.
2.2.2 Activation of silica gel
Silica gel (5µm) was first activated using HCl following a previous method [12] with slight
modification. In brief, 2 g of silica gel dissolved in 20 mL of 20% hydrochloric acid was added
to a round bottomed flask and the mixture was refluxed at 700 C for 4 hours. The sample was
then filtered out, washed with water and acetone three times and later oven dried at 800C for 12 h.
The sample was then stored in the desiccator ready for the next step.
2.2.3 Preparation of chromium solution
The chromium solution was first synthesized following a method by Kido’s group [13] with
slight modification. In brief, CrCl3.6H2O (1.19 g), urea (2.68 g) and acrylic acid (0.8 g) were
dissolved in a mixture of distilled water (1.82 mL) and EtOH (1.50 mL). Polypropylene glycol
(1.88 mL) was then added to the solution and the solution was again ultra-sonicated for 20 min.
Chapter 2
18
The solution was stirred under ultra-sonicator into a homogeneous green solution for 20 min and
this mixture was denoted as solution A.
2.2.4 Preparation of Si-Cr Composites
The activated silica (0.4 g) was put into a round bottomed flask and solution A (0.2 g) suspended
in 20 mL toluene was added drop wise. The mixture was refluxed for 24 h at 80oC. The sample
was then washed with toluene, iso-propanol, methanol, water and finally with acetone three
times subsequently. The sample was later oven dried at 80 oC for 12 h. The sample was denoted
as Si-Cr.
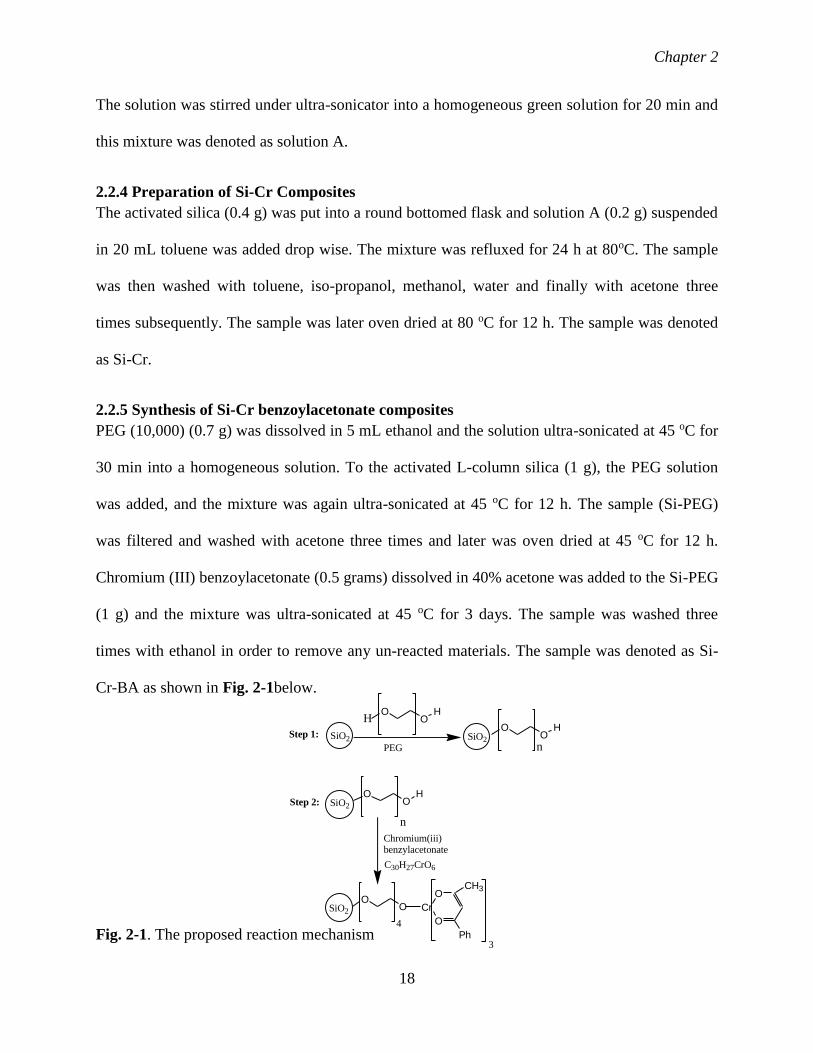
2.2.5 Synthesis of Si-Cr benzoylacetonate composites
PEG (10,000) (0.7 g) was dissolved in 5 mL ethanol and the solution ultra-sonicated at 45 oC for
30 min into a homogeneous solution. To the activated L-column silica (1 g), the PEG solution
was added, and the mixture was again ultra-sonicated at 45 oC for 12 h. The sample (Si-PEG)
was filtered and washed with acetone three times and later was oven dried at 45 oC for 12 h.
Chromium (III) benzoylacetonate (0.5 grams) dissolved in 40% acetone was added to the Si-PEG
(1 g) and the mixture was ultra-sonicated at 45 oC for 3 days. The sample was washed three
times with ethanol in order to remove any un-reacted materials. The sample was denoted as Si-
Cr-BA as shown in Fig. 2-1below.
Fig. 2-1. The proposed reaction mechanism
SiO2
PEG
HO
OH
SiO2
OO
H
SiO2
OO
H
Chromium(iii) benzylacetonate
SiO2
OO
O
Cr
O
CH3
Ph
n
n
4
C30H27CrO6
Step 1:
Step 2:
3

Chapter 2
19
2.2.6 Column packing and testing
Both the commercial silica (Si) and Si-Cr samples were packed into 10 cm capillary column (100
cm x 0.32 mm i.d.) and different analytes were separated, recorded and compared. The columns
were downward packed individually using suspension of silicas in methanol using a syringe and
the same solvent for propulsion purposes.
2.2.7 Sample characterization
2.2.7.1 Elemental and scanning electron microscope (SEM) analyses
The elemental analyzer, CHN 2400 Perkin-Elmer, was used to identify the elements present in
both the Si-Cr and Si-Cr-BA samples. The samples (0.2 mg) were first heated in the ceramic
crucibles in the temperature range of 30-1000 oC in the flowing air atmosphere with the heating
rate of 10oC min-1 [14].The results were recorded and analyzed. The samples were again
characterized using SEM.
2.2.7.2 FT-IR characterization
The IR spectra of all the samples were recorded at the wavelength range of 400-4000 cm-1 using
FT-IR Perkin Elmer Spectrum 400 spectrometer. The sample (0.1 mg) was placed on Gladi
ATRTM PIKE technologies, Japan and was scanned 8 times. The spectra were recorded and
analyzed.
2.2.7.3 BET adsorption isotherms
The Si-Cr powder was first oven dried at 150 oC for 180 min before measurements. It was then
put inside a glass tube to be used as the adsorbate for nitrogen gas at 77 K, in order to form a
monolayer sample. A certain volume (V) of nitrogen was adsorbed on the pore walls of Si-Cr
and the corresponding partial pressure (p/po) was recorded. Measurement of specific surface area
was done using the lower portion of adsorption-desorption isotherm which was used for pore
analyses.
Chapter 2
20
Physical gas adsorption is a technique of choice for examining the silica pore
characteristic which determines the amount of gas adsorbed on silica gel which is a direct
indication of the porous properties [15]. Thus the isotherm obtained from these adsorption
measurements provided the information about surface area, pore volume and pore size
distribution.
2.3 Results and discussions
2.3.1 Sample characterization
2.3.1.1 Si and Si-Cr elemental analysis
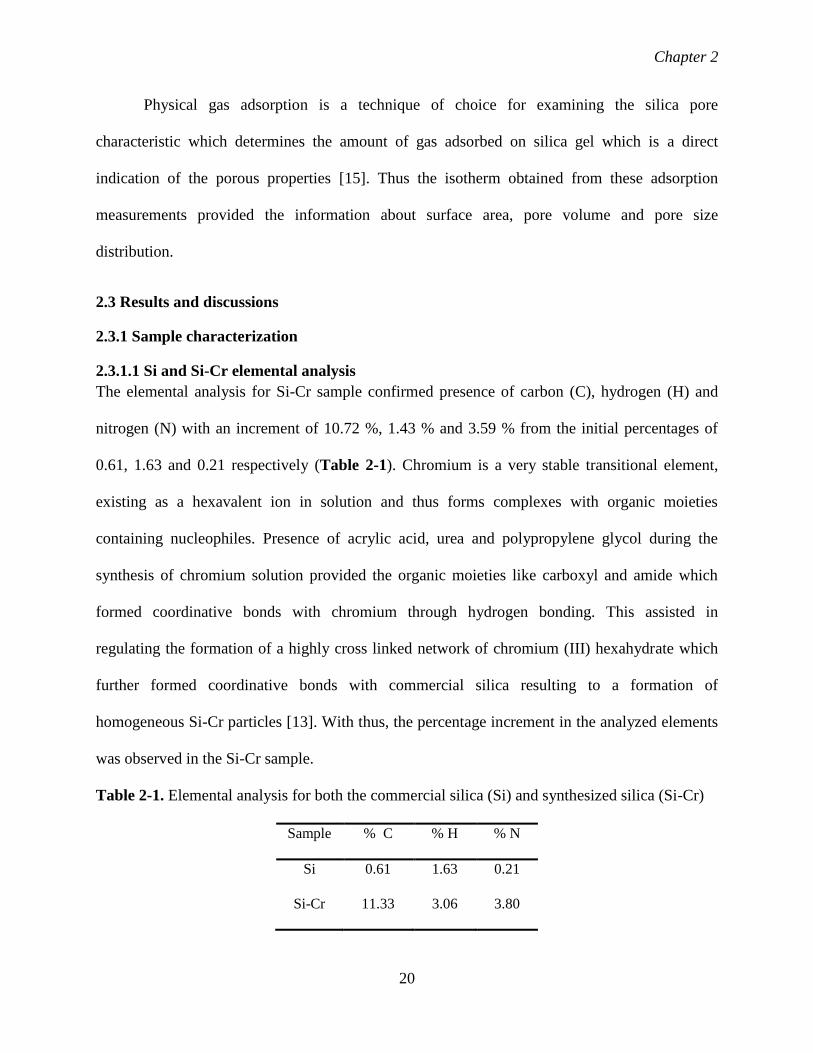
The elemental analysis for Si-Cr sample confirmed presence of carbon (C), hydrogen (H) and
nitrogen (N) with an increment of 10.72 %, 1.43 % and 3.59 % from the initial percentages of
0.61, 1.63 and 0.21 respectively (Table 2-1). Chromium is a very stable transitional element,
existing as a hexavalent ion in solution and thus forms complexes with organic moieties
containing nucleophiles. Presence of acrylic acid, urea and polypropylene glycol during the
synthesis of chromium solution provided the organic moieties like carboxyl and amide which
formed coordinative bonds with chromium through hydrogen bonding. This assisted in
regulating the formation of a highly cross linked network of chromium (III) hexahydrate which
further formed coordinative bonds with commercial silica resulting to a formation of
homogeneous Si-Cr particles [13]. With thus, the percentage increment in the analyzed elements
was observed in the Si-Cr sample.
Table 2-1. Elemental analysis for both the commercial silica (Si) and synthesized silica (Si-Cr)
Sample % C % H % N
Si 0.61 1.63 0.21
Si-Cr 11.33 3.06 3.80

Chapter 2
21
2.3.1.2 Si and Si-Cr-BA elemental analysis
The Si-Cr-BA sample elemental analysis confirmed presence of C and H with an increment of
38.52 % and 2.61 % from the initial percentages of 0.35 and 1 % respectively (Table 2-2).
Presence of PEG during the synthesis of Si-Cr-BA provided the carboxyl organic moieties
linking the commercial silica surface with the chromium benzoylacetonate complex
(C30H27CrO6) through hydrogen bonding. Thus, about thirty C (C30) atoms resulted from
chromium complex and the rest eight (C8) resulted from the PEG ligand.
Table 2-2.Elemental analysis for both commercial silica (Si) and synthesized silica (Si-Cr-BA)
Sample % C % H % N
Si 0.35 1 0
Si-Cr-BA 38.87 3.61 0
2.3.1.3 Scanning electron microscopefor both Si and Si-Crsamples
When comparing the SEM images as shown in Fig 2-2of Si, i.e.A (i) and A (ii), and those of Si-
Cr,i.e.B (i) and B (ii), the Si-Cr showed to have a smallerparticles distribution. This may have
been due to the replacement of an OH groups by O-Cr groups in silica pore gel. Thus, the
incorporation of Cr (III) into tetrahedral geometry of Si (IV) was successful thereby increasing
the lattice parameter [5].
A (i) B (i)

Chapter 2
22
A(ii) B(ii)
Fig. 2-2.SEM images of commercial silica (Si),A (i) magnification 1000x and A(ii)
magnification 2000x, and synthesized silica (Si-Cr), B(i) magnification 1000X
and B(ii) magnification 2000x, respectively
2.3.1.4 The FT-IR spectra for both Si and Si-Cr samples
The FT-IR spectra of both commercial silica (Si) {Fig. 2-3 (a)} and chromium modified silica
gel (Si-Cr) {Fig. 2-3 (b)} were analyzed and recorded which confirmed successful incorporation
of Cr (III) into the Si surface. The synthesized sample was green in color which was due to
presence of trivalent chromium ions in the octahedral geometry. The IR absorption peaks at 468
cm-1 and 1088 cm-1 on commercial silica were due to asymmetric and symmetric stretching
vibrations of the Si-O-Si bond. On Si-Cr sample analysis, these absorption peaks shifted to lower
wavelength of 466.1 cm-1 and 1102.0 cm-1 respectively, which was a clear indication of Cr
incorporation into silica tetrahedral framework. The absorption bands at 966 cm-1 caused by Si-O
vibrations in Si-OH, was observed to shift to lower wavelength of 930 cm-1 on Si-Cr due to
presence of chromium ions (Table 2-3). Similar results were observed by Bai’s group [5].

Chapter 2
23
Fig. 2-3. FT-IR spectra for commercial silica (Si) (a) and synthesized silica (Si-Cr) (b)
Table 2-3. Assignment of the FT-IR absorption bands
Wavenumber (cm -1 ) Assignment
468 cm -1 Si-O-Si Asymmetrical stretching
966 cm -1 Si-O-H stretching vibrations
1088 cm -1 Si-O-Si symmetrical stretching
1380.2 cm -1 Symmetrical vibration of methyl group
2925 cm-1 C-H stretching of the alkyl groups
3507.5 cm -1 O-H stretching vibration
2.3.1.5 The FT-IR spectra for both Si and Si-Cr-BA samples
The FT-IR spectrawere recorded for both commercial silica, as shown inFig. 2-4(a), and Si-Cr-
BA, as shown inFig. 2-4(b), and the absorption bands were assigned in accordance to Table 2-
4below. The Si-Cr-BA sample contained both the PEG and benzoylacetonate ligands as
confirmed by the elemental analysis (Table 2-2). The carboxyl groups are the main groups in
both the PEG and benzoylacetonate structures, which may have undergone transformation during
chromium metal complexes formation. These carboxyl groups contains C=O, C-O and O-H
1000 2000 3000 4000
70
80
90
100
(a)
(b)
Wavenumber (cm-1
)
Tra
nsm
itta
nce (
%)

Chapter 2
24
vibration modes. The C=O stretch appeared at 1700.4 cm-1, and due to the small differences in
the lengths of C=O bonds in the carboxylic there may have been some sub-bands at 1710 cm-1
and 1698.5 cm-1. On deprotonation of the carboxyl groups during the complex formation, this
caused band in the 1700 cm-1 region disappear and new, very strong bands of asymmetric and
symmetric stretching vibration of –COO- appear. The broad spectrum at 3507.5 cm-1 was
attributed to O-H stretching vibrations consequence of benzoylacetone and PEG ligand. The
results were in consistence with previous research work [14, 16-17].
Fig. 2-4. FT-IR spectra for both the commercial silica (a) andsynthesized silica (Si-Cr-
BA)(Si) (b)
Table 2-4. Assignment of the FT-IR absorption bands
Wavenumber (cm -1) Assignment
470 cm -1 Si-O bending vibrations
583 cm -1 Cr-O stretching vibrations
746 cm -1 Mono substituted benzenes vibrations
800 cm -1 Si-O-Si symmetrical stretching vibrations
1380.2 cm -1 Symmetrical vibration of CH3 in ligand
1000 2000 3000 4000
70
80
90
100
110(a)
(b)
Wavenumber (cm-1
)
Tra
nsm
itta
nce (
%)

Chapter 2
25
1525.6 cm -1 C=C assymetrical stretching of the ligand
1710 cm -1 Deprotonation of carboxyl group during complex
formation
3507.5 cm -1 O-H stretching vibration
2.3.1.6 BET adsorption isotherms for both Si and Si-Cr samples
From the nitrogen adsorption isotherm, it was observed that the material had both macropores
and mesopores structures. The nitrogen adsorption on Si-Cr sample was best described to be type
IV in the BET classification, Fig. 2-5 (A), as indicated by the square of the product moment
correlation coefficient (R2) value of 0.998 Fig. 2-5 (B). This indicated that the mesopores
structures had increased in N2 uptake which confirmed excellent adsorption behavior resulting
from modification of Si with the oxides of Cr [7]. This also showed that capillary condensation
occurred during adsorption through cylindrical meniscus while desorption occurred through
hemispherical meniscus, thus separating the vapor and the capillary condensed phases [15].
However, the presence of the oxides of chromium on silica backbone reduced the access of
nitrogen into the skeletal base which thus resulted in gradual decrease in the specific surface area.
The initial silica specific surface area ranges from 235-700 m2/g which gradually reduced to
200.89 m2/g specific surface area upon modification [4, 18]. This further supported the elemental,
SEM and FT-IR sample analysis.
Fig. 2-5.Nitrogen adsorption isotherm at 77K with correlation coefficient of 0.998 (A)
indicative of type IV in BET classification (B)
0
50
100
150
200
1 12 23
Isotherm plot
Qu
anti
ty A
dso
rbed
(cm
³/g S
TP
)
Relative Pressure (P/Po)
(A)
y = 0.0222xR² = 0.9981
0
0.002
0.004
0.006
0.008
0 0.1 0.2 0.3 0.4
1/[
Q(P
o/P
-1
)]
Relative Pressure (P/Po)
(B)

Chapter 2
26
2.3.2 Chromatographic evaluation
2.3.2.1 Separation of mixed aromatic compounds
The present study was able to address a major problem of synthesizing a silica-chromium
method that was able to produce an adsorbent which was stable under conditions of high flow
and pressure, during the chromatographic evaluation. The Si-Cr column was found capable of
separating mix aromatic compounds with retention time of 15 minutes (Fig. 2-6). The retention
order was from phenol; the hydroxyl group on the phenol compound being the point of reference,
thus from less non-polar to highly non-polar compound (diethyl phthalate). However, there was
an observed peak broadening on peaks 1 and 2 (Fig. 2-6) which were due to the interaction of the
given compounds (slightly polar) with the Cr open sites. Such a drawback could be fixed by
replacement of the given ligands with rigid aromatic multi dentate ligands containing both O- and
N- electron rich surfaces, so as to form stable complexes with chromium, effectively closing all
the open Cr sites. These results were in line with the past research work [19].
Fig. 2-6.Separation of mixed aromatic compounds; (1) phenol, (2) nitrobenzene, (3)
acetophenone, (4) dimethyl phthalate and (5) diethyl phthalate on the
synthesized silica (Si-Cr) column. Hexane: chloroform (90:10, v/v) was used
0 5 10 15 20 25Time (min)
1
2
3
4
5
Det
ecto
r re
sponse
(µ
V)

Chapter 2
27
as the mobile phase, with a flow-rate of 2.0µLmin-1, an injection volume of
0.2 µL and at UV detection of 280 nm
2.3.2.2 Separation of alkyl benzenes
In order to effectively separate the alkyl benzenes compounds, the use of ligands ensured a
homogeneous, cross linked chromium complex was formed. According to previous research
works [4, 11], chromium surface is a non-polar surface, moreover, the incorporated ligands also
increased the hydrophobicity of the commercial silica column Fig. 2-7 (A) to the synthesized
silica surface (Si-Cr)Fig. 2-7 (B) which effectively separated non-polar compounds with about
half an hour reduced retention time. The retention was in the order of less non-polar compound
(benzene) to more non-polar compound (dodecyl benzene).
Fig. 2-7 (A).Separation of alkyl benzene; (1) benzene (2) toluene, (3) hexyl benzene, (4) octyl
benzene (5) dodecyl benzene on commercial silica packed in a capillary
column (A)of 100 ×0.32mm i.d while using hexane-chloroform (94:6, v/v) as
the mobile phase, a flow-rate of 2.0µLmin-1, an injection volume of0.2 µL and
UV detection at 254nm
0 10 20 30 40 50 60
Time (min)
1
2
3
4
5
Det
ecto
r re
sponse
(µ
V)
A

Chapter 2
28
Fig. 2-7 (B).Separation of alkyl benzene; (1) benzene (2) toluene, (3) hexyl benzene, (4) octyl
benzene (5) dodecyl benzene on synthesized silica (B) (Si-Cr). Operating
conditions as shown in Fig 2-7 (A)
2.3.2.3 Separation of parabens
Parabens were separated on commercial silica (Si) and compared with both Si-Cr and Si-Cr-BA
columns, as shown in Fig. 2.8 (a),Fig. 2-8 (b) and Fig. 2-9, respectively. In comparison, the
synthesized silicas (Si-Cr and Si-Cr-BA) were able to separate the parabens better than the
commercial silica (Si). Moreover, separation on Si-Cr-BA column had reduced peak broadening
and tailing in comparison with Si-Cr column. This was as a result of the increased
hydrophobicity on column Si-Cr-BA (Table 2-2) resulting from the presence of
benzoylacetonate and PEG ligands in comparison to Si-Cr column (Table 2-1). The three
benzoylacetonate ligands present in the chromium complex formation, were also effective in
closing the Cr open sites, thereby reducing the analytes-column interaction, thus the reduced
tailing. The analytes were again separated in the order of polarity; with the less non-polar
compounds eluting first while the more non-polar compound eluted last.
0 5 10 15 20 25
Time (min)
1
2
3
4
5
Dete
cto
r re
sponse
(µ
V)
B

Chapter 2
29
However, in Si-Cr-BA column, there was no peak when ACN was used as a mobile
phase as Cr sites have more affinity for N,i.e.the cyano group present in ACN than O, and
methanol was thus used as both a mobile phase and a modifier, inhibiting the analytes-column
interaction up to optimum 55% [19].
In comparison to the two synthesized column, Si-Cr was more stable during the
separation analysis in comparison to Si-Cr-BA. This may have been due to presence of both O-
and N- ligands during the Cr complex formation (Table 2-1 and 2-2) [9-10]. However, separation
with reduced peak tailing was achieved on Si-Cr-BA column due to the better ligand coverage on
all the possible open Cr sites.
However, the synthesis process on Si-Cr-BA column was found to be physical process
(Fig. 2-10) and with thus, no further analysis was carried out. Other than the type of the ligand
used for stable Cr complex formation as seen in Tables2-1 and 2-2, the modification process
may also have been a physical process due to the synthesis method. The chemical modification
process may have been attained if it was carried out in a Teflon lining under elevated pressure
and temperature (hydrothermal treatment/ microwave treatment) [7]. A bit of difference with
original commercial silica (Si) and ligands desorbed form the commercial silica (Si-Cr-BA),FT-
IR spectra as shown in Fig. 2-10(e) and 2-10(d) respectively, was attributed to a partial loss in
the crystalline structure of the framework after the separation applications.

Chapter 2
30
Fig. 2.8.Separation of parabens;(1) 4-hydroxy benzoic acid, (2) methyl paraben, (3) ethyl
paraben, (4) propyl paraben and (5) butyl parabenon (a) commercial silica (Si)
and (b) synthesized silica (Si-Cr) packed in a 100 ×0.32mm i.d. capillary column.
Hexane: chloroform (98:2, v/v) was used as the mobile phase, with a flow-rate of
2.0µLmin-1, injection volume of0.2µL and UV detection at 280nm
Fig. 2.9.Separation of parabens;(1) 4-hydroxy benzoic acid, (2) methyl paraben, (3) ethyl
paraben, (4) propyl paraben and (5) butyl parabenon a commercial bare silica
(Si) and (c) synthesized silica Si-Cr-BA.Mobile phase used was 45%, 55% and
2,3
1,2,3,4,5
(a)
0 5 10 15 20 25 30
Time (min)
Det
ecto
r re
sponse
(µ
V) 1
4,5
(b)
1,2,3,4,5
(a)
0 5 10 15 20 25 30 35 40 45
12 3
4 & 5
(a) 55 %
(c) 45 %
(c) 80 %
(c) 55 %
Time (min)
Det
ecto
r re
sponse
(µ
V)

Chapter 2
31
80% MeOHwith a flow-rate of 2.0µLmin-1injection volume of 0.2 µL and UV
detection at 280nm
Fig. 2-10.FT-IR spectra for both thesynthesized silica (Si-Cr-BA) (e) and used column (Si-
Cr BA) (d)
2.4 Conclusions
Modification process was successful; however, physical-sorption process on Si-Cr-BA column
may have been involved. Chemical-sorption is the best modification process for preparation of
stationary phases to be used in chromatographic separation fields. No peak was observed when
using ACN as a mobile phase in parabens separation on this column. This was due to the
interaction of cyano group in ACN with the open Cr-sites. The optimal MeOH used as the
mobile phase was 55%. MeOH also acted as stationary phase modifier inhibiting interaction
between the paraben analytes and Cr open sites. Use of the appropriate multi dentate ligand
together with ligand-Cr ratio is important in MOF-Cr synthesis for separation applications. Silica
1000 2000 3000 4000
70
80
90
100
110
(d)
(e)
Wavenumber (cm-1
)
Tra
nsm
itta
nce
(%
)
Chapter 2
32
can be used as a career in drug delivery applications/ sorption (adsorbent) of heavy metals like
chromium from waste water.
2.5 References
[1] K. Choi, S. Lee, O.J. Park, A. Park, S. Cho, Y.S. Lee, H. J. Lee,W. Choi,J. Sci. Rep.,8 (2018),
1-10.
[2] R.S. Cesar, A. Claudio, E.C. Kenneth,H.C. Carol, North Am. J.,22, (2004), 1-6.
[3] C.D. Hoth, G.J. Rivera, A.L. Colon, J.Chromatogr.A.,1079, (2005), 392-396.
[4] A.W. Aue, P.P. Wickramanayake,J. Chromatogr.,197,(1980), 21-29.
[5] Y. Bai, W. Hu, X. Hu, B. Zhu, P. Yao, J. Jia, IJEMS,19,(2012),209-214.
[6] H.Budiman, H.K. F. Sri, H.A.Setiawan,J. Chem.,6, (2009),141-150.
[7] K.Uma, T.Pan, K.C.T. Yang, Materials, 10, (2017), 1-13.
[8] L. Chmielarz, P. Kustrowski, R. Dziembaj, P. Cool, F. E. Vansant, Microporous Mesoporous,
127,(2010), 133-141.
[9] R.Iwona, S.Justyna, M.Liliana, R.Zofia, J. Inorg Organomet Polym Mater., 23, (2013) 1068-
1077.
[10] A.V. Nikolakis, T. J. Tsalavoutis, M. Stylianou, E. Evgeniou, T. Jakusch, A. Melman, M.
Sigalas, T. Kiss, D. A. Keramidas, A. T. Kabanos, Inorg. Chem.,47, (2008), 11698-11710.
[11] M. M. Michael,Master’s thesis dissertation, (2014), University of South Florida, pp. 64-102.
[12] X.Huang, J.Wang, X.Liu,Anal. Sci.,18, (2002), 69-72.
[13] Y. Kido, G. Hesagawa, K. Kanamori, Nakanishi K. J. Mater. Chem. A.,2,(2014),745-
752.
[14] J.Sienkiewicz-Gromiuk, I.Rusinek, L.Kurach, Z. Rzaczynska, J. Therm Anal. Calorim., 126,
(2016),327-342.
[15] A. Sdiri, T. Higashi, S. Bouaziz, M. Benzina, Arab. J. Chem.,7, (2014),486-493.

Chapter 2
33
[16] E. Khairuddin, S.B. Pramono, V. Utomo, A. Wulandari, W. Zahroutul, F. Clegg, J.
Phys.,776, (2016),1-7.
[17] I. Rusinek, J. Sienkiewicz-Gromiuk, L. Mazur, and Z. Rzaczynska, J. Inorg. Organomet.
Polym.,23, (2013), 1068-1077.
[18] K. R. Sharma, A. Puri, A. Kumar, A. Adholeya, J. Environ. Sci.,25, (2013), 1252-1261.
[19] Y.Fu, C.Yang, X.Yan, Langmuir,28, (2012), 6794-6802.

Chapter 3
34
Chapter 3
Development of a novel stationary phase for ion exchange liquid
chromatography via click reaction
3.1 Introduction
Liquid chromatography (LC) is a well-known analytical technique used for separation of
different compounds. It can be categorized into different modes of separation,i.e. reversed-phase
LC (RPLC), normal-phase LC (NPLC), ion-exchangechromatoghraphy (IEC), hydrophobic
interaction chromatography (HIC), hydrophilic interaction chromatography (HILIC) and size-
exclusion chromatography (SEC) amongst others [1]. As a branch of LC, IEC has been well-
established over the past years since its first initiation by Small [2] for the ionic samples
separation. From then on, researchers have made a considerable effort in preparation of these ion
exchange stationary phases [3]. These phases have charged functionalities, where ionic analytes
are separated through electrostatic forces. For instance, on this chromatographic media, inorganic
anions and other charged molecules are mainly separated.
Covalently bonded silica based stationary phases still dominates as the best, most popular
separation medium due to its good chromatographic performance, mechanical strength and easy
during preparation process [4].The most commonly used stationary phasescovalently bonded
onto silica surface is C18-alkyl chains, which have been widely utilized for reversed-phase
separation mode. Other reactive groups like –NH2,–COOH, have also been immobilized onto
silica surface, but sometimes with low selectivity and efficiency. This could be due to some side
reactions between the silica supports and the other functional groups resulting in inefficient
immobilization process, which generally affects the separation efficiency [5].
Cetyltrimethylammonium modified silica was evaluated for the inorganic anions
detection in seawater samples by our researchgroup [6-7]. The quaternary ammonium anion was

Chapter 3
35
introduced onto silica surface forming two layers, where the first layer was introduced through
electrostatic interaction and the second layer worked as anion-exchange site [6]. Later, inorganic
anions were effectively separated using pyridine functionalized silica-based stationary phase; the
inorganic anions were retained on a protonated pyridine under acidic eluent conditions in ion-
exchange mode [7].
On further development to these findings, a novel, facile and a powerful strategy for
covalently immobilizing these functionalities onto silica support through click chemistry was
reported [8-9]. Since then, it has attracted a great attention in the modern chemistry. These
reactions have excellent advantages like high selectivity, no side reactions, functional groups
tolerance and the reactions are done under mild conditions. According to Chu’s group research
work, the mechanism of CuAAC is highly favored by different factors. For instant, the solvents
used during the reaction promotes ligand exchange and consequently promoting the formation of
polynuclear copper acetylides, the complexes’ reactivity and the ligands present during this
reaction [1]. It is thus useful class of selective chemical reactions which affords high yields with
tolerance to variety of solvents and functional groups. Many researchers have been able to
effectively immobilize highly functionalized molecules onto silica surface with terminal alkyne
and azido modified silica surface [10]. Liu and his co-workers immobilized propargylamine onto
azide-silica through click chemistry. The stationary phase had good selectivity in inorganic
anions separation under ion exchange mechanism [11].
Depending on the functionalities on click modified silica stationary phases, several
separation modes, e.g., RPLC, chiral separation, HILIC and IEC have been identified. Guo and
his group functionalized silica through click chemistry and their usage in HPLC chromatographic
separations of compounds. They were able to effectively bond di- and oligosaccharides on silica

Chapter 3
36
gel for HILIC and it was assessed to be an excellent chromatographic phase for the polar
compounds separation. This further demonstrated the power of click chemistry in the preparation
of complex bonded stationary phases [5].
A novel click-arginine-stationary phase was also synthesized by covalently linking
arginine onto silica gel through click reaction. This stationary phase exhibited a good HILIC
property, excellent selectivity and high capacity towards glycopeptides analytes and thus become
a promising glycoproteomics analytical material [11].
Additionally, Huang and colleagues covalently linked a glycosyl amino acid (glycosyl
phenyl glycine) onto silica via click chemistry. Again, the material exhibited to be a typical
HILIC characteristic which was found capable of separating high polar compounds like
nucleosides and bases in a simple eluent composition of acetonitrile and water. It also showed
better separation ability with longer retention during the separation of polar organic acids [12].
Liu and coworkers were able to effectively synthesize azide-silica and later attached
propargylamine through click chemistry. This stationary phase had good selectivity in inorganic
anions separation under ion exchange mechanism. In combination with the free amino group
attached to the prepared material, the triazole ring played a role in the separation [11].
Futhermore, Guo and coworkers developed a lysine attached onto silica stationary phase
through click reaction for ion exchange mechanism through click chemistry for the inorganic
ions analysis. The synthesized material demonstrated good performance and effective separation
ability for the common inorganic anions while using aqueous sodium sulfate as eluent. In
accordance to the above highlighted research observations, many stationary phases i.e NPLC,
RPLC and HILIC modes have been prepared through click chemistry for the polar compounds’
separation and complex samples except for IC stationary phases [5].
Chapter 3
37
With thus, a novel silica based stationary phase was developed through click chemistry
for inorganic anions’ separation in this study.
3.2 Experimental
3.2.1 Apparatus
A capillary LC system comprised of a micro-feeder (L.TEX-8301 Corporation, Tokyo, Japan)
equipped with a gas-tight syringe (0.5mL; Ito, Fuji, Japan) was applied as a pump, 0.2µL as the
injection volume, was injected through a M435 micro-injection valve (Upchurch Scientific, Oak
Harbor, WA, USA), and a UV-970 UV detector (JASCO, Tokyo, Japan) with a capillary flow
cell (75 µm; JASCO) attached, was used to carry out the chromatographic measurements. The
pump flow-rate was kept at 1.0 µL min-1, and the detector was operated at 210 nm. CDS-Lite ver
5.0 data processor (LAsoft, Nagareyama, Chiba, Japan) was used to acquire all the data.
Fourier transform infrared spectroscopy (FT-IR) was used during the characterization of
the silicas. The FT-IR spectra of all the samples were recorded at the wavelength range 400-4000
cm-1 using FT-IR Perkin Elmer Spectrum 400 spectrometer. The sample (0.1 mg) was placed on
Gladi ATRTM PIKE technologies, Japan and was scanned 8 times. The spectra were recorded and
analyzed.
3.2.2 Reagents and chemicals
Spherical silica 5μm particle diameter (Chemical Evaluation and Research Institute, Tokyo,
Japan) was used. 3-Isocyanatopropyl-triethoxysilane, propargyl bromide, tetrahydrofuran (THF),
sodium azide (NaN3) and sodium chloride (NaCl) were purchased from FUJIFILM Wako Pure
Chemical Co-operation (Osaka, Japan), tetrabutylammonium iodide andL-ascorbic acid sodium
salt (Nacalai Tesque INC., Japan), while dimethyl sulfoxide (DMSO) and 1-chloro octadecane
were obtained from Kanto Chemicals Co., INC, Japan. A simple UV water purification system
Chapter 3
38
was used to produce ultrapure water in the laboratory, which was used in the preparation of all
solutions used in this study.
3.2.3 Preparation of alkynyl-modified silica
A previous method by Guo [5], for the synthesis of alkynyl-modified silica gel was followed
with slight modification. To the anhydrous THF (20 mL) was added a solution of 3-
isocyanatopropyltriethoxysilane (1.73 g) and propargyl bromide (0.462 g). The mixture was
heated at 85o C with constant stirring for 12 h, which was then cooled to room temperature.
Silica gel (2 g) was added to the resultant mixture and this, was stirred for 32 h at 110oC and
later filtered. The obtained product was rinsed with 15 mL dichloromethane, 15 mL methanol
and 7.5 mL acetone, the solid was collected through filtration using 0.45μm filter paper.
3.2.4. Preparation of 1-azido octadecane
1-azidooctadecane was prepared by a method previously described with slight modification[8].
Sodium azide (0.715 g) and tetrabutylammonium iodide (2.0 mg) were dissolved in DMSO (22
mL). 1-chloro octadecane (3.33 g) was added to the solution and the mixture was heated at 83o C
for 16 h. Later, water was added to the solution mixture in order to quench it, which was then
extracted with hexane using a separating funnel, to obtain a whitish oil layer.
3.2.5. Synthesis of the stationary phase
The synthetic procedure used in the preparation of this stationary phase is as described by Guo
[5] with slight modification. To a solution of 1-azidooctadecane (0.44 g) in 15 mL MeOH/ H2O
(60:30), L-ascorbic acid sodium salt (50 mg) dissolved in 2 mL H2O, CuSO4 (25 mg) dissolved
in 2 mL H2O and alkyne-silica (0.49 g) was added into the mixture while slowly stirring. The
resultant solution was stirred at room temperature for 5 days. The obtained solid product after
filtration was then washed with water (100 mL), methanol (100 mL), 0.1 mol L−1EDTA solution
Chapter 3
39
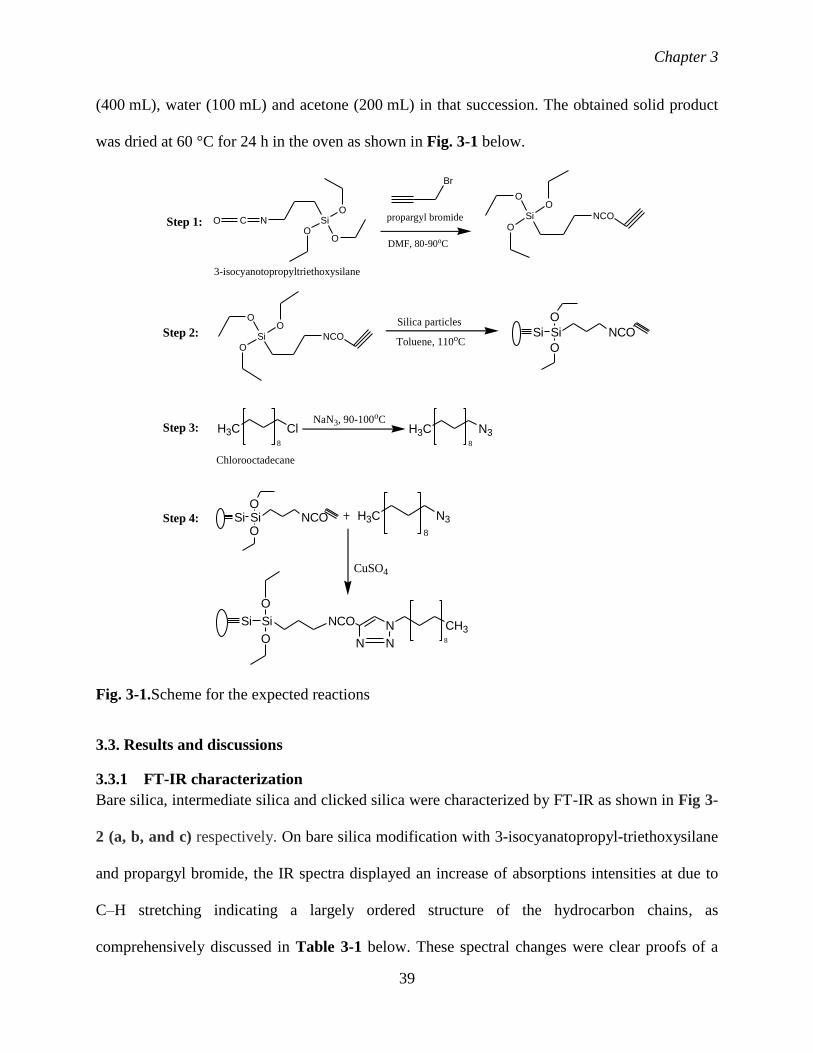
(400 mL), water (100 mL) and acetone (200 mL) in that succession. The obtained solid product
was dried at 60 °C for 24 h in the oven as shown in Fig. 3-1 below.
SiO
O
O
NCO
3-isocyanotopropyltriethoxysilane
Br
propargyl bromide
DMF, 80-90oC
Si
O
O
O
NCO
SiO
O
O
NCO
Silica particles
Toluene, 110oCSi Si
O
O
NCO
H3C Cl
Chlorooctadecane
NaN3, 90-100oC
Si SiO
ONCO
8
H3C N38
H3C N3
8
Si Si
O
O
NCO
N
N
N
CH38
CuSO4
Step 1:
Step 2:
Step 3:
Step 4:
Fig. 3-1.Scheme for the expected reactions
3.3. Results and discussions
3.3.1 FT-IR characterization
Bare silica, intermediate silica and clicked silica were characterized by FT-IR as shown in Fig 3-
2 (a, b, and c) respectively. On bare silica modification with 3-isocyanatopropyl-triethoxysilane
and propargyl bromide, the IR spectra displayed an increase of absorptions intensities at due to
C–H stretching indicating a largely ordered structure of the hydrocarbon chains, as
comprehensively discussed in Table 3-1 below. These spectral changes were clear proofs of a

Chapter 3
40
successful reaction and an immobilization procedure. This was further confirmed using
elemental analysis as shown in Table 3-2 below
Fig. 3-2. FT-IR characterization of bare silica (a), intermediate silica (b) and clicked
modified silica (c)
Table 3-1. Assignment of the FT-IR absorption bands for bare silica, intermediate silica and
clicked modified silica
Wavenumber(cm -1) Peak assignment
477.1 cm -1 Si-O bending vibrations
800.3 cm -1 Si-O-Si symmetrical stretching
1380.2 cm -1 Symmetrical vibration of CH3
1585-1600 cm -1 C-C stretching of aromatic ring
1710.5 cm -1 Asymmetric stretching of C=O
2925 cm -1 C-H stretch of alkyl groups
3507.5 cm -1 O-H stretching vibration
1000 2000 3000 4000
40
60
80
100
(a)
(b)
(c)
Tra
nsm
itta
nce
(%
)
Wavenumber (cm-1
)

Chapter 3
41
Table 3-2. Elemental analysis of both bare and modified silica samples
Sample % C % H % N
Silica 0.35 1 0
Modified Silica 9.62 2.16 2.05
Increment 9.27% 1.16% 2.05%
3.3.2 Inorganic anion’s retention behavior
The prepared click alkyl-azide silica bonded stationary phase was achieved through the reaction
of alkyne silica and azido-octadecane in presence of Cu catalyst to produce a triazole ring. This
ring could have served as an ion exchange site as it is considered to be a basic aromatic
heterocycle. After the protonation of this ring, the eluent cations may have been trapped resulting
in formation of ion exchange site. The ions were separated in the order of iodate, bromate,
bromide, nitrate, iodide, and thiocyanate which is a similar observation made to common IC
columns (Fig 3-3).
Fig 3-3.Separation of inorganic anions on aclick alkyl-azide silica bonded stationary
phase column 100 x 0.32 mm I.D, while using 100 mM NaCl as eluent, a flow-
rate of 1.5μL min-1 and UVwavelengthdetection at 210 nm. Analytes: 1= IO3-,
2= BrO3 -, 3= Br-, 5= I -, 6= SCN -, 1 mM each while 4 = NO3
- (0.5 mM)
0 5 10 15 20
1
2
3
4
5
6
Time (min)
Dete
cto
r re
sponse
(µ
V)
Chapter 3
42
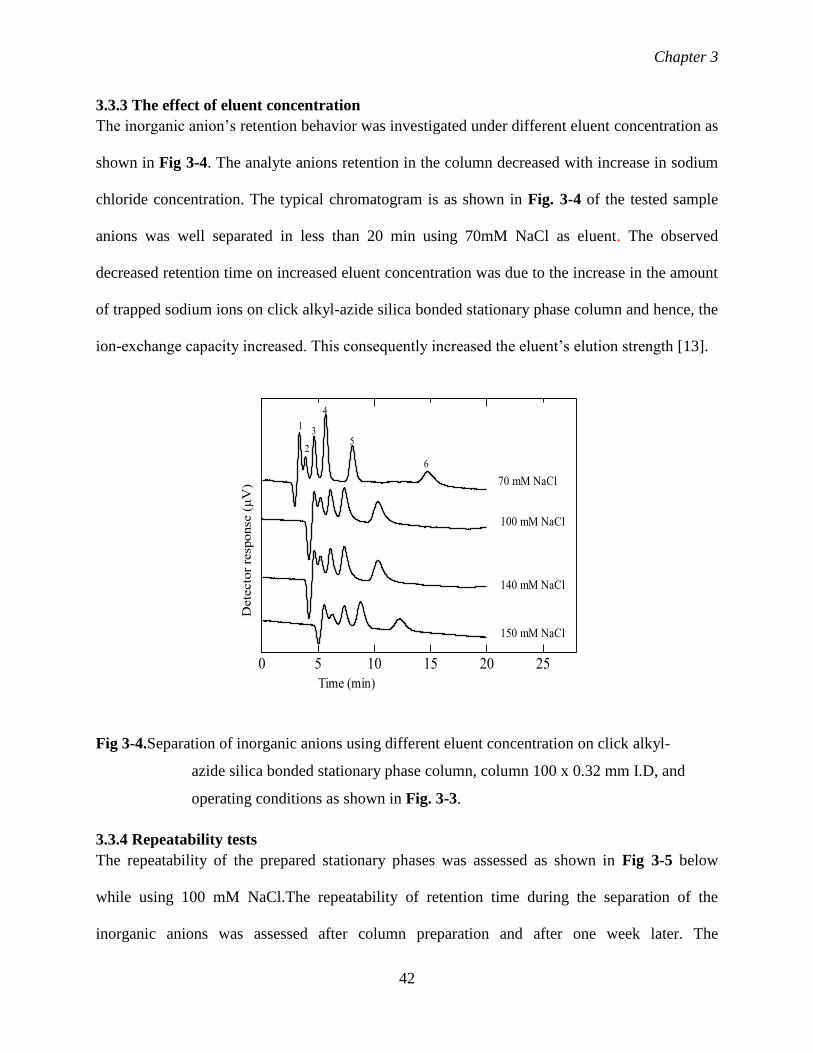
3.3.3 The effect of eluent concentration
The inorganic anion’s retention behavior was investigated under different eluent concentration as
shown in Fig 3-4. The analyte anions retention in the column decreased with increase in sodium
chloride concentration. The typical chromatogram is as shown in Fig. 3-4 of the tested sample
anions was well separated in less than 20 min using 70mM NaCl as eluent. The observed
decreased retention time on increased eluent concentration was due to the increase in the amount
of trapped sodium ions on click alkyl-azide silica bonded stationary phase column and hence, the
ion-exchange capacity increased. This consequently increased the eluent’s elution strength [13].
Fig 3-4.Separation of inorganic anions using different eluent concentration on click alkyl-
azide silica bonded stationary phase column, column 100 x 0.32 mm I.D, and
operating conditions as shown in Fig. 3-3.
3.3.4 Repeatability tests
The repeatability of the prepared stationary phases was assessed as shown in Fig 3-5 below
while using 100 mM NaCl.The repeatability of retention time during the separation of the
inorganic anions was assessed after column preparation and after one week later. The
0 5 10 15 20 25
70 mM NaCl
100 mM NaCl
140 mM NaCl
150 mM NaCl
1
2
3
4
5
6
Time (min)
Dete
cto
r re
sponse
(µ
V)

Chapter 3
43
observation made was that the repeatability of the retention time was not very good. That is, the
retention time of the assessed inorganic anions was observed to decrease with increasing analysis
time, meaning that the long-term stability of the prepared stationary phase remainedto be a big
challenge [19]. This may have been as a result of the exposure of the click modified material to
light, thus resulted to degradation of the ion exchange active sites.
Fig 3-5.Repeatability assessment during the separation of inorganic anions on a click
alkyl-azide silica bonded stationary phase column, and other operating conditions
as shown in Fig. 3-3.
3.3.5 Column application
3.3.5.1 Gifu University laboratory tap water
Tap water was collected from Gifu university laboratory, which was then filtered through a 0.45-
μm membrane filter prior to injection. The prepared column was used to assessthis sample
whileusing 70mM NaCl as eluent. Tap water was confirmed to contain both had nitrate and
iodide ions as shown in Fig. 3-6 below.
0 5 10 15 20
1
23
4
5
6
Time (min)
Dete
cto
r re
sponse
(µ
V)
Day 7
Day 1

Chapter 3
44
Fig 3-6.Real sample column application for tap water samples analysis usingthe
click alkyl-azide silica bonded stationary phase column, and other operating
conditions as in Fig. 3-3.
3.3.5.2Saliva sample analysis
A saliva sample was collected from a healthy non-smoker, which was then filtered through a
0.45 µm membrane filter prior to injection. The inorganic anions present were examined using
the prepared column where 70mM NaCl as was used as the eluent.As shown in Fig 3-7, this
sample contained nitrate, iodide and thiocyanate anions. The saliva sample peak’s retention time
was observed to be slightly different when comparing it with the standard sample, due to matrix
interaction; however, confirmation was done through spiking the saliva sample, and
consequently peak height increment.
0 5 10 15 20 25
Tap water sample
1
Standard sampleIodide anion
Nitrate anion
Time (min)
Dete
cto
r re
sponse
(µ
V)

Chapter 3
45
Fig 3-7.Real sample column application for saliva sample analysis usingand other operating
conditions as in Fig. 3-3.
3.4 Conclusions
This study demonstrated ions are separated using stationary phases with ionizable functional
groups. The triazole ring that was formed during click reaction could be responsible for the
separation of inorganic anions thus acting as ion exchange site. Separation of the inorganic
anions could be achieved using 70mM NaCl as eluent. The inorganic anions retention as
observed to be affected by the concentration of eluent.
3.5 References
[1] C. Chu, R. Liu, J. Chem. Soc. Rev.,40, (2011), 2177-2188.
[2] H. Small, T.S. Stevens, W. C. Bauman, Anal. Sci.,47, (1975), 1801-1812.
[3] F. Zhang, Y. Liu, J. Wei, Z. Guo, B. Yang, and X. Liang, J. Sep. Sci.,34,(2012),1624-1628.
[4] Z. Guo, A. Lei, Y. Zhang, Q. Xu, X. Xue, F. Zhang, X. Liang, Chem. Commun., 1, (2007),
2491-2493.
0 5 10 15 20 25
Saliva sample
1
2
3
4
5
6
Time (min)
Standard sample
Nitrate anion
Iodide anionThiocyanate anion
Dete
cto
r re
sponse
(µ
V)
Chapter 3
46
[5] H. Guo, C. Chu, Y. Li, B. Yang, and X. Liang, Anal.Sci.,136, (2011), 5302-5307.
[6] X. Jiang, L. W. Lim, and T. Takeuchi, Anal. Bioanal. Chem., 393, (2009)1203-1206.
[7] T. Takeuchi, T. Kawasaki, and L.W. Lim, Anal. Sci.,26, (2010), 511-514.
[8] X. Sun, D. Lin, X. He, L. Chen, and Y. Zhang, Talanta,82,(2010), 404-408.
[9] H.C. Kolb, M.G. Finn, and K.B. Sharpless,J. Angew. Chem.,40,(2001),2004-2021.
[10]Y. Wang, Y. Xiao, T. Thatt Yang Tan, and S. Ng, Tetrahedron Lett., 49, (2008), 5190-5191
[11] Y. Liu, Q. Du, B. Yang, F. Zhang, C. Chu, and X. Liang, Anal., 137, (2012), 1624-1628.
[12] H. Huang, H. Guo, M. Xue, Y. Liu, J. Yang, X. Liang, C. Chu, 85,Talanta, (2011), 1642-
1647.
[13] I. Kawase, L.W. Lim, and T. Takeuchi, Chromatographia, 80,(2017), 1089-1093.
[14] S. Wu, X. Li, F. Zhang, G. Jiang, X. Liang, and B. Yang,Anal., 1,(2015), 1-12.
[15] Z. Guo, Y. Liu, J. Xu, Q. Xu, X. Xue, F. Zhang, Y. Ke, X. Liang, A. Lei, J. Chromatogr.
A,1191, (2008), 78-82.
[16] C. Lin, Y. Yang, and M. Yang, J.Chromatogr.,515,(1990),49-58.
[17] L. W. Lim, Chromatography,1, (2015),1-12.
[18] L. W. Lim, K. Tokunaga, T. Takeuchi, Chromatography,35, (2014), 95-101.
[19] R. Linda, L. W. Lim, T. Takeuchi, J. Chromatogr. A, 1294, (2013), 117– 121.
Chapter 4
47
Chapter 4
A novel covalently bonded 4-amino butyric acid silica stationary
phase for capillary ion chromatography
4.1 Introduction
Monitoring the inorganic anions’ concentrations, i.e. bromide (Br-), nitrate (NO3-), iodide (I-) and
nitrite (NO2-) anions in rivers, lakes or seawaters is essential for marine pollution research and
environmental conservation. Concentrations of both the NO2- and NO3
- anions in aquatic
environmental water is responsible for algal blooms and eutrophication pollution, as nitrate is the
main source of nitrogen for the phytoplankton growth in seawater. Eutrophication blocks
sunlight passage to the aquatic life and its overgrowth may deplete off oxygen present in the
water, creating a dead zone for living organisms [1].
On the other hand, inorganic anions, i.e. iodide and bromide anions are naturally
occurring in aquatic environment. Chlorination of this water for drinking purposes is essential as
it kills microbes and bactaria responsible for the waterborne diseases like typhoid, cholera and
dysentery outbreak. I-and Br-anions present in water are rapidly oxidized during chlorination to
hypoiodous acid (HOI) and hypobromous acid (HOBr) respectively. The natural occurring
organic matter reacts with these oxidants (HOBr and HOI) to formcarcinogenic compounds [2].
Determination of these inorganic anions is done by ion chromatography (IC) with an
ultraviolet (UV) detector. This IC analytical technique was developed in 1975 by Small and his
co-workers [3].
The most commonly applied IC stationary phases are silica and polymer based. Silica
based stationary phases have rich silanol groups on its surfaces, which allows easy introduction
of many functionalities onto the gel. Moreover, the rich silanol groups on silica surface may

Chapter 4
48
affect biological sample’s separation, due to their high rigidity, fast mass transfer and resistance
to organic solvents [4].
Basically, most IC stationary phases have chargeable functional groups, where the
difference in repulsive forces or electrostatic attraction between the ionic analytes and the
prepared stationary phase results to their separation, through ion exchange mechanism [5]. With
thus, many researchers have been interested in developing various types of silica stationary
phases for IC.
For instance, our group dynamically modified silica gel with a cetyltrimethylammonium which
effectively separated inorganic anions. This was done by the passage of
cetyltrimethylammonium ion’s solution through the column [6]. Later in the research, we
fabricated monolithic silica modified with cetyltrimethylammonium ion for the separation of five
inorganic anions in seawater matrix while using a capillary column. In order to stabilize the
anions’ retention time, cetyltrimethylammonium chloride was added as a modifier for the mobile
phase. In their research findings, nitrate anion had a retention factor (K) of 3.2 and a plate height
(H) of 87 μm while using 500 mmol/L sodium chloride with 0.1 mmol/L of
cetyltrimethylammonium chloride (CTAC) as the mobile phase [7]. They made further
advancement by modifying the monolithic silica with dilauryldimethylammonium bromide
(DDAB). This was observed to have higher stability in anions’ retention in comparison to CTAC
modified monolithic silica, which thus allowed for bromide ion’s determination in seawater
without tedious pretreatments [8].
Additionally, Sun and his co-workers [9] effectively modified silica with benzimidazole,
and the stationary phase was evaluated as reversed phase and anion exchange mixed mode.
Moreover, imidazole [10], poly (1-allylimidazole) [11], phenyl amine [12], 8-quinolinol [13],
Chapter 4
49
pyridine [14], dipyridine [15], phenylpropanolamine [16] modified silicas have been investigated
as potential mixed mode stationary phase liquid chromatography. The prepared columns had
multi-interactions including π–π stacking, electrostatic forces, hydrogen bonding, hydrophobic
and anion-exchange interactions.Thus different analytes including phthalates,phenols, organic
and inorganic anions, poly aromatic hydrocarbons and anilines were effectively separated.
Nesterenko and his group effectivelyprepared zwitternionic stationary phases with
different amino acids like valine, glutamine, asparagine, lysine and tryosine byfirst linking 3-
glycidyloxypropyltrimethoxysilane (GPTMS) on silica surface, which was then followed by an
epoxy ring attack using the targeted amino acid [17-20].
The purpose of this study was to investigate the retention of anions on a chemically
bonded 4-amino butyric acid (ABA) onto the surface of silica gel. A simple 2-step reaction was
followed in order to effectively synthesize the material. Selection of a suitable eluent resulted to
the retention and separation of anions and thus, it worked as the anion-exchange stationary phase.
4.2 Experimental
4.2.1 Apparatus
A capillary LC system was used to carry out the chromatographic measurements. It comprised of
a L.TEX-8301 micro-feeder fitted with a 0.5mL gas-tight syringe as a pump, an injector with an
injection sample volume of 0.2µL-a M435 microinjection valve (Upchurch Scientific, Oak
Harbor, WA, USA), and aJASCO, Tokyo, Japan, UV detector(UV-970) fitted with a flow cell
capillary (75 µm; JASCO) attached. The pump flow rate was kept at 1.0 µL min-1, and the
detector was operated at 210 nm. CDS-Lite ver 5.0 data processor (LAsoft, Nagareyama, Chiba,
Japan) was used to acquire all the data. A centrifuge (IEC610-2-020, Kubota, Tokyo, Japan) was
used for centrifuging the mixture solution during the cleaning off the un-reacted residue on the
prepared stationary phase.

Chapter 4
50
4.2.2 Reagents
All the chemicalsused were of high quality. Sodium chloride, hydrochloric acid (HCl), 4-amino
butyric acid (ABA) and 3-isocyanatopropyl-triethoxysilane (ICPT) were acquired from Wako
Pure Chemical Manufacturers (Osaka, Japan) while Kanto Chemical (Tokyo) provided methanol
and acetonitrile. A simple UV water purifier system produced the ultrapure water which was
used to prepare all solutions used in this study. Silica gel (3 μm) was used as the stationary
phase’s base the materials (Chemical Evaluation and Research Institute, Tokyo, Japan). The
silica gel was first dried at 120°C for 5 h before use while toluene was dried using molecular
sieves 3A (1/16” pellets) for ca. 5 h, and a reflux equipment was used as the reaction vessel.
4.2.3 Preparation of the stationary phase
The ABA stationary phase (Fig 4-1) was prepared following a method by previous researchers
[21-22] with slight modification. Dried porous silica gel (0.2 g) was placed in the reaction reflux
equipment, and 1.2 mL dry toluene together with 0.1 mL of ICPT was added to the vessel. The
reaction was carried out at 110oC with continuous stirring for 18 h. The ICPT-bonded silica gel
was washed with methanol and was then dried at 70°C for 6 h. The reacted silica gel was reacted
with ABA at 90oC for 24 h, and was finally washed twice with ethanol and wateras shown in Fig
4-1.The synthesized material was then packed into the capillary column, while using ethanol as
propulsion solvent.HCl (30 mM) was then passed though the packed column for 30 minutes.
The ABA stationary phase, Fig. 4-1(a), was also prepared following a method by previous
report [23] with slight modification. Silica gel was first dried at 120° C for 5 h before use while
toluene was dried using molecular sieves 3A (1/16” pellets) for ca. 5 h, and a reflux equipment
was used as the reaction vessel. Briefly, dried porous silica gel (0.1 g), 4-aminobutyric acid (0.1
g), 0.1 mL of 3-isocyanopropyltriethoxysilane, ethanol (0.3 ml) and water (0.5 mL) were all
mixed together in reflux equipment. The reaction was refluxed with continuous stirring for 24 h

Chapter 4
51
at 90o C. The reaction was later cooled to room temperature, filtered and the obtained material
was washed three times with toluene and ethanol consequently. The obtained synthesized
material was packed into the capillary column and ethanol was used as the propulsion solvent.
Hydrochloric acid (30 mM) was passed though the packed column for 30 minutes. The prepared
column also gave satisfactory results. Moreover, another possible reaction mechanism route was
also proposed to guarantee similar results as shown in Fig 4-1(b).
Si OH
Si O Si
O
OO
toluene,110 oC
18 h
Si O Si
O
O
O
toluene, 90oC
24 h
O
OHH2N
4-amino butyric acid
SiO
O
O
N
3-isocyanopropyltriethoxysilane
N C O
C
O
O
OHN-C-N
O
H
+ +
H
Fig. 4-1. The proposed reaction mechanism for 4-aminobutanoic acid-modified column

Chapter 4
52
O
OHH2N
4-amino butyric acid
Si
O
O
O
N
3-isocyanopropyltriethoxysilane
C
O
Silica particles,in;EtOH/ Water
24 h
One pot reaction
Si O Si
O
O
O
O
OHN-C-N
O
H
+ +
H
Fig. 4-1 (a). Possible reaction mechanism for 4-aminobutanoic acid-modified column
O
OHH2N
4-amino butyric acid
Si
O
O
O
N
3-isocyanopropyltriethoxysilane
C
O
DMF, 80-90oC.
12 / 24 h
Silica particles,
toluene, 110oC
Si O Si
O
O
O
O
OHN-C-N
O
H
+ +
H
O Si
O
O
O
O
OHN-C-N
O
H
+ +
H
Fig. 4-1 (b). Possible reaction mechanism for 4-aminobutanoic acid-modified column

Chapter 4
53
4.3 Results and discussions
4.3.1 Inorganic anion’s retention behavior
The prepared ABA-silica bonded stationary phase was achieved through the reaction of ICPT
with 4-amino butyric acid which guaranteed the covalent incorporation of 4-amino butyric acid
onto the silica gel to yield a secondary amine. The surface was able to effectively retain and
separate the inorganic anions within reasonable time. It was suggested that the expected mode of
inorganic anions separation was due to the primary amine group’s protonation, on the ABA
modified silica surface, which may have acted as cationic site interacting with the inorganic
anions through electrostatic interaction, for the effective separation. On thissynthesized
stationary phase, the inorganic anions were separated through the ion-exchange mode with an
elution order of iodate, bromate, bromide, nitrate, iodide, and thiocyanate. This elution order was
observed to be similar to that of common IC while using 80 mM sodium chloride in 0.5 mM HCl
as the eluent while subjecting a flow rate of 1µL/min, as shown in Fig. 4-2.
Fig. 4-2. Separation of inorganic anions on a ABA modified silica column, (column 100 x
0.32 mm I.D), while using sample mixture of (1) IO3-, (2) BrO3
-, (3) Br-, (4) NO3-
, (5) I- , and (6) SCN-at a concentration of 1mM each and 0.5mM NO3-, an
0 10 20 30 40 50 60
1
2
3
4
5
6
Time (min)
Det
ecto
r re
sponse
(µ
V)
0.05 µV abs
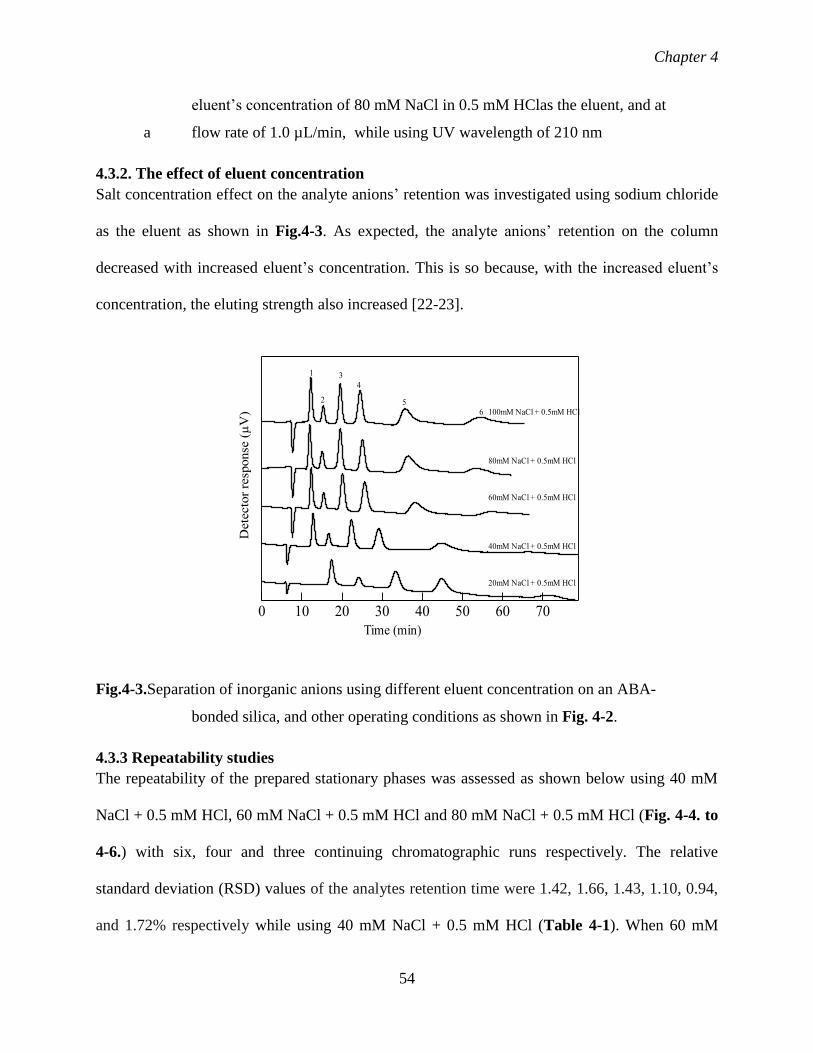
Chapter 4
54
eluent’s concentration of 80 mM NaCl in 0.5 mM HClas the eluent, and at
a flow rate of 1.0 µL/min, while using UV wavelength of 210 nm
4.3.2. The effect of eluent concentration
Salt concentration effect on the analyte anions’ retention was investigated using sodium chloride
as the eluent as shown in Fig.4-3. As expected, the analyte anions’ retention on the column
decreased with increased eluent’s concentration. This is so because, with the increased eluent’s
concentration, the eluting strength also increased [22-23].
Fig.4-3.Separation of inorganic anions using different eluent concentration on an ABA-
bonded silica, and other operating conditions as shown in Fig. 4-2.
4.3.3 Repeatability studies
The repeatability of the prepared stationary phases was assessed as shown below using 40 mM
NaCl + 0.5 mM HCl, 60 mM NaCl + 0.5 mM HCl and 80 mM NaCl + 0.5 mM HCl (Fig. 4-4. to
4-6.) with six, four and three continuing chromatographic runs respectively. The relative
standard deviation (RSD) values of the analytes retention time were 1.42, 1.66, 1.43, 1.10, 0.94,
and 1.72% respectively while using 40 mM NaCl + 0.5 mM HCl (Table 4-1). When 60 mM
0 10 20 30 40 50 60 70
100mM NaCl + 0.5mM HCl
80mM NaCl + 0.5mM HCl
60mM NaCl + 0.5mM HCl
40mM NaCl + 0.5mM HCl
20mM NaCl + 0.5mM HCl
1
2
34
56
Time (min)
Dete
cto
r re
sponse
(µ
V)

Chapter 4
55
NaCl + 0.5 mM HCl and 80 mM NaCl + 0.5 mM HCl were used as the mobile phases, RSD
values were between 0.57-1.75% and 0.12-2.76%, as can be seen in Table 4-1. and 4-2.,
respectively. Good repeatability with RSD value less than 2%in almost all repeatability
assessments was observed with some peak signal being relatively sharp.
Fig.4-4.Repeatability assessment during the separation of inorganic anions on an ABA-
bonded silica, while using 40 mM NaCl + 0.5 mM HCl as eluent, and operating
conditions as in Fig. 4-2.
Table 4-1.RSD values of the separation of inorganic anions on an ABA-bonded silica while
using 40 mM NaCl + 0.5 mM HCl as eluent, operating conditions as in Fig. 4-4.
Anion Average S.D RSD (%)
IO3- 12.6858 0.1797 1.42
BrO3 - 16.8515 0.2798 1.66
Br- 22.6305 0.3238 1.43
NO3- 29.3485 0.3233 1.10
I - 44.6153 0.4184 0.94
SCN - 68.6892 1.1814 1.72
0 10 20 30 40 50 60 70 80
1
2
34
56
Time (min)
Dete
cto
r re
sponse
(µ
V)

Chapter 4
56
Fig.4-5.Repeatability assessment during the separation of inorganic anions on an ABA-
bonded silica, while using 60 mM NaCl + 0.5 mM HCl as eluent, and other
operating conditions as shown in Fig. 4-2.
Table 4-2. RSD values of the separation of inorganic anions on an ABA-bonded silica while
using 40 mM NaCl + 0.5 mM HCl as eluent, operating conditions as in Fig. 4-5.
Anion Average S.D RSD (%)
IO3- 12.3280 0.1407 1.14
BrO3 - 15.5800 0.2468 1.58
Br- 20.3577 0.3567 1.75
NO3- 25.8153 0.1540 0.57
I - 38.1637 0.1120 0.29
SCN - 57.2213 0.6834 1.19
0 10 20 30 40 50 60
1
2
34
5
6
Time (min)
Dete
cto
r re
sponse
(µ
V)

Chapter 4
57
Fig.4-6.Repeatability assessment during the separation of inorganic anions on an ABA-
bonded silica, column 100 x 0.32 mm I.D, while using 80 mM NaCl + 0.5 mM
HCl as eluent, operating conditions as in Fig. 4-2.
Table 4-3.RSD values of the separation of inorganic anions on an ABA-bonded silica while
using 80 mM NaCl + 0.5 mM HCl as eluent, operating conditions as in Fig. 4-6.
Anion Average S.D RSD (%)
IO3- 11.9540 0.0141 0.12
BrO3 - 15.3555 0.4250 2.76
Br- 19.5915 0.0583 0.29
NO3- 24.936 0.1980 0.79
I - 36.706 0.4186 1.14
SCN - 52.906 0.8457 1.59
4.3.4 Effect of eluent cation
The effect of different chloride solutions i.e.NaCl (a), KCl (b), LiCl (c), RbCl (d), CsCl (e)at 20
mM + 0.5 mM HCl each and 10 mMCaCl2 + 0.5 mM HCl (f) were used as eluents in order to
investigate their effect on anions’ retention as shown in Fig. 4-7. The retention time was
observed not to be affected by these eluent cations.
0 10 20 30 40 50 60 70 80 90
1
2
34
56
Time (min)
Dete
cto
r re
sponse
(µ
V)

Chapter 4
58
Fig.4-7.Evaluation of inorganic anions at different eluent cationson an ABA-bonded
silica, other operating conditions as shown in Fig. 4-2.
4.3.5 Effect of pH
In order toinvestigate the effect of pH on inorganic anions’retention as shown in Fig 4-8, the
prepared column was again evaluated. The procedure was carried out while using 40 mM NaCl
solutions as the mobile phase whose pH value had been adjusted to; 2.49, 3.59, 3.98, 5.55 and
6.96. Below, Fig. 4-8 demonstrates the separation of iodate, bromate, bromide, nitrate and iodide
on the prepared column at pH value close to neutral (pH 6.96) and at acidic eluent conditions
(pH 2.49, 3.59, 3.98 and 5.55). The anions were more retained in the column under acidic
condition, while they were less retained on the stationary phase under neutral condition. In
addition, the elution order was iodate, bromate, bromide, nitrate, iodide and thiocyanate ions.
This observation shows that the 4-amino butyric acid functionality and the terminal weak acid
group produced a variable capacity anion exchanger. 4-Amino butyric acid is a weakly basic
amino acid with the pKa values at 25oC of 4.01. This means that the ABA stationary phase
0 20 40 60 80 100 120 140
20 mM KCl + 0.5 mM HCl
20 mM NaCl + 0.5 mM HCl
Time (min)
20 mM LiCl + 0.5 mM HCl
20 mM CsCl + 0.5 mM HCl
20 mM RbCl + 0.5 mM HCl
10 mM CaCl2 + 0.5 mM HCl
1
23
4 5 6
Dete
cto
r re
sponse
(µ
V)

Chapter 4
59
employed in this work was protonated at a lower pH, while it had no charge at a neutral or higher
pH. Thus, the prepared stationary phase worked as an anion-exchange stationary phase at a lower
pH [9, 17].
Fig.4-8.Evaluation of inorganic anions at various eluent pH on an ABA-bonded silica
while using 40 mM NaCl as eluent, other operating conditions as
in Fig. 4-2.
4.3.6 Column application
Water samples; Gifu university laboratory tap water (Fig 4-9), Chubu Centrair Japan Airport
water (Fig 4-10) and Shinmaiko seawater (Fig 4-11) were first collected. Thesamples were
filtered through a 0.45 µm membrane filter prior to injection. The ABA column was used for the
assessment these water samples while using 120mM NaCl + 0.5mM HCl as eluent. Tap water
had nitrate ions as confirmed through increase in peak height after spiking the sample with 0.5
mM nitrate ion (0.25 ml). On the other hand,Central Japan Airport waters and Shinmaiko
seawaters were confirmed to contain both the bromide and nitrate ions.
0 20 40 60 80 100 120 140 160
40 mM NaCl pH 2.49
40 mM NaCl pH 3.59
40 mM NaCl pH 3.98
Time (min)
40 mM NaCl pH 5.55
40 mM NaCl pH 6.96
12
34
5
Dete
cto
r re
sponse
(µ
V)

Chapter 4
60
Fig.4-9.Evaluation of inorganic anions in laboratory tap water on an ABA-bonded silica
while using 120 mM NaCl + 0.5 mM HCl as eluent, other operating conditions as
shown in Fig. 4-2.
Fig .4-10.Evaluation of inorganic anions in Central Japan Airport water on an ABA-bonded
silica while using 120 mM NaCl + 0.5 mM HCl as eluent, other operating
conditions as shown in Fig. 4-2.
0 10 20 30 40 50 60 70 80 90 100
Laboratory tap water
Tap water bromide ion spiked
Standard sample
Tap water with nitrate ion spiked
Time (min)
Dete
cto
r re
sponse
(µ
V)
1
2
34
56
0 10 20 30 40 50 60 70 80 90 100
Standard
Time (min)
Nitrate ion spiked
Bromide ion spiked
Central Japan Airport water
Iodate ion spiked
Bromate ion spiked
Bromide ionNitrate ion
Dete
cto
r re
sponse
( µ
V)
12
34 5 6

Chapter 4
61
Fig.4-11.Evaluation of inorganic anions in Shinmaiko sea water on an ABA-bonded silica
while using 120 mM NaCl + 0.5 mM HCl as eluent, other operating conditions as
shown in Fig. 4-2.
4.4 Conclusions
This study demonstrated that ions are usually separated using stationary phases with charged or
chargeable functional groups in LC. ABA bonded stationary phase provided the anion-exchange
site which allowed us to separate of inorganic anions and as it was expected, ion exchange
mechanism was involved in the retention of these analyte anions. The retention time of the
analyte anions was carefully controlled by a good selection of the eluent. The eluent
concentration greatly affected the analyte anions’ retention on the synthesized stationary phase.
4.5 References
[1] K. Ito, R. Nomura, T. Fujii, M. Tanaka, T. Tsumura, H. Shibata, T. Hirokawa, Anal. Bioanal.
Chem.,404, (2012),1123–1128.
[2]G. Hua, D. A. Reckhow, J. Kim, Environ. Sci. Technol.,40, (2006), 3050-3056.
[3] H. Small, T.S. Stevens, W.C. Bauman, J. Anal. Sci.,47, (1975), 1801-1809.
0 10 20 30 40 50 60 70 80 90 100
Standard
Time (min)
Nitrate ion spiked
Bromide ion spiked
Shinmaiko seawater
Iodate ion spiked
Bromate ion spiked
Bromide ionNitrate ion
Det
ecto
r re
sponse
( µ
V)
12
34 5 6

Chapter 4
62
[4] R. Linda, L. W. Lim, T. Takeuchi, J. Chromatogr. A.,1294, (2013), 117-121.
[5] T. Takeuchi, B. Jiang, L.W. Lim, Anal. Bioanal. Chem., 402, (2012),551-555.
[6] T. Takeuchi, E. S. Yeung, J. Chromatogr., 370, (1986), 83-92.
[7] A. Suzuki, L.W. Lim, T. Hiroi, T.Takeuchi, Talanta,70, (2006), 190-193.
[8] A. Suzuki, L.W. Lim, T. Takeuchi, Anal. Sci., 23, (2007), 1081-1084.
[9] M. Sun, J. Feng, C. Luo, X. Liu, S. Jiang, Talanta,105, (2013), 135-141.
[10] H. Qiu, S. Jiang, X. Liu, J. Chromatogr. A, 1103, (2006), 265–270.
[11] M. Sun, H. Qiu, L.Wang, X. Liu, S. Jiang, J. Chromatogr. A, 1216, (2009),3904-3909.
[12] M. G. Kisereva, P. N. Nesterenko, J. Chromatogr. A,898, (2000), 23-34.
[13] M. M. Muenter, K. C. Strokes, R. T. Obie, J. R. Jezorek, J. Chromatogr. A., 844, (1999),
39-51.
[14] T. Takeuchi, T. Kawasaki, L.W. Lim, Anal. Sci., 26, (2010), 511-514.
[15] M. Sun, J. Feng, S. Liu, C. Xiong, X. Liu, S. Jiang, J. Chromatogr. A., 1218, (2011), 3743-
3749.
[16] S. Wongyai, Chromatographia, 38, (1994), 485-490.
[17] N. P. Nesterenko, J. Chromatogr. A, 605, (1992), 199-204.
[18] N. P. Nesterenko, I. A. Elefterov, A. D. Tarasenko, A.O. Shpigun, J. Chromatogr. A,706,
(1995),59-68.
[19] H. Xu, Z. Xu, L. Yang, Q. J. S. Wang, J. Sep. Sci.,34, (2011), 2314-2322.
[20] H. Xu, Z. Xu, L. Yang, Q. J. S. Wang, J. Sep. Sci.,34, (2011), 2314-2322.
[21] L. W. Lim, K. Tokunaga, T. Takeuchi, Chromatography, 35, (2014), 95-101.
[22] T. Takeuchi, K. Tokunaga, L.W. Lim, Anal. Sci., 29, (2013), 423-427.
[23] P. N. Nesterenko, P.A. Kebets, Anal. Chem., 62 (2007) 2-7.

Chapter 4
63
[24] R. Linda, L.W. Lim, T. Takeuchi, J.Chromatogr.A,1294, (2013), 117-121.

Chapter 5
64
Chapter 5
A novel covalently bonded 7-amino heptanoic acid silica stationary
phase for capillary ion chromatography
5.1 Introduction
Capillary columns are at the core of chromatographic separation techniques. According to a
review by Lim [1], these columns were first invented for gas chromatography (GC), but due to
the majority of the target compounds being neither volatile nor stable to be separated on a GC
system, a vision was therefore realized to use glass beads packed columns for liquid
chromatography (LC). LCwas invented in 1967, and it is generally attributed to Horvath and co-
workers[2]. Since then, an era of LC systems was then developed. Themajority of these columns
are stillpacked columns, with monolithic columns being the best alternatives [3].
Packed capillary columns are made by slurry packing of the silica materials under
pressure with particles <15µm in diameter. On the other hand, open-tubular capillary columns
are fused-silica capillaries with an inner diameter in the range of < 100 µm while monolithic
column consists of tailored polymer matrix through photo or thermally initiated polymerization
of monomers with the desired functional groups or through sol-gel processes [4].
Packed capillary columns for ion exchange chromatography (IEC) were invented by
Small and his coworkers [5], are probably the most frequently used chromatographic media for
the identification and separation of ionic samples, mainly, inorganic anions and cations, peptides
and carbohydrates. Since then, this technique has been applied to solve a wide range of analytical
problems, such determination of the composition of aqueous samples and as quality control. Ion
exchangers with silica as the base material still dominates as the best stationary phases due to

Chapter 5
65
itsgood mechanical strength,easy modification processes and excellent chromatography
performance [6].
These IEC stationary phases are being utilized owing to their charged moieties. Cyanuric
chloride quaternary ammonium salt was linked covalently onto silica surface, forming a strong
anion exchanger for the separation of single charged inorganic anions while using tartaric acid as
eluent by Lin and his group [7].
Additionally, a methyl-capped poly (ethylene oxide)bonded silica gel was developed by
our group and the stationary phase was evaluated for the inorganic anions’effective separation,
with the retention behavior examined to be ion exchange mechanism [8]. Later, weobserved that
a pyridine stationary phase could also be used for ion-exchange separation of inorganic anions
under acidic condition. The protonated pyridine group acted as an effective ion exchange site
when operated in acidic condition [9].
Basically, ionically charged functional groups; negative or positive charged sites, are
attached to the stationary phase and the retention mechanism is ion exchange [10-12]. The eluent
cation must be sufficiently attracted to the ion-exchange stationary phase, and at a very low
eluent concentration, in order to effectively separate the sample anions[7]. That is, due to the
differences in the electrostatic interactions, the ionic analytes are separated prior to moving into
the detector [13].
In accordance to previous research findings [14], hydrophilic interaction liquid
chromatography (HILIC) columns with zwitterionic functional groups could also simultaneously
separate anions and cations in active pharmaceutical components while using acetonitrile-
ammonium formate buffer as the mobile phase. On the other hand, Arai and coworkers [15]

Chapter 5
66
demonstrated that diol-columns could be used to achieve excellent separation of anions using
acidic eluent with presence of H+ being very critical.
Zwitterionic stationary phases are mainly prepared by usingamino acids as they have both
an acid (carboxylic acid, i.e. negative charge) and basic (amine; i.e. positive charge) functional
groups within the same molecule [16]. The opposite charge on groups within a molecule is based
upon the location and the pKa at neutral pH, and thus the prepared stationary phase could have
cation, anion or zwitterions exchange properties, depending on the structure of the amino acids
[6]. In aqueous solutions,amino acids acts as weak acids and bases, i.e, the carboxylic acid
functionality is the dominant form at low pH and they exist in equilibrium between the neutral
molecules and the zwitterionic form at intermediate pH [17].
This led Nesterenko and coworkers to investigate some amino acid functionalized silica
based ion exchangers by immobilizing amino acids with different structures i.e. asparagine,
valine, arginine, lysine, glutamine and tryrosine, on the surface of a monolithic silica column, on
which, according to their research findings, these phases they exhibited zwitterionic properties.
They prepared the phase by first covalently linking GPTMS onto silica surface, which was
immediately followed by the attack of the epoxy ring by the amino acid of interest [18-20].
The purpose of this study was to investigate the retention of anions on a silica gel
immobilized with 7-amino heptanoic acid. Two simple step reactions were followed. Selection of
a suitable mobile phase resulted to the separation of targeted anions, and the prepared column
worked as the anion-exchange stationary phase.
5.2 Experimental
5.2.1 Reagents
High quality reagents were used in this study. Hydrochloric acid (HCl), 7-amino heptanoic acid
(AHA) and sodium chloride were purchased from Wako Pure Chemical Manufacturers (Osaka,

Chapter 5
67
Japan) and used as obtained. All solutions used were prepared using ultra-pure water using a
simple UV water purifier system. Silica gel (3 μm)obtained from Chemical Evaluation and
Research Institute, Tokyo, Japan, was first dried at 120°C for 5 h before use and used as the base
material.
5.2.2 Apparatus
A capillary LC system comprised of a L.TEX-8301 micro-feeder and fitted with a 0.5mL gas-
tight syringe was used as a pump. An M435 microinjection valve (Upchurch Scientific, Oak
Harbor, WA, USA) as an injector with an injection sample volume of 0.2µL-a M435
microinjection valve, and a JASCO, Tokyo, Japan, UV detector (UV-970) fitted with a flow cell
capillary (75 µm; JASCO) were also attached. The pump flow-rate was kept at 2.5 µL min-1, and
the detector was operated at 210 nm. All the data was acquired using a CDS-Lite ver 5.0 data
processor (LAsoft, Nagareyama, Chiba, Japan). The modified silica was washed and separated
using a centrifuge (IEC610-2-020, Kubota, Tokyo, Japan).
5.2.3 Preparation of stationary phases
The AHA stationary phase was prepared following a method by previous researchers [21-23]
with slight modification. Dried porous silica gel (0.2g) was placed in the reaction reflux
equipment, and 1.2 mL dry toluene together with 0.1 mL of 3-chloropropyltrmethoxysilane were
added to the vessel. The reaction was refluxed with continuous stirring for 24 h. The reaction
was later cooled to room temperature, filtered and the obtained material was washed two times
with toluene and ethanol consequently. The obtained chloropropyl silica (ChprSil) was dried
using an oven at 65oC for 8h.The chloro group of the ChprSil was then reacted with AHA at
90oC for 24 h, and was finally washed twice with ethanol and water as shown as shown in Fig 5-
1.The obtained synthesized material was packed into the capillary column and ethanol was used
Chapter 5
68
as the propulsion solvent. Hydrochloric acid (30 mM) was passed though the packed column for
30 minutes.
The AHA stationary phase, Fig. 5-1(a), was also prepared following a method by a previous
report [24] with slight modification. Silica gel was first dried at 120° C for 5 h before use while
toluene was dried using molecular sieves 3A (1/16” pellets) for ca. 5 h, and a reflux equipment
was used as the reaction vessel. Briefly, dried porous silica gel (0.1 g), 7-aminoheptanoic acid
(0.1 g), 0.1 mL of 3-chloropropyltrimethoxysilane, ethanol (0.3ml) and water (0.5 ml) were all
mixed together in reflux equipment. The reaction was refluxed with continuous stirring for 24 h
at 90o C. The reaction was later cooled to room temperature, filtered and the obtained material
was washed three times with toluene and ethanol consequently. The obtained synthesized
material was packed into the capillary column and ethanol was used as the propulsion solvent.
Hydrochloric acid (30 mM) was passed though the packed column for 30 minutes. The prepared
column also gave satisfactory results. Moreover, another possible reaction mechanism route was
also proposed to guarantee similar results as shown inFig 5-1(b).
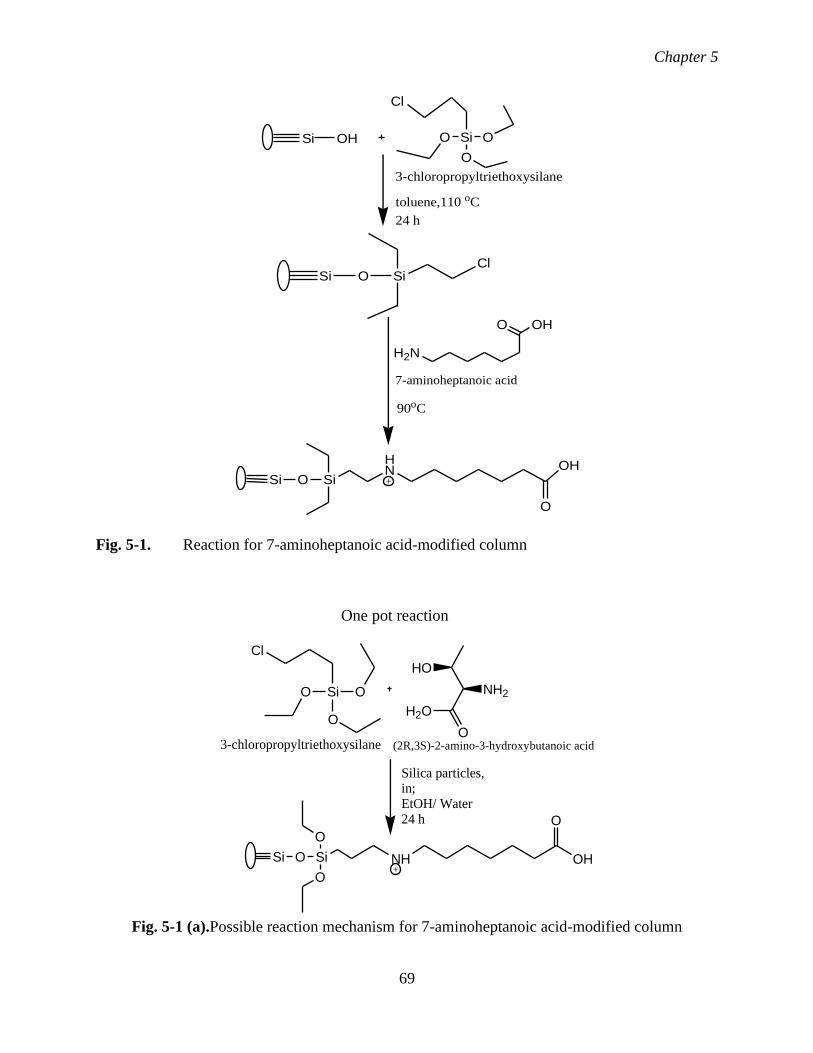
Chapter 5
69
Si SiO O
O
Cl
3-chloropropyltriethoxysilane
Si O SiCl
toluene,110 oC
24 h
Si O Si
HN
O OH
H2N
90oC
7-aminoheptanoic acid
O
OH+
OH
Fig. 5-1. Reaction for 7-aminoheptanoic acid-modified column
Silica particles,in;EtOH/ Water24 h
One pot reaction
SiO O
O
Cl
3-chloropropyltriethoxysilaneO
H2O
HO
NH2
(2R,3S)-2-amino-3-hydroxybutanoic acid
Si O Si
O
O
NH
O
OH+
Fig. 5-1 (a).Possible reaction mechanism for 7-aminoheptanoic acid-modified column
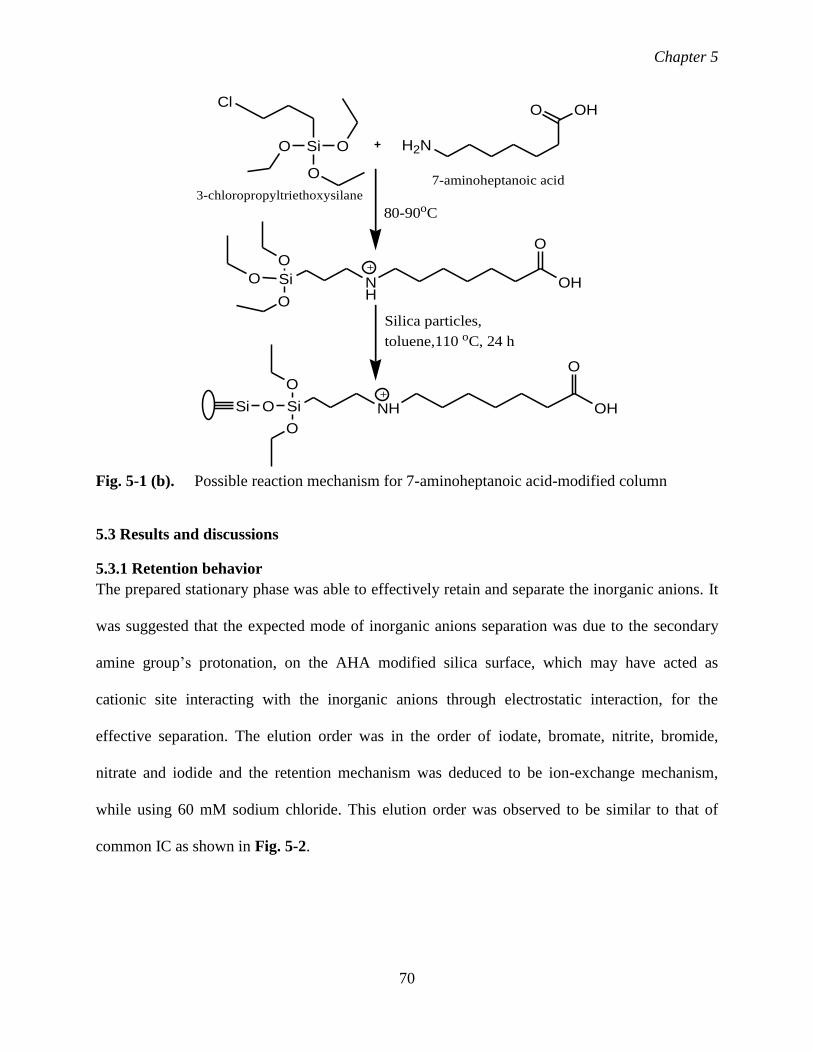
Chapter 5
70
O Si
O
O
Si O Si
O
O
Silica particles,
toluene,110 oC, 24 h
NH
NH
O
OH
SiO O
O
3-chloropropyltriethoxysilane
Cl
80-90oC
OH
O
7-aminoheptanoic acid
O OH
H2N
+
+
Fig. 5-1 (b). Possible reaction mechanism for 7-aminoheptanoic acid-modified column
5.3 Results and discussions
5.3.1 Retention behavior
The prepared stationary phase was able to effectively retain and separate the inorganic anions. It
was suggested that the expected mode of inorganic anions separation was due to the secondary
amine group’s protonation, on the AHA modified silica surface, which may have acted as
cationic site interacting with the inorganic anions through electrostatic interaction, for the
effective separation. The elution order was in the order of iodate, bromate, nitrite, bromide,
nitrate and iodide and the retention mechanism was deduced to be ion-exchange mechanism,
while using 60 mM sodium chloride. This elution order was observed to be similar to that of
common IC as shown in Fig. 5-2.

Chapter 5
71
Fig. 5-2.Separation of inorganic anions on a AHA modified silica column, (column 100 x
0.32 mm I.D), while using a sample mixture of (1) IO3-, (2) BrO3
-, (3) NO2- (4)
Br-, (5) NO3-, (6) I-, at a concentration of 1mM each and 0.5mM NO3
-, and at an
eluent’s concentration of 60 mM NaCl as the eluent, and a flow-rate of 2.5
µL/min, while using a UVdetection wavelength of 210 nm
5.3.2 The effect of eluent concentration
The six anions used in this study were observed to be affected by the salt concentration as shown
in Fig 5-3. As the NaCl concentration was increased from 20mM NaCl to 120mM NaCl, the
anions’ retention was observed to be decreased. Thus, it was understood that with an increase in
elution strength, the anions’ retention was decreased [21-23].
0 5 10 15 20 25 30 35 40 45 50
1
2
3
4
56
Time (min)
Dete
cto
r re
sponse
(µ
V)
0.05 µV abs
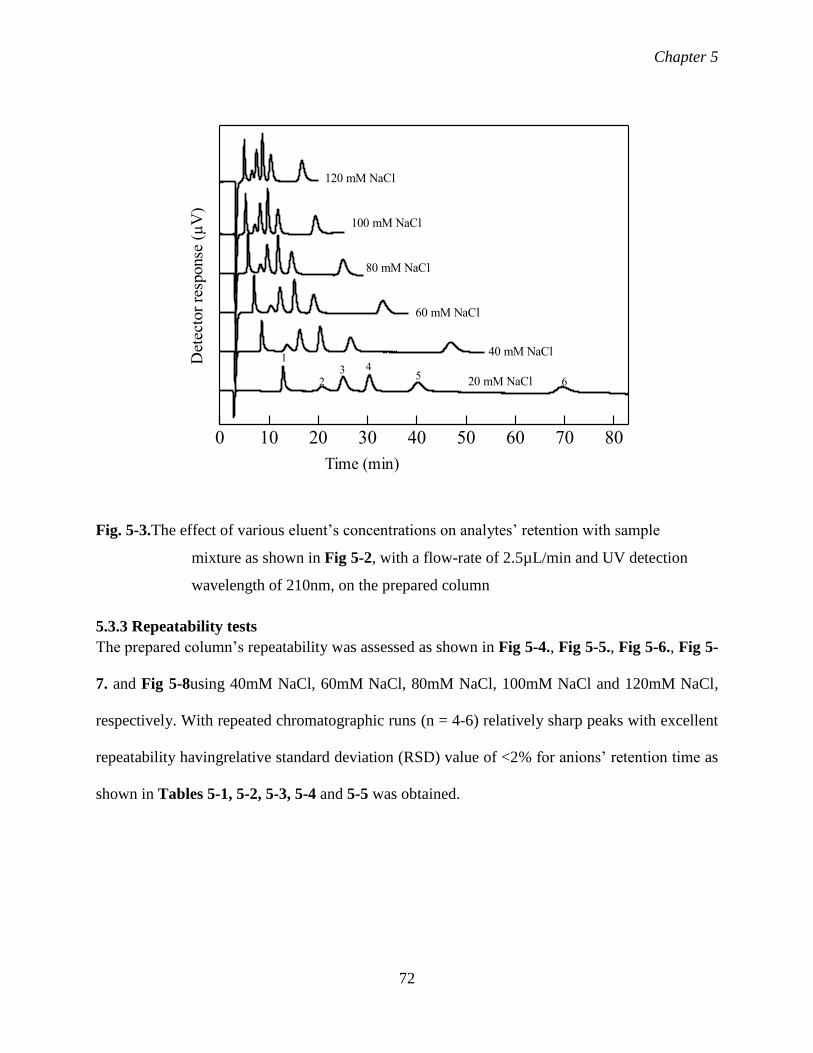
Chapter 5
72
Fig. 5-3.The effect of various eluent’s concentrations on analytes’ retention with sample
mixture as shown in Fig 5-2, with a flow-rate of 2.5µL/min and UV detection
wavelength of 210nm, on the prepared column
5.3.3 Repeatability tests
The prepared column’s repeatability was assessed as shown in Fig 5-4., Fig 5-5., Fig 5-6., Fig 5-
7. and Fig 5-8using 40mM NaCl, 60mM NaCl, 80mM NaCl, 100mM NaCl and 120mM NaCl,
respectively. With repeated chromatographic runs (n = 4-6) relatively sharp peaks with excellent
repeatability havingrelative standard deviation (RSD) value of <2% for anions’ retention time as
shown in Tables 5-1, 5-2, 5-3, 5-4 and 5-5 was obtained.
0 10 20 30 40 50 60 70 80
1
23 4
5620 mM NaCl
40 mM NaCl
60 mM NaCl
80 mM NaCl
100 mM NaCl
120 mM NaCl
Time (min)
Det
ecto
r re
sponse
(µ
V)

Chapter 5
73
Fig. 5-4.Repeatability tests for the separation of inorganic anions with sample mixture as
shown in Fig. 2.1 Eluent’s concentration used was 40mM NaCl with a flow-rate
of 2.5µL/min and at a UV detection wavelength of 210 nm
Table 5.1.RSD values of the retention time during the separation of inorganic anions on an
AHA-bonded silica while using 40 mM NaCl as eluent, and other operating
conditions as in Fig. 5-4.
Anion Average S.D RSD (%)
IO3- 8.514 0.0971 1.14
BrO3 - 13.69 0.242 1.76
Br- 16.23 0.252 1.54
NO3- 20.40 0.327 1.60
I - 26.57 0.521 1.96
SCN - 46.95 0.739 1.57
0 10 20 30 40 50 60
Time (min)
1
23 4
5 6
Dete
cto
r re
sponse
(µ
V)

Chapter 5
74
Fig. 5-5.Repeatability tests for the separation of inorganic anions using eluent’s
concentration of 60mM NaCl with sample mixture and operatingconditions as
shown in Fig. 5-1.
Table 5-2.RSD values of the retention time during separation of inorganic anions on an
AHA-bonded silica while using 60 mM NaCl as eluent, other operating conditions
as in Fig. 5-5.
Anion Average S.D RSD (%)
IO3- 6.745 0.0750 1.11
BrO3 - 10.06 0.192 1.91
Br- 11.84 0.234 1.97
NO3- 14.63 0.228 1.56
I - 26.57 0.397 2.16
SCN - 46.95 0.621 1.96
0 5 10 15 20 25 30 35 40 45 50
1
2
3 4
5 6
Time (min)
Dete
cto
r re
sponse (
µV
)
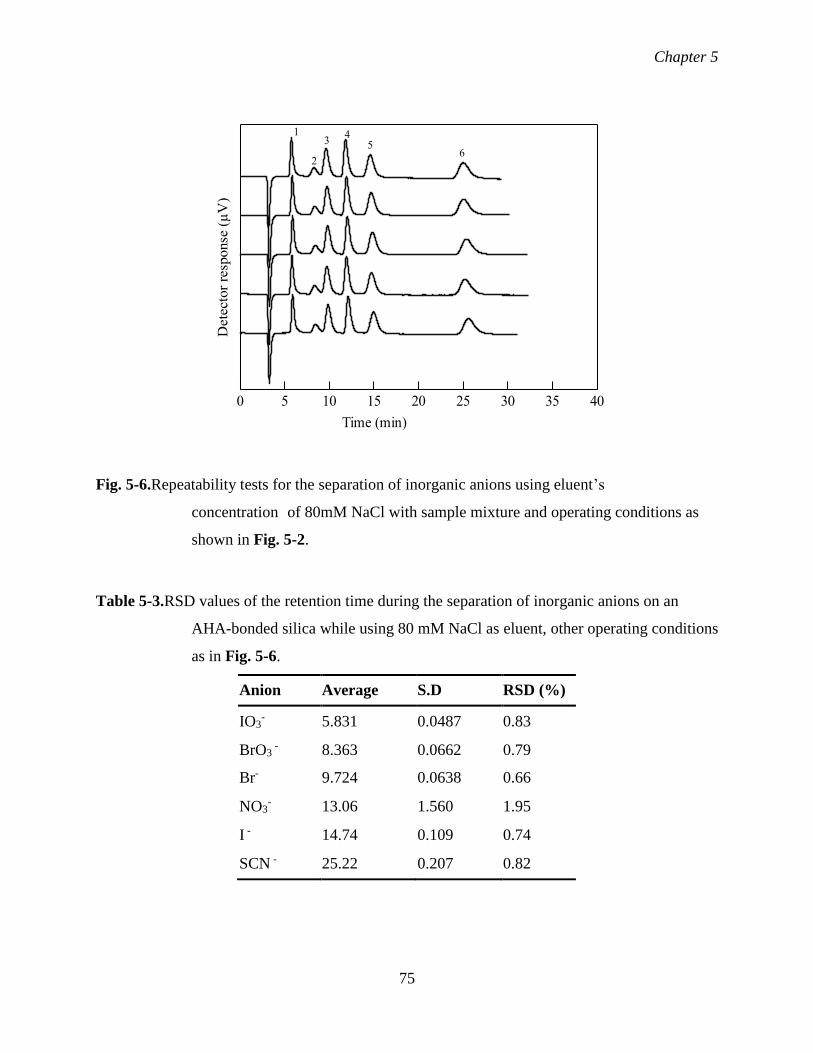
Chapter 5
75
Fig. 5-6.Repeatability tests for the separation of inorganic anions using eluent’s
concentration of 80mM NaCl with sample mixture and operating conditions as
shown in Fig. 5-2.
Table 5-3.RSD values of the retention time during the separation of inorganic anions on an
AHA-bonded silica while using 80 mM NaCl as eluent, other operating conditions
as in Fig. 5-6.
Anion Average S.D RSD (%)
IO3- 5.831 0.0487 0.83
BrO3 - 8.363 0.0662 0.79
Br- 9.724 0.0638 0.66
NO3- 13.06 1.560 1.95
I - 14.74 0.109 0.74
SCN - 25.22 0.207 0.82
0 5 10 15 20 25 30 35 40
1
2
34
56
Time (min)
Dete
cto
r re
sponse
(µ
V)

Chapter 5
76
Fig. 5-7.Repeatability tests for the separation of inorganic anions using eluent’s
concentration of 100mM NaCl with sample mixture and operating conditions as
shown in Fig. 5-2.
Table 5-4.RSD values of the retention time during the separation of inorganic anions on an
AHA-bonded silica while using 100 mM NaCl as eluent, other operating
conditions as shown in Fig. 5-7.
Anion Average S.D RSD (%)
IO3- 5.302 0.0658 1.24
BrO3 - 7.248 0.116 1.60
Br- 8.349 0.145 1.73
NO3- 10.23 0.371 3.54
I - 12.09 0.283 2.34
SCN - 20.63 0.476 2.30
0 5 10 15 20 25
1
2
3
4
5 6
Time (min)
Dete
cto
r re
sponse
(µ
V)

Chapter 5
77
Fig. 5-8.Repeatability tests for the separation of inorganic anions using eluent
concentration of 120mM NaCl with sample mixture and other operating
conditions as shown in Fig. 5-2.
Table 5-5.RSD values of the retention time during the separation of inorganic anions on an
AHA-bonded silica while using 120 mM NaCl as eluent, other operating
conditions as in Fig. 5-8.
Anion Average S.D RSD (%)
IO3- 5.061 0.0310 0.61
BrO3 - 6.604 0.0635 0.96
Br- 7.543 0.0760 1.01
NO3- 8.789 0.0910 1.04
I - 10.50 0.1086 1.03
SCN - 16.92 0.2041 1.21
0 5 10 15 20 25 30
1
2
3 45 6
Time (min)
Det
ecto
r re
sponse
(µ
V)
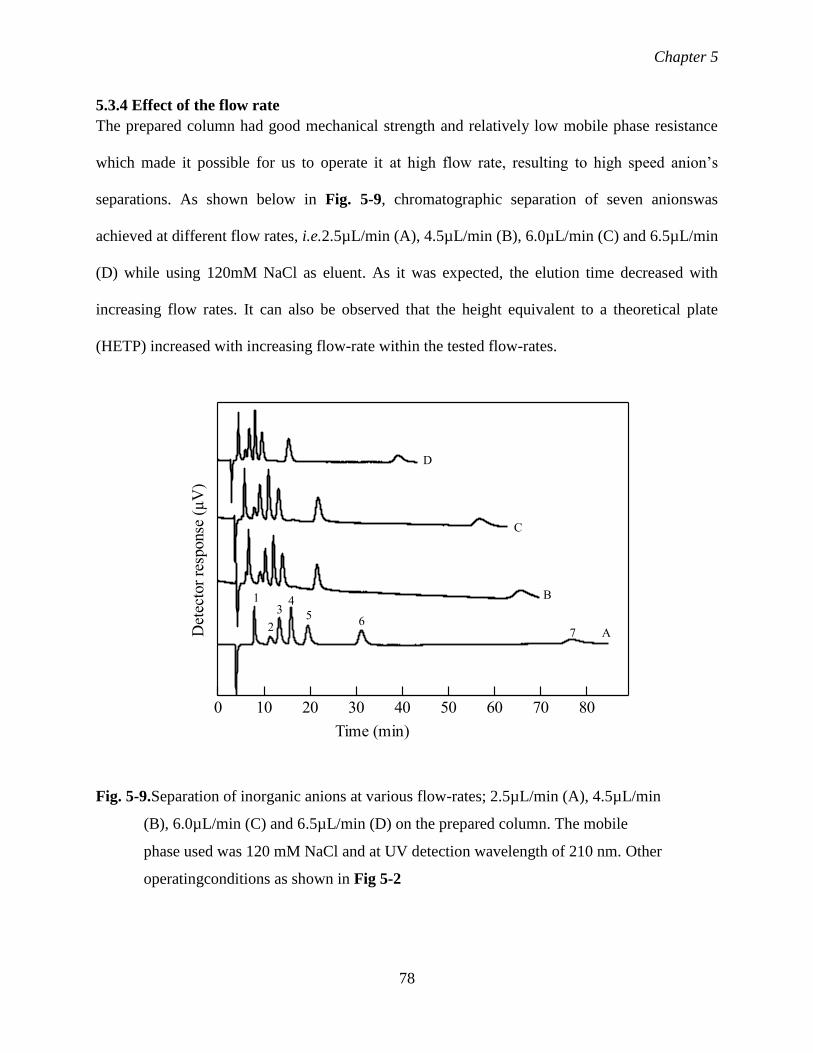
Chapter 5
78
5.3.4 Effect of the flow rate
The prepared column had good mechanical strength and relatively low mobile phase resistance
which made it possible for us to operate it at high flow rate, resulting to high speed anion’s
separations. As shown below in Fig. 5-9, chromatographic separation of seven anionswas
achieved at different flow rates, i.e.2.5µL/min (A), 4.5µL/min (B), 6.0µL/min (C) and 6.5µL/min
(D) while using 120mM NaCl as eluent. As it was expected, the elution time decreased with
increasing flow rates. It can also be observed that the height equivalent to a theoretical plate
(HETP) increased with increasing flow-rate within the tested flow-rates.
Fig. 5-9.Separation of inorganic anions at various flow-rates; 2.5µL/min (A), 4.5µL/min
(B), 6.0µL/min (C) and 6.5µL/min (D) on the prepared column. The mobile
phase used was 120 mM NaCl and at UV detection wavelength of 210 nm. Other
operatingconditions as shown in Fig 5-2
0 10 20 30 40 50 60 70 80
1
2
34
5
7
Time (min)
6A
B
C
D
Det
ecto
r re
sponse
(µ
V)

Chapter 5
79
5.3.5 Effect of pH
The effect of pH was evaluated in the retention of the inorganic anions as shown in Fig. 5-10
below. This was done using 120mM NaCl as the eluent at pH values of (a) 3.56, (b) 4.63, (c)
5.48, (d) 6.45 and (e) 7.42. The anions were observed to be more retained in the column under
acidic condition, while they were less retained under neutral condition. The elution order was
iodate, bromate, nitrite, bromide, nitrate, iodide and thiocyanate ions. This meant that the
prepared stationary phase was protonated at a lower pH, while it has no charge at a neutral or
higher pH. Thus, the prepared stationary phase worked as an anion-exchange stationary phase at
a lower pH [18, 21].
Fig.5-10.Retention of inorganic anions at various eluent pH while using 120 mM NaCl as
eluent at different concentration of (a) 3.56, (b) 4.63, (c) 5.48, (d) 6.45 and (e)
7.42, a flow rate of 4.5µL/Min and UV detection wavelength of 210 nm. Other
operating conditions as shown in Fig 5-2.
0 10 20 30 40 50 60 70 80 90
Time (min)
1
2
3 45
67
pH 3.56
pH 4.63
pH 5.48
pH 6.45
pH 7.42
Dete
cto
r re
sponse
(µ
V)

Chapter 5
80
5.3.6 Real sample application
5.3.6.1 Saliva sample analysis
Saliva sample was collected from a healthy non-smoker, which was then filtered through a 0.45
mm membrane filter prior to injection. The inorganic anions present were examined using the
prepared column while using 120mM NaCl as eluent.As shown in Fig 5-11, this sample
contained nitrite, bromide, nitrate and thiocyanate anions. The saliva sample peak’s retention
time was observed to be similar when comparing it with the standard sample.
Fig. 5-11.Separation of inorganic anions contained in saliva sample on the prepared
column.The mobile phase used was 120 mM NaCl, with flow rate of 6.5 μL/min
and other operating conditions as shown in Fig. 5-9, for both the standard sample
(A) and saliva sample (B)
5.3.6.2 Tap watersample assessment
Water sample; Gifu university laboratory tap water, was first collected and filtered through a
0.45 µm membrane filter prior to injection. The AHA column was used for the assessment this
0 5 10 15 20 25 30 35 40
B
A
1
2
3
4
5
6
7
3 47
5
Time (min)
Dete
cto
r re
sponse
(µ
V)

Chapter 5
81
water samplewhile using 120mM NaCl as eluent. Tap water was confirmed to have nitrate ions
as shown in Fig. 5-12.
Fig. 5-12.Separation of inorganic anions contained in laboratory tap water on the
prepared column, while using120 mM NaCl as eluent, a flow rate of 4.5 μL/min
and other operating conditions as shown in Fig. 5-9, for both the standard sample
(A) and laboratory tap water (B)
5.3.6.3 Sea watersample assessment
Water sample; Shinmaiko seawater was first collected and then filtered through a 0.45 µm
membrane filter prior to injection. The AHA column was used for the assessment of this water
sample while using 120mM NaCl as eluent. Shinmaiko sea waters were confirmed to contain
both the bromide and nitrate ions as shown in Fig 5-13.
0 10 20 30 40 50 60 70
1
2
3
4
5
5
6
7
Time (min)
A
BDete
cto
r re
sponse
(µ
V)

Chapter 5
82
Fig. 5-13.Separation of inorganic anions contained in laboratory tap water on the
prepared column, while using 120 mM NaCl as the mobile phase, a flow rate of
4.5 μL/min and otheroperating conditions as shown in Fig. 5-9, for both the
standard sample (A) and Shinmaiko seawater (B)
5.4 Conclusions
Stationary phases with charged or chargeable functional groups are frequently used as stationary
phase in IEC. AHA-bonded stationary phase provided the anion-exchange site which allowed us
to separate of inorganic anions and as it was expected that ion-exchange mechanism was
involved in the retention of these analyte anions. The retention time of the analyte anions was
carefully controlled by a good selection of the eluent. The eluent’s concentration greatly affected
the analyte anions’ retention on the synthesized material.
Comparison between ABA-modified silica column in chapter 4 and AHA-modified silica
columnin this chapter was done, and the analytes retention results obtained for AHA silica
0 10 20 30 40 50 60 70
1
2
3
4
56
7
Time (min)
4
5B
AD
ete
cto
r re
sponse
(µ
V)

Chapter 5
83
gelwas observed to be better in terms ofcolumn’s chemical stability and reproducibility. This was
due to the fact that AHA modified silica formed stable, homogenous, smooth surface unlike
ABA modified silica. This research work results is in line with the computation modeling of
molecular interaction by silico software by past research work [25-26]
5.5References
[1] L. W. Lim,Chromatography,36, (2015),1-12.
[2] C.G. Hovath, A. B. Preiss, S. R. Lipsky, J. Anal. Chem.,39, (1967) 1422-1428.
[3] G. Huang, Q. Lian, W. Zeng, Z. Xie, J. Electrophoresis,29, (2008),3896-3904.
[4] P. Kuban, P.K. Dasgupta, J. Sep. Sci.,27, (2004), 1441-1457.
[5] H. Small, T.S. Stevens, W.C. Bauman, Anal. Chem.,47, (1975), 1801-1809.
[6] H. Guo, C. Chu, Y. Li, B. Yang, X. Liang, Anal.Chem.,136, (2011), 5302–5307.
[7] C. Lin, Y. Yang, M. Yang, J.Chromatogr.,515,(1990),49-58.
[8] T. Takeuchi, B. Oktavia, L.W.Lim, Anal. Bioanal. Chem., 393, (2009) 1267-1272.
[9] T. Takeuchi, T. Kawasaki, L.W. Lim, Anal. Sci.,26, (2010),511-514.
[10] F. Mairizki, A. Rahman, R. Putri, R. Zein, L.W. Lim, T. Takeuchi, E. Munaf,
Am. J. Anal. Chem.,4, (2013),451-456.
[11] T. Takeuchi, B. Jiang, L.W. Lim,Anal. Bioanal.Chem.,402, (2012),551-555.
[12] N. Takayama, L.W. Lim, T. Takeuchi, Anal. Sci.,33, (2017), 619-623.
[13] A. Sedyohutomo, H. Suzuki, C. Fujimoto, Anal. Sci.,28,(2012),625-629.
[14] D.S. Risley, B.W. Pack, LC GC N. Am.,24, (2006),776-785.
[15] K. Arai, M. Mori, D. Kozaki, N. Nakatani, H. Itabashi, K. Tanaka, J. Chromatogr.A,1270,
(2012),147-152.
[16] H. Qiu, Q. Jiang, Z. Wei, X. Wang, X. Liu, S. Jiang, J. Chromatogr. A,1163,(2007), 63-69.

Chapter 5
84
[17] E. Sugrue, N. P. Nesterenko, B. Paull, J. Chromatogr. A,1075, (2005), 167-175.
[18] N. P. Nesterenko, J. Chromatogr. A, 605, (1992), 199-204.
[19] N. P. Nesterenko, I. A. Elefterov, A. D. Tarasenko, A.O. Shpigun, J. Chromatogr. A, 706,
(1995),59-68.
[20] H. Xu, Z. Xu, L. Yang, Q. J. S. Wang, J. Sep. Sci.,34, (2011), 2314-2322.
[21] M. Sun, J. Feng, C. Luo, X. Liu, S. Jiang, Talanta,105,(2013), 135-141.
[22] L. W. Lim, K. Tokunaga, T. Takeuchi, Chromatography, 35, (2014), 95-101.
[23] T. Takeuchi, K. Tokunaga, L.W. Lim, Anal. Sci., 29, (2013), 423-427.
[24] P. N. Nesterenko, P.A. Kebets, Anal. Chem., 62 (2007) 2-7.
[25] T. Hanai, Separations, 6, (2019), 1-20.
[26] T. Hanai, J. Sep. Sci., 37, (2014), 3013–3014.
Chapter 6
85
Chapter 6
Threonine-bonded silica stationary phase for capillary ion
chromatography
6.1 Introduction
Silica-based stationary phases still dominates as the best, most popular separation medium due to
their good chromatographic performance, mechanical strength and easy during preparation
process. These phases have rich silanol groups on their surfaces, which allows easy introduction
of many functionalities onto the silica gel. Moreover, the rich silanol groups on silica surface
may affect biological sample’s separation, due to their high rigidity, fast mass transfer and
resistance to organic solvents [1].
Most commonly used stationary phasescovalently bonded onto silica surface are C18-
alkyl chain, which have previously been utilized for reversed-phase separation mode [2].
Nevertheless, determination of inorganic anions is also crucial as earlier highlighted in
the previous chapters. Basically, stationary phase’ssurface have chargeable functional groups,
where the difference in electrostatic attraction between the ionic analytes and the prepared
stationary phase results to their separation, through ion exchange mechanism [3].Thus, many
researchers have been interested in developing various types of silica stationary phases for ion
chromatography (IC).
Sun and coworkers [4] effectively modified silica with benzimidazole, and the stationary
phase was evaluated for reversed-phase and anion-exchange mixed mode separation. Moreover,
imidazole [5], poly(1-allylimidazole) [6], phenyl amine [7], 8-quinolinol [8], pyridine [9],
dipyridine [10], phenylpropanolamine [11] modified silicas have been investigated as potential
mixed mode stationary phasesfor liquid chromatography (LC). The prepared columns had multi-

Chapter 6
86
interactions including π–π stacking, electrostatic forces, hydrogen bonding, hydrophobic and
anion-exchange interactions.Thus different analytes including phthalates,phenols, organic and
inorganic anions, poly aromatic hydrocarbons and anilines were effectively separated.
Nesterenko’s group also effectivelyprepared zwitternionic stationary phases with
different amino acids like valine, glutamine, asparagine, lysine and tryosine byfirst linking 3-
glycidyloxypropyltrimethoxysilane (GPTMS) on silica surface, which was then followed by an
epoxy ring attack using the targeted amino acid [12-14].
The purpose of this study was to investigate the retention of anions on a threonine
chemically bonded silica gel. A simple one-pot reaction was followed in order to effectively
synthesize the material. Selection of a suitable eluent resulted to the retention and separation of
anions and thus, it worked as the anion-exchange stationary phase.
6.2 Experimental
6.2.1 Apparatus
A capillary LC system comprised of a L.TEX-8301 micro-feeder and fitted with a 0.5mL gas-
tight syringe was used as a pump. An M435 micro-injection valve (Upchurch Scientific, Oak
Harbor, WA, USA) as an injector with an injection sample volume of 0.2µL, and a JASCO,
Tokyo, Japan, UV detector (UV-970) fitted with a capillary flow-cell (75 µm; JASCO) were also
attached. The pump flow-rate was kept at 2.5 µL min-1, and the detector was operated at 210 nm.
All the data was acquired using a CDS-Lite ver 5.0 data processor (LAsoft, Nagareyama, Chiba,
Japan). The modified silica was washed and separated using a centrifuge (IEC610-2-020, Kubota,
Tokyo, Japan).
6.2.2 Reagents
High quality reagents were used in this study. Hydrochloric acid (HCl), D-threonine and sodium
chloride were purchased from Wako Pure Chemical Manufacturers (Osaka, Japan) and used as

Chapter 6
87
obtained. All solutions used were prepared using ultra-pure water using a simple UV water
purifier system. Silica gel (3 μm) obtained from Chemical Evaluation and Research Institute,
Tokyo, Japan, was first dried at 120°C for 5 h before use.
6.2.3 Preparation of stationary phases
The threonine bonded stationary phase was prepared following a method by a previous
researcher [15] with slight modification as shown in Fig 6-1below. Briefly, dried porous silica
gel (0.2g), D-threonine (0.2 g), and toluene (1.5 mL) mixed with 0.2 mL of 3-
chloropropyltrmethoxysilane were placed in the reflux equipment. The reaction was refluxed
with continuous stirring for 24 h at 90oC. The reaction was later cooled to room temperature,
filtered and the obtained material was washed two times with toluene and ethanol consequently.
The obtained synthesized material was packed into the capillary column and ethanol was used as
the propulsion solvent. Hydrochloric acid (30 mM) was passed though the packed column for 30
min.
Si O Si
O
OO NH
Silica particles, 24 h
One pot reaction
O
HO
HO
NH2
(2R,3S)-2-amino-3-hydroxybutanoic acid/Threonine
SiO O
O
Cl
3-chloropropyltriethoxysilane
OH
O
OH
Fig. 6-1. One-pot reaction for threonine bonded silica modified column

Chapter 6
88
6.3 Results and discussions
6.3.1 Inorganic anions retention behavior
The prepared threonine-bonded stationary phase was able to effectively retain and separate the
inorganic anions. The expected mode of inorganic anions separation was due ion exchange
attributed to the secondary amine group’s protonation, on the surface of the modified silica. The
elution order was in the order of iodate, bromate, nitrite, bromide, nitrate and iodide while using
10-6 mM sodium chloride. This elution order was observed to be similar to that of common IC as
shown in Fig. 6-2.
Fig. 6-2.Separation of inorganic anions on a threonine-modified silica column(100 x
0.32 mm I.D), while using a sample mixture of (1) IO3-, (2) BrO3
-, (3) NO2-
(4) Br-, (5) NO3-, (6) I-, at a concentration of 1mM each and 0.5mM for NO3
-,
and at an eluent’s concentration of10-6 mM NaClas the eluent, and a flow-rate of
1.0 µL/min, while using a UVdetection wavelength of 210 nm
6.3.2 The effect of eluent concentration
The six anions used in this study were observed to be affected by the salt concentration as shown
in Fig 6-3. As the NaCl concentration was reduced from 10 mM NaCl to 1 mM NaCl, the anions’
0 10 20 30 40 50 60 70 80
1 2
3
45
6
Time (min)
Det
ecto
r re
sponse
(µ
V)
0.05 µV abs

Chapter 6
89
retention was observed to increase. Thus, it was understood that with an increase in elution
strength, the anions’ retention was decreased and vice versa [21-23].
Fig. 6-3.The effect of various eluent’s concentrations on analytes’ retention with sample
mixture as shown in Fig 6-2, with a flow rate of 1.0 µL/min and UV detection
wavelength of 210nm, on the prepared column
6.3.3 Repeatability tests
The prepared column’s repeatability was assessed as shown in Fig 6-4, Fig 6-5 and Fig 6-6while
using 1 mM NaCl, 10-4mM NaCl and 10-6mM NaCl respectively. With repeated
chromatographic runs of n = 3, 4 or 5, relatively sharp peaks with relatively good repeatability
was achieved, however, there was an observed room for column’s improvement.
0 4 8 12 16
1.2
3 4
5
6
Dete
cto
r re
sponse
(µ
V)
Time (min)
1 mM NaCl
10 mM NaCl
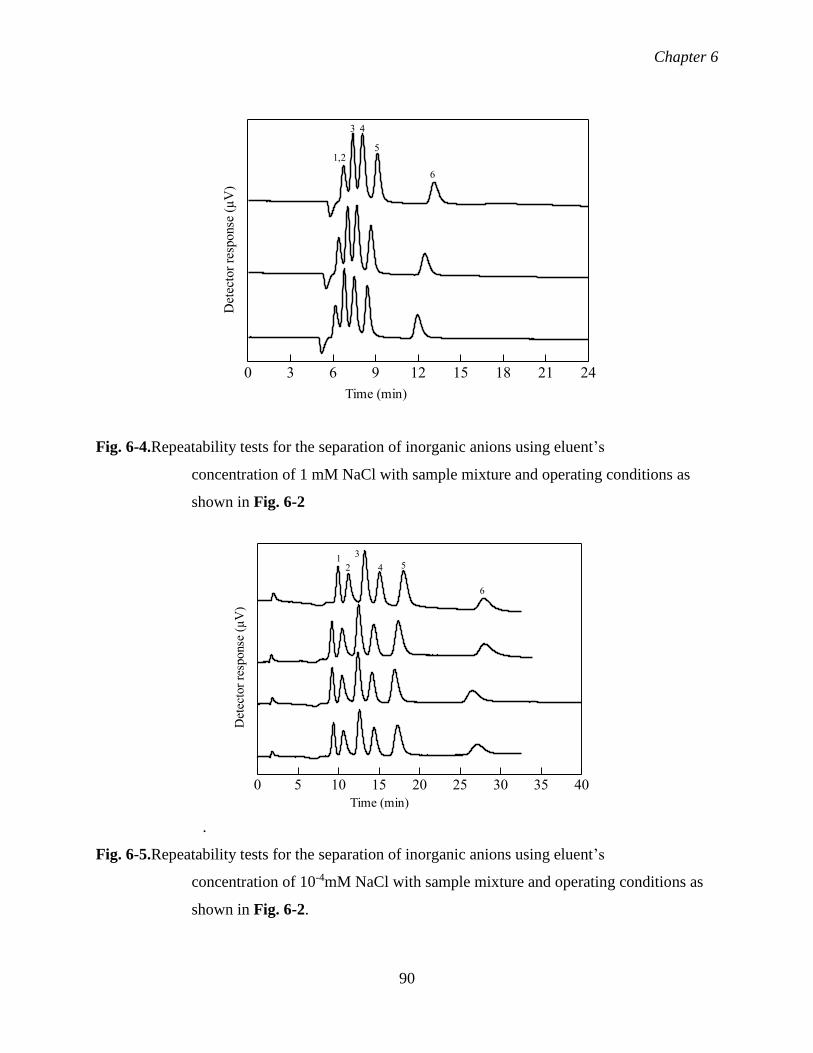
Chapter 6
90
Fig. 6-4.Repeatability tests for the separation of inorganic anions using eluent’s
concentration of 1 mM NaCl with sample mixture and operating conditions as
shown in Fig. 6-2
.
Fig. 6-5.Repeatability tests for the separation of inorganic anions using eluent’s
concentration of 10-4mM NaCl with sample mixture and operating conditions as
shown in Fig. 6-2.
0 3 6 9 12 15 18 21 24
Det
ecto
r re
sponse
(µ
V)
Time (min)
1,25
3 4
6
0 5 10 15 20 25 30 35 40
Time (min)
12
3
4 5
6
Det
ecto
r re
sponse
(µ
V)

Chapter 6
91
Fig. 6-6.Repeatability tests for the separation of inorganic anions using eluent’s
concentration of 10-6mM NaCl with sample mixture and operating conditions as
shown in Fig. 6-2.
6.4 Conclusions
Stationary phases with charged or chargeable functional groups are frequently used as stationary
phase in IEC. Threonine-bonded stationary phase provided the anion-exchange site which
allowed us to separate of inorganic anions and as it was expected that ion exchange mechanism
was involved in the retention of these analyte anions. The retention time of the analyte anions
was carefully controlled by a good selection of the eluent. The eluent’s concentration greatly
affected the analyte anions’ retention on the synthesized material.
6.5 References
[1] Z. Guo, A. Lei, Y. Zhang, Q. Xu, X. Xue, F. Zhang, X. Liang, Chem. Commun., 1, (2007),
2491-2493.
0 10 20 30 40 50 60 70 80
1 2
3
4 5
6
Time (min)
Dete
cto
r re
sponse
(µ
V)

Chapter 6
92
[2] K. Arai, M. Mori, D. Kozaki, N. Nakatani, H. Itabashi, K. Tanaka, J. Chromatogr. A, 1270,
(2012),147-152.
[3]T. Takeuchi, B. Jiang, L.W. Lim, Anal. Bioanal.Chem.,402, (2012),551-555.
[4] M. Sun, J. Feng, C. Luo, X. Liu, S. Jiang, Talanta,105, (2013), 135-141.
[5] H. Qiu, S. Jiang, X. Liu, J. Chromatogr. A, 1103, (2006), 265–270.
[6] M. Sun, H. Qiu, L.Wang, X. Liu, S. Jiang, J. Chromatogr. A,1216, (2009),3904-3909.
[7] M. G. Kisereva, P. N. Nesterenko, J. Chromatogr. A,898, (2000), 23-34.
[8] M. M. Muenter, K. C. Strokes, R. T. Obie, J. R. Jezorek, J. Chromatogr. A.,844, (1999), 39-
51.
[9] T. Takeuchi, T. Kawasaki, L.W. Lim, Anal. Sci., 26, (2010), 511-514.
[10] M. Sun, J. Feng, S. Liu, C. Xiong, X. Liu, S. Jiang, J. Chromatogr. A.,1218, (2011), 3743-
3749.
[11] S. Wongyai, Chromatographia,38, (1994), 485-490.
[12] E. Sugrue, N. P. Nesterenko, B. Paull, J. Chromatogr. A, 1075, (2005), 167-175.
[13] N. P. Nesterenko, J. Chromatogr. A, 605, (1992), 199-204.
[14] N. P. Nesterenko, I. A. Elefterov, A. D. Tarasenko, A.O. Shpigun, J. Chromatogr. A, 706,
(1995), 59-68.
[15] P. N. Nesterenko, P.A. Kebets, Anal. Chem., 62 (2007) 2-7.

Chapter 7
93
Chapter 7
Conclusions and future perspectives
7.1 Conclusions
In chapters 2, 3, 4, 5 and 6,thestudyinvolved developing novel separation columns for the
separation of various compounds on capillary liquid chromatography. Retention behavior of
inorganic anions was investigated on these columns dynamically modified through; metal
organic framework (MOF), click reactions, 4-amino butanoic acid, 7-amino heptanoic acid and
threonine respectively as described below.
Chapter 2 presents the study on silica based chromium metal-organic framework
materials that was able to address a major problem of synthesizing a silica-chromium adsorbent
able to produce ahomogeneous surfacefor the chromatographic evaluation. The Si-Cr column
was found capable of separating mix aromatic compounds with retention time of 15 min. The
retention order was from phenol, the hydroxyl group on the phenol compound being the point of
reference, thus from less non-polar to highly non-polar compound (diethyl phthalate). However,
there was an observed peak broadening on peaks which were due to the interaction of the given
compounds (slightly polar) with the Cr open sites. Such a drawback could be fixed by
replacement of the given ligands with rigid aromatic multi dentate ligands containing both O- and
N- electron rich surfaces, so as to form stable complexes with chromium, effectively closing all
the open Cr sites.
Chapter 3, on the other hand, presents click modified silica that was first confirmed using
FT-IR spectroscopy. On bare silica modification with 3-isocyanatopropyl-triethoxysilane and
propargyl bromide, the FT-IR spectra displayed an increase of absorptions intensities at due to
C–H stretching indicating a largely ordered structure of the hydrocarbon chains. These spectral
Chapter 7
94
changes were clear proofs of a successful reaction. FT-IR spectra of the silica alkyne
groups disappeared as observed on the FT-IR spectra of the click-silica alkylazide, which
indicated that the intermediate azide group was almost exhausted in the final immobilization
procedure. The prepared click alkyl-azide silica bonded stationary phase was achieved through
the reaction of alkyne silica and azido-octadecane in presence of Cu catalyst to produce a triazole
ring. This ring could serve as ion exchange site as it is considered to be a basic aromatic
heterocycle. The ions were separated in the order of iodate, bromate, bromide, nitrate, iodide,
and thiocyanate which is a similar observation made to common IC columns.The inorganic
anions’ retention behavior was investigated under different eluent concentration. The analyte
anions retention in the column decreased with increase in sodium chloride concentration.
Chapter 4 presents a4-amino butyric acid silica packing column that could be used to
separate common anions by using sodium chloride as the eluent. It was suggested that the
expected mode of inorganic anions separation was due to the secondary amine group’s
protonation, on the modified silica surface, which may have acted as cationic site interacting
with the inorganic anions through electrostatic interaction, for the effective separation. The
elution order was in the order of iodate, bromate, nitrite, bromide, nitrate and iodide and the
retention mechanism was deduced to be ion-exchange mechanism, while using sodium chloride
as eluent. This elution order was observed to be similar to that of common IC. The anions used in
this study were observed to be affected by the salt concentration. As the NaCl concentration was
increased, the anions’ retention was observed to be decreased. Thus, it was understood that with
an increase in elution strength, the anions’ retention was decreased. The prepared column’s
repeatability was assessed with repeated chromatographic runs of n = 4, 5 or 6, where the results
had relatively sharp peaks with excellent repeatability with RSD value of 2% for anions’

Chapter 7
95
retention time was obtained. The pH of the eluent also affected the retention of the anion. The
anions were more retained in the column under acidic condition, and less retained on the
stationary phase under neutral condition.This meant that the prepared stationary was protonated
at a lower pH, while had no charge at a neutral pH. Thus, the prepared stationary phase worked
as an anion-exchange stationary phase at a lower pH.
Chapter 5 presents a7-amino heptanoic acid silica packing column that could be used to
separate common anions by using sodium chloride as the eluent. Asexpected, the mode of
inorganic anions separation was due to the secondary amine group’s protonation, on the modified
silica surface, which may have acted as cationic site interacting with the inorganic anions
through electrostatic interaction, for the effective separation. The elution order was in the order
of iodate, bromate, nitrite, bromide, nitrate and iodide and the retention mechanism was deduced
to be ion-exchange mechanism, while using sodium chloride as eluent. This elution order was
observed to be similar to that of common IC. The anions used in this study were observed to be
affected by the salt concentration. As the NaCl concentration was increased, the anions’ retention
was observed to be decreased. Thus, it was understood that with an increase in elution strength,
the anions’ retention was decreased. The prepared column’s repeatability was assessed with
repeated chromatographic runs of n = 5 or 6, where the results had relatively sharp peaks with
excellent repeatability with RSD value of 2% for anions’ retention time was obtained. The pH of
the eluent also affected the retention of the anion. The anions were more retained in the column
under acidic condition, and less retained on the stationary phase under neutral condition.This
meant that the prepared stationary was protonated at a lower pH, while had no charge at a neutral
pH. Thus, the prepared stationary phase worked as an anion-exchange stationary phase at a lower
pH.

Chapter 7
96
The same behavior was observed with threonine modified silica in chapter 6.
Comparison between the analytes retention results obtained for both the 4-amino butyric
acid modified and 7-amino heptanoic acid silica gel, both the chemical stability and the
reproducibility of 7-amino heptanoic acid modified silica was better than 4-amino butyric acid.
This can be explained by the fact that 7-amino heptanoic acid modified silica formed stable,
homogenous, smooth surface unlike 4-amino butyric acid modified silica. This research work
results are in line with the computation modeling of molecular interaction, i.e. molecular
simulations usingSilico analysis by past researcher [1-3]. In his research work, Silico software
was used to demonstrate three dimensional chemical structure models between analytes and
stationary phase’s molecular interaction. This further assisted in understanding the quantitative
interactions involved.
7.2 Future perspective
For the future developments of the current studies, silica-based chromium metal-organic
framework materials can be applied to the separation of complicated mixtures of polar and non-
polar compounds since a large number of functional groups are present within the surface.
Amino acid modified columns on the other hand, should be applied to ion exchange
chromatography, which leads to low backpressure and rapid sample analysis [1-2].
Simulation softwares like Chrom X or ChromSword, amongst others can be used for the
development of model based processes, which can work hand in hand with laboratory
experimental work. This can be done through importing liquid chromatogram UV signals into
this Silico software for calibration of models and simulation of any further laboratory
experiment.Thus, they can assist in saving time and laboratory reagents and also inavoiding
tedious unsuccessful experiments [3-4].

Chapter 7
97
7.3 References
[1] N. P. Nesterenko, J. Chromatogr. A, 605, (1992), 199-204.
[2] N. P. Nesterenko, I. A. Elefterov, A. D. Tarasenko, A.O. Shpigun, J. Chromatogr. A,706,
(1995),59-68.
[3] T. Hanai, Separations,6, (2019), 2.
[4] T. Hanai, J. Sep. Sci.,37, (2014), 3013–3014

List of figures
98
List of figures
Chapter 1
Fig. 1-1. The capillary liquid chromatography system
Chapter 2
Fig. 2-1. The proposed reaction mechanism
Fig. 2-2. SEM images of commercial silica (Si),A (i) magnification 1000x and A(ii)
magnification 2000x, and synthesized silica (Si-Cr), B(i) magnification 1000X
and B(ii) magnification 2000x, respectively
Fig. 2-3. FT-IR spectra for both the commercial silica (Si) (a) and synthesized silica (Si-Cr)
(b)
Fig. 2-4. FT-IR spectra for both the commercial silica (a) and synthesized silica (Si-Cr-
BA)(Si) (b)
Fig. 2-5. Nitrogen adsorption isotherm at 77K with correlation coefficient of 0.998 (A)
indicative of type IV in BET classification (B)
Fig. 2-6. Separation of mixed aromatic compounds; (1) phenol, (2) nitrobenzene, (3)
acetophenone, (4) dimethyl phthalate and (5) diethyl phthalateon the
synthesized silica (Si-Cr) column. Hexane: chloroform (90:10, v/v) was used
as the mobile phase, with a flow rate of 2.0µLmin-1, an injection volume of
0.2 µL and at UV detection of 280 nm
Fig. 2-7 (A). Separation of alkyl benzene on (A) commercial silica and (B) synthesized silica
(Si-Cr) packed in a capillary column of 100 ×0.32mm i.d while using hexane-
chloroform (94:6, v/v) as the mobile phase, a flow rate of 2.0µLmin-1, an
injection volume of0.2 µL and UV detection at 254nm
Fig. 2-7 (B). Separation of alkyl benzene; (1) benzene (2) toluene, (3) hexyl benzene, (4) octyl
benzene (5) dodecyl benzene on (A) commercial silica and (B) synthesized silica
(Si-Cr). Operating conditionsas shown in Fig 5-6 (A)
Fig. 2.8. Separation of parabens;(1) 4-hydroxy benzoic acid, (2) methyl paraben, (3) ethyl
paraben and (4) butyl paraben on (a) commercial silica (Si) and (b) synthesized

List of figures
99
silica (Si-Cr) packed in a 100 ×0.32mm i.d. capillary column. Hexane-
chloroform (98:2, v/v) was used as the mobile phase, with a flow rate of 2.0
µLmin-1, injection volume of0.2µL and UV detection at 280nm
Fig. 2.9. Separation of parabens on a commercial bare silica (Si) and (c) synthesized silica
Si-Cr-BA.Mobile phase used was 45%, 55% and 80% MeOHwith a flow rate
of 2.0µLmin-1, injection volume of 0.2µL and UV detection at 280nm
Fig. 2-1. FT-IR spectra for both the synthesized silica (Si-Cr-BA) (e) and used column (Si-
Cr-BA) (d)
Chapter 3
Fig. 3-1. Scheme for the expected reactions
Fig 3-2. FT-IR characterization for bare silica (a), intermediate silica (b) and clicked silica
(c) samples
Fig 3-3. Separation of inorganic anions on aclick alkyl-azide silica bonded stationary
phase column 100 x 0.32 mm I.D, while using 100 mM NaCl as eluent, a flow-
rate of 1.5μL min-1 and UV wavelengthdetection at 210 nm. Analytes: 1= IO3-,
2= BrO3 -, 3= Br-, 5= I -, 6= SCN -, 1 mM each while 4 = NO3
- (0.5 mM)
Fig 3-4. Separation of inorganic anions using different eluent concentration on click alkyl-
azide silica bonded stationary phase column, column 100 x 0.32 mm I.D, and
other operating conditions as shown in Fig. 3-3
Fig 3-5. Repeatability assessment during the separation of inorganic anions on a click
alkyl-azide silica bonded stationary phase column, and other operating conditions
as shown in Fig. 3-3
Fig 3-6. Real sample column application for tap water samples analysis usingthe
click alkyl-azide silica bonded stationary phase column, and other operating
conditions as in Fig. 3-3
Fig 3-7. Real sample column application for saliva sample analysis usingthe
click alkyl-azide silica bonded stationary phase column, and other operating
conditions as in Fig. 3-3
Chapter 4
Fig. 4-1. The proposed reaction mechanism for 4-aminobutanoic acid-modified column

List of figures
100
Fig. 4-1 (a). Possible reaction mechanism for 4-aminobutanoic acid-modified column
Fig. 4-1 (b). Possible reaction mechanism for 4-aminobutanoic acid-modified column
Fig. 4-2. Separation of inorganic anions on an ABA modified silica column, (column 100 x
0.32 mm I.D), while using sample mixture of (1) IO3-, (2) BrO3
-, (3) Br-, (4) NO3-
, (5) I-, and (6) SCN-at a concentration of 1mM each and 0.5mM NO3-, an
eluent’s concentration of 80 mM NaCl in 0.5 mM HClas the eluent, and at a
flow rate of 1.0 µL/min, while using UV wavelength of 210 nm
Fig.4-3. Separation of inorganic anions using different eluent concentration on an ABA-
bonded silica, and other operating conditions as shown in Fig. 4-2
Fig.4-4. Repeatability assessment during the separation of inorganic anions on a ABA-
bonded silica, while using 40 mM NaCl + 0.5 mM HCl as eluent, and operating
conditions as in Fig. 4-2
Fig.4-5. Repeatability assessment during the separation of inorganic anions on an ABA-
bonded silica, while using 60 mM NaCl + 0.5 mM HCl as eluent, and other
operating conditions as shown in Fig. 4-2
Fig.4-6. Repeatability assessment during the separation of inorganic anions on an ABA-
bonded silica, column 100 x 0.32 mm I.D, while using 80 mM NaCl + 0.5 mM
HCl as eluent, operating conditions as in Fig. 4-2
Fig.4-7. Evaluation of inorganic anions at different eluent cationson an ABA-bonded
silica, other operating conditions as shown in Fig. 4-2
Fig.4-8. Evaluation of inorganic anions at various eluent pH on an ABA-bonded silica
while using 40 mM NaCl + 0.5 mM HCl as eluent, other operating conditions as
in Fig. 4-2
Fig.4-9. Evaluation of inorganic anions in laboratory tap water on an ABA-bonded silica
while using 120 mM NaCl + 0.5 mM HCl as eluent, other operating conditions as
shown in Fig. 4-2
Fig.4-10. Evaluation of inorganic anions in Central Japan Airport water on an ABA-bonded
silica while using 120 mM NaCl + 0.5 mM HCl as eluent, other operating
conditions as shown in Fig. 4-2

List of figures
101
Fig.4-11. Evaluation of inorganic anions in Shinmaiko sea water on an ABA-bonded silica
while using 120 mM NaCl + 0.5 mM HCl as eluent, other operating conditions as
shown in Fig. 4-2
Chapter 5
Fig. 5-1.Reaction for 4-aminoheptanoic acid-modified column
Fig. 5-1 (a). Possible reaction mechanism for 7-aminoheptanoic acid-modified column
Fig. 5-1 (b). Possible reaction mechanism for 7-aminoheptanoic acid-modified column
Fig. 5-2. Separation of inorganic anions on a AHA modified silica column, (column 100 x
0.32 mm I.D), while using sample mixture of (1) IO3-, (2) BrO3
-, (3) NO2- (4) Br-,
(5) NO3-, (6) I-, at a concentration of 1mM each and 0.5mM NO3
-, and at an
eluent’s concentration of 60 mM NaCl as the eluent, and a flow rate of
2.5µL/min, while using a UVdetection wavelength of 210 nm
Fig. 5-3. The effect of various concentrations on analytes’ retention with sample mixture as
shown in Fig 5-2, with a flow rate of 2.5µL/min and UV detection wavelength of
210nm, on the prepared column
Fig. 5-4. Repeatability tests for the separation of inorganic anions with sample mixture as
shown in Fig. 2.1. Eluent’s concentration used was 40mM NaCl with a flow rate
of 2.5µl/min and at a UV detection wavelength of 210 nm
Fig. 5-5. Repeatability tests for the separation of inorganic anions using eluent’s
concentration of 60mM NaCl with sample mixture and operating conditions as
shown in Fig. 2-1
Fig. 5-6. Repeatability tests for the separation of inorganic anions using eluent’s
concentration of 80mM NaCl with sample mixture and operating conditions as
shown in Fig. 5-2
Fig. 5-7. Repeatability tests for the separation of inorganic anions using eluent’s
concentration of 100mM NaCl with sample mixture and operating conditions as
shown in Fig. 5-2
Fig. 5-8. Repeatability tests for the separation of inorganic anions using eluent
concentration of 120mM NaCl with sample mixture and other operating
conditions as shown in Fig. 5-2

List of figures
102
Fig. 5-9. Separation of inorganic anions at various flow rates; 2.5µL/min (A), 4.5µL/min
(B), 6.0µL/min (C) and 6.5µL/min (D) on the prepared column. The mobile
phase used was 120 mM NaCland at UVdetection wavelength of 210 nm.
Analytesused were, iodate (1), bromide (4), iodide (6), thiocyanate (7), with each
at a concentration of 1 mM and 0.5mM nitrate (5), and an injection volume of
0.2 μL
Fig.5-10. Retention of inorganic anions at various eluent pH while using 120 mM NaCl as
eluent, a flow rate of 4.5µL/min and UV detection wavelength of 210 nm.
Other operating conditions as shown in Fig 5-2
Fig. 5-11. Separation of inorganic anions contained in saliva sample on the prepared
column.The mobile phase used was120 mM NaCl, with flow rate of 6.5 μL/min
and other operating conditions as shown in Fig. 5-9, for both the standard sample
(A) and saliva sample (B)
Fig. 5-12. Separation of inorganic anions contained in laboratory tap water on the
prepared column, while using120 mM NaCl as eluent, a flow rate of 4.5 μL/min
and other operating conditions as shown in Fig. 5-9, for both the standard sample
(A) and laboratory tap water (B)
Fig. 5-13. Separation of inorganic anions contained in laboratory tap water on the
prepared column, while using 120 mM NaCl as the mobile phase, and other
operating conditions as shown in Fig. 5-9
Chapter 6
Fig. 6-1.One-pot reaction for threonine bonded silica modified column
Fig. 6-2. Separation of inorganic anions on a threonine modified silica column, (column
100 x 0.32 mm I.D), while using a sample mixture of (1) IO3-, (2) BrO3
-, (3) NO2-
(4) Br-, (5) NO3-, (6) I-, at a concentration of 1mM each and 0.5mM NO3
-, and at
an eluent’s concentration of10-6 mM as the eluent, and a flow rate of 1.0
µL/min, while using a UVdetection wavelength of 210 nm
Fig. 6-3. The effect of various eluent’s concentrations on analytes’ retention with sample
mixture as shown in Fig 6-2, with a flow rate of 1.0 µL/min and UV detection
wavelength of 210nm, on the prepared column

List of figures
103
Fig. 6-4. Repeatability tests for the separation of inorganic anions using eluent’s
concentration of 1 mM NaCl with sample mixture and operating conditions as
shown in Fig. 6-2
Fig. 6-5. Repeatability tests for the separation of inorganic anions using eluent’s
concentration of 10-4mM NaCl with sample mixture and operating conditions as
shown in Fig. 6-2
Fig. 6-6. Repeatability tests for the separation of inorganic anions using eluent’s
concentration of 10-6 mM NaCl with sample mixture and operating conditions as
shown in Fig. 6-2

List of tables
104
List of tables
Chapter 1
Table 1-10. Classification of chromatography
Table 1-2. Development of capillary LC
Chapter 2
Table 2-1. Elemental analysis for both the commercial silica (Si) and synthesized silica (Si-
Cr)
Table 2-2. Elemental analysis for both the commercial silica (Si) and synthesized silica (Si-
Cr-BA)
Table 2-3.Assignment of the FT-IR absorption bands for both the commercial silica (Si) and
synthesized silica (Si- Cr)
Table 2-4. Assignment of the FT-IR absorption bands for both the commercial silica (Si) and
synthesized silica (Si- Cr-BA)
Chapter 3
Table 3-1. Assignment of the FT-IR absorption bands for bare silica, intermediate silica and
clicked modified silica
Table 3-2. Elemental analysis of both bare and modified silica samples
Chapter 4
Table 4-1. RSD values of the retention time duringseparation of inorganic anions on an
ABA-bonded silica while using 40 mM NaCl + 0.5 mM HCl as eluent, other
operating conditions as in Fig. 4-4
Table 4-2. RSD values of the retention time duringseparation of inorganic anions on an
ABA-bonded silica while using 40 mM NaCl + 0.5 mM HCl as eluent, other
operating conditions as in Fig. 4-5

List of tables
105
Table 4-3. RSD values of the retention time duringseparation of inorganic anions on an
ABA-bonded silica while using 80 mM NaCl + 0.5 mM HCl as eluent, and other
operating conditions as in Fig. 4-6
Chapter 5
Table 5.1. RSD values of the retention time during the separation of inorganic anions on an
AHA-bonded silica while using 40 mM NaCl as eluent, and other operating
conditions as in Fig. 5-4
Table 5-2. RSD values of the of the retention time during the separation of inorganic anions
on an AHA-bonded silica while using 60 mM NaCl as eluent, and other operating
conditions as in Fig. 5-5
Table 5-3. RSD values of the of the retention time during the separation of inorganic anions
on an AHA-bonded silica while using 80 mM NaCl as eluent, other operating
conditions as in Fig. 5-6
Table 5-4. RSD values of the of the retention time during separation of inorganic anions on
an AHA-bonded silica while using 100 mM NaCl as eluent, and other operating
conditions as in Fig. 5-7
Table 5-5. RSD values of the retention time during separation of inorganic anions on an
AHA-bonded silica while using 120 mM NaCl as eluent, operating conditions as
in Fig. 5-8

List of presentations
106
List of presentations
1. Esther Wamaitha Maina, Lee Wah Lim, Toyohide Takeuchi
‘‘Development of a Novel Inorganic Material for Chromatographic Separation’’
The 36thTakayama forum which was held in Takayama City library, Japan, on the 29th -
30thAugust, 2017 (Poster Presentation)
2. Esther Wamaitha Maina, Lee Wah Lim, Toyohide Takeuchi
‘‘Development of Silica Based Chromium Metal-Organic Framework Materials for
Chromatographic Separations’’, the 14th Asian Conference on Analytical Sciences
Symposium, which was held in Jakarta Conventional Center, Jakarta, Indonesia, on the
4th-6thApril, 2018(Oral Presentation)
3. Esther Wamaitha Maina, Lee Wah Lim, Toyohide Takeuchi
‘‘Development of Silica-Based Materials for Chromatographic Separations’’, an
international conference held by the 6th Asian Network for Natural and Unnatural
Materials (ANNUM VI), at Gifu Satellite Campus, Gifu, Japan, on the 27th -28th July,
2018(Poster Presentation) [Best presentation award]
4. Esther Wamaitha Maina, Lee Wah Lim, Toyohide Takeuchi
‘‘Development of Chromium-Silica Hybrid Materials for Chromatographic Separations’’,
an international conference by The Society for Chromatographic Sciences, held in
Toyohashi, Japan, on the 7th -9thNovember, 2018 (Poster Presentation)
List of presentations
107
5. Esther Wamaitha Maina, Lee Wah Lim, Toyohide Takeuchi
‘‘Amino Acid-bonded Silica for Capillary Ion Chromatography’’,The 10th Forum on
studies of Environmental and Public Health Issues in Asian Mega-citieswhich was held
in No. 1 Meeting room, 2nd floor, Faculty of Engineering, Gifu University, on the 11th-
15thDecember, 2019 (Poster Presentation)

Curriculum vitae
108
Curriculum vitae
2007-2011 : Bachelors Degree in Industrial Chemistry, at the Department of Chemistry in
Jomo Kenyatta University of Agriculture and Technology, Nairobi,Kenya
Feb-April 2010 : Bachelors Degree Internship Program, at International Center of Insect
Physiology and Ecology (ICIPE), Nairobi,Kenya
2011-2012 : Production assistant Chemistry Production Center, Jomo Kenyatta University
of Agriculture and Technology, Nairobi, Kenya
2012-2013 : Production assistant at at Alkhemy Brand Limited, Nairobi,Kenya
2013-2016 : Masters in Chemistry at the Department of Chemistry, Jomo Kenyatta University
of Agriculture and Technology, Nairobi,Kenya
2017-2019 : Teaching Assistant atMaterial Engineering Department, Gifu University, Gifu,
Japan
2017-2020 : Doctoral degree at the Material Engineering Divisions, Graduate School of
Engineering, Gifu University, Gifu, Japan

Acknowledgements
109
Acknowledgments
Praise and honor to the Almighty God, my Father, for His mercies, kindness and love
throughout my entire life. Thank You.
This PhD project was also made possible by the kind support from JASSO Scholarship and
Gifu University, Gifu, Japan. This work would also not have been possible without the kind
support from the following people;
First of all, I would like to express my sincere gratitude to my academic advisors;Professor
Toyohide Takeuchi and ProfessorLee Wah Lim, who always gave useful insightsand feedbacks
throughout the entire doctorate program.Your patience, motivation and tremendous knowledge
became a stepping stone to the completion of this program, and of course,I became a better
scientist and chemist.
I would also wish to convey my deepest gratitude and appreciation to Professor Minoru Sasaki,
in the Mechanical Engineering Department for introducing me to Gifu University.
Many thanks goto all themembers of Takeuchi laboratory for their wonderful friendship and
support.
Last but certainly not least, I would like to thank; my parents, Mr.and Mrs.Maina, my dearest
sister Carol, my mother in law, Mrs. Njoroge,my beloved husband Paul, for their constant
Acknowledgements
110
encouragements and outstanding support. Tothe entire extended family, thank you so much for
your continued moral support, great patience and unconditional love throughout the entire period.
Japan, March 2020
Maina Esther Wamaitha