TITLE ARIAL ITALIC 36PT CAPS LIGHT GREY - Swedbanki/@sc/@all/@lci/documents/... · Q4 2012 Q1 2013...
23
EMGS ASA Svein Knudsen, CFO 21 March 2013
Transcript of TITLE ARIAL ITALIC 36PT CAPS LIGHT GREY - Swedbanki/@sc/@all/@lci/documents/... · Q4 2012 Q1 2013...

EMGS ASA
Svein Knudsen, CFO 21 March 2013

DISCLAIMER
This presentation includes and is based, inter alia, on forward-looking information and statements that are subject to risks and uncertainties that could cause actual results to differ. Such forward-looking information and statements are based on current expectations, estimates and projections about global economic conditions, the economic conditions of the regions and industries that are major markets for Electromagnetic Geoservices ASA (EMGS) and its subsidiaries. These expectations, estimates and projections are generally identifiable by statements containing words such as "expects", "believes", "estimates" or similar expressions. Important factors that could cause actual results to differ materially from those expectations include, among others, economic and market conditions in the geographic areas and industries that are or will be major markets for the EMGS’s businesses, oil prices, market acceptance of new products and services, changes in governmental regulations, interest rates, fluctuations in currency exchange rates and such other factors as may be discussed from time to time. Although Electromagnetic Geoservices ASA believes that its expectations and the information in this presentation were based upon reasonable assumptions at the time when they were made, it can give no assurance that those expectations will be achieved or that the actual results will be as set out in this presentation. Electromagnetic Geoservices ASA nor any other company within the EMGS Group is making any representation or warranty, expressed or implied, as to the accuracy, reliability or completeness of the information in the presentation, and neither Electromagnetic Geoservices ASA, any other company within the EMGS Group nor any of their directors, officers or employees will have any liability to you or any other persons resulting from your use of the information in the presentation. Electromagnetic Geoservices ASA undertakes no obligation to publicly update or revise any forward-looking information or statements in the presentation.
EMGS IN BRIEF
• Pioneered the EM industry
• Technology & market leader
• Delivered >650 surveys
• 300 employees
• Worldwide experience
• Efficient & stable operations
• Listed on OSE March 2007
• 2012 revenues: USD 201 million
• 2012 EBITDA: USD 56 million

MEASURING RESISTIVITY
Water-bearing
sediments:
1 - 2 Ωm
Low resistivity
Hydrocarbon
reservoirs:
10 - 100 Ωm
High resistivity
Hydrocarbon
reservoirs display
high resistivity
10 4
10 10 0
10 2
10 3
10 1
10 10 10 10 10 10
Well log resistivity [ m] -1

THE 3D EM METHOD
Source towed above a grid
of receivers
Receivers deployed in a predetermined grid
on the sea floor
3D EM data indicates oil reserves (high
resistivity matches seismic anomaly)

WORLDWIDE EXPERIENCE AND PRESENCE
Include PNG
Survey water depths from ~ 30 to 3500 metres in mature and frontier basins worldwide

3D EM IN THE EXPLORATION & PRODUCTION (E&P) WORKFLOW

EM IN THE E&P WORKFLOW –
PORTFOLIO OPTIMIZATION - MEXICO
• 2010 - 2012
• >12,000 km2
• 35 deep-water
prospects
Calibration
Prediction
Generation
• EM prediction
success rate:
4 out of 4 wells
Data courtesy of PEMEX
Ref : Escalera et al : The Road Ahead : SEG , Las Vegas 2012
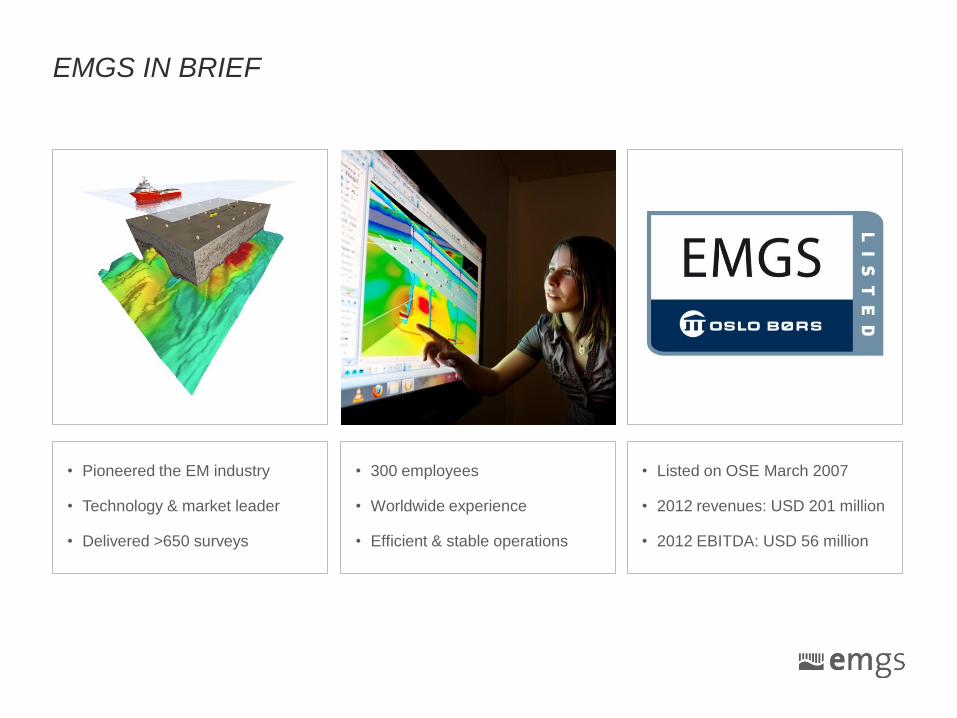
REGIONAL EXPLORATION
BARENTS SEA MULTICLIENT 3D EM
2008 – 2012
24,000 km2
Apparent
anisotropy
6.0
5.0
4.0
3.0
2.0
1.0
7.0

2013 BARENTS SEA MULTI-CLIENT 3D EM PROGRAM
Area A: Fingerdjupet - Hoop
Area C: Western Barents
Area B: South Eastern Barents
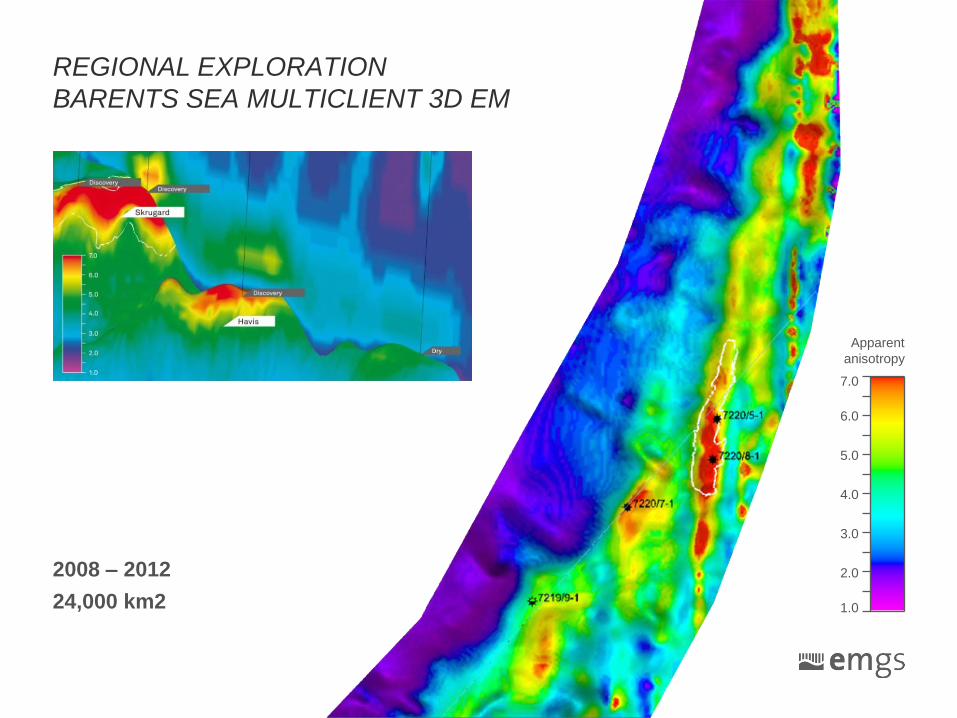
3D EM IN SUB-BASALT EXPLORATION
• Preliminary 3D CSEM and MT inversion results
• Mapping basalt distribution and thickness
• EMGS responses match well log results
• Confirms potential in sub-basalt exploration
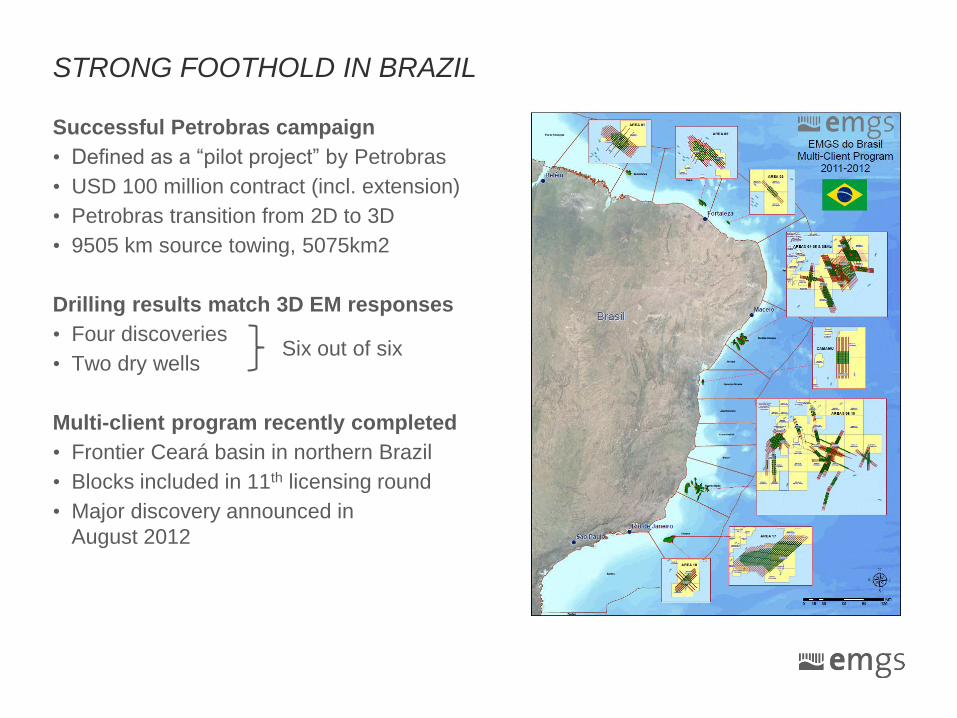
STRONG FOOTHOLD IN BRAZIL
Successful Petrobras campaign
• Defined as a “pilot project” by Petrobras
• USD 100 million contract (incl. extension)
• Petrobras transition from 2D to 3D
• 9505 km source towing, 5075km2
Drilling results match 3D EM responses
• Four discoveries
• Two dry wells
Multi-client program recently completed
• Frontier Ceará basin in northern Brazil
• Blocks included in 11th licensing round
• Major discovery announced in
August 2012
Six out of six

NEW MULTI-CLIENT PROGRAM: FOZ DO AMAZONAS BASIN, BRAZIL
Highly prospective equatorial margin
• Zaedyus discovery in French Guiana
• Petrobras’s Pecém discovery in the
Ceará basin
• Analogous discoveries in the West
African equatorial margin
Collaboration with Spectrum
• Combining 2D seismic and 3D EM
• Early stage exploration in a frontier basin
• Improved imaging and prospecting
• Spectrum has 21,000 km multi-client 2D
seismic
• EMGS shortly commencing multi-client
3D EM survey covering 8000 km2

Q4 AND FULL YEAR 2012 HIGHLIGHTS

HIGHLIGHTS
Q4 financial results
• Revenues of USD 45.0 million
• EBITDA of USD 10.1 million
Full-year 2012 financial results
• Revenues of USD 200.8 million
• EBITDA of USD 55.9 million
Key investments made in 2012
• Proof of concept studies
• New acquisition technology
• Expanding multi-client data library
Market and outlook 2013
• New market segments
• Visibility improving
• Expect 2013 revenues of USD 210 – 230 million
0
50
100
150
200
250
2008 2009 2010 2011 2012
Revenues per year (USD million)
-60
-40
-20
0
20
40
60
80
2008 2009 2010 2011 2012
EBITDA per year (USD million)
28% 25%
16%
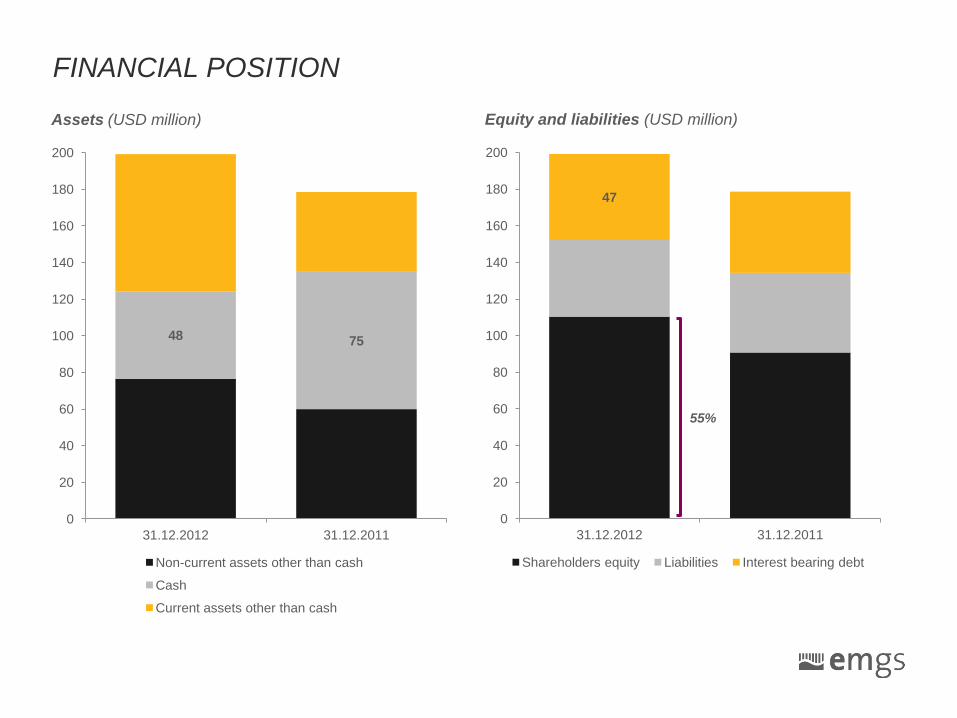
FINANCIAL POSITION
Equity and liabilities (USD million)
48 75
0
20
40
60
80
100
120
140
160
180
200
31.12.2012 31.12.2011
Non-current assets other than cash
Cash
Current assets other than cash
Assets (USD million)
47
0
20
40
60
80
100
120
140
160
180
200
31.12.2012 31.12.2011
Shareholders equity Liabilities Interest bearing debt
55%

MARKET AND OUTLOOK
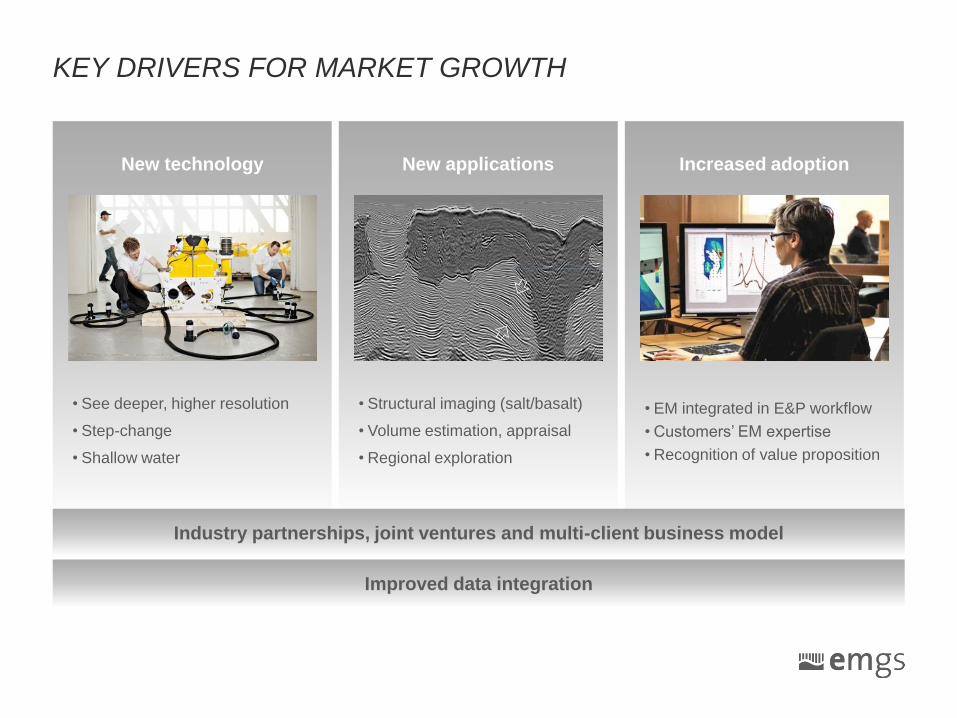
KEY DRIVERS FOR MARKET GROWTH
Increased adoption
• EM integrated in E&P workflow
• Customers’ EM expertise
• Recognition of value proposition
New applications
• Structural imaging (salt/basalt)
• Volume estimation, appraisal
• Regional exploration
New technology
• See deeper, higher resolution
• Step-change
• Shallow water
Industry partnerships, joint ventures and multi-client business model
Improved data integration
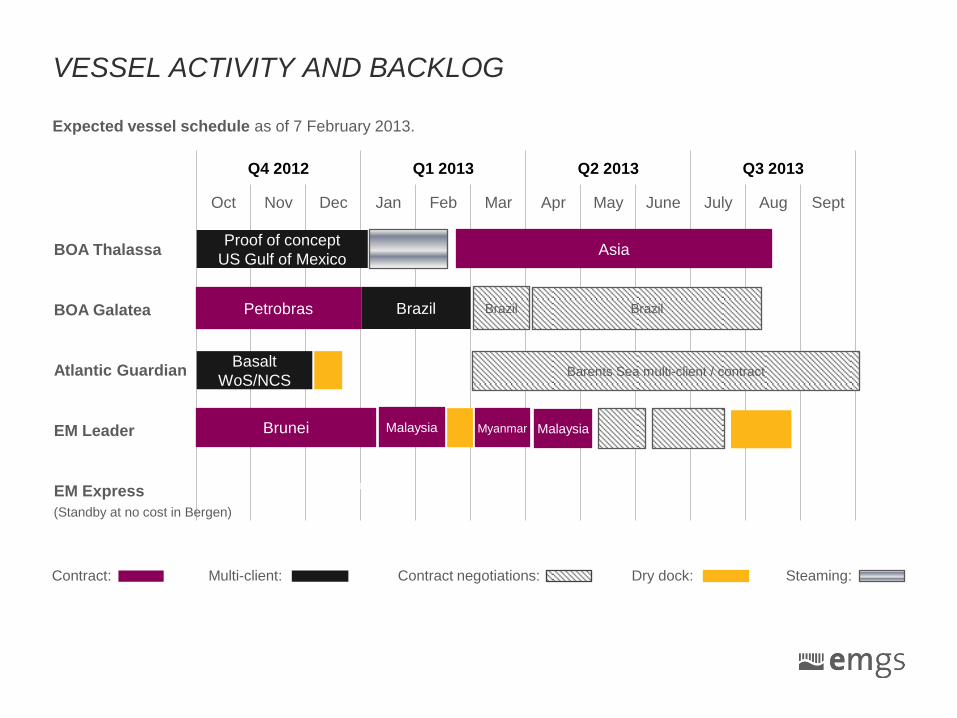
Q4 2012 Q1 2013 Q2 2013 Q3 2013
Oct Nov Dec Jan Feb Mar Apr May June July Aug Sept
BOA Thalassa
BOA Galatea
Atlantic Guardian
EM Leader
EM Express
VESSEL ACTIVITY AND BACKLOG
Petrobras
Contract: Multi-client: Contract negotiations: Steaming:
Norway
Proof of concept
US Gulf of Mexico
Dry dock:
(Standby at no cost in Bergen)
Expected vessel schedule as of 7 February 2013.
Brunei
Brazil
Basalt
WoS/NCS Barents Sea multi-client / contract
Brazil
Asia
Brazil
Malaysia Myanmar Malaysia
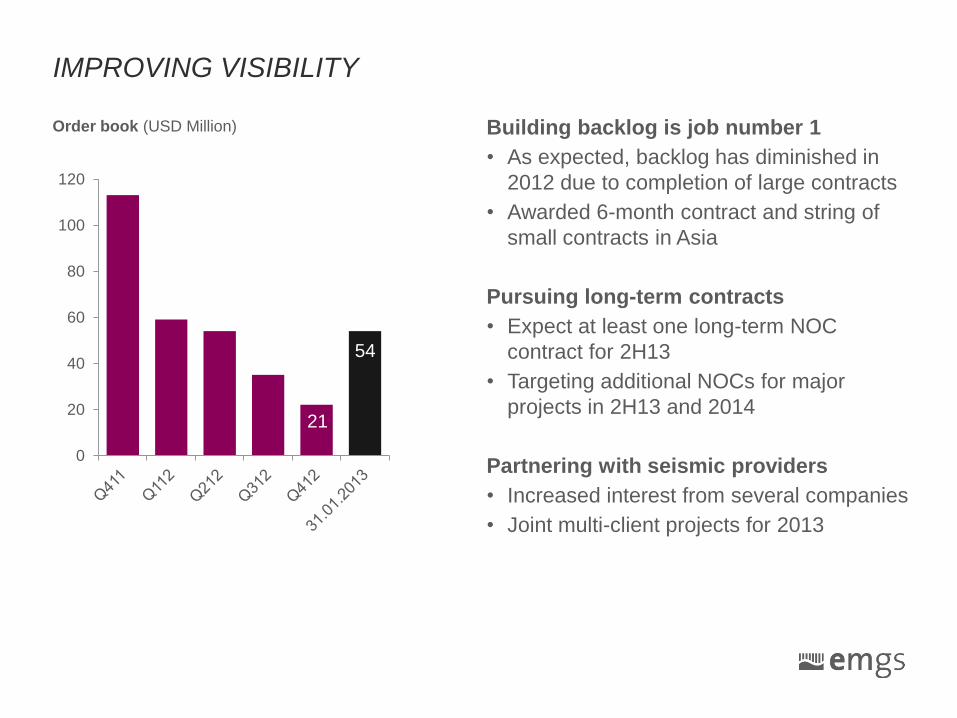
IMPROVING VISIBILITY
0
20
40
60
80
100
120
Building backlog is job number 1
• As expected, backlog has diminished in
2012 due to completion of large contracts
• Awarded 6-month contract and string of
small contracts in Asia
Pursuing long-term contracts
• Expect at least one long-term NOC
contract for 2H13
• Targeting additional NOCs for major
projects in 2H13 and 2014
Partnering with seismic providers
• Increased interest from several companies
• Joint multi-client projects for 2013
Order book (USD Million)
21
54

2013 GUIDANCE
• Revenues of USD 210-230 million
• EBITDA margin of 25-30%
• Backlog at a minimum of USD 100 million
by end 1H13
Assumptions:
• ~ 3.7 vessel years (44 vessel months) with
a utilisation rate of ~ 80%
• vessels allocated 20-25% to multi-client
programs
• multi-client revenues of USD 40-60 million
• average multi-client pre-funding level of at
least 100%
• contract pricing and capex in line with
2012 levels
• Soft Q1 2013

SUMMARY
Current status
• Robust E&P environment
• 4 vessels operating
Growth potential
• Increased customer adoption
• New technology
– Deeper penetration
– Increased resolution
– Continental shelf applications
• New applications
– Regional exploration
– Portfolio scale de-risking
– Development applications
– Structural imaging
Regional
exploration Pre-drilling
risk
reduction
Development
and Production Structural
imaging
(salt/basalt etc.)
2015
2012
Revenue scenario by application/market segment

Q & A