Title. Active screening at entry for tuberculosis among...
26
1 Title. Active screening at entry for tuberculosis among new immigrants: a systematic review and meta-analysis Authors. Shazia Arshad 1* ; Luckshman Bavan 1* ; Kataryna Gajari 1* ; Sophia N. J. Paget 1* ; Iacopo Baussano 1,2 *Those authors have contributed equally to the work and should be considered first authors. Affiliations. 1 Imperial College of Science, Technology and Medicine. Division of Epidemiology, Public Health and Primary Care. Faculty of Medicine, London. 2 Unit of Medical Statistics – Università ‘A.Avogadro’ and CPO-Piemonte, Novara, Italy Short title. Tuberculosis among new immigrants Keywords. tuberculosis, screening, migrants. Words count, text: 3703. Words count, abstract: 199. Number of tables: 2. Number of figures: 4. . Published on October 19, 2009 as doi: 10.1183/09031936.00054709 ERJ Express Copyright 2009 by the European Respiratory Society.
Transcript of Title. Active screening at entry for tuberculosis among...

1
Title. Active screening at entry for tuberculosis among new immigrants: a systematic
review and meta-analysis
Authors. Shazia Arshad1*; Luckshman Bavan1*; Kataryna Gajari1*; Sophia N. J. Paget1*;
Iacopo Baussano 1,2
*Those authors have contributed equally to the work and should be considered first authors.
Affiliations. 1Imperial College of Science, Technology and Medicine. Division of Epidemiology, Public
Health and Primary Care. Faculty of Medicine, London. 2Unit of Medical Statistics – Università ‘A.Avogadro’ and CPO-Piemonte, Novara, Italy
Short title. Tuberculosis among new immigrants
Keywords. tuberculosis, screening, migrants.
Words count, text: 3703.
Words count, abstract: 199.
Number of tables: 2.
Number of figures: 4.
. Published on October 19, 2009 as doi: 10.1183/09031936.00054709ERJ Express
Copyright 2009 by the European Respiratory Society.

2
Principal Degrees and current positions of the authors
Shazia Arshad, B.Sc. Current position: medical student.
Luckshman Bavan, B.Sc. Current position: medical student
Kataryna Gajari, B.Sc. Current position: medical student
Sophia Paget, B.Sc. Current position: medical student
Iacopo Baussano, see below (corresponding authors details)
Full address
Imperial College of Science, Technology and Medicine. Division of Epidemiology, Public
Health and Primary Care. Faculty of Medicine. St Mary's Campus, Norfolk Place, London
W2 1PG.
Corresponding author.
Iacopo Baussano, MD, MSc., M.Phil., Specialist in Infectious Diseases.
Current position: researcher
Imperial College of Science, Technology and
Medicine. Division of Epidemiology, Public
Health and Primary Care. Faculty of
Medicine, room 512 (fifth floor).
St Mary's Campus,
Norfolk Place,
London W2 1PG.
SCDU di Epidemiologia dei Tumori
Servizio di Statistica Medica
CPO Piemonte
Via Solaroli, 17
28100 - NOVARA
Italy

3
Abstract.
Background. Although there is no evidence that imported tuberculosis increases the
incidence of the disease in the host countries, the rise in migration worldwide raises concerns
regarding the adequacy of surveillance and control of immigrant-associated tuberculosis in
low incidence countries. Assessing the performance of screening of immigrants for
tuberculosis is key to rationalize the control policies to detect and manage immigrant-
associated tuberculosis.
Methods. We performed a systematic review and meta-analysis to determine the yield of
active screening for tuberculosis among new immigrants at the point of entry.
Results. The yield for pulmonary tuberculosis was 3.5 cases per thousand screened (95% CI
2.9– 4.1, I²= 94%), for refugees, asylum seekers and regular immigrants the estimates were
11.9 (95% CI 6.7 – 17.2, I²= 92%), 2.8 (95% CI 2.0 – 3.7, I²= 96%) and 2.7 (95% CI 2.0 –
3.4, I²= 81%), respectively. The yield estimates for immigrants from Europe, Africa and Asia
were 2.4 (95% CI 1.3 – 3.4, I²= 51.5%), 6.5 (95% CI 3.2 – 10.0, I²= 62%) and 11.2 (95% CI
6.2 – 16.1, I²= 95%), respectively.
Conclusions. These results provide useful data to inform the development of coherent
policies and rational screening services to detect immigrant-associated tuberculosis.

4
Introduction
In 2007, according to the World Health Organization (WHO), there were an estimated 13.7
million prevalent cases of tuberculosis and an estimated 0.5 million cases of multidrug-
resistant tuberculosis worldwide. In the same year, the number of new cases increased from
9.24 million cases in 2006 to 9..27 due to population growth, while there were 1,756,000
deaths from tuberculosis, 456,000 of which occurred in HIV-positive people. The African,
South-East Asia and Western Pacific regions accounted for around 80% of total case
notifications.[1] As with other infections, the movements of populations across countries can
be critically important in shaping the global epidemiology of tuberculosis.[2] The
displacement of people from areas characterized by a high burden of tuberculosis and poor
implementation of control strategies may hinder the tuberculosis control in areas with
unprepared or overstretched control programmes. Contact patterns both within and outside
the migrant communities, immigration patterns and tuberculosis control measures are likely
to affect the effective contact between infectious and susceptible individuals.[3] Thus,
migrants from countries with a high prevalence of tuberculosis may play a role as a source of
tuberculosis infection particularly within migrant communities.[4,5] The dramatic rise in
migration to Europe and the potential consequences of this in terms of infectious diseases
circulation, has recently been addressed at the second Conference on Applied Infectious
Disease Epidemiology (ESCAIDE) supported by the European Centre for Disease Prevention
and Control (ECDC).[6] The issues of surveillance of communicable diseases and screening
of migrants for tuberculosis are politically sensitive topics that need robust evidence about
the burden of immigrant-associated tuberculosis and about the efficacy of screening services
to be adequately addressed.[7,8,9] Very recently, overseas screening has been reported as a
high-yield intervention for indentifying tuberculosis in regular immigrants and refugees in
their countries of origin[10]. Similarly, contact tracing among migrants and the foreign-born
population has been recently reviewed as a potentially effective, though poorly standardized,
strategy to identify cases in a high-prevalence population.[11]
We review the current literature in order to provide a measure of performance of screening at
entry in settings of low tuberculosis prevalence. Specifically looking at evidence on the yield
(defined as the ratio between number of cases detected and individuals screened) of active
case finding or active screening programmes targeted to migrants moving from areas of high
tuberculosis incidence to areas of low incidence.
Methods

5
Search strategy
We initially searched the available literature for systematic reviews or meta-analyses
reporting tuberculosis prevalence amongst migrants. In 2005 Dasgupta and Menzies
published a systematic review aimed at assessing the cost-effectiveness of tuberculosis
control strategies among immigrants and refugees.[7] In order to optimize the sensitivity of
the search the focus was not specifically on active screening yield. We aimed our search
strategy to identify all the studies that assessed the prevalence of tuberculosis amongst
immigrants moving from high incidence, i.e. >49 new TB cases/100,000 persons-year, to
medium or low incidence, i.e. <50 new TB cases/100,000 persons-year. We searched three
electronic databases for primary studies: PubMed, EMBASE and Web of Knowledge. The
search included published reports through July 2008, using the following combination of
terms: ‘tuberculosis’ and ‘prevalence’ or ‘screening’ and ‘emigrants’ or ‘refugees’ or ‘foreign
born’ or ‘immigrants’. We restricted the language of the publications to English, French,
Spanish and Italian. To identify relevant articles not found in the electronic databases we
supplemented the search strategy as follows: a) we hand-searched the indices of the
International Journal of Tuberculosis and Lung Disease (1997-2004), b) we reviewed the
reference lists of primary studies.
Study selection
Studies were eligible for inclusion if they reported the proportion of active pulmonary
tuberculosis among screened immigrants, including the number of migrants investigated and
number of cases found, and if they assessed through active case finding or an active screening
programme, that is screening targeting all immigrants, irrespective of symptoms. For the
purpose of this review we considered studies performing both radiological and
microbiological tests to identify cases of active tuberculosis.[12] We excluded the following
studies: (1) studies only reporting prevalence of latent tuberculosis infection; (2) studies only
reporting tuberculosis cases in children (reported as such in the paper or younger than 16
years of age); (3) studies only identifying cases through passive case finding; (4) studies only
reporting tuberculosis prevalence among migrants moving from areas of low incidence; (5)
studies only reporting cases of multi-drug resistant tuberculosis; (6) studies only including
migrants who had undergone screening prior to leaving the country of origin and (7) studies
only reporting tuberculosis incidence data among immigrants.
All duplicate citations were eliminated from the initial database. Four reviewers (SA, SP,
KG, LB) screened these citations by reviewing titles and abstracts to identify potentially

6
relevant studies. Disagreements between the reviewers were resolved by consensus. The
database was then screened again to include only primary articles, and the full text of each
citation was obtained and reviewed.
Data extraction
A data extraction form was designed and pilot tested by four reviewers (SA, SP, KG, LB),
then a subset of five studies were independently reviewed to extract the relevant data. The
inter-rater agreement obtained for the data from these studies was 100%. Subsequently, the
papers were independently reviewed by the reviewers (SA, SP, KG, LB) and data extraction
cross-checked. The study period, the number of migrants screened and cases of active
tuberculosis were recorded. The pattern of screening has been classified as ‘routine’ or ‘on
purpose’ to differentiate information collected through ongoing and settled programmes from
those obtained from programmes developed ad hoc. If reported, we also collected data on the
country or geographic area of origin of the migrants, their age and gender distribution. We
considered as ‘migrants’ those reported as such in the original study. Since migrants were
differently reported in different studies, we grouped the migration patterns according to the
following classification: regular immigrant (including immigrant workers and students),
asylum seekers (including individuals who went through asylum centres or state registration
centres at the border; individuals arriving through transit centres and reporting to ports and
border health divisions) and refugees (reported as such in the papers). Only studies that
identified pulmonary tuberculosis using chest X-rays and/or sputum smear and/or
microbiological culture were included.
As estimates of tuberculosis prevalence among the general populations in the host countries,
we considered estimates provided by the WHO for the corresponding study period.[13]
Finally, we assessed the quality of each study, adapting the Newcastle-Ottawa scoring scale
for cohort studies.[14] In brief, the quality of the studies has been assessed considering the
definition and representativeness of the cohort of migrants, the diagnostic criteria for cases of
active tuberculosis and the comparability of the cohorts on the basis of the study design or
analysis.
Data collation and meta-analysis
For each study the yield of active screening for pulmonary tuberculosis has been calculated.
The yield was defined as the number of cases detected per 1,000 individuals screened. We
performed a random-effects meta-analysis in order to account for the expected between-study
variability for each study, that is we drew pooled estimates under the assumption that each
study had different characteristics and measured different, though related, underlying

7
yields[15]. We used the software for statistical analysis STATA version 9.2 (StataCorp.,
College Station, TX, USA). The studies included in the meta-analysis were weighted by the
inverse variance of their effect-size estimate.[16] In order to assess the magnitude of the
disproportion of the risk of pulmonary tuberculosis among screened immigrants and the
general population of the host country, we also compared the yield of active screening for
pulmonary tuberculosis with the estimated prevalence of tuberculosis in the general
population of the host country. The latter estimates are usually drawn from passive case
finding programmes, we therefore considered active screening yield as a proxy measure of
the pulmonary tuberculosis prevalence among immigrants.
The presence of heterogeneity across studies was assessed by the conventional chi-squared
test for heterogeneity and by calculating the I² statistic, which accounts for the number of
studies included in the meta-analysis and provide a direct measure of the variability not
explained by the information included in the analysis.[17]
To investigate possible sources of heterogeneity, we stratified the analysis by patterns of
migration, geographic area of destination and patterns of screening. To account for the effect
of continuous variables, such as the study period and quality scoring of the study, we
performed univariate meta-regression analyses. Using some studies, it was possible to
estimate a pooled pulmonary tuberculosis prevalence among screened migrants according to
their geographic origin and to assess the relative risk of tuberculosis between men and
women. There were insufficient studies reporting the distribution of the migrants by age,
gender and country of origin to warrant analysis. Finally, we qualitatively assessed the
publication bias by drawing a funnel plot.
Results
The study selection process is shown in figure 1. We identified 468 potentially relevant
unique citations from all literature searches, and 22 of these publications were eligible for
inclusion, accounting for 5,446 cases of pulmonary tuberculosis out of 2,620,739 screened
immigrants.[18,19,20,21,22,23,24,25,26,27,28,29,30,31,32,33,34,35,36,37,38,39] No
publication has been excluded from the analysis on the basis of the quality assessment. The
median number of cases of pulmonary tuberculosis among immigrants was 31 (inter-quartile
range [IQR]: 10–76), while the median number of immigrants screened in each study was
6526 (IQR: 945–19912). Of the 22 studies, seven reported pulmonary tuberculosis cases
among refugees,[26,27,28,29,30,31,38] seven reported cases among regular
immigrants,[32,33,34,35,36,37,39] seven reported cases among asylum

8
seekers,[18,19,20,21,22,23,24] one did not report any pulmonary tuberculosis case.[25]
Twelve studies reported information about the geographic origin of the
migrants,[19,20,21,26,27,28,29,30,31,36,38,39] while only three studies reported a gender
distribution of pulmonary tuberculosis cases.[22,29,31] Among the studies reporting the
geographic origin of immigrants, six reported cases from Europe (median number of cases:
10 [IQR: 4 – 8]; median number of immigrants: 2,950 [IQR:945 –
8,462]),[19,20,21,26,28,29] six reported cases from Asia (median number of cases: 24 [IQR:
13 – 71]; median number of immigrants: 2,089 [IQR: 1,863– 9,328]),[20,27,30,31,36,38]
three reported cases from Africa (median number of cases: 14 [IQR: 13–46]; median number
of immigrants: 1,732 [IQR:1,390–10,490])[19,20,21], one reported cases from the Middle
East[20] and finally one paper reported cases from Haiti.[39] Table 1 summarizes the
findings of the 22 studies that reported cases of active pulmonary tuberculosis among
migrants and the prevalence of tuberculosis among the general population in the host
countries. Figure 2 shows the pooled and study specific estimates, stratified by patterns of
migration, of the yield of active screened programmes. These estimates ranged between a
minimum of one every thousand screened to a maximum of 38.1 per thousand, while the
pooled estimate was 3.5 per thousand (95% confidence interval [CI]: 2.9–4.1]). The study
reported by Denburg et al. did not identify any pulmonary tuberculosis cases out of the 68
refugees investigated and therefore did not contribute to the estimate of the pooled relative
risk.[25] Interestingly, the stratified pooled estimates allowed us to identify a fourfold
increase of the yield for refugees (yield = 11.9 per thousand; 95%CI: 6.7–17.2, I2 = 92%,)
compared to the other group of migrants: namely, regular immigrants (yield = 2.8 per
thousand; 95%CI: 2.0–3.6, I2 = 96%) and asylum seekers (yield = 2.7 per thousand; 95%CI:
2.0– 3.4, I2 = 81%). Since different geographic area of destination may experience different
patterns of immigration and implement different screening services, we performed a
sensitivity analysis considering estimates exclusively from European countries (figure 3). The
active screening yield for refugees decreased to 5.8 per thousand (95% CI: 2.0–9.5, I2 =
68%), while the yield for regular immigrants (yield = 2.2 per thousand; 95%CI: 1.3–3.2, I2 =
89%) and for asylum seekers (yield = 2.7 per thousand; 95%CI: 1.9–3.4, I2 = 84%) virtually
did not change.
In order to account for the possible differences between routine and ad hoc screening
programmes, we conducted an analysis restricted to the routine screening programmes. Also
in this case the yields for both regular immigrants (yield = 2.0 per thousand; 95%CI: 1.3–2.8,
I2 = 96%) and asylum seekers (yield = 2.1 per thousand; 95%CI: 1.8–2.5, I2 = 30%) remained

9
substantially unchanged, while the heterogeneity between studies targeted to asylum seekers
decreased significantly.
We investigated the role of the study period and quality scoring of the study for other sources
of heterogeneity, neither appeared to significantly influence the meta-analysis estimates.
The prevalence estimated in host countries ranged between 0.03 and 0.3 per thousand (table
1), while the overall pooled estimate of the active pulmonary tuberculosis prevalence ratio
between screened new immigrants and autochthonous population was 48.2 (95% CI:23.3–
99.6 I2 = 99%). The stratification by migration patterns of the prevalence ratio (figure 4),
mirrored the stratification of the screening yield, namely: refugees prevalence ratio for
tuberculosis was 130.6 (95% CI: 58.8–290.2, I2 = 96%), for regular immigrants was 29.4
(95% CI:9.7–88.9, I2 = 99%), and for asylum seekers it was 30.1 (95% CI:19.3–47.1, I2 =
93%).
Since some studies also reported pulmonary tuberculosis cases according to their geographic
origin, we tentatively estimated the pooled yield of active tuberculosis among migrants from
some continents (figure 5): the pooled yield for immigrants from European countries was 2.4
per thousand (95%CI: 1.3–3.4, I2=51,5%), from Africa it was 6.5 (95%CI: 3.1–9.9,
I2=62.5%), while from Asia the yield was 11.2 (95%CI: 6.2–16.1, I2=94.9%).
Finally, using the data reported by four studies, we estimated the prevalence ratio for
pulmonary active tuberculosis between migrant men and women (table 2). Men were at a
higher risk of active pulmonary tuberculosis than women, RR = 1.39, however, this
difference was not statistically significant (95%CI: 0.94–2.04, I2=49.4%).
The possible distortion of the estimates due to publication bias could be reasonably excluded
by visual inspection of the funnel plot, although the method has been designed for meta-
analysis of randomised controlled trials.[40]
Discussion
Population mobility across the world is rapidly becoming a key determinant of the infectious
diseases epidemiology.[41] The relationship existing between international migration and
tuberculosis control has been extensively addressed by a report of a European Task Force
from the International Union Against Tuberculosis and Lung Disease (IUATLD) and WHO
in 1994,[2] while Dasgupta and Menzies compared the cost-effectiveness of different
tuberculosis control strategies.[7] In the present study we attempt to summarize the evidence
on the yield of active screening of immigrants for pulmonary tuberculosis from countries
with high incidence of tuberculosis migrating to low incidence countries. Overall, the

10
proportion of screened immigrants with active pulmonary tuberculosis ranged between 1 and
38 per thousand, that is between ten to one hundred times greater than the prevalence
measured in the general population of the host country. The overall stratified analysis has
shown that the patterns of migration are indicators of the risk of tuberculosis: namely
refugees have been shown to be four times more likely to be diagnosed with active
pulmonary tuberculosis than the other immigrants. The sensitivity analysis restricted to the
European host countries has shown a similar pattern, although the screening yield for
refugees halved and the confidence intervals between groups overlapped. These differences
in screening yield may reflect a different risk of pulmonary tuberculosis infection associated
with each pattern of migration. Refugees usually leave their own countries as consequence of
critical and relatively rapid events, therefore they might be less subject to a process of
selection based on their health status, the so called ‘healthy immigrant effect’.[42]
Furthermore, refugees may spend some time in overcrowded camps before moving to the
host country; in these settings the living conditions may favour both the transmission and the
occurrence of tuberculosis. Our findings are consistent with the estimates reported from the
overseas screening for U.S.-bound immigrants and refugees. The reported analyses shows
that prevalence (per thousand screened) among refugees is larger (10.4; 95%CIs 10.0-10.7)
than among other immigrants (9.6; 95%CIs 9.5-9.7)[10]. Unfortunately, those values are not
readily comparable with our estimates since they refer exclusively to smear negative
tuberculosis cases, whereas our analysis accounts also for smear positive cases. However, the
consistency of the findings highlights the need for recommendations on screening of refugees
as a high risk group for active tuberculosis. To be fully effective screening should be part of
an integrated preventive strategy focused on improving housing conditions to decrease the
risk of tuberculosis transmission, on enhancing tuberculosis case finding[11] and on setting
case management within the framework of directly-observed treatment programme.[43]
It has been observed, among regular immigrants, that the prevalence at entry was higher than
expected from the WHO estimated prevalence of tuberculosis in the country of origin,
possibly because migrants are a selected group with a higher risk for active tuberculosis, as
are young adults and lower socioeconomic status groups.[34] Interestingly, an analysis of the
data (not shown) from those studies reporting the country of origin of migrants suggested a
similar pattern. Unfortunately however, data were too limited to draw any convincing
conclusion.
Immigrants from Asia and Africa have been found to be about five and three times,
respectively, more likely to be affected by pulmonary tuberculosis at their entry, than their

11
European counterparts. These differences grossly reflect the worldwide distribution of
tuberculosis. Unexpectedly, the pooled yield for immigrants from Africa was lower than for
immigrants from Asia, This could be explained by the fact that about 51% of immigrants
from Asia were refugees, whereas all immigrants from Africa were asylum seekers.
Furthermore, according to a restricted analysis, the pooled yield for asylum seekers from
European countries[19,20,21] was 2.00 per thousand (95%CI: 1.36–2.63, I2=0.0%). This
finding suggests that a finer definition of the risk groups might result in a reduction of
heterogeneity of the estimates, possibly supporting more specific indications about which
immigrant groups should be targeted for screening. Unfortunately, the available data were not
sufficient to further stratify the whole analysis by geographic origin and migration patterns.
The comparison of prevalence of active tuberculosis among screened immigrants at entry
with the prevalence estimated for the autochthonous general population, has shown that
overall immigrants at entry into the country are a 40 times more at risk of having active
tuberculosis than the local general population. Also, as expected, the comparison between
patterns of migration confirmed that refugees are four to fivefold as much at risk of
pulmonary tuberculosis than the other groups. These comparisons should be however
considered cautiously, since a) tuberculosis prevalence, in absence of specifically designed
surveys, is usually derived from the incidence and duration estimates obtained from the
notification systems based on a passive case finding approach,[44] b) active screening
anticipate diagnosis of asymptomatic cases of tuberculosis, for example Monney et al. found
that 49% of actively screened cases were asymptomatic compared to 18% of those detected
through passive case finding,[24] and c) some prevalent cases may be missed by screening at
entry, for example Erkens et al. detected 97% of prevalent cases through screening, the
remaining cases were detected passively during the first five months of immigration.
Further limitation should be considered when interpreting the findings of this study. Firstly,
the pooled analysis of all studies showed substantial heterogeneity. Similar levels of
heterogeneity have been observed in other systematic reviews focusing on tuberculosis
transmission control issues and analysing observational studies.[45,46] Such heterogeneity
can be due to differences in methodological quality, study design, sampling variability, and
study populations across studies. In particular, we accounted for the patterns of migration and
we restricted the analysis to the European and to the routine screening programmes, under the
assumption of a greater homogeneity within each subgroup. In fact, some reduction of the
heterogeneity has been observed, possibly due to a more consistent organization of routine
screening programmes and more consistent migration patterns within Europe. The variations

12
in the study quality and in the study period, did not significantly affect the heterogeneity
between study estimates. The high level of heterogeneity limits the ability to interpret the
pooled estimates and to compare estimates among subgroups. However the yield of active
screening of new immigrants and the prevalence ratios for active tuberculosis between
migrants and the general population in the host country were so high to warrant serious
consideration. Secondly, it was not possible to account for the level of coverage of screening
services, furthermore, it is uncertain whether and how our estimates, drawn for refugees,
asylum seekers or regular immigrants, can be projected on to illegal immigrants, who are
likely to be those bearing the greatest share of imported tuberculosis burden. Finally, some
misclassification between migration patterns could not be excluded, in particular between
refugees and asylum seekers. However when the analysis has been restricted to the data from
routine screening programmes, the heterogeneity between studies investigating asylum
seekers decreased by about 50%, while the screening yield remained virtually unchanged.
It is noteworthy that currently there is no evidence that imported tuberculosis has
significantly increased the incidence of tuberculosis among the autochthonous population.[7]
On the contrary, overall the number of notifications from the local population is decreasing
every year in most industrialized countries, whereas the proportion of foreign-born
tuberculosis cases is increasing.[47,48] However, imported tuberculosis has been shown to be
transmitted within population subgroups with poor living conditions and poor access to health
care provision.[5,8,49,50] Therefore, favouring the detection of tuberculosis cases by active
screening and by promoting the access of immigrants to health care facilities may shorten the
infectious periods, interfere with the transmission network, and improve the control of
potential tuberculosis reservoirs.
The assessment of effectiveness of active screening of immigrants at entry is beyond the
scope of this paper. However, our yield estimates, in particular for refugees from countries
with high incidence of tuberculosis, support the recommendation of the introduction of
screening at entry as an element of an integrated preventive strategy for tuberculosis control.
In particular, screening programmes targeting high-risk groups within the framework of
coordinated activities of control and management of tuberculosis, such as contact tracing
investigations and tailored directly-observed treatment programmes can be successful in
reducing the burden among migrants.[4,8] The early identification and management of
tuberculosis among immigrants before they are dispersed within the host country is expected
to prevent unnecessary transmission between recent immigrants. Furthermore, it would
guarantee a more equitable access to health care provision and, possibly, eventually result

13
into higher treatment success rates. In conclusion, the presented findings provide useful data
to inform the development of coherent policies and rational screening services to detect
immigrant-associated tuberculosis.

14
Figures and Tables
Figure 1: Flow diagram for study selection.
282 excluded:─ published in non-English, French Spanish or Italian literature (n=42)─ not relevant to tuberculosis or migration by screening titles and abstracts (n=240)
468 potentially relevant citations identified from
electronic databases and other sources
186 full text articles screened for eligibility
criteria
22 full text articles screened for eligibility criteria (included in the
systematic review)
165 excluded : ─ Tuberculosis incidence (n=14)─ Latent tuberculosis infections (n=51) ─ Passive screening (n=32) ─ Tuberculosis in children (31) ─ MDR tuberculosis (23) ─ Migrants from low prevalence countries (n=5)─ Pre-migration screening (n=13)
5 additional full texts identified from
references and reviews

15
Tabl
e 1:
Pre
vale
nce
of tu
berc
ulos
is a
mon
g m
igra
nts.
Stu
dy
Aut
hor,
year
of
publ
icat
ion
Stud
y Pe
riod
Patte
rn o
f M
igra
tion
Hos
t co
untr
y
TB c
ases
amon
g
mig
rant
s
Mig
rant
s sc
reen
ed
for T
B
TB
prev
alen
ce
in th
e ho
st
coun
try
(per
100
00
0)[1
3]
Met
hod
of
scre
enin
g at
entr
y†
Stud
y Q
ualit
y
Scor
ing*
Har
ling
et a
l., 2
007[
18]
2002
-03
Asy
lum
See
kers
U
K
11
8258
12
R
outin
e 5
Van
den
Bra
nde
et a
l.,
1997
[19]
19
93
Asy
lum
See
kers
B
elgi
um
19
4794
15
O
n pu
rpos
e 8
Cal
liste
r et a
l., 2
001[
20]
1995
-199
9 A
sylu
m S
eeke
rs
UK
10
0 41
470
9 R
outin
e 8
John
sen
et a
l., 2
005[
21]
1987
-199
5 A
sylu
m S
eeke
rs
Nor
way
43
19
912
8 R
outin
e 10
van
Bur
g et
al.,
200
3[22
] 19
94-1
997
Asy
lum
See
kers
N
ethe
rland
s 10
3 46
424
8 R
outin
e 9
Hob
bs e
t al.,
200
2[23
] 19
99-2
000
Asy
lum
See
kers
N
ew
Zeal
and
4 90
0 11
R
outin
e 8
Mon
ney
et a
l., 2
005[
24]
2001
-200
2 A
sylu
m S
eeke
rs
Sw
itzer
land
71
13
507
6 O
n pu
rpos
e 11
Pitc
heni
k et
al.,
198
2[39
] 19
80
Reg
ular
imm
igra
nts
US
A
101
1554
4 7
On
purp
ose
7
Nol
an e
t al.,
198
8[38
] 19
80
Ref
ugee
s U
SA
78
93
28
7 O
n pu
rpos
e 9
Den
burg
et a
l., 2
007[
25]
2006
R
efug
ees
Can
ada
0 68
4
On
purp
ose
8
Laife
r et a
l., 2
004[
26]
1999
R
efug
ees
Sw
itzer
land
8
3119
8
On
purp
ose
8
Wilc
ke e
t al.,
199
7[27
] 19
95
Ref
ugee
s D
enm
ark
13
1936
9
On
purp
ose
5
Rys
stad
et a
l., 2
002[
28]
1999
R
efug
ees
Nor
way
4
800
5 O
n pu
rpos
e 8
Sm
ith e
t al.,
200
0[29
] 19
99-2
000
Ref
ugee
s Ire
land
12
94
5 12
O
n pu
rpos
e 5

16
Juds
on e
t al.,
198
4[30
] 19
81-1
982
Ref
ugee
s U
SA
18
92
3 7
On
purp
ose
8
Kel
ly e
t al.,
200
2[31
] 19
99
Ref
ugee
s A
ustra
lia
71
1863
6
On
purp
ose
8
Akh
tar e
t al.,
200
8[32
] 19
97-2
006
Reg
ular
Imm
igra
nts
Kuw
ait
4608
23
2858
2 31
R
outin
e 7
Laife
r et a
l., 2
007[
33]
1997
-200
4 R
egul
ar
Imm
igra
nts
Sw
itzer
land
43
42
601
7 R
outin
e 11
Erk
ens
et a
l., 2
008[
34]
1998
-200
2 R
egul
ar
Imm
igra
nts
Net
herla
nd
s 76
68
122
6 R
outin
e 10
Sal
inas
Sol
ano
et a
l.,
2002
[35]
19
98
Reg
ular
Imm
igra
nts
Spa
in
3 40
6 27
O
n pu
rpos
e 7
Orm
erod
et a
l., 1
998[
36]
1990
-199
4 R
egul
ar
Imm
igra
nts
UK
10
22
42
10
Rou
tine
7
Mat
hez
et a
l., 2
007[
37]
2004
R
egul
ar
Imm
igra
nts
Sw
itzer
land
50
89
95
6 R
outin
e 8
† Rou
tine:
stan
dard
scre
enin
g pr
otoc
ol a
dopt
ed b
y th
e lo
cal a
utho
ritie
s. O
n pu
rpos
e: sc
reen
ing
prot
ocol
spec
ifica
lly a
dopt
ed to
face
a sp
ecifi
c si
tuat
ion
or fo
r the
stud
y pu
rpos
es. *
Ada
pted
from
the
New
cast
le-O
ttaw
a sc
orin
g sc
ale
for c
ohor
t stu
dies
[14]
.

17
Figure 2: Forest plot, yield(X 1000 individuals tested ) of active screening of immigrants at
entry, by pattern of migration (all studies included).
Overall (I2 = 94.0%, p = 0.000)
Hobbs et al. (2002)
Laifer et al. (2007)
Subtotal (I2 = 92.5%, p = 0.000)
Harling et al. (2007)
van Burg et al. (2003)
Regular immigrants
Judson et al. (1984)
Johnsen et al. (2005)
Akhtar et al. (2008)
Subtotal (I2 = 81.0%, p = 0.000)
Asylum seekers
Erkens et al. (2008)
van den Brande et al. (1997)
Mathez et al. (2007)
Wilcke et al. (1998)Rysstad et al. (2002)
Ormerod et al. (1998)
Monney et al. (2005)
Smith et al. (2000)
Kelly et al. (2002)
Solano et al. (2002)
Laifer et al. (2004)
Callister et al. (2001)
Pitchenik et al. (1982)
Subtotal (I2 = 96.0%, p = 0.000)
Refugees
Nolan et al. (1988)
3.49 (2.90, 4.08)
4.44 (1.67, 11.78)
1.01 (0.75, 1.36)
11.92 (6.68, 17.17)
1.33 (0.74, 2.40)
2.22 (1.83, 2.69)
19.50 (12.32, 30.74)
2.16 (1.60, 2.91)
1.98 (1.92, 2.04)
2.70 (1.98, 3.42)
1.12 (0.89, 1.40)
3.96 (2.53, 6.21)
5.56 (4.22, 7.33)
6.71 (3.90, 11.53)5.00 (1.88, 13.24)
4.46 (2.40, 8.27)
5.26 (4.17, 6.63)
12.70 (7.23, 22.22)
38.11 (30.31, 47.82)
7.39 (2.39, 22.65)
2.56 (1.28, 5.12)
2.41 (1.98, 2.93)
6.50 (5.35, 7.89)
2.84 (2.04, 3.64)
8.36 (6.70, 10.43)
100.00
1.20
8.70
13.67
7.58
8.50
0.40
8.03
8.89
44.98
8.76
4.81
5.53
1.910.97
2.81
6.44
0.59
0.44
0.33
4.62
8.42
6.33
41.34
4.75
.5 5 10 30 50
Authors (year of publication) % WeightYield x 1000 (95% CI)
Screening Yield (x 1000 screened)
Overall (I2 = 94.0%, p = 0.000)
Hobbs et al. (2002)
Laifer et al. (2007)
Subtotal (I2 = 92.5%, p = 0.000)
Harling et al. (2007)
van Burg et al. (2003)
Regular immigrants
Judson et al. (1984)
Johnsen et al. (2005)
Akhtar et al. (2008)
Subtotal (I2 = 81.0%, p = 0.000)
Asylum seekers
Erkens et al. (2008)
van den Brande et al. (1997)
Mathez et al. (2007)
Wilcke et al. (1998)Rysstad et al. (2002)
Ormerod et al. (1998)
Monney et al. (2005)
Smith et al. (2000)
Kelly et al. (2002)
Solano et al. (2002)
Laifer et al. (2004)
Callister et al. (2001)
Pitchenik et al. (1982)
Subtotal (I2 = 96.0%, p = 0.000)
Refugees
Nolan et al. (1988)
3.49 (2.90, 4.08)
4.44 (1.67, 11.78)
1.01 (0.75, 1.36)
11.92 (6.68, 17.17)
1.33 (0.74, 2.40)
2.22 (1.83, 2.69)
19.50 (12.32, 30.74)
2.16 (1.60, 2.91)
1.98 (1.92, 2.04)
2.70 (1.98, 3.42)
1.12 (0.89, 1.40)
3.96 (2.53, 6.21)
5.56 (4.22, 7.33)
6.71 (3.90, 11.53)5.00 (1.88, 13.24)
4.46 (2.40, 8.27)
5.26 (4.17, 6.63)
12.70 (7.23, 22.22)
38.11 (30.31, 47.82)
7.39 (2.39, 22.65)
2.56 (1.28, 5.12)
2.41 (1.98, 2.93)
6.50 (5.35, 7.89)
2.84 (2.04, 3.64)
8.36 (6.70, 10.43)
100.00
1.20
8.70
13.67
7.58
8.50
0.40
8.03
8.89
44.98
8.76
4.81
5.53
1.910.97
2.81
6.44
0.59
0.44
0.33
4.62
8.42
6.33
41.34
4.75
3.49 (2.90, 4.08)
4.44 (1.67, 11.78)
1.01 (0.75, 1.36)
11.92 (6.68, 17.17)
1.33 (0.74, 2.40)
2.22 (1.83, 2.69)
19.50 (12.32, 30.74)
2.16 (1.60, 2.91)
1.98 (1.92, 2.04)
2.70 (1.98, 3.42)
1.12 (0.89, 1.40)
3.96 (2.53, 6.21)
5.56 (4.22, 7.33)
6.71 (3.90, 11.53)5.00 (1.88, 13.24)
4.46 (2.40, 8.27)
5.26 (4.17, 6.63)
12.70 (7.23, 22.22)
38.11 (30.31, 47.82)
7.39 (2.39, 22.65)
2.56 (1.28, 5.12)
2.41 (1.98, 2.93)
6.50 (5.35, 7.89)
2.84 (2.04, 3.64)
8.36 (6.70, 10.43)
100.00
1.20
8.70
13.67
7.58
8.50
0.40
8.03
8.89
44.98
8.76
4.81
5.53
1.910.97
2.81
6.44
0.59
0.44
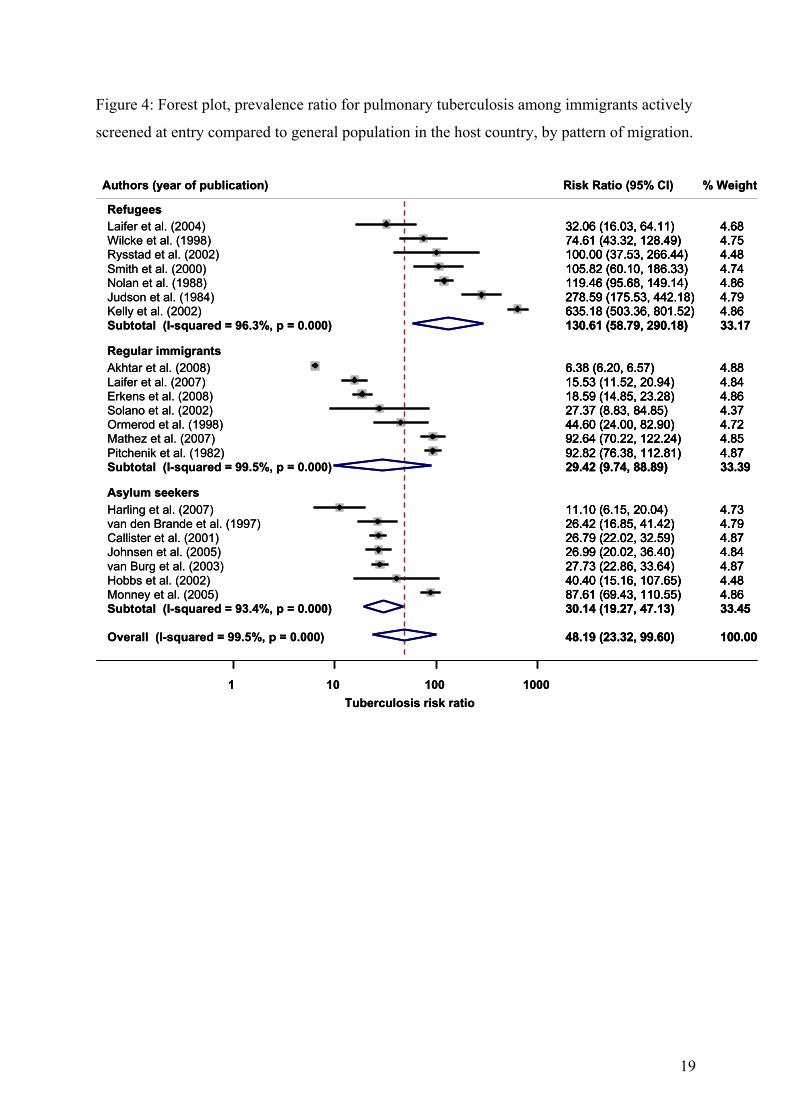
0.33
4.62
8.42
6.33
41.34
4.75
.5 5 10 30 50
Authors (year of publication) % WeightYield x 1000 (95% CI)
Screening Yield (x 1000 screened)

18
Figure 3: Forest plot, yield(X 1000 individuals tested ) of active screening of immigrants at
entry, by pattern of migration (only studies from European countries included).
Overall (I2 = 89.9%, p = 0.000)
Subtotal (I2 = 89.5%, p = 0.000)
Mathez et al. (2007)
Regular immigrants
Callister et al. (2001)
Smith et al. (2000)Subtotal (I2 = 68.0%, p = 0.025)
Laifer et al. (2004)
Johnsen et al. (2005)
Laifer et al. (2007)
Rysstad et al. (2002)
Solano et al. (2002)
Harling et al. (2007)
van den Brande et al. (1997)
Asylum seekers
Refugees
Subtotal (I2 = 83.8%, p = 0.000)
Ormerod et al. (1998)
van Burg et al. (2003)
Wilcke et al. (1998)
Erkens et al. (2008)
Monney et al. (2005)
2.83 (2.16, 3.49)
2.25 (1.29, 3.22)
5.56 (4.22, 7.33)
2.41 (1.98, 2.93)
12.70 (7.23, 22.22)5.77 (2.06, 9.49)
2.56 (1.28, 5.12)
2.16 (1.60, 2.91)
1.01 (0.75, 1.36)
5.00 (1.88, 13.24)
7.39 (2.39, 22.65)
1.33 (0.74, 2.40)
3.96 (2.53, 6.21)
2.67 (1.94, 3.41)
4.46 (2.40, 8.27)
2.22 (1.83, 2.69)
6.71 (3.90, 11.53)
1.12 (0.89, 1.40)
5.26 (4.17, 6.63)
100.00
33.51
7.07
10.82
0.7410.30
5.90
10.32
11.18
1.24
0.42
9.72
6.14
56.19
3.57
10.93
2.42
11.27
8.25
.5 5 10 30
Authors (year of publication) % WeightYield x 1000 (95% CI)
Screening Yield (x 1000 screened)
19
Figure 4: Forest plot, prevalence ratio for pulmonary tuberculosis among immigrants actively
screened at entry compared to general population in the host country, by pattern of migration.
Overall (I-squared = 99.5%, p = 0.000)
Solano et al. (2002)
Johnsen et al. (2005)
Subtotal (I-squared = 99.5%, p = 0.000)
Smith et al. (2000)
Callister et al. (2001)
Hobbs et al. (2002)Monney et al. (2005)
Pitchenik et al. (1982)
Refugees
Laifer et al. (2007)
Nolan et al. (1988)
Harling et al. (2007)
Mathez et al. (2007)
Kelly et al. (2002)
Laifer et al. (2004)
van den Brande et al. (1997)
Judson et al. (1984)
Erkens et al. (2008)
Akhtar et al. (2008)
Wilcke et al. (1998)
Regular immigrants
Subtotal (I-squared = 96.3%, p = 0.000)
Ormerod et al. (1998)
Asylum seekers
van Burg et al. (2003)
Subtotal (I-squared = 93.4%, p = 0.000)
Rysstad et al. (2002)
48.19 (23.32, 99.60)
27.37 (8.83, 84.85)
26.99 (20.02, 36.40)
29.42 (9.74, 88.89)
105.82 (60.10, 186.33)
26.79 (22.02, 32.59)
40.40 (15.16, 107.65)87.61 (69.43, 110.55)
92.82 (76.38, 112.81)
15.53 (11.52, 20.94)
119.46 (95.68, 149.14)
11.10 (6.15, 20.04)
92.64 (70.22, 122.24)
635.18 (503.36, 801.52)
32.06 (16.03, 64.11)
26.42 (16.85, 41.42)
278.59 (175.53, 442.18)
18.59 (14.85, 23.28)
6.38 (6.20, 6.57)
74.61 (43.32, 128.49)
130.61 (58.79, 290.18)
44.60 (24.00, 82.90)
27.73 (22.86, 33.64)
30.14 (19.27, 47.13)
100.00 (37.53, 266.44)
100.00
4.37
4.84
33.39
4.74
4.87
4.484.86
4.87
4.84
4.86
4.73
4.85
4.86
4.68
4.79
4.79
4.86
4.88
4.75
33.17
4.72
4.87
33.45
4.48
1 10 100 1000
Authors (year of publication) % WeightRisk Ratio (95% CI)
Tuberculosis risk ratio

20
Figure 5: Forest plot, yield(X 1000 individuals tested ) of active screening of immigrants at
entry, by geographic origin of the immigrants.
Wilcke et al. (1998)Nolan et al. (1988)
Callister et al. (2001)
Judson et al. (1984)
Asia
Africa
Johnsen et al. (2005)
Kelly et al. (2002)
Subtotal (I2 = 51.5%, p = 0.067)
Ormerod et al. (1998)
Subtotal (I2= 62.5%, p = 0.069)
van den Brande et al. (1997)
Johnsen et al. (2005)
Laifer et al. (2004)
Callister et al. (2001)
van den Brande et al. (1997)
Smith et al. (2000)
Subtotal (I2= 94.9%, p = 0.000)
Callister et al. (2001)
Rysstad et al. (2002)
Europe
6.71 (3.90, 11.53)8.36 (6.70, 10.43)
2.70 (1.89, 3.86)
19.50 (12.32, 30.74)
2.48 (1.62, 3.80)
38.11 (30.31, 47.82)
2.36 (1.31, 3.40)
4.46 (2.40, 8.27)
6.55 (3.19, 9.90)
1.44 (0.54, 3.83)
8.08 (4.79, 13.60)
2.56 (1.28, 5.12)
4.39 (3.29, 5.85)
9.35 (5.44, 16.04)
12.70 (7.23, 22.22)
11.17 (6.25, 16.08)
1.84 (1.16, 2.92)
5.00 (1.88, 13.24)
6.428.52
9.20
2.51
9.13
2.70
43.51
7.40
19.74
8.72
5.80
8.47
9.00
4.94
3.34
36.75
9.25
4.61
.5 5 10 50
Authors (year of publication) % WeightYield x 1000 (95% CI)
Screening Yield (x 1000 screened)

21
Table 2: Risk of pulmonary tuberculosis among migrants, by gender
Study Author, year of
publication
Study Period
Pattern of Migration
Men with TB
Men Women with TB
Women Relative risk –
95%CIs (men vs. women)
Kelly et al., 2002[31] 1999 Refugees 42 958 29 905 1.35
(0.85–2.15)
Van Burg et al.,
2003[22]
1994-1997 Asylum
Seekers
78 28875 25 17509 1.89
(1.21–2.96)
Erkens et al., 2008[34] 1998-2002 Regular
Immigrants
30 28566 46 38415 0.90
(0.57–1.42)
Smith et al., 2000[29] 1999-2000 Refugees 8 435 4 510 2.32
(0.70–7.65)
Pooled Relative risk – 95%CIs (men vs. women)
1.39 (0.94–2.04)
I2=49.4%

22
Acknowledgments
The authors would like to thank Massimiliano Bugiani, Ugo Fedeli, Edwin Michael, Gabriela
Gomez and Fabio Scano for their thoughtful comments. The paper has been conceived and
prepared within the framework of a BSc. module in Global Health held by the Faculty of
Medicine of the Imperial College of Science, Technology and Medicine in London, UK. The
authors would like to thank the course directors, Helen Ward and Paolo Vineis. IB has been
supported by the “Regione Piemonte” Italy, Assessorato Sanità, Progetti di Ricerca Sanitaria
Finalizzata, 2008.
Conflict of interest statement
The authors do not have any conflict of interest to disclose.

23
References
1. WHO-Report (2009) Global Tuberculosis Control:Epidemiology, Strategy, Financing. WHO Report 2009. Geneva, Switzerland: World Health Organization.
2. Riley S (2007) Large-scale spatial-transmission models of infectious disease. Science 316: 1298-1301.
3. Verver S, Venn J (2006) Tuberculosis control and migration. In: Raviglione MC, editor. Reichman and Hershfield's Tuberculosis: a comprehensive, intrantional approach. New York: Informa HealthCare. pp. 869-906.
4. Rieder HL, Zellweger JP, Raviglione MC, Keizer ST, Migliori GB (1994) Tuberculosis control in Europe and international migration. Eur Respir J 7: 1545-1553.
5. Lillebaek T, Andersen AB, Dirksen A, Smith E, Skovgaard LT, et al. (2002) Persistent high incidence of tuberculosis in immigrants in a low-incidence country. Emerg Infect Dis 8: 679-684.
6. Hargreaves S (2009) Migration high on the agenda at ESCAIDE 2008. Lancet Infect Dis 9: 11.
7. Dasgupta K, Menzies D (2005) Cost-effectiveness of tuberculosis control strategies among immigrants and refugees. Eur Respir J 25: 1107-1116.
8. Coker R, Bell A, Pitman R, Zellweger JP, Heldal E, et al. (2006) Tuberculosis screening in migrants in selected European countries shows wide disparities. Eur Respir J 27: 801-807.
9. Hargreaves S, Carballo M, Friedland JS (2009) Screening migrants for tuberculosis: where next? Lancet Infect Dis 9: 139-140.
10. Liu Y, Weinberg MS, Ortega LS, Painter JA, Maloney SA (2009) Overseas screening for tuberculosis in U.S.-bound immigrants and refugees. N Engl J Med 360: 2406-2415.
11. Mulder C, Klinkenberg E, Manissero D (2009) Effectiveness of tuberculosis contact tracing among migrants and the foreign-born population. Euro Surveill 14.
12. Broekmans JF, Migliori GB, Rieder HL, Lees J, Ruutu P, et al. (2002) European framework for tuberculosis control and elimination in countries with a low incidence. Recommendations of the World Health Organization (WHO), International Union Against Tuberculosis and Lung Disease (IUATLD) and Royal Netherlands Tuberculosis Association (KNCV) Working Group. Eur Respir J 19: 765-775.
13. World Health Organization Global Health Atlas.
14. Wells G, Shea B, O’Connell D, Peterson J, Welch V, et al. The Newcastle-Ottawa Scale (NOS) for assessing the quality of nonrandomised studies in meta-analyses.

24
15. Normand SL (1999) Meta-analysis: formulating, evaluating, combining, and reporting. Stat Med 18: 321-359.
16. Sterne JAC, Bradburn MJ, Egger M (2001) Meta-analysis in Stata. In: Egger M, Davey-Smith G, Altman DG, editors. Systematic reviews in health care: meta-analysis in context. London: BMJ publishing group. pp. 347-369.
17. Higgins JP, Thompson SG, Deeks JJ, Altman DG (2003) Measuring inconsistency in meta-analyses. Bmj 327: 557-560.
18. Harling R, Pearce M, Chandrakumar M, Mueller K, Hayward A (2007) Tuberculosis screening of asylum seekers: 1 years' experience at the Dover Induction Centres. Public Health 121: 822-827.
19. Van den Brande P, Uydebrouck M, Vermeire P, Demedts M (1997) Tuberculosis in asylum seekers in Belgium. VRGT (Flemish Lung and Tuberculosis Association). Eur Respir J 10: 610-614.
20. Callister ME, Barringer J, Thanabalasingam ST, Gair R, Davidson RN (2002) Pulmonary tuberculosis among political asylum seekers screened at Heathrow Airport, London, 1995-9. Thorax 57: 152-156.
21. Johnsen NL, Steen TW, Meyer H, Heldal E, Skarpaas IJ, et al. (2005) Cohort analysis of asylum seekers in Oslo, Norway, 1987-1995: effectiveness of screening at entry and TB incidence in subsequent years. Int J Tuberc Lung Dis 9: 37-42.
22. van Burg JL, Verver S, Borgdorff MW (2003) The epidemiology of tuberculosis among asylum seekers in The Netherlands: implications for screening. Int J Tuberc Lung Dis 7: 139-144.
23. Hobbs M, Moor C, Wansbrough T, Calder L (2002) The health status of asylum seekers screened by Auckland Public Health in 1999 and 2000. N Z Med J 115: U152.
24. Monney M, Zellweger JP (2005) Active and passive screening for tuberculosis in Vaud Canton, Switzerland. Swiss Med Wkly 135: 469-474.
25. Denburg A, Rashid M, Brophy J, Curtis T, Malloy P, et al. (2007) Initial health screening results for Karen refugees: a retrospective review. Can Commun Dis Rep 33: 16-22.
26. Laifer G, Widmer AF, Frei R, Zimmerli W, Fluckiger U (2004) Polymerase chain reaction for Mycobacterium tuberculosis: impact on clinical management of refugees with pulmonary infiltrates. Chest 125: 981-986.
27. Wilcke JT, Poulsen S, Askgaard DS, Enevoldsen HK, Ronne T, et al. (1998) Tuberculosis in a cohort of Vietnamese refugees after arrival in Denmark 1979-1982. Int J Tuberc Lung Dis 2: 219-224.
28. Rysstad OG, Gallefoss F (2003) TB status among Kosovar refugees. Int J Tuberc Lung Dis 7: 458-463.

25
29. Smith A, O'Flanagan D, Igoe D, Cronin J, Forde D, et al. (2000) Outcome of medical screening of Kosovan refugees in Ireland: 1999. Commun Dis Public Health 3: 291-294.
30. Judson FN, Lince DM, Anders BJ, Tapy JM, Le Van D, et al. (1984) Health status of Southeast Asian refugees. West J Med 141: 183-188.
31. Kelly PM, Scott L, Krause VL (2002) Tuberculosis in east timorese refugees: implications for health care needs in East Timor. Int J Tuberc Lung Dis 6: 980-987.
32. Akhtar S, Mohammad HG (2008) Nonlinear pattern of pulmonary tuberculosis among migrants at entry in Kuwait: 1997-2006. BMC Public Health 8: 264.
33. Laifer G, Widmer AF, Simcock M, Bassetti S, Trampuz A, et al. (2007) TB in a low-incidence country: differences between new immigrants, foreign-born residents and native residents. Am J Med 120: 350-356.
34. Erkens C, Slump E, Kamphorst M, Keizer S, van Gerven PJ, et al. (2008) Coverage and yield of entry and follow-up screening for tuberculosis among new immigrants. Eur Respir J 32: 153-161.
35. Salinas Solano C, Altube Urrengoetxea L, Espana Yandiola PP, Capelastegui Saiz A, Quintana Lopez JM (2002) [Tuberculosis among immigrants in Bilbao (Spain)]. Arch Bronconeumol 38: 506-510.
36. Ormerod LP (1998) Is new immigrant screening for tuberculosis still worthwhile? J Infect 37: 39-40.
37. Mathez C, Bangala Y, Bady P, Zellweger JP (2007) Active screening for pulmonary tuberculosis among immigrants by chest x-ray at the Swiss border. Swiss Med Wkly 137: 649-654.
38. Nolan CM, Elarth AM (1988) Tuberculosis in a cohort of Southeast Asian Refugees. A five-year surveillance study. Am Rev Respir Dis 137: 805-809.
39. Pitchenik AE, Russell BW, Cleary T, Pejovic I, Cole C, et al. (1982) The prevalence of tuberculosis and drug resistance among Haitians. N Engl J Med 307: 162-165.
40. Tatsioni A, Zarin DA, Aronson N, Samson DJ, Flamm CR, et al. (2005) Challenges in systematic reviews of diagnostic technologies. Ann Intern Med 142: 1048-1055.
41. Cliff A, Haggett P (2004) Time, travel and infection. Br Med Bull 69: 87-99.
42. McDonald JT, Kennedy S (2004) Insights into the 'healthy immigrant effect': health status and health service use of immigrants to Canada. Soc Sci Med 59: 1613-1627.
43. Macq JC, Theobald S, Dick J, Dembele M (2003) An exploration of the concept of directly observed treatment (DOT) for tuberculosis patients: from a uniform to a customised approach. Int J Tuberc Lung Dis 7: 103-109.

26
44. Dye C, Bassili A, Bierrenbach AL, Broekmans JF, Chadha VK, et al. (2008) Measuring tuberculosis burden, trends, and the impact of control programmes. Lancet Infect Dis 8: 233-243.
45. Joshi R, Reingold AL, Menzies D, Pai M (2006) Tuberculosis among health-care workers in low- and middle-income countries: a systematic review. PLoS Med 3: e494.
46. Morrison J, Pai M, Hopewell PC (2008) Tuberculosis and latent tuberculosis infection in close contacts of people with pulmonary tuberculosis in low-income and middle-income countries: a systematic review and meta-analysis. Lancet Infect Dis 8: 359-368.
47. Murray MB (2002) Molecular epidemiology and the dynamics of tuberculosis transmission among foreign-born people. CMAJ 167: 355-356.
48. Bloom BR (2002) Tuberculosis--the global view. N Engl J Med 346: 1434-1435.
49. Hernandez-Garduno E, Kunimoto D, Wang L, Rodrigues M, Elwood RK, et al. (2002) Predictors of clustering of tuberculosis in Greater Vancouver: a molecular epidemiologic study. CMAJ 167: 349-352.
50. Kulaga S, Behr M, Musana K, Brinkman J, Menzies D, et al. (2002) Molecular epidemiology of tuberculosis in Montreal. CMAJ 167: 353-354.