TITLE: A MEASUREMENT OF EMPLOYEE ENGAGEMENT USING …
88
TITLE: A MEASUREMENT OF EMPLOYEE ENGAGEMENT USING THE GALLUP Q 12® WORKPLACE AUDIT AUTHOR: FIONA VALE DEGREE BA (HONS) IN HRM YEAR 2011 This dissertation is submitted in partial fulfilment of the requirements for the Bachelor of Arts (Honours) in Human Resource Management, 2011. School of Business National College of Ireland 2011
Transcript of TITLE: A MEASUREMENT OF EMPLOYEE ENGAGEMENT USING …
TITLE: A MEASUREMENT OF EMPLOYEE ENGAGEMENT USING
THE GALLUP Q12®
WORKPLACE AUDIT
AUTHOR: FIONA VALE
DEGREE BA (HONS) IN HRM
YEAR 2011
This dissertation is submitted in partial fulfilment of the requirements for the Bachelor of Arts
(Honours) in Human Resource Management, 2011.
School of Business
National College of Ireland
2011
Norma Smurfit Library
National College of Ireland
Research Students’ Declaration Form
(Thesis/Author Declaration Form)
Name: Fiona Vale
Student Number: x03285308
Degree for which thesis is submitted: BA (Hons) in HRM
Material submitted for award
(a) I declare that the work has been composed by me.
(b) I declare that all verbatim extracts contained in the thesis have been distinguished by
quotation marks and the sources of information specifically acknowledged.
(c) My thesis will be included in electronic format in the College Institutional Repository
TRAP (thesis reports and projects)
(d) I declare that no material contained in the thesis has been used in any other submission
for an academic award.
Signature of research student: _____________________________________
Date: _____________________
i
ABSTRACT
The term ‘employee engagement’ is relatively new with the concept introduced by Kahn in
1990 as ‘personal engagement’ and ‘personal disengagement’. Despite increasing interest
(Frauenheim, 2009; Kular et al, 2008; Robertson-Smith and Markwick, 2009; Saks, 2006;
Shuck and Wollard, 2010) there is still no clear definition of the term and little academic
research has been carried out (Saks, 2006).
Numerous professional firms such as Gallup, Towers Perrin, BlessingWhite, ASTD and the
Conference Board have carried out studies of employee engagement over the past number of
years. Research by these firms has shown a correlation between employee engagement and
profit (Harter et al, 2002; Harter et al, 2009; Towers Perrin, 2008). Towers Perrin’s 2007-
2008 global workforce study showed that operating income increased by 19% over one year
in firms with high employee engagement (Towers Perrin, 2008).
The purpose of this research is to measure levels of employee engagement and to add to the
existing knowledge pool of academic research on the topic of employee engagement.
A quantitative questionnaire replication of the Gallup Q12®
workplace audit was selected for
the purpose of data collection for this review given its validity and reliability (Harter et al,
2009).
Gallup’s Q12®
workplace audit states that only highly engaged employees will respond in
strong agreement to each of twelve statements (Forbringer, 2002). The findings did not
ii
demonstrate a higher level of engagement to what was anticipated based on Towers Perrin’s
2007-2008 Global Workforce Study where engagement levels provided were at 21%. The
engagement levels found in this research report were at 18.3%, just below that level. Towers
Perrin categorises employees as ‘enrolled’ where they are capable but not fully engaged
(Towers Perrin, 2008). This category represented 32.7% of respondents to the online survey.
The remainder, the ‘disenchanted’ or disengaged made up 46.4% of respondents.

ACKNOWLEDGEMENTS
Thanks to Patricia Power (PhD), Sarah Barry and Rebecca Towers without whose support this
project may not have been completed. Thanks also to Susann Prenderville for her good
humour over the past four years of Saturdays – we finally made it! I owe a debt of gratitude to
my colleagues who participated in this year’s research as well as last year’s; thank you!
TABLE OF CONTENTS
CHAPTER 1: INTRODUCTION ............................................................................................... 1
1.1 Introduction.............................................................................................................. 1
1.2 What exactly is employee engagement? .................................................................. 1
1.3 Why be concerned with employee engagement?..................................................... 2
1.4 Previous research on employee engagement ........................................................... 2
1.5 Research strategies used to date .............................................................................. 3
1.6 Intended outcome of this research ........................................................................... 3
1.7 Limitations ............................................................................................................... 3
1.8 Delimitations............................................................................................................ 4
1.9 Structure of the report .............................................................................................. 4
CHAPTER 2: LITERATURE REVIEW .................................................................................... 5
2.1 Introduction.............................................................................................................. 5
2.2 Definition(s) of employee engagement ................................................................... 5
2.3 Researchers of employee engagement ..................................................................... 6
2.4 Opposing views from ‘burnout’ researchers............................................................ 8
2.5 Conclusion ............................................................................................................... 9
CHAPTER 3: METHODOLOGY ............................................................................................ 10
3.1 Introduction............................................................................................................ 10
3.2 Paradigm Assessment and statement ..................................................................... 10
3.3 Methodological strategy ........................................................................................ 10
3.3.1 Research purpose ......................................................................................... 11
3.3.2 Process .......................................................................................................... 11
3.3.3 Site and population ....................................................................................... 12
3.3.4 Sampling ...................................................................................................... 12
3.3.5 Research strategy ......................................................................................... 12
3.3.6 Logic ............................................................................................................ 14
3.3.7 Outcome ....................................................................................................... 14
3.4 Data collection methods ........................................................................................ 15
3.5 Trust ....................................................................................................................... 15
3.6 Bias (and solution) ................................................................................................. 15
3.7 Ethics ..................................................................................................................... 16
3.8 Data analysis .......................................................................................................... 16
3.9 Analysis strategy .................................................................................................... 16
3.10 Reason for selection the Gallup Q12®
workplace audit .......................................... 17
3.11 Design of the Q12
survey........................................................................................ 17
CHAPTER 4: RESULTS ......................................................................................................... 18
4.1 Introduction............................................................................................................ 18
4.2 Sample population ................................................................................................. 18
4.3 Return rate ............................................................................................................. 19
4.4 Completion rate ..................................................................................................... 19
4.5 Initial findings ........................................................................................................ 19
4.5.1 Introductory section of the survey questionnaire ......................................... 20
4.6 Gallup Q12®
statements .......................................................................................... 26
4.6.1 Overall satisfaction ....................................................................................... 26
4.6.2 Question nine: Change in satisfaction .......................................................... 27
4.6.3 The twelve Gallup Q12®
statements .............................................................. 28
4.7 Cross-tabulated responses ...................................................................................... 35
4.7.1 Cross-tabulation across gender .................................................................... 36
4.7.2 Cross-tabulation of age groups ..................................................................... 40
4.7.3 Cross-tabulation against length of service ................................................... 49
CHAPTER 5: DISCUSSION ................................................................................................... 57
5.1 Introduction............................................................................................................ 57
5.2 Analysis of findings against Forbringer’s 4 levels ................................................ 57
5.2.1 Level 1: “What do I get?” ............................................................................ 57
5.2.2 Level 2: “What do I give?” .......................................................................... 58
5.2.3 Level 3: “Do I belong here?” ....................................................................... 59
5.2.4 Level 4: “How can we all grow?” ................................................................ 61
5.3 Correlation of findings to engagement .................................................................. 62
5.4 Analysis of findings against research .................................................................... 62
5.5 Possible shortcomings to the research ................................................................... 64
5.6 Research limitations............................................................................................... 65
5.7 Possible directions for future research ................................................................... 65
CHAPTER 6: CONCLUSION ................................................................................................. 66
6.1 Introduction............................................................................................................ 66
6.2 Engagement levels of respondents......................................................................... 66
6.3 Future focus for managers ..................................................................................... 66
6.4 Future focus for research ....................................................................................... 66
CHAPTER 7: REFERENCES / BIBLIOGRAPHY ................................................................. 68
CHAPTER 8: APPENDICES ................................................................................................... 71
8.1 Appendix 1: Communication to participants ......................................................... 71
8.2 Appendix 2: Survey questionnaire......................................................................... 72
8.3 Appendix 3: Copy of responses ............................................................................. 78
LIST OF ILLUSTRATIONS
Figure 4:1 – Question one: Gender........................................................................................... 20
Figure 4:2 – Question two: Age group ..................................................................................... 21
Figure 4:3 – Question three: Length of service ........................................................................ 22
Figure 4:4 – Question four: Role type ...................................................................................... 23
Figure 4:5 – Question eight: Satisfaction with company ......................................................... 27
Figure 4:6 – S1: Expectation at work ....................................................................................... 28
Figure 4:7 – S2: Necessary materials and equipment .............................................................. 29
Figure 4:8 – S3: Opportunity to do your best ........................................................................... 29
Figure 4:9 – S4: Recognition or praise received ...................................................................... 30
Figure 4:10 – S5: Caring .......................................................................................................... 30
Figure 4:11 – S6: Encouragement ............................................................................................ 31
Figure 4:12 – S7: My opinion is counted ................................................................................. 31
Figure 4:13 – S8: Company mission impact on role ................................................................ 32
Figure 4:14 – S9: Colleagues’ commitment ............................................................................. 32
Figure 4:15 – S10: Best friend at work..................................................................................... 33
Figure 4:16 – S11: Progress review .......................................................................................... 34
Figure 4:17 – S12: Opportunities to learn and grow ................................................................ 34
Figure 4:18 – Cross-tabulation of male respondents ................................................................ 36
Figure 4:19 – Cross-tabulation of female respondents ............................................................. 38
Figure 4:20 – Cross-tabulation of age group 20-29 .................................................................. 41
Figure 4:21 – Cross-tabulation of age group 30-39 .................................................................. 43
Figure 4:22 – Cross-tabulation of age group 40-49 .................................................................. 45
Figure 4:23 – Cross-tabulation of age group 50+ ..................................................................... 47
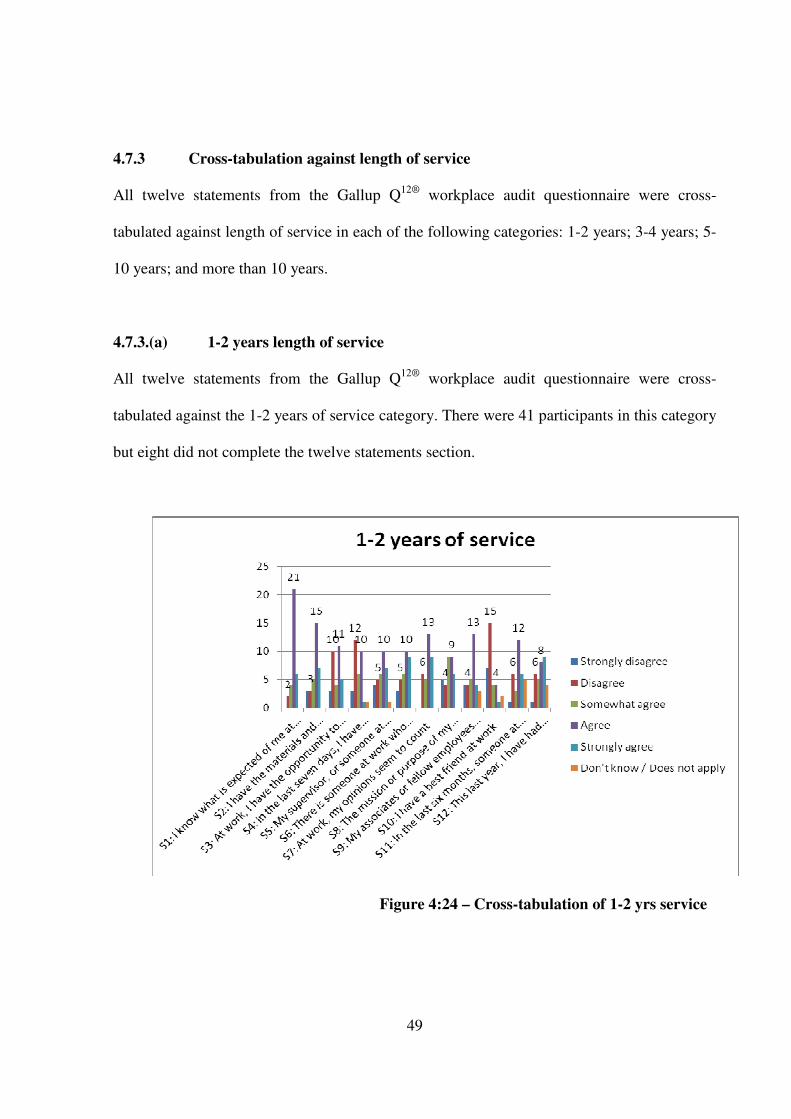
Figure 4:24 – Cross-tabulation of 1-2 yrs service .................................................................... 49
Figure 4:25 – Cross-tabulation of 3-4 yrs service .................................................................... 51
Figure 4:26 – Cross-tabulation of 5-10 yrs service .................................................................. 53
Figure 4:27 – Cross-tabulation of 10+ yrs service ................................................................... 55
LIST OF TABLES
Table 4:1 – Question one: Gender ............................................................................................ 21
Table 4:2 – Question two: Age group ...................................................................................... 22
Table 4:3 – Question three: Length of service ......................................................................... 23
Table 4:4 – Question four: Role type ....................................................................................... 24
Table 4:5 – Question five: Corporate title ................................................................................ 24
Table 4:6 – Question six: Job location ..................................................................................... 25
Table 4:7 – Question seven: ‘Other’ role type ......................................................................... 25
Table 4:8 – Question eight: Satisfaction with company ........................................................... 27
Table 4:9 – Participant number within age groups ................................................................... 35
Table 4:10– Participant number against length of service ....................................................... 35
Table 4:11 – Participant number within gender ....................................................................... 35
Table 4:12 – Cross-tabulation of male participants .................................................................. 37
Table 4:13 – Cross-tabulation of female respondents .............................................................. 39
Table 4:14 – Cross-tabulation of age group 20-29 ................................................................... 42
Table 4:15 – Cross-tabulation of age group 30-39 ................................................................... 44
Table 4:16 – Cross-tabulation of age group 40-49 ................................................................... 46
Table 4:17 – Cross-tabulation of age group 50+ ...................................................................... 48
Table 4:18 – Cross-tabulation of 1-2 yrs service ...................................................................... 50
Table 4:19 – Cross-tabulation of 3-4 yrs service ...................................................................... 52
Table 4:20 – Cross-tabulation of 5-10 yrs service .................................................................... 54
Table 4:21 – Cross-tabulation of 10+ yrs service ..................................................................... 56
Table 5:1 – Mean % average for 12 statements ....................................................................... 62
1
CHAPTER 1: INTRODUCTION
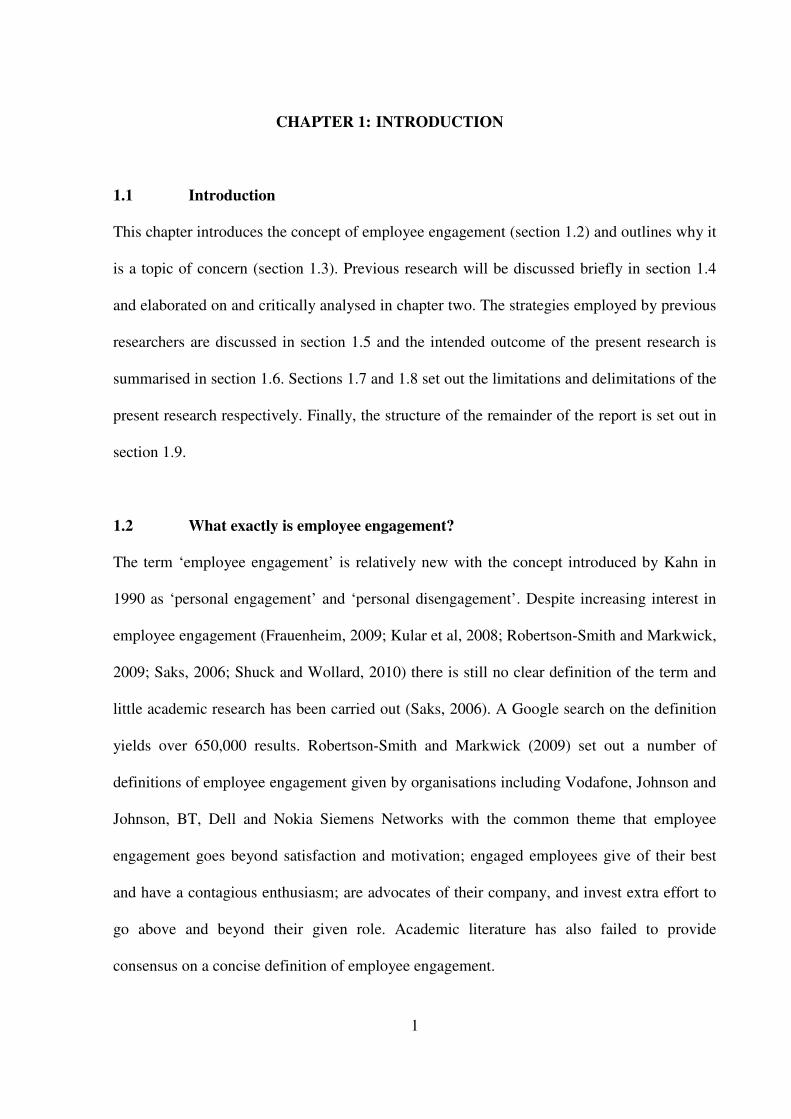
1.1 Introduction
This chapter introduces the concept of employee engagement (section 1.2) and outlines why it
is a topic of concern (section 1.3). Previous research will be discussed briefly in section 1.4
and elaborated on and critically analysed in chapter two. The strategies employed by previous
researchers are discussed in section 1.5 and the intended outcome of the present research is
summarised in section 1.6. Sections 1.7 and 1.8 set out the limitations and delimitations of the
present research respectively. Finally, the structure of the remainder of the report is set out in
section 1.9.
1.2 What exactly is employee engagement?
The term ‘employee engagement’ is relatively new with the concept introduced by Kahn in
1990 as ‘personal engagement’ and ‘personal disengagement’. Despite increasing interest in
employee engagement (Frauenheim, 2009; Kular et al, 2008; Robertson-Smith and Markwick,
2009; Saks, 2006; Shuck and Wollard, 2010) there is still no clear definition of the term and
little academic research has been carried out (Saks, 2006). A Google search on the definition
yields over 650,000 results. Robertson-Smith and Markwick (2009) set out a number of
definitions of employee engagement given by organisations including Vodafone, Johnson and
Johnson, BT, Dell and Nokia Siemens Networks with the common theme that employee
engagement goes beyond satisfaction and motivation; engaged employees give of their best
and have a contagious enthusiasm; are advocates of their company, and invest extra effort to
go above and beyond their given role. Academic literature has also failed to provide
consensus on a concise definition of employee engagement.
2
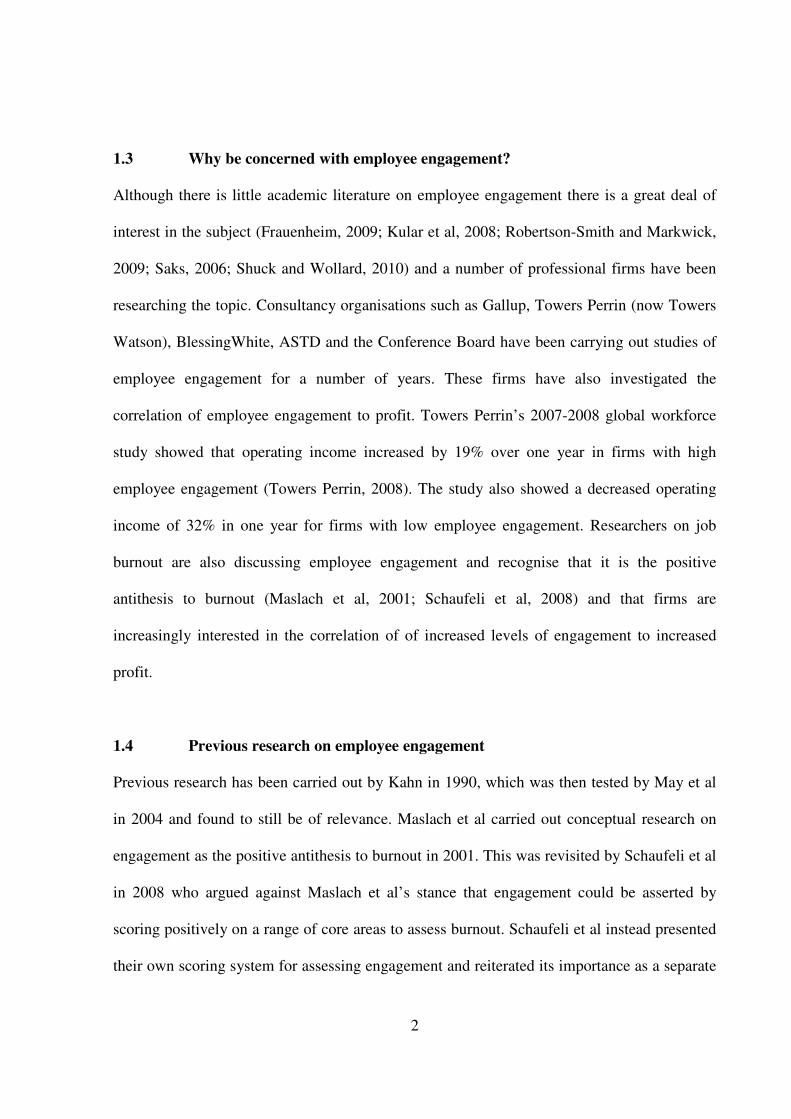
1.3 Why be concerned with employee engagement?
Although there is little academic literature on employee engagement there is a great deal of
interest in the subject (Frauenheim, 2009; Kular et al, 2008; Robertson-Smith and Markwick,
2009; Saks, 2006; Shuck and Wollard, 2010) and a number of professional firms have been
researching the topic. Consultancy organisations such as Gallup, Towers Perrin (now Towers
Watson), BlessingWhite, ASTD and the Conference Board have been carrying out studies of
employee engagement for a number of years. These firms have also investigated the
correlation of employee engagement to profit. Towers Perrin’s 2007-2008 global workforce
study showed that operating income increased by 19% over one year in firms with high
employee engagement (Towers Perrin, 2008). The study also showed a decreased operating
income of 32% in one year for firms with low employee engagement. Researchers on job
burnout are also discussing employee engagement and recognise that it is the positive
antithesis to burnout (Maslach et al, 2001; Schaufeli et al, 2008) and that firms are
increasingly interested in the correlation of of increased levels of engagement to increased
profit.
1.4 Previous research on employee engagement
Previous research has been carried out by Kahn in 1990, which was then tested by May et al
in 2004 and found to still be of relevance. Maslach et al carried out conceptual research on
engagement as the positive antithesis to burnout in 2001. This was revisited by Schaufeli et al
in 2008 who argued against Maslach et al’s stance that engagement could be asserted by
scoring positively on a range of core areas to assess burnout. Schaufeli et al instead presented
their own scoring system for assessing engagement and reiterated its importance as a separate
3
concept (Schaufeli et al, 2008). Harter et al (2002) conducted an empirical analysis across
more than 7,000 business units in multiple industries and were among the first to set out the
link between profit and engagement. Further empirical research was carried out by Saks in
2006. Saks’ research represented the first academic research to test the consequences to
employee engagement.
1.5 Research strategies used to date
To date, a number of consultancy firms have researched the topic of employee engagement by
carrying out surveys as well as correlating levels of engagement to profitability but little
academic research has been carried out (Saks, 2006). Five empirical reviews and three
conceptual reviews were identified by Shuck and Wollard (2010) as having posed a major
contribution to the field of Human Resource Development. Each defined employee
engagement differently although there is a common theme among them of going beyond
satisfaction and presenting a positive attitude and enthusiasm (Shuck and Wollard, 2010).
1.6 Intended outcome of this research
The intended outcome of the current research is to add to the knowledge creation process
already in existence in the field of employee engagement and to the level of academic
research on the topic.
1.7 Limitations
The initial research location for this report was a Dublin-based firm due to lack of access to
employees in other companies. The survey was initially sent to 52 employees within the firm.
In order to widen the participant pool, given the number of Ireland-based employees, the
4
survey questionnaire used in the research was also made available via three Internet locations.
Due to the relatively low number of people surveyed (the survey was made available to 860
people out of an employee population in Ireland of almost two million (Central Statistics
Office, 2010), the results of this research may not be directly applicable to all Ireland-based
employees or companies. Given the usage of the Internet as a source of data collection, the
survey was also available to employees working outside of Ireland. As such, the results may
further be inapplicable to Ireland-based companies.
1.8 Delimitations
The research undertaken for the purpose of this report was restricted to workers. Those who
were previously in employment were not asked to complete the survey although their
feedback may have proved useful in terms of gaining a better understanding into the reasons
behind their current unemployment status (redundancy or natural attrition, student, person
outside the labour force (e.g. home-maker)).
1.9 Structure of the report
This chapter introduced the topic of the research report and outlined its importance, previous
researchers, research strategies used to date in understanding the topic and the limitations and
delimitations of the current research. An outline of the research methodology was put forward
as was the intended outcome of the report. Chapter two provides a detailed review of the
guiding literature consulted for the purpose of this research. Chapter three outlines the
methodology. Chapter four sets out the results of the current research which are discussed in
detail in chapter five. Chapter six provides a conclusion to the research report and is followed
by a bibliography and appendices relevant to the current research.
5
CHAPTER 2: LITERATURE REVIEW
2.1 Introduction
Although there is little academic literature on employee engagement there is a great deal of
interest in the subject (Kular et al, 2008) and a number of professional firms such as Gallup,
Towers Perrin, BlessingWhite, ASTD and the Conference Board have carried out studies of
employee engagement over the past number of years. Research by these firms has shown a
correlation between employee engagement and profit (Harter et al, 2002; Harter et al, 2009;
Towers Perrin, 2008). Towers Perrin’s 2007-2008 global workforce study showed that
operating income increased by 19% over one year in firms with high employee engagement
(Towers Perrin, 2008). The study also showed a decreased operating income of 32% in one
year for firms with low employee engagement.
Despite the interest of professional firms, there is a paucity of academic research available on
the topic of engagement (Shuck and Wollard, 2010). Five empirical reviews and three
conceptual reviews were identified by Shuck and Wollard (2010) as having posed a major
contribution to the field of Human Resource Development. Each defined employee
engagement differently although there is a common theme among them of going beyond
satisfaction and presenting a positive attitude and enthusiasm (Shuck and Wollard, 2010).
2.2 Definition(s) of employee engagement
The term ‘employee engagement’ is relatively new with the concept introduced by Kahn in
1990 as ‘personal engagement’ and ‘personal disengagement’ during a study into the
psychological conditions associated with the degree to which people engage or disengage
6
themselves in their roles. Despite increasing interest in employee engagement (Frauenheim,
2009; Kular et al, 2008; Robertson-Smith and Markwick, 2009; Saks, 2006; Shuck and
Wollard, 2010) there is no clear definition of the term. A Google search on the definition
yields over 650,000 results. Robertson-Smith and Markwick (2009) set out a number of
definitions of employee engagement given by organisations including Vodafone, Johnson and
Johnson, BT, Dell and Nokia Siemens Networks. The common theme among these definitions
was that employee engagement goes beyond satisfaction and motivation; that engaged
employees give of their best and have a contagious enthusiasm; they are advocates of their
company, investing extra effort to go above and beyond their given role. The companies
reviewed by Robertson-Smith and Markwick also stated that engaged employees remain
longer with the company, add value and help increase and sustain productivity. The
companies focused on the beneficial outcomes of employee engagement to the organisation
but did not suggest any drivers for such engagement. Academic literature has also failed to
provide consensus on a concise definition of employee engagement.
2.3 Researchers of employee engagement
Research on employee engagement commenced with Kahn in 1990 and his findings were then
tested by May et al in 2004 and found to still be of relevance. Maslach et al carried out
conceptual research on engagement as the positive antithesis to burnout in 2001. This was
revisited by Schaufeli et al in 2008 who argued against Maslach et al’s stance that
engagement could be asserted by scoring positively on a range of core areas to assess burnout.
Schaufeli et al instead presented their own scoring system for assessing engagement and
reiterated its importance as a separate concept (Schaufeli et al, 2008). Harter et al (2002)
conducted an empirical analysis across more than 7,000 business units in multiple industries
7
and were among the first to set out the link between profit and engagement. Further empirical
research was carried out by Saks in 2006. Saks’ research represented the first academic
research to test the consequences to employee engagement.
Kahn (1990) introduced the concept of employee engagement as a standalone concept and
conducted empirical research with 16 summer camp counsellors and 16 employees of an
architecture firm. This was the first empirical research carried out in the field on the topic of
employee engagement. Kahn introduced the first definition of employee engagement, or
personal engagement, as “the harnessing of organization members’ selves to their work roles”
(Kahn, 1990) and described how engaged employees “employ and express themselves
physically, cognitively, and emotionally” in their work. Disengagement was also introduced
by Kahn who defined it as “the uncoupling of selves from work roles” whereby employees set
back and rather than express themselves they “defend themselves physically, cognitively, or
emotionally” in the work (Kahn, 1990). Kahn found that there were three psychological
conditions which influenced both engagement and disengagement: meaningfulness, safety,
and availability. The Gallup Organisation’s Q12
workplace audit looks at similar conditions of
employee’s needs (safety); their understanding of what is expected and thought of them
(safety); their fit to the organisation (meaningfulness); and their opportunity for self-
development (availability). May, Gilson & Harter (2004) carried out the first empirical study
to test Kahn’s 1990 concepts of employee engagement through an empirical survey of almost
200 employees in a US insurance company and found that all three of the psychological
conditions Kahn outlined “were important in determining one’s engagement at work” (May,
Gilson & Harter, 2004; Shuck & Wollard, 2010).
8
Harter, Schmidt & Hayes (2002) examined the correlation between profit and engagement
through an empirical meta-analysis across 7,939 business units in 36 companies. This
empirical research has been replicated and has continued to show a correlation between
increased profit and high levels of employee engagement. Following this, an empirical
research study was carried out by the American Society for Training and Development
(‘ASTD’) and conducted by Czarnowsky (2008) to investigate how organisations are
addressing employee engagement. The research identified work strategies which have higher
levels of influence on employee engagement and emphasised the role of learning as one such
influence.
Saks (2006) introduced the first research in academic literature by conducting an empirical
survey of 102 employees across a variety of roles in Toronto, Canada and found a difference
between job engagement and organisation engagement as well as predictors for both types of
engagement.
2.4 Opposing views from ‘burnout’ researchers
Converse views on employee engagement may be found in literature on ‘job burnout’ which
describes engagement as the “positive antithesis to job burnout” (Maslach et al, 2001).
Maslach et al argue that burnout arises when there is a mismatch within the six core areas of
“workload, control, reward, community, fairness, and values” and that engaged employees
should therefore score positively against these six areas. Maslach et al outline empirical
support for this theory carried out by Maslach & Leiter in 1997. Schaufeli (2008) agreed that
engagement was the positive antithesis of burnout but disagreed that engagement should be
assessed on the basis of scoring positively against the six areas of workload, control, reward,
9
community, fairness, and values on the Maslach Burnout Inventory Manual. Schaufeli et at
instead developed a separate scale of three measurements to assess engagement: “vigor,
dedication, and absorption” (Schaufeli, 2008).
2.5 Conclusion
Despite the volume of research from professional firms, there remains a paucity of academic
research into employee engagement and no agreed definition. It has been shown by
Robertson-Smith & Markwick (2009) that definitions provided by organisations have
commonalities such as:
• employee engagement goes beyond satisfaction and motivation;
• engaged employees give of their best and have a contagious enthusiasm;
• engaged employees are advocates of their company,
• engaged employees invest extra effort to go above and beyond their given role
The five empirical and three conceptual reviews identified by Shuck and Wollard (2010) as
having posed a major contribution to the field of Human Resource Development also had a
common theme in their definitions of employee engagement as going beyond satisfaction and
presenting a positive attitude and enthusiasm (Shuck and Wollard, 2010).
Correlation between engagement and heightened profitability and retention levels was shown
by Harter et al, 2002; Harter et al, 2009 at the individual business unit level during research
carried out on the Gallup Q12®
workplace audit.
10
CHAPTER 3: METHODOLOGY
3.1 Introduction
This chapter describes the research methodology used and explains the process of the
research: how the sample was selected, how the analysis was collected and analysed. The data
is displayed graphically and explained in chapter five. Initial findings are provided in chapter
four and discussed both within the context of their correlation to each other and to the
literature research conducted in chapter five. The reason for selecting the Gallup Q12®
workplace audit questionnaire is presented and it is broken down into four sections described
by Forbringer (2002) which will be used for data analysis in chapter five.
3.2 Paradigm Assessment and statement
The research paradigm assumption was based on the ontological assumption outlined by
Sargent in 2010 that “there is a reality that can be apprehended. We can determine “the way
things are” and, often, discover the cause effect relations behind social reality. At the least, we
can find meaningful indicators of what is “really” happening”. This is consistent with a
positivistic approach using a quantitative questionnaire to collate data for analysis.
3.3 Methodological strategy
Having selected the research paradigm, the methodological strategy to carry out the research
will now be presented. Firstly, the varying types of research applicable will be examined and
a strategy will be developed according to the philosophical paradigm with reference to the
research topic and the sample chosen for this research.
11
3.3.1 Research purpose
The purpose of this research is to measure levels of employee engagement and to add to the
existing knowledge pool of academic research on the topic of employee engagement.
A quantitative questionnaire was selected as the research type and transmitted via electronic
survey. The questionnaire is a replication of the Gallup Q12®
workplace audit. The use of an
online quantitative questionnaire seemed the most efficient method of collecting data and a
valid and reliable option. The Gallup Q12®
workplace audit has proven to be a valid
measurement instrument of employee engagement (Harter et al, 2009)
3.3.2 Process
The epistemological position of positivism was used through a deductive approach of a
quantitative questionnaire administered electronically (Bryman and Bell, 2007). The approach
is detailed hereafter and covers population, sampling, and appropriate methods. Analysis of
the quantitative data collected was also performed to validate or disprove the research
questions. The questionnaire used was that developed by the Gallup Organisation over a
period of decades (Forbringer, 2001; Harter et al, 2009). The quantitative data sought by the
questionnaire is ranked on a five-point scale where 1 represents ‘Strongly agree’ and 5
represents ‘Strongly disagree’. A sixth option of ‘Don’t know / Does not apply’ receives no
score (Harter et al, 2009). The Gallup survey has been vigorously tested over a number of
decades and refined to a limited twelve statements on employee engagement. The inclusion of
the extreme statement of ‘Strongly agree’ and ‘Strongly disagree’ is intentional as research
conducted by Gallup has shown correlation between employees who strongly agree to the
statements and higher productivity, profit and retention in those employees’ business units
12
(Forbringer, 2002). Forbringer also indicated that the statements were whittled down to
twelve on the basis that they were the items to which the most engaged employees responded
positively – other employees answered neutrally or negatively to them.
3.3.3 Site and population
The questionnaire was originally targeted via email at a population of 58 Dublin-based
employees. It was subsequently released to a wider population via three Internet locations
together capturing a potential population of 802 people, not all of whom are employed or
working in Ireland.
3.3.4 Sampling
Due to the lack of control over the participant group, it was not possible to provide a
breakdown of the population sample. The sample population is not representative of the
overall population as there are over one million employees in Ireland alone and the survey
was targeted as just 860 – not all of whom work in Ireland. The decision to increase the
sample from the initial 58 was to ensure that the participants did not form part of one single
organisation and that a more representative sample of employees could be accessed.
The average age of respondents was 30-39 (47.6%) and 57.8% were female. The average
length of service was evenly distributed between 3-4 years (27.1%) and 5-10 years (27.1%).
3.3.5 Research strategy
The research strategy adopted was the use of a quantitative questionnaire. Each participant
was separately contacted via telephone and asked for permission to include them on the
13
survey. An email was subsequently sent to the 58 initial participant group (see Appendix 1)
containing a link to the online survey. Participants were assured of the confidential nature of
the survey, which was distributed via SurveyMonkey to ensure that no email or participant
names would be collected.
The questionnaire contains an introductory section setting out the purpose of the questionnaire
and the estimated length of time it would take to complete the entire survey. It also assured
participants of the confidential nature of the survey. As previously discussed, the researcher
was unable to identify any participants as neither their name nor email address was collected.
A series of six questions was included in the introductory section so that responses could later
be cross-tabulated to enable an understanding of employee engagement across genders, age
groups and length of service. A seventh open question was included in this introductory
section for those whose role type was not listed in question four.
The main section of the questionnaire contains the Gallup Q12®
workplace audit statements.
These consist of a series of twelve statements preceded by an overall assessment of the
participant’s satisfaction with their organisation. An additional question was posed in this
survey to ask participants to comment on whether their overall satisfaction levels with their
organisation have changed since they joined and if so, how. This additional question was not
measured by the researcher but provided an interesting additional context to the overall
responses.
14
Participants were reassured before and after the data collection that their privacy is guaranteed
and that their organisation name would not be divulged. Participants were informed that they
may be identified as a group in terms of age, gender and length of service.
3.3.6 Logic
Logic refers to whether the research is inductive or deductive. “Deductive reasoning works
from the more general to the more specific. Sometimes this is informally called a "top-down"
approach” (Trochim (2006). Trochim continues by explaining inductive reasoning as working
in the opposite direction, “moving from specific observations to broader generalizations and
theories. Informally, we sometimes call this a "bottom up" approach”.
Inductive logic was used by starting with a theory about levels of employee engagement,
testing the theory by asking a series of quantitative questions via the online survey, and then
analysing the data to validate/invalidate the hypothesis.
3.3.7 Outcome
It is anticipated that the outcome of the research will add to the knowledge pool of academic
research on levels of employee engagement at the particular time that the research was
conducted. As the research is immediately out of date, it is reassuring that the quality of the
Gallup Q12®
workplace audit questionnaire is of sufficient quality and validity to be of
continued worth.
15
3.4 Data collection methods
The research used was a quantitative questionnaire with a Cronbach’s alpha of 0.91 at
business unit level and of approximately 0.70 at the true-score broader value (Harter et al,
2009). Although 0.80 is an acceptable level of internal reliability, 0.70 has been considered
acceptable by Schutte et al in terms of a replicated burnout scale (Bryman and Bell, 2007). As
burnout is often linked to employee engagement (Maslach et al, 2001; Schaufeli et al, 2008), a
Cronbach’s alpha of 0.70 was considered acceptable for the purpose of this research report.
3.5 Trust
Participants’ trust was gained for the initial target sample by clearly outlining the purpose of
the study to the participants. On request the questionnaire was treated confidentially and to
ensure this an online survey tool (SurveyMonkey) was used. SurveyMonkey provides an
option to not record any personal data, including participants’ IP addresses. The report will be
made available to the National College of Ireland for the purpose of grading and for retention
in the college library.
3.6 Bias (and solution)
Given the quantitative positivistic approach of using the questionnaire, it is anticipated that
bias will be reduced. Bias will be further reduced as the questionnaire was devised by and has
been thoroughly tested over the course of a number of decades by Gallup.
16
3.7 Ethics
The endeavours to protect any organisation’s and individual participant’s identity suggest that
due ethical consideration was given in the approach to and compilation of the research data.
3.8 Data analysis
58 surveys were sent out to Dublin-based employees. The survey was then released to a
further population of 802. 166 surveys were returned giving a return rate of 19.3%. Of 166
who commenced the survey, 152 fully completed it (91.6%). Two people skipped question 5
on corporate title from the introductory section; four people skipped question 6 from the
introductory section on job location. Five people skipped the rating question on overall
satisfaction and seven skipped the open question on whether their overall satisfaction has
changed since they joined their organisation. Twelve people skipped questions in the main
Q12®
rating section and 137 people did not make any remark in the final optional additional
comments section. The reasons for partial completion are unclear as the author was unable to
approach the participants who did not fully complete the online questionnaire due to the
inability to identify them.
3.9 Analysis strategy
The analysis strategy adopted by the author is that of a positivistic quantitative questionnaire.
Data analysis was provided both in tabular and graphical format firstly covering the
introductory section of gender; age; length of service; role type; corporate title; and job
location. The main section’s findings, the Gallup Q12®
workplace audit statements, are also
presented both graphically and in tabular format. These findings were also cross-tabulated
against the gender, age and length of service categories from the introductory section to
17
examine responses across a range of groupings. Findings for each question are discussed in
chapter five. This approach provided clearly presented findings which are easily understood
and accessible but is limited due to the small sample size of the overall population.
3.10 Reason for selection the Gallup Q12®
workplace audit
The Q12®
workplace audit was developed over a number of decades commencing in the 1950s
with a study into the factors contributing positively to work and learning environments
(Harter et al, 2009). Through a series of studies continuing through the 1980s, the survey was
reduced from 100-200 items to just thirteen statements, known as the Gallup Workplace Audit
or Q12
. The Q12
measures actionable management issues through a measurement of
engagement levels or conditions (Harter et al, 2009). Given the proven reliability and validity
of the Q12
across 169 countries worldwide it was selected as an appropriate survey to test in an
Irish setting.
3.11 Design of the Q12
survey
The survey opens with a rating of overall satisfaction with the participant’s organisation. This
is the only statement in the survey to use a separate rating scale from ‘Extremely satisfied’ to
‘Extremely dissatisfied’. The remaining 12 statements use a rating scale from ‘Strongly agree’
to ‘Strongly disagree’ and set out the employee’s needs (statements one and two); their
understanding of what is expected and thought of them (statements three to six); their fit to
the organisation (statements seven to ten); and their opportunity for self-development
(statements eleven and twelve). Forbringer (2002) sets out these four elements as stages on a
metaphorical mountain climb and further analysis of the application of his research questions
will be conducted in chapter five.
18
CHAPTER 4: RESULTS
4.1 Introduction
This chapter sets out the sample population surveyed for this research report as well as the
related return and completion rates. Initial findings from the survey are then presented in the
form of both tabular and graphical format. Following the initial findings, responses to the
Gallup Q12®
statements are set out. The responses were then cross-tabulated across age group,
length of service and gender. Findings to this cross-tabulation exercise are presented in
section 4.7 and are discussed in the next chapter.
4.2 Sample population
The survey was made available to a population of 860 people both in Ireland and overseas via
direct email (Ireland – 58 employed people) and the Internet (the remaining 802 people, both
employed and unemployed; living in Ireland and overseas). Of the 802 people it was made
available to on the Internet, some are not in employment and therefore would not have been
eligible to complete the survey. This figure of ineligible people is currently unknown and the
return rate, discussed in the next section, assumes all 860 people to be eligible.
The sample population is not representative of the overall population of employees in Ireland.
Rather, it represents less than 1% of the overall labour force of 1.8 million (Central Statistics
Office, 2010). Compounding this small sample size is the usage of the Internet as a source of
data collection. This ensured that the survey was available not only to employees working in
Ireland but also to those outside of Ireland. As such, despite the validity of the results it
19
cannot be asserted that they are representative of Ireland-based employees and companies but
rather are representative of a minute percentage (0.4%) of targeted employees.
4.3 Return rate
Of a total population of 860, 166 surveys were returned giving a return rate of 19.3%.
Although it is known that a section of the total population was ineligible due to either living
overseas or to being unemployed, the exact percentage is not known and the return rate was
therefore calculated based on the total population rather than on an uncertain lower figure.
4.4 Completion rate
Of 166 who commenced the survey, 152 fully completed it (91.6%). Two people skipped
question 5 on corporate title from the introductory section; four people skipped question 6
from the introductory section on job location. Five people skipped the rating question on
overall satisfaction and seven skipped the open question on whether their overall satisfaction
has changed since they joined their organisation. Twelve people skipped questions in the main
Q12®
rating section and 137 people did not make any remark in the final optional additional
comments section.
4.5 Initial findings
The findings to the individual questions are set out below in sections 4.5.1 through to 4.5.3.
The results were also cross-tabulated and the findings of this further analysis are set out in
section 4.6.
20
4.5.1 Introductory section of the survey questionnaire
The introductory section of the survey questionnaire sets out the purpose of the questionnaire
and the estimated length of time it would take to complete the entire survey. It also assured
participants of the confidential nature of the survey. The researcher was unable to identify any
participants as neither their name nor email address was collected. A series of six questions
was included in the introductory section so that responses could later be cross-tabulated to
enable an understanding of employee engagement across genders, age groups and length of
service. A seventh open question was included in this introductory section for those whose
role type was not listed in question four. The findings of the introductory section are set out
below.
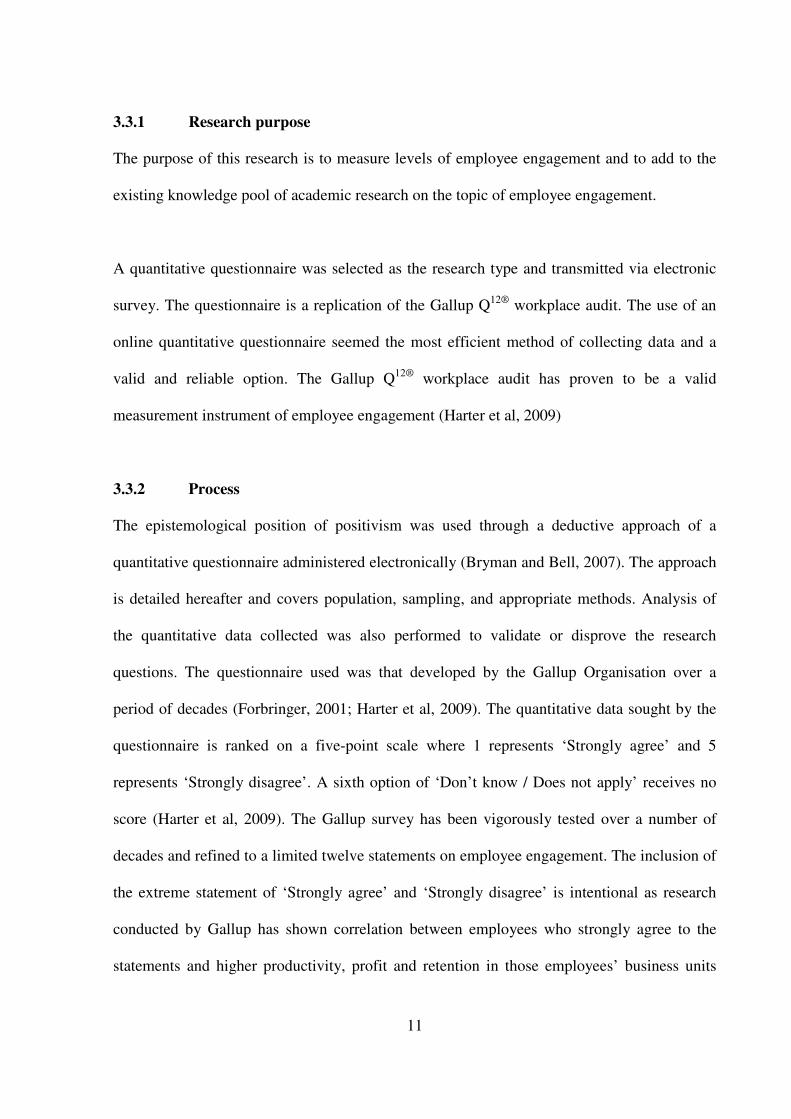
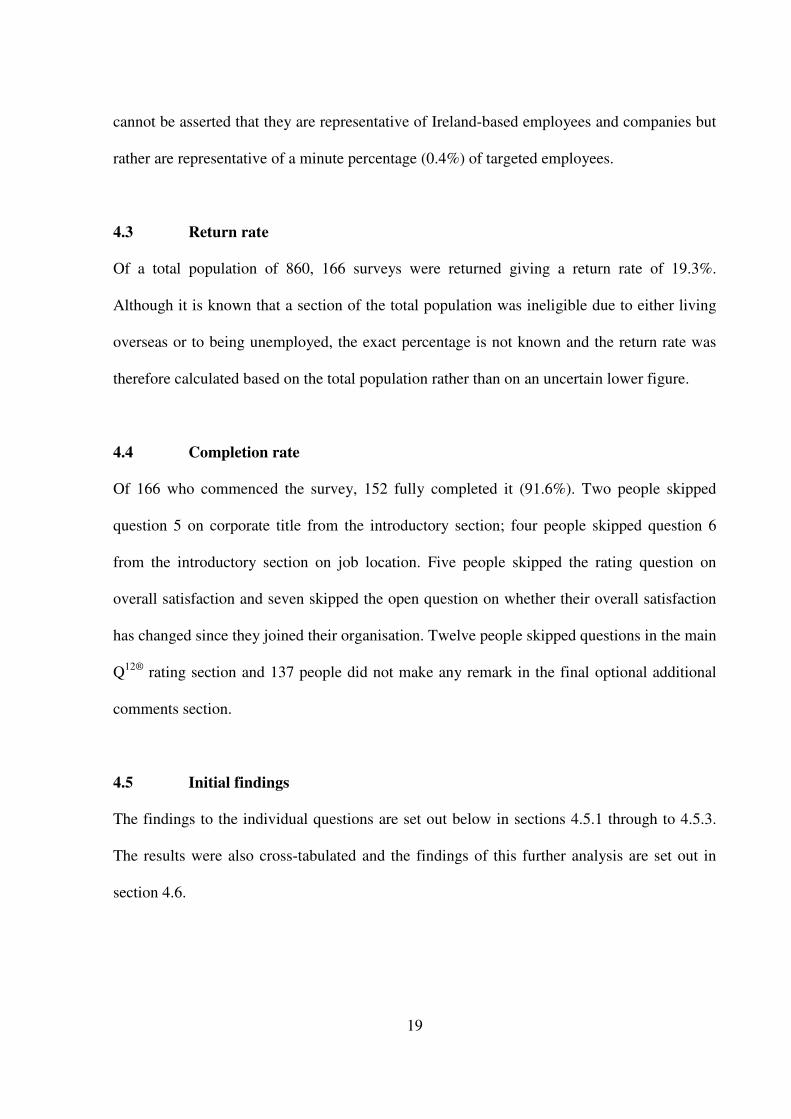
4.5.1.(a) Question one: Gender
This question was asked in order to enable cross-tabulation of results against the Gallup Q12®
statements.
Figure 4:1 – Question one: Gender
21
My gender is
Answer Options Response
Percent
Response
Count
Male 42.2% 70
Female 57.8% 96
answered question 166
skipped question 0
Table 4:1 – Question one: Gender
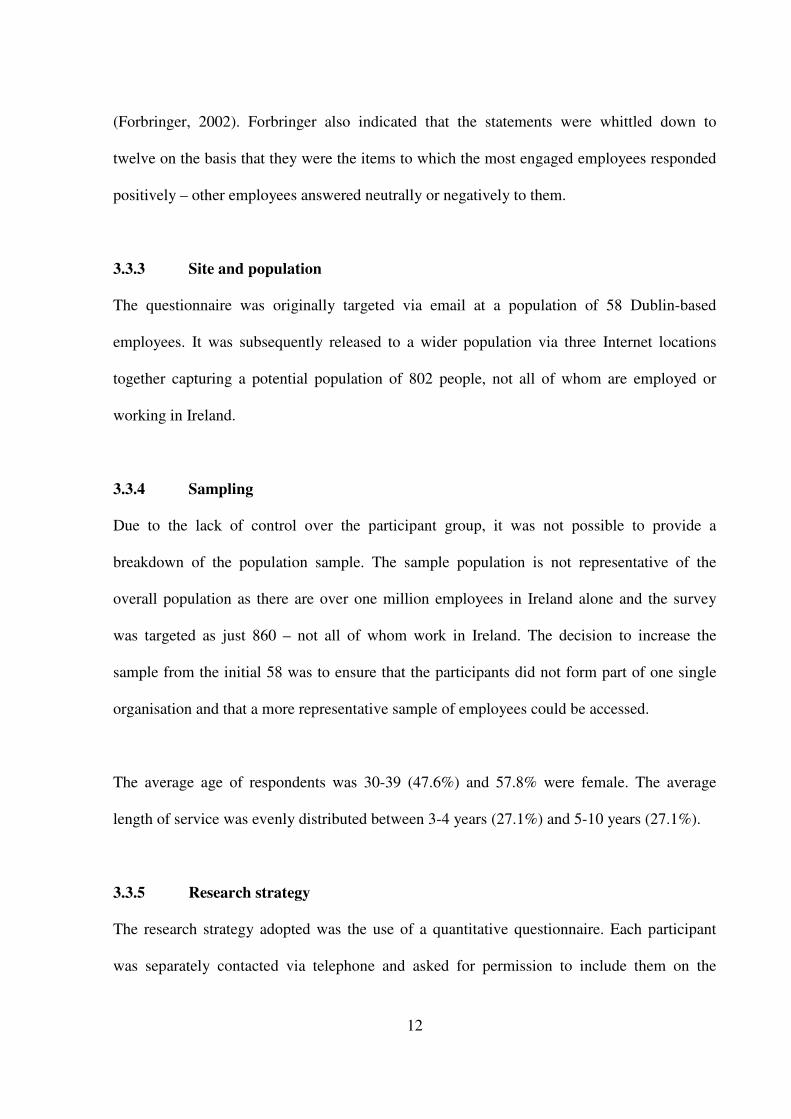
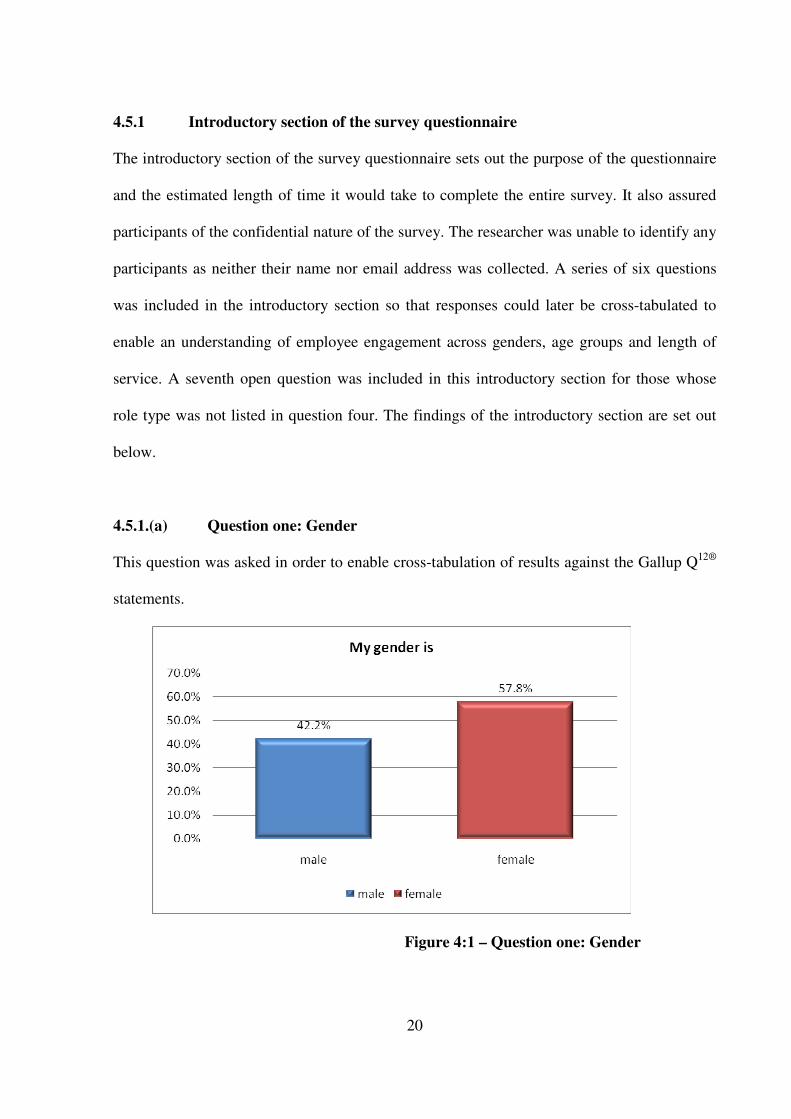
4.5.1.(b) Question two: Age group
This question was asked in order to enable cross-tabulation of results against the Gallup Q12®
statements.
Figure 4:2 – Question two: Age group
22
I am aged between
Answer Options Response
Percent
Response
Count
20-29 34.9% 58
30-39 47.6% 79
40-49 12.7% 21
50+ 4.8% 8
answered question 166
skipped question 0
Table 4:2 – Question two: Age group
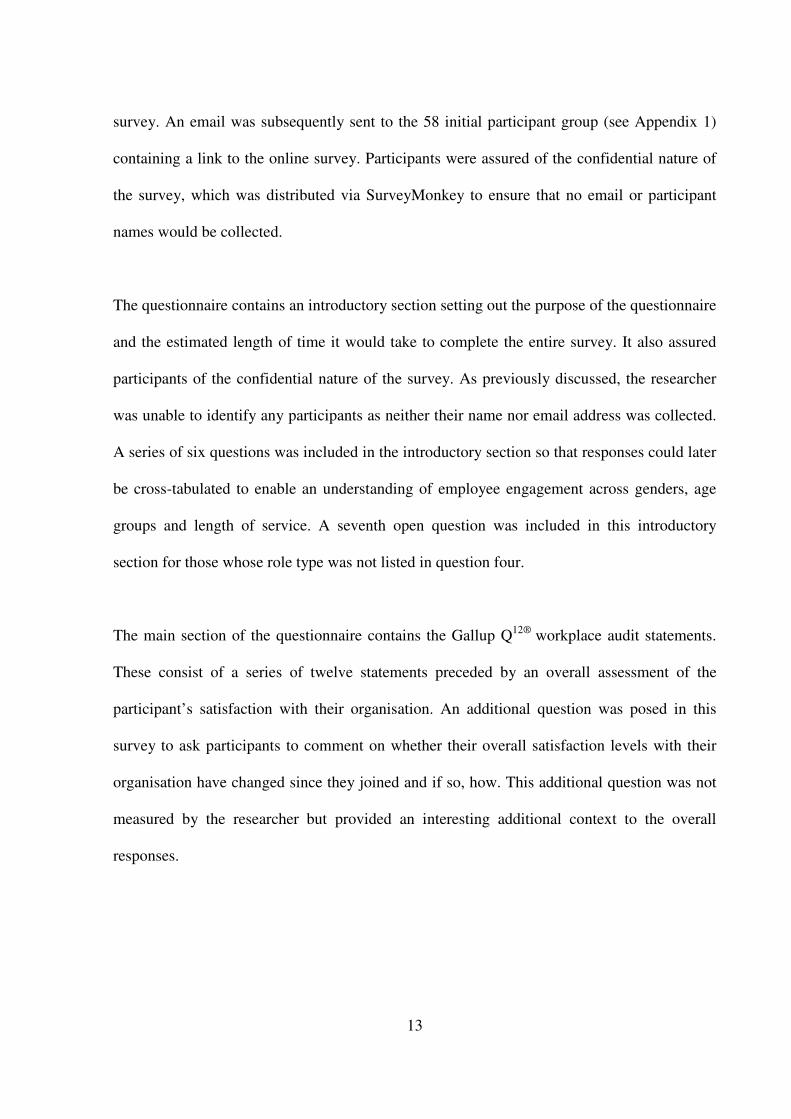
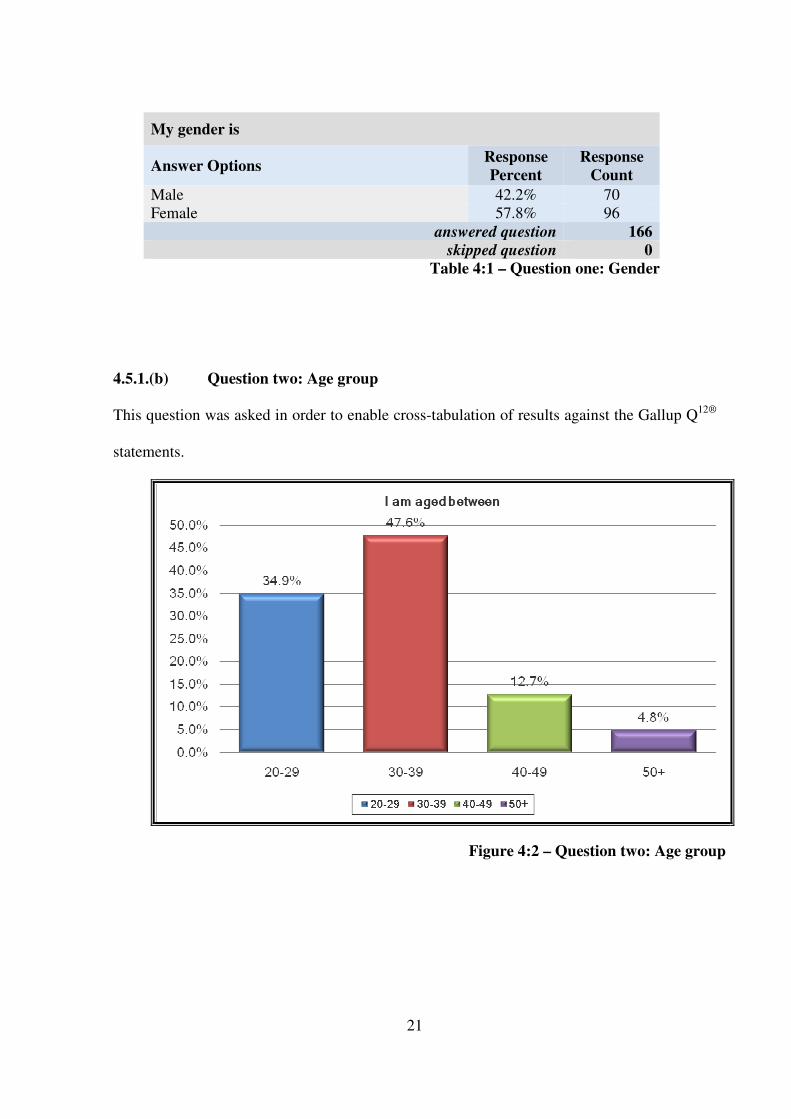
4.5.1.(c) Question three: Length of service
This question was asked in order to enable cross-tabulation of results against the Gallup Q12®
statements.
Figure 4:3 – Question three: Length of service
23
I have been with my current company for
Answer Options Response
Percent
Response
Count
1-2 years 24.7% 41
3-4 years 27.1% 45
5-10 years 27.1% 45
more than 10 years 21.1% 35
answered question 166
skipped question 0
Table 4:3 – Question three: Length of service
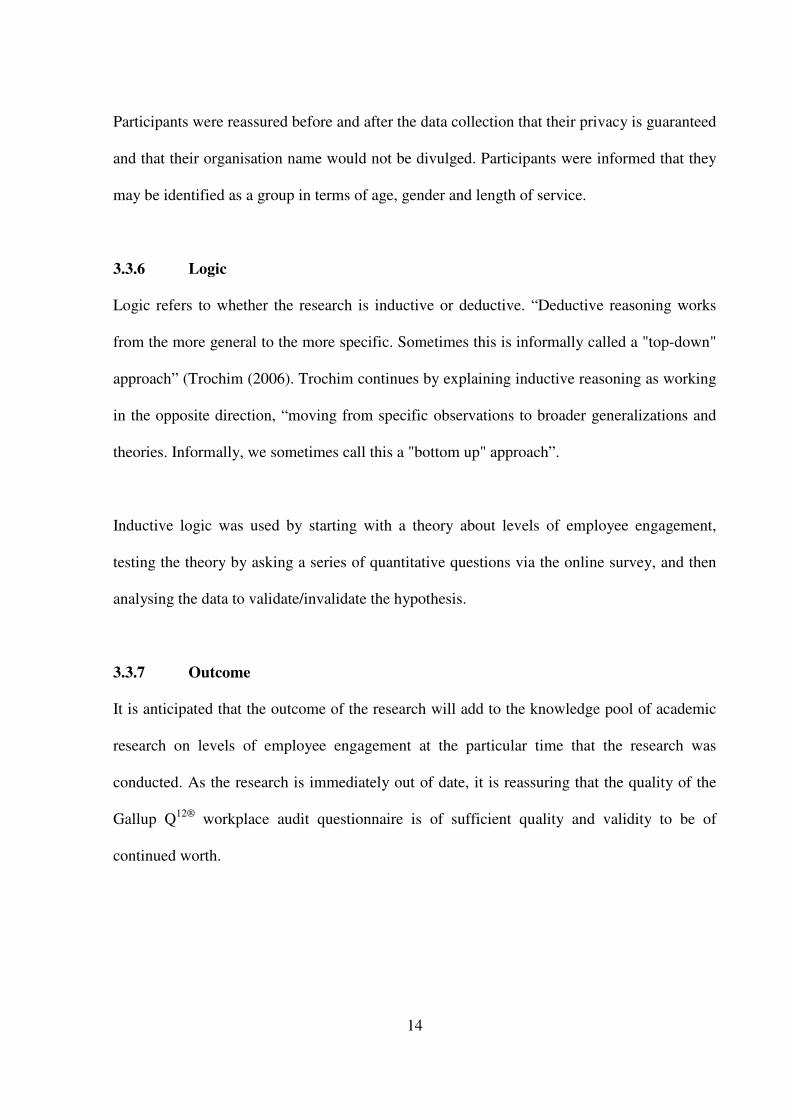
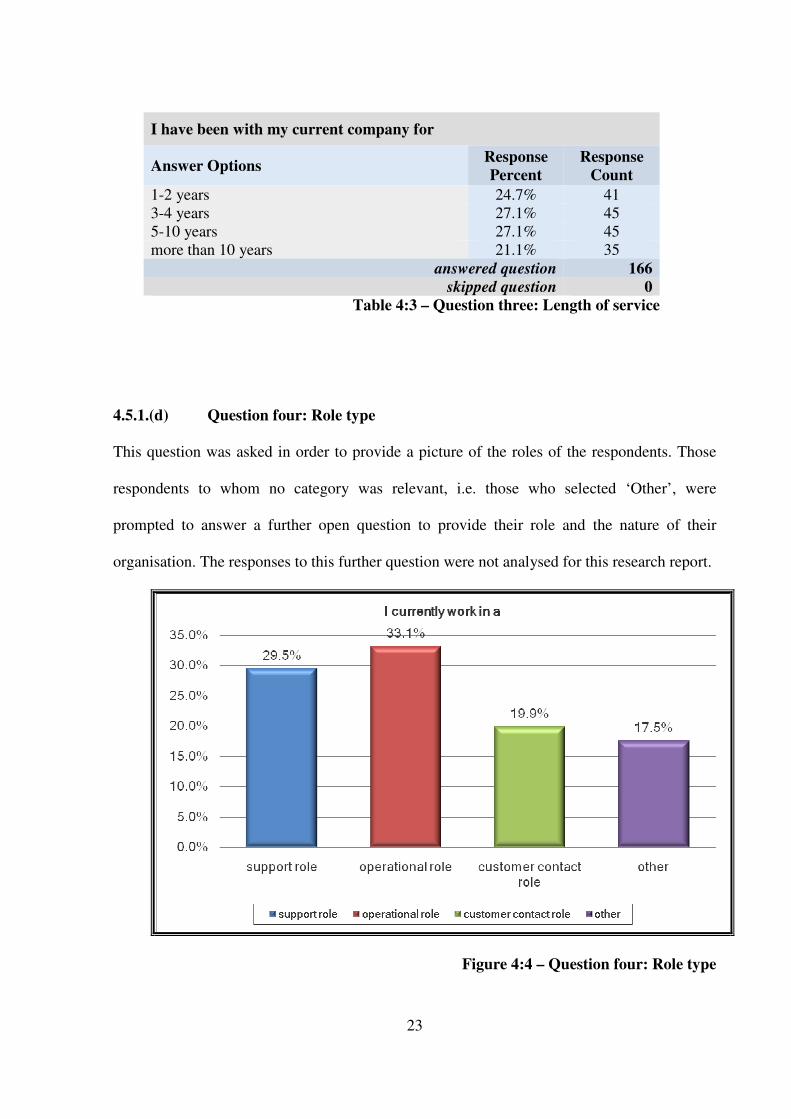
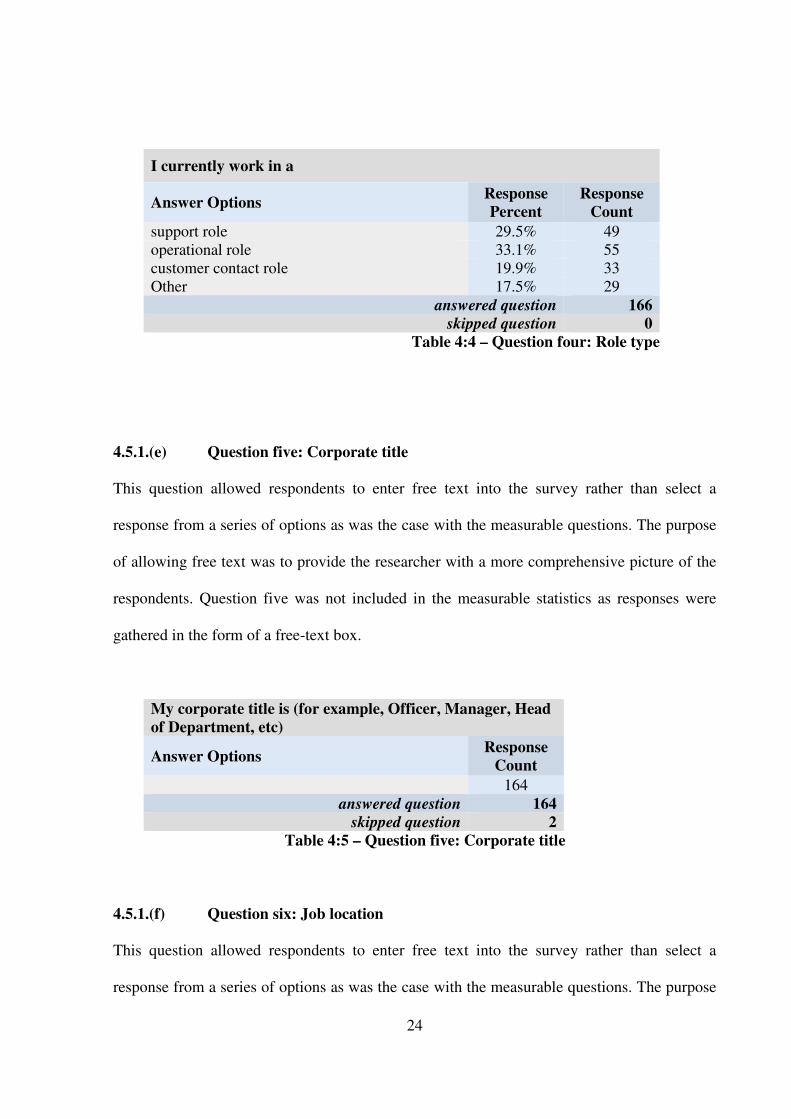
4.5.1.(d) Question four: Role type
This question was asked in order to provide a picture of the roles of the respondents. Those
respondents to whom no category was relevant, i.e. those who selected ‘Other’, were
prompted to answer a further open question to provide their role and the nature of their
organisation. The responses to this further question were not analysed for this research report.
Figure 4:4 – Question four: Role type
24
I currently work in a
Answer Options Response
Percent
Response
Count
support role 29.5% 49
operational role 33.1% 55
customer contact role 19.9% 33
Other 17.5% 29
answered question 166
skipped question 0
Table 4:4 – Question four: Role type
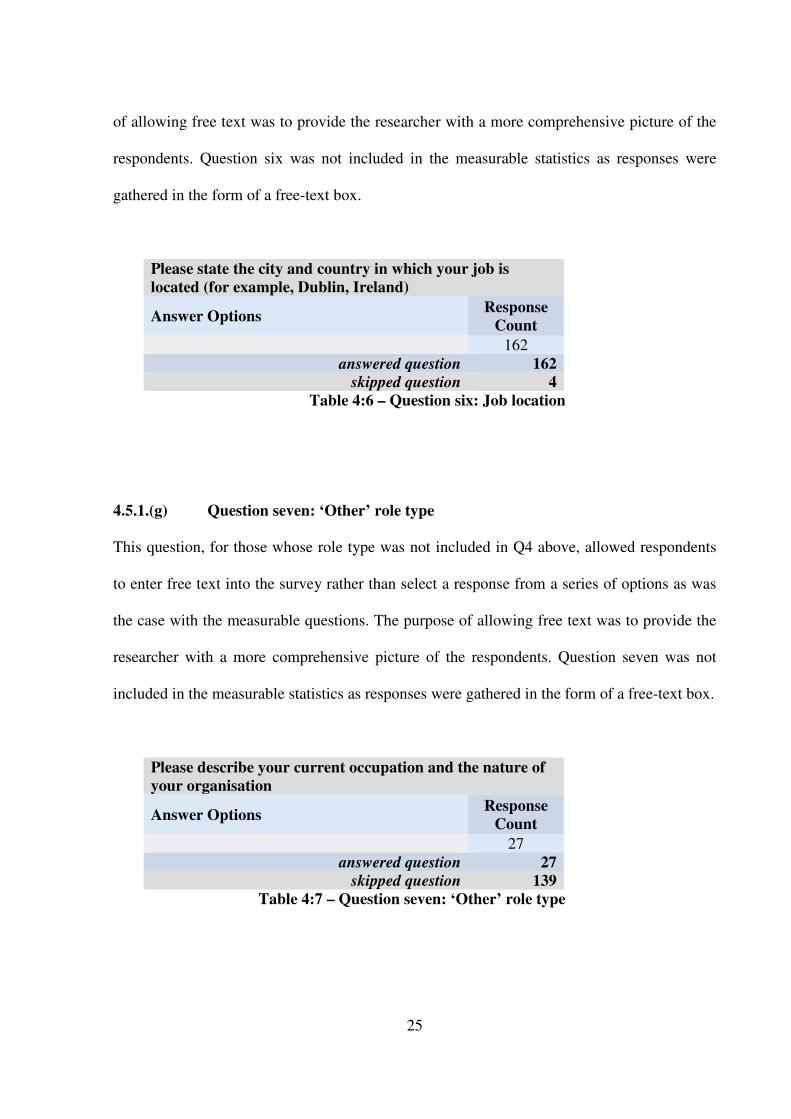
4.5.1.(e) Question five: Corporate title
This question allowed respondents to enter free text into the survey rather than select a
response from a series of options as was the case with the measurable questions. The purpose
of allowing free text was to provide the researcher with a more comprehensive picture of the
respondents. Question five was not included in the measurable statistics as responses were
gathered in the form of a free-text box.
My corporate title is (for example, Officer, Manager, Head
of Department, etc)
Answer Options Response
Count
164
answered question 164
skipped question 2
Table 4:5 – Question five: Corporate title
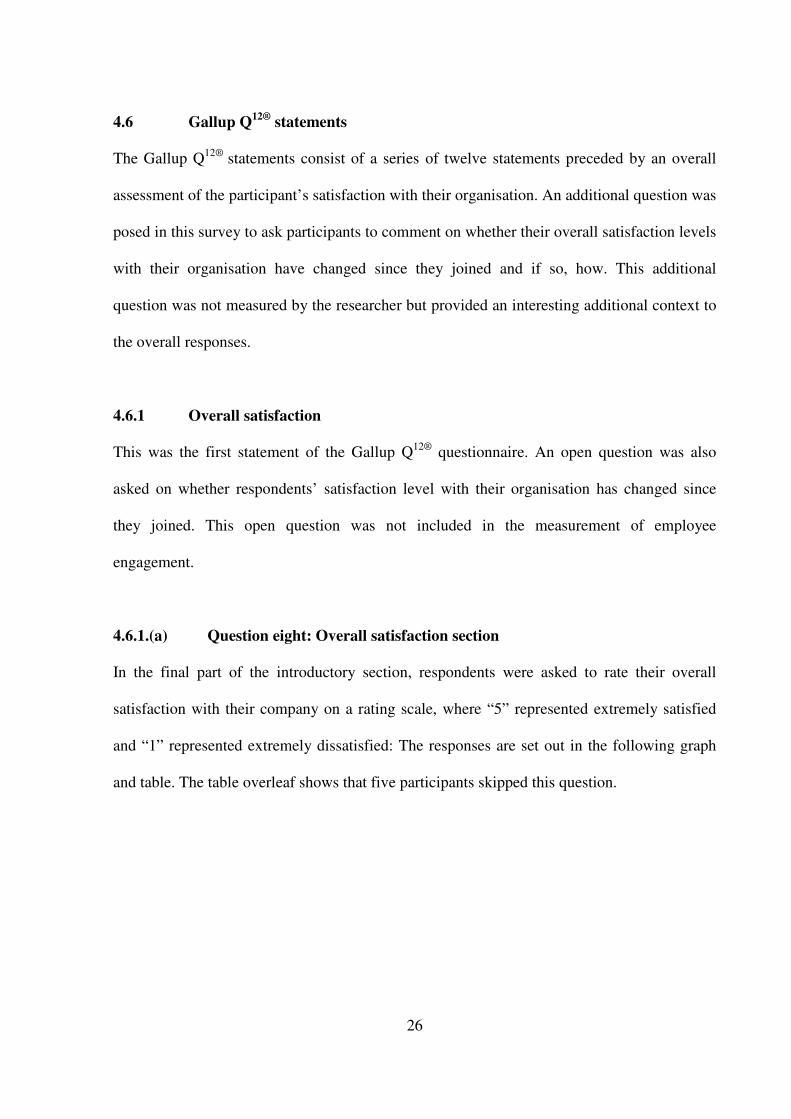
4.5.1.(f) Question six: Job location
This question allowed respondents to enter free text into the survey rather than select a
response from a series of options as was the case with the measurable questions. The purpose
25
of allowing free text was to provide the researcher with a more comprehensive picture of the
respondents. Question six was not included in the measurable statistics as responses were
gathered in the form of a free-text box.
Please state the city and country in which your job is
located (for example, Dublin, Ireland)
Answer Options Response
Count
162
answered question 162
skipped question 4
Table 4:6 – Question six: Job location
4.5.1.(g) Question seven: ‘Other’ role type
This question, for those whose role type was not included in Q4 above, allowed respondents
to enter free text into the survey rather than select a response from a series of options as was
the case with the measurable questions. The purpose of allowing free text was to provide the
researcher with a more comprehensive picture of the respondents. Question seven was not
included in the measurable statistics as responses were gathered in the form of a free-text box.
Please describe your current occupation and the nature of
your organisation
Answer Options Response
Count
27
answered question 27
skipped question 139
Table 4:7 – Question seven: ‘Other’ role type
26
4.6 Gallup Q12®
statements
The Gallup Q12®
statements consist of a series of twelve statements preceded by an overall
assessment of the participant’s satisfaction with their organisation. An additional question was
posed in this survey to ask participants to comment on whether their overall satisfaction levels
with their organisation have changed since they joined and if so, how. This additional
question was not measured by the researcher but provided an interesting additional context to
the overall responses.
4.6.1 Overall satisfaction
This was the first statement of the Gallup Q12®
questionnaire. An open question was also
asked on whether respondents’ satisfaction level with their organisation has changed since
they joined. This open question was not included in the measurement of employee
engagement.
4.6.1.(a) Question eight: Overall satisfaction section
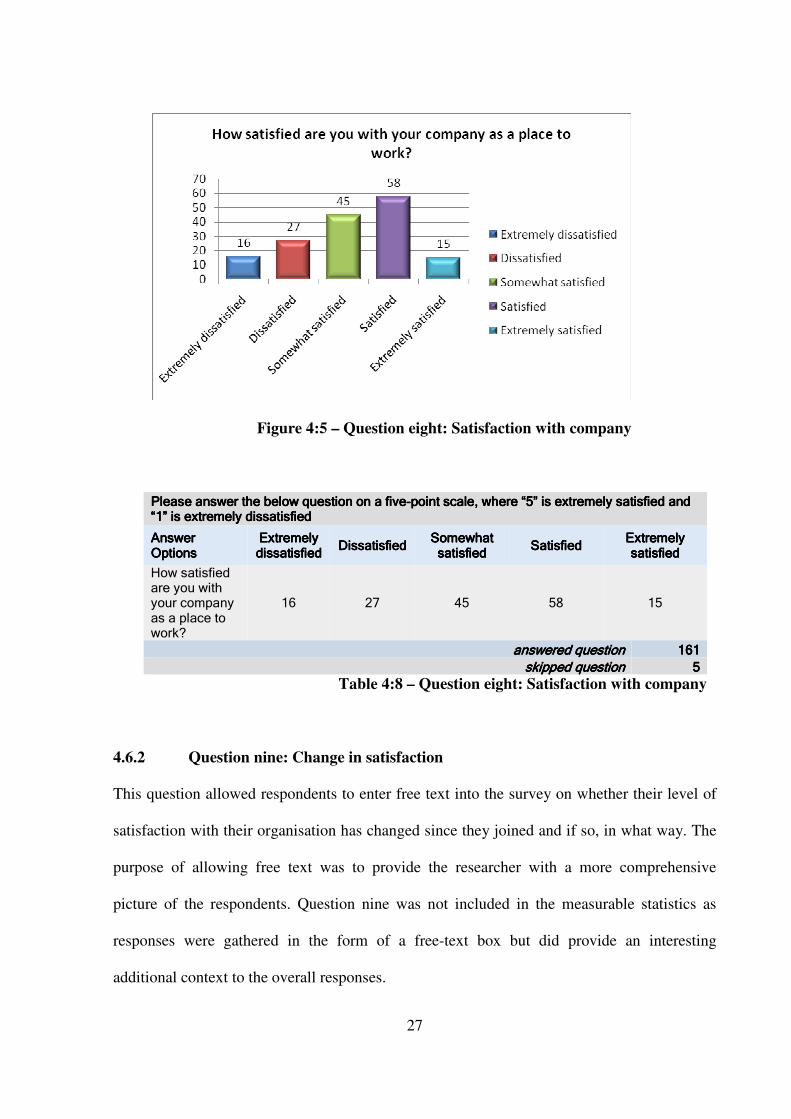
In the final part of the introductory section, respondents were asked to rate their overall
satisfaction with their company on a rating scale, where “5” represented extremely satisfied
and “1” represented extremely dissatisfied: The responses are set out in the following graph
and table. The table overleaf shows that five participants skipped this question.
27
Figure 4:5 – Question eight: Satisfaction with company
Please answer the below question on a fivePlease answer the below question on a fivePlease answer the below question on a fivePlease answer the below question on a five----point scale, where “5” is extremely satisfied and point scale, where “5” is extremely satisfied and point scale, where “5” is extremely satisfied and point scale, where “5” is extremely satisfied and “1” is extremely dissatisfied“1” is extremely dissatisfied“1” is extremely dissatisfied“1” is extremely dissatisfied
Answer Answer Answer Answer OptionsOptionsOptionsOptions
Extremely Extremely Extremely Extremely dissatisfieddissatisfieddissatisfieddissatisfied
DissatiDissatiDissatiDissatisfiedsfiedsfiedsfied Somewhat Somewhat Somewhat Somewhat satisfiedsatisfiedsatisfiedsatisfied
SatisfiedSatisfiedSatisfiedSatisfied Extremely Extremely Extremely Extremely satisfiedsatisfiedsatisfiedsatisfied
How satisfied are you with your company as a place to work?
16 27 45 58 15
answered questionanswered questionanswered questionanswered question 161161161161
skipped questionskipped questionskipped questionskipped question 5555
Table 4:8 – Question eight: Satisfaction with company
4.6.2 Question nine: Change in satisfaction
This question allowed respondents to enter free text into the survey on whether their level of
satisfaction with their organisation has changed since they joined and if so, in what way. The
purpose of allowing free text was to provide the researcher with a more comprehensive
picture of the respondents. Question nine was not included in the measurable statistics as
responses were gathered in the form of a free-text box but did provide an interesting
additional context to the overall responses.
28
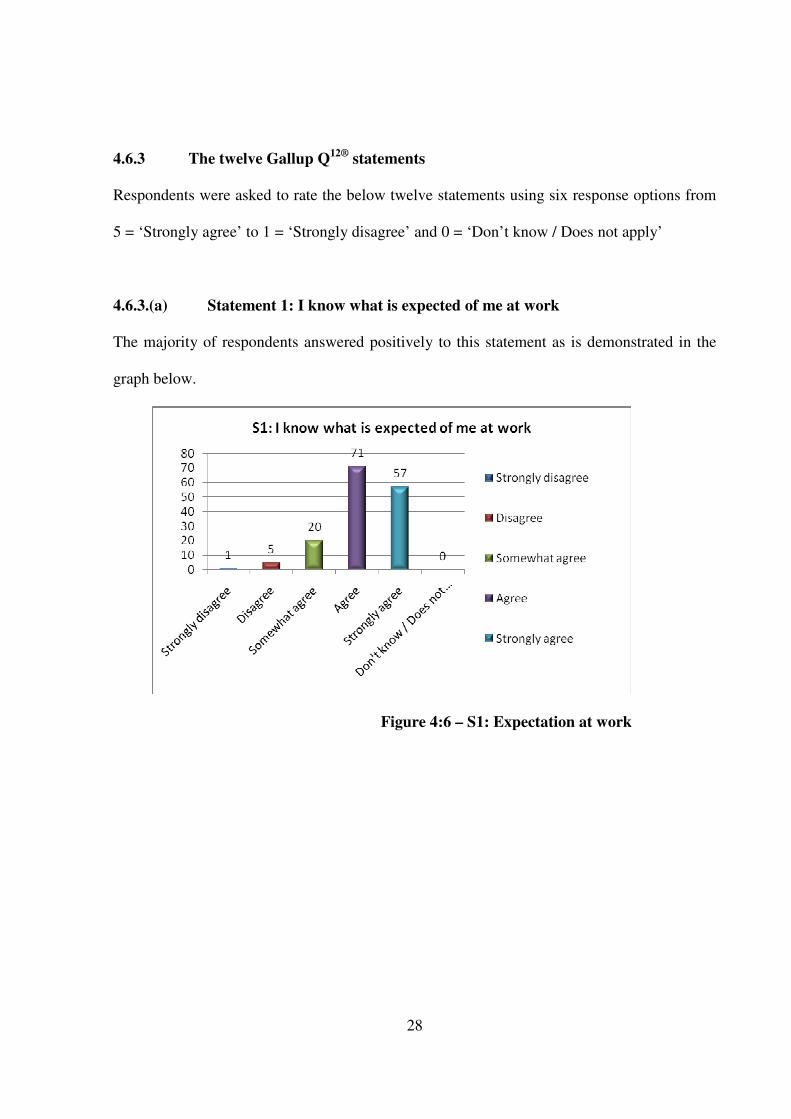
4.6.3 The twelve Gallup Q12®
statements
Respondents were asked to rate the below twelve statements using six response options from
5 = ‘Strongly agree’ to 1 = ‘Strongly disagree’ and 0 = ‘Don’t know / Does not apply’
4.6.3.(a) Statement 1: I know what is expected of me at work
The majority of respondents answered positively to this statement as is demonstrated in the
graph below.
Figure 4:6 – S1: Expectation at work
29
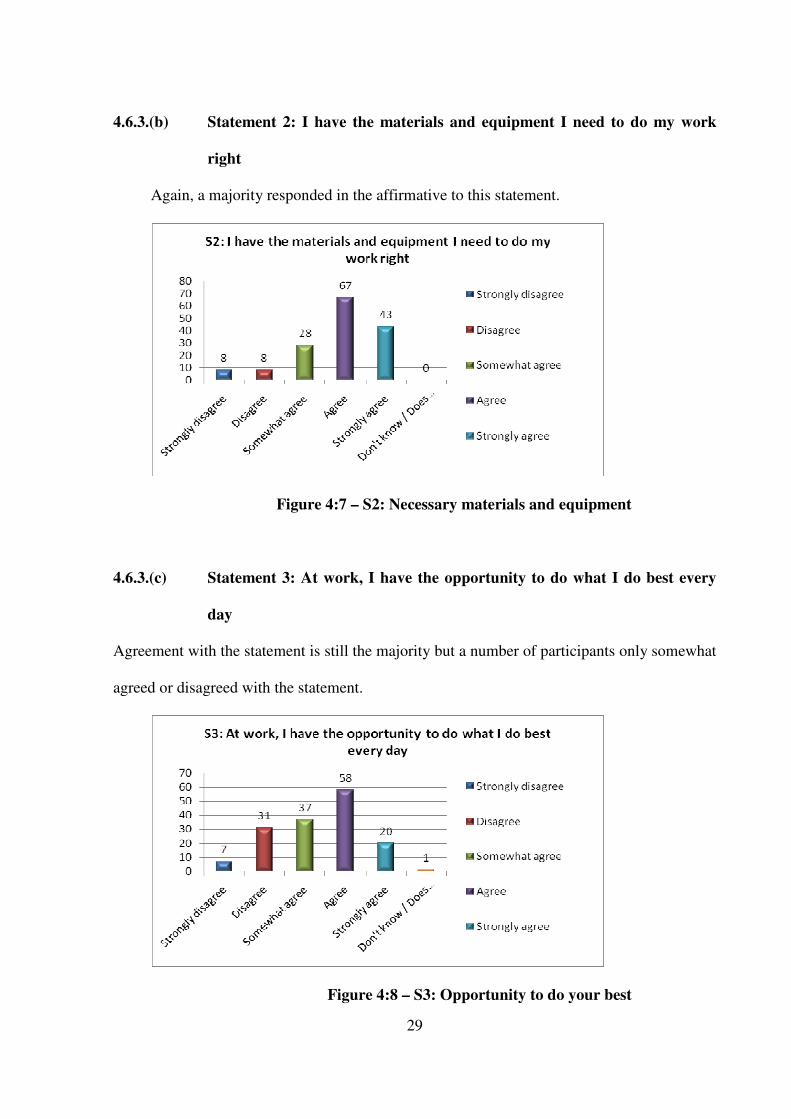
4.6.3.(b) Statement 2: I have the materials and equipment I need to do my work
right
Again, a majority responded in the affirmative to this statement.
Figure 4:7 – S2: Necessary materials and equipment
4.6.3.(c) Statement 3: At work, I have the opportunity to do what I do best every
day
Agreement with the statement is still the majority but a number of participants only somewhat
agreed or disagreed with the statement.
Figure 4:8 – S3: Opportunity to do your best
30
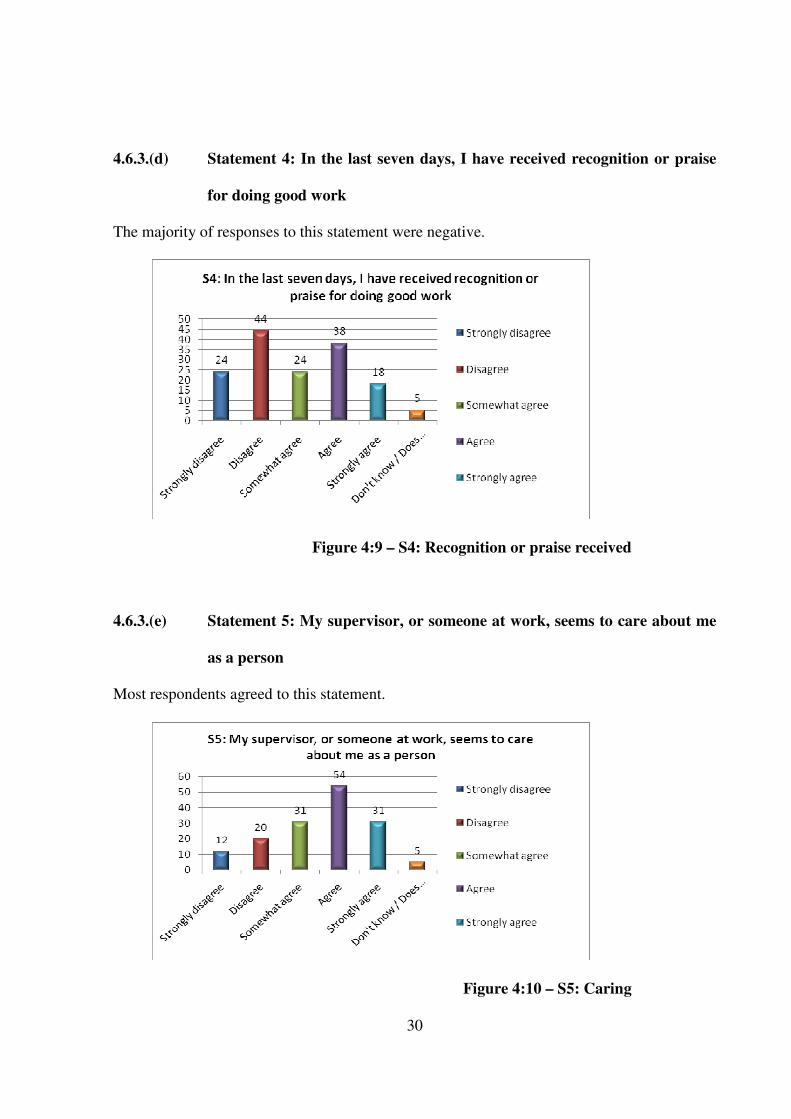
4.6.3.(d) Statement 4: In the last seven days, I have received recognition or praise
for doing good work
The majority of responses to this statement were negative.
Figure 4:9 – S4: Recognition or praise received
4.6.3.(e) Statement 5: My supervisor, or someone at work, seems to care about me
as a person
Most respondents agreed to this statement.
Figure 4:10 – S5: Caring
31
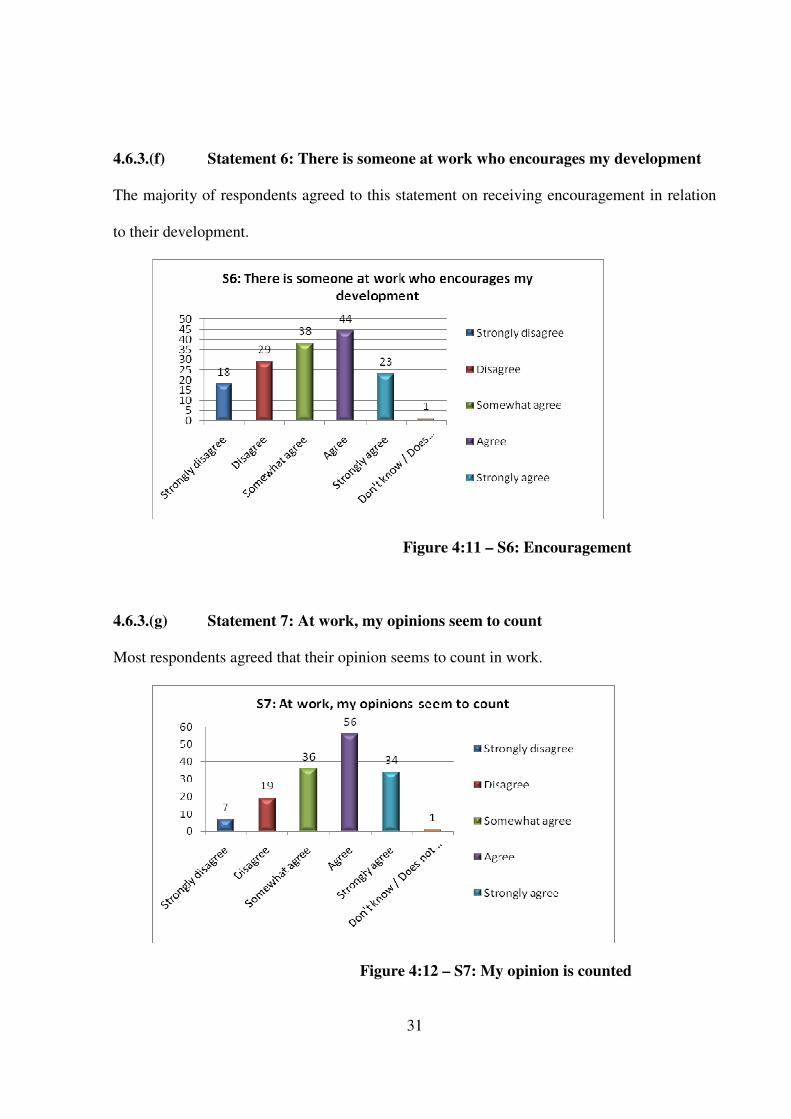
4.6.3.(f) Statement 6: There is someone at work who encourages my development
The majority of respondents agreed to this statement on receiving encouragement in relation
to their development.
Figure 4:11 – S6: Encouragement
4.6.3.(g) Statement 7: At work, my opinions seem to count
Most respondents agreed that their opinion seems to count in work.
Figure 4:12 – S7: My opinion is counted
32
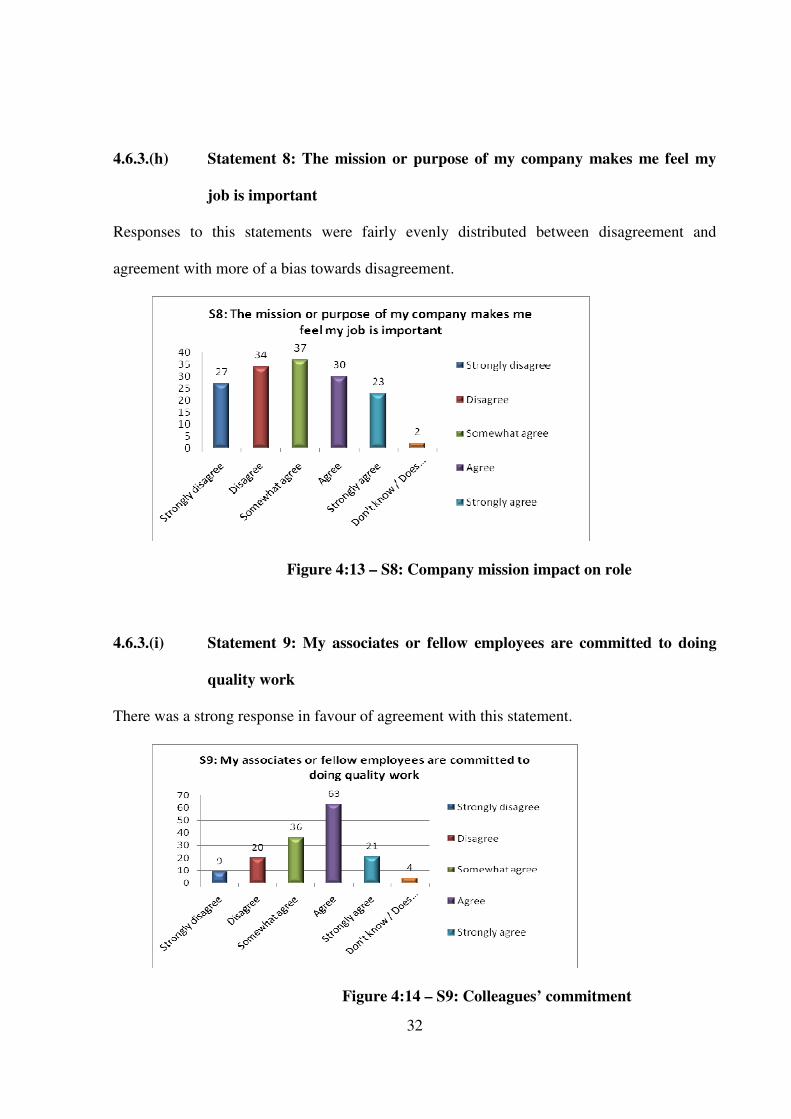
4.6.3.(h) Statement 8: The mission or purpose of my company makes me feel my
job is important
Responses to this statements were fairly evenly distributed between disagreement and
agreement with more of a bias towards disagreement.
Figure 4:13 – S8: Company mission impact on role
4.6.3.(i) Statement 9: My associates or fellow employees are committed to doing
quality work
There was a strong response in favour of agreement with this statement.
Figure 4:14 – S9: Colleagues’ commitment
33
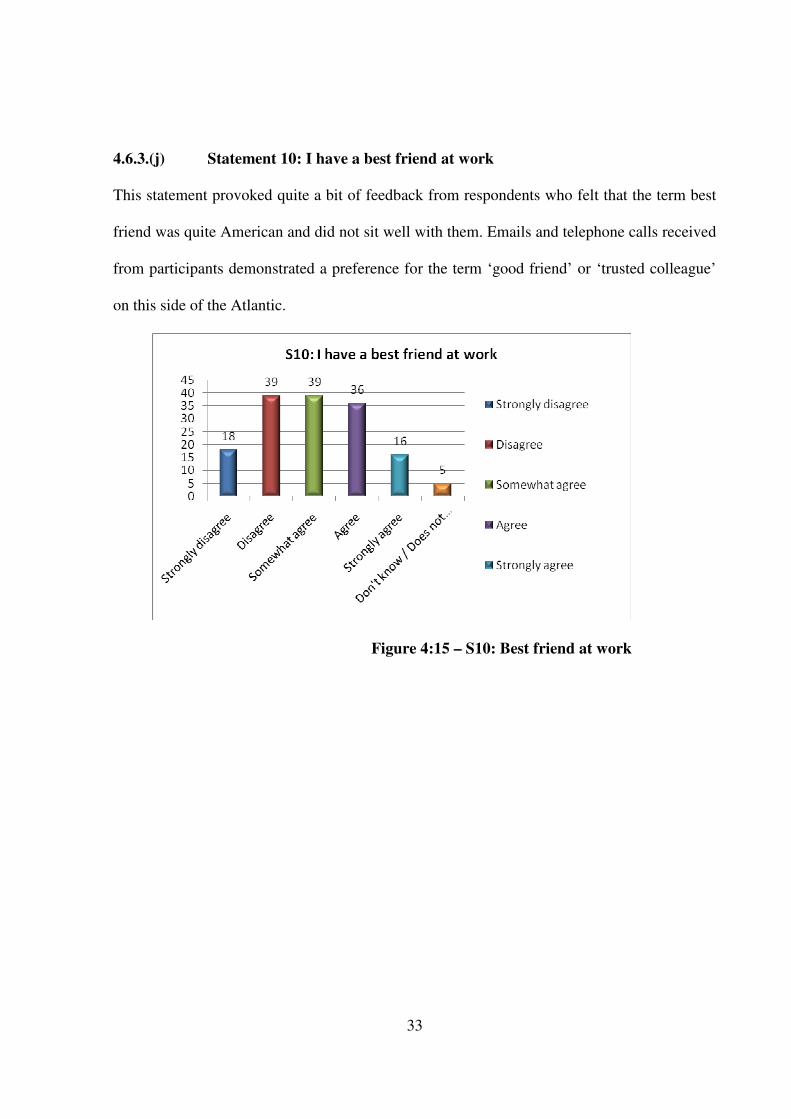
4.6.3.(j) Statement 10: I have a best friend at work
This statement provoked quite a bit of feedback from respondents who felt that the term best
friend was quite American and did not sit well with them. Emails and telephone calls received
from participants demonstrated a preference for the term ‘good friend’ or ‘trusted colleague’
on this side of the Atlantic.
Figure 4:15 – S10: Best friend at work
34
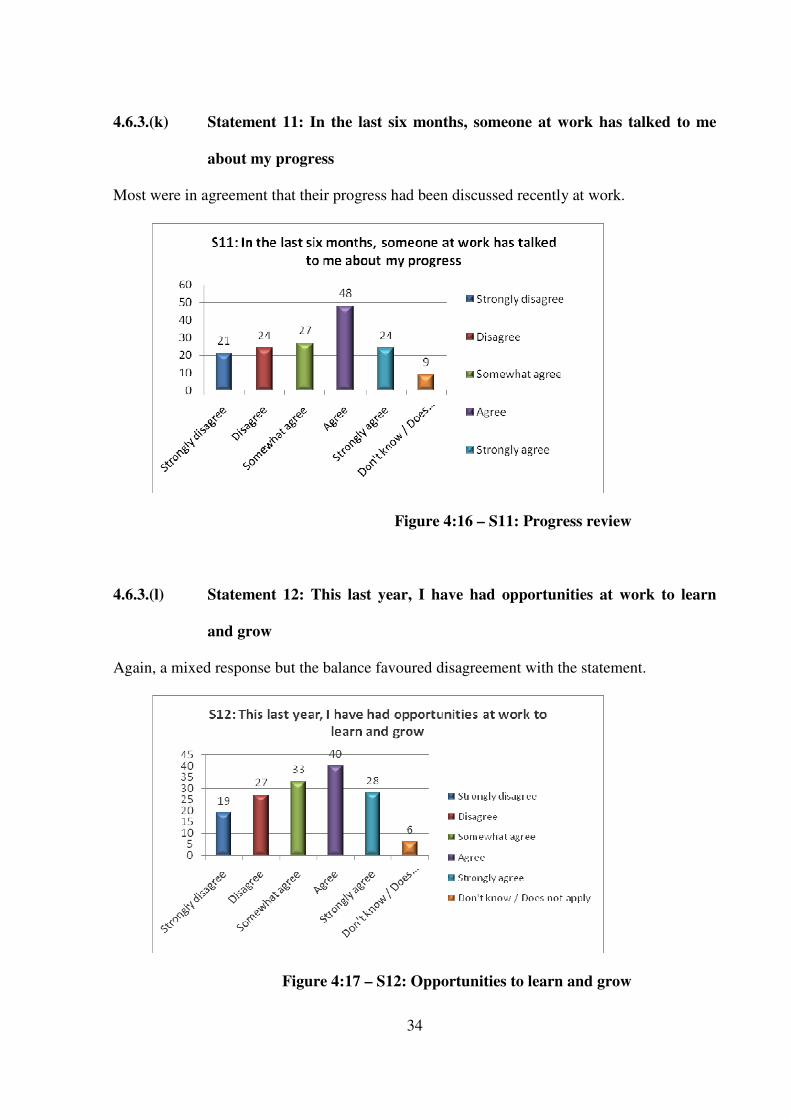
4.6.3.(k) Statement 11: In the last six months, someone at work has talked to me
about my progress
Most were in agreement that their progress had been discussed recently at work.
Figure 4:16 – S11: Progress review
4.6.3.(l) Statement 12: This last year, I have had opportunities at work to learn
and grow
Again, a mixed response but the balance favoured disagreement with the statement.
Figure 4:17 – S12: Opportunities to learn and grow
35
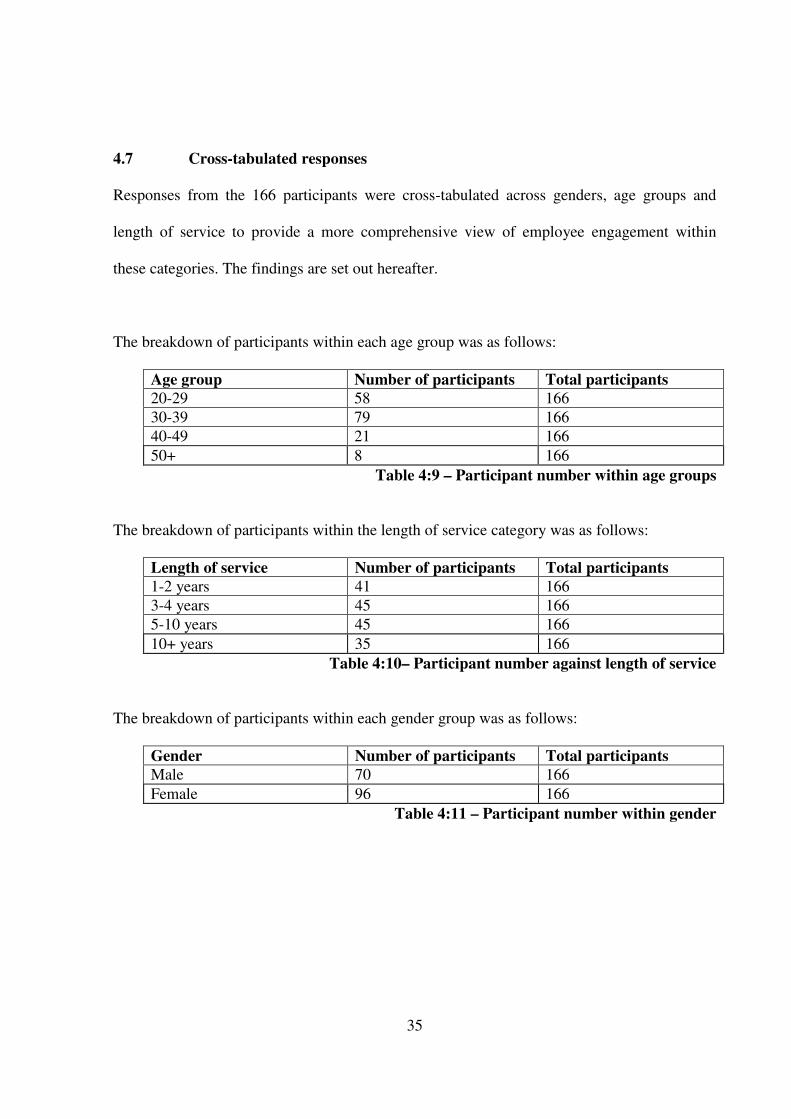
4.7 Cross-tabulated responses
Responses from the 166 participants were cross-tabulated across genders, age groups and
length of service to provide a more comprehensive view of employee engagement within
these categories. The findings are set out hereafter.
The breakdown of participants within each age group was as follows:
Age group Number of participants Total participants
20-29 58 166
30-39 79 166
40-49 21 166
50+ 8 166
Table 4:9 – Participant number within age groups
The breakdown of participants within the length of service category was as follows:
Length of service Number of participants Total participants
1-2 years 41 166
3-4 years 45 166
5-10 years 45 166
10+ years 35 166
Table 4:10– Participant number against length of service
The breakdown of participants within each gender group was as follows:
Gender Number of participants Total participants
Male 70 166
Female 96 166
Table 4:11 – Participant number within gender
36
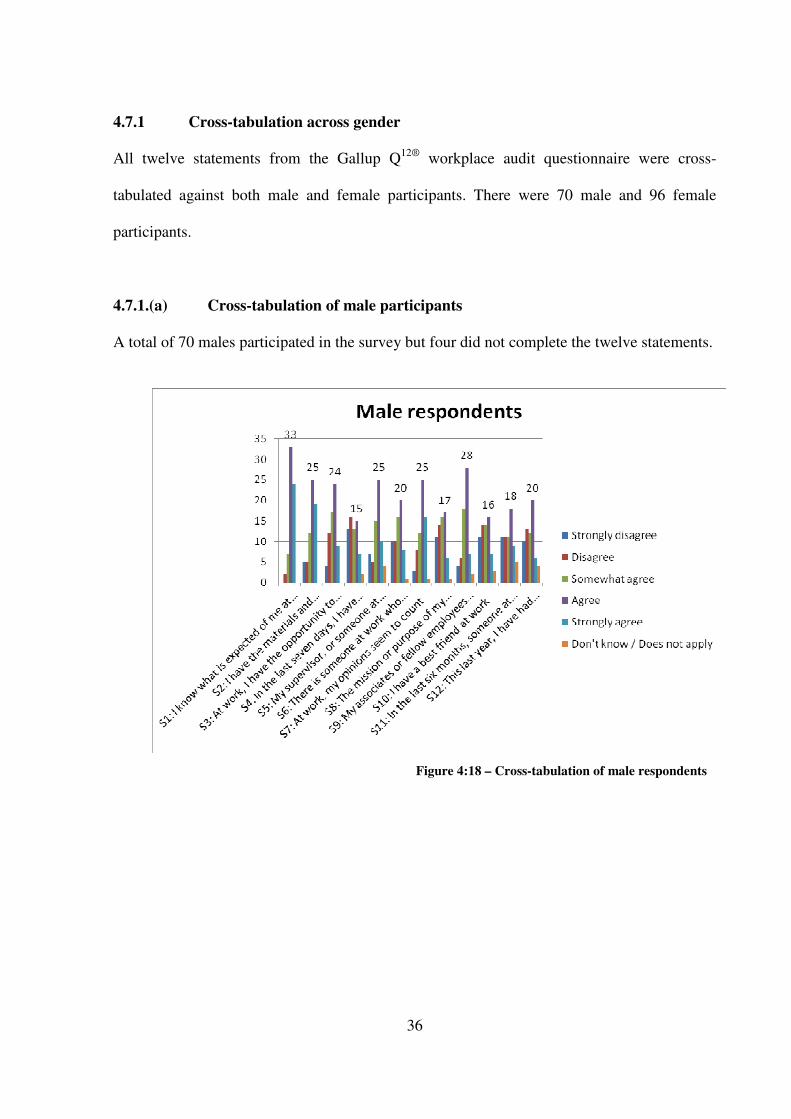
4.7.1 Cross-tabulation across gender
All twelve statements from the Gallup Q12®
workplace audit questionnaire were cross-
tabulated against both male and female participants. There were 70 male and 96 female
participants.
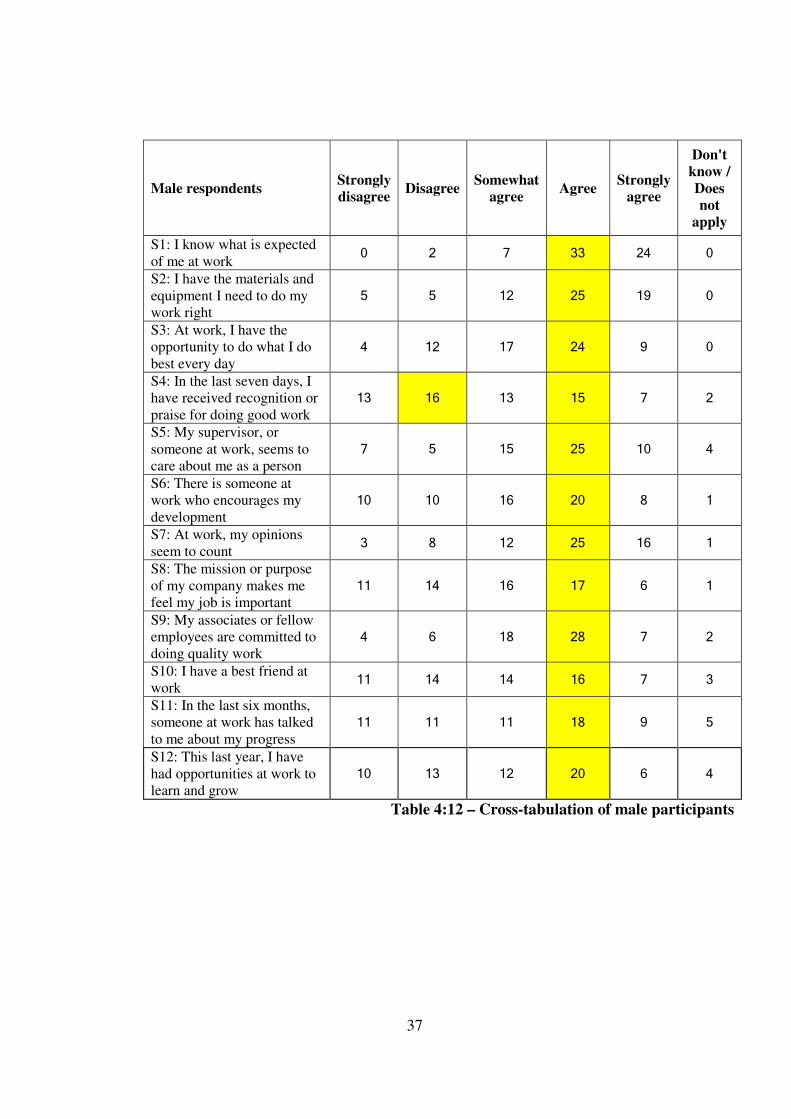
4.7.1.(a) Cross-tabulation of male participants
A total of 70 males participated in the survey but four did not complete the twelve statements.
Figure 4:18 – Cross-tabulation of male respondents
37
Male respondents Strongly
disagree Disagree
Somewhat
agree Agree
Strongly
agree
Don't
know /
Does
not
apply
S1: I know what is expected
of me at work 0 2 7 33 24 0
S2: I have the materials and
equipment I need to do my
work right
5 5 12 25 19 0
S3: At work, I have the
opportunity to do what I do
best every day
4 12 17 24 9 0
S4: In the last seven days, I
have received recognition or
praise for doing good work
13 16 13 15 7 2
S5: My supervisor, or
someone at work, seems to
care about me as a person
7 5 15 25 10 4
S6: There is someone at
work who encourages my
development
10 10 16 20 8 1
S7: At work, my opinions
seem to count 3 8 12 25 16 1
S8: The mission or purpose
of my company makes me
feel my job is important
11 14 16 17 6 1
S9: My associates or fellow
employees are committed to
doing quality work
4 6 18 28 7 2
S10: I have a best friend at
work 11 14 14 16 7 3
S11: In the last six months,
someone at work has talked
to me about my progress
11 11 11 18 9 5
S12: This last year, I have
had opportunities at work to
learn and grow
10 13 12 20 6 4
Table 4:12 – Cross-tabulation of male participants
38
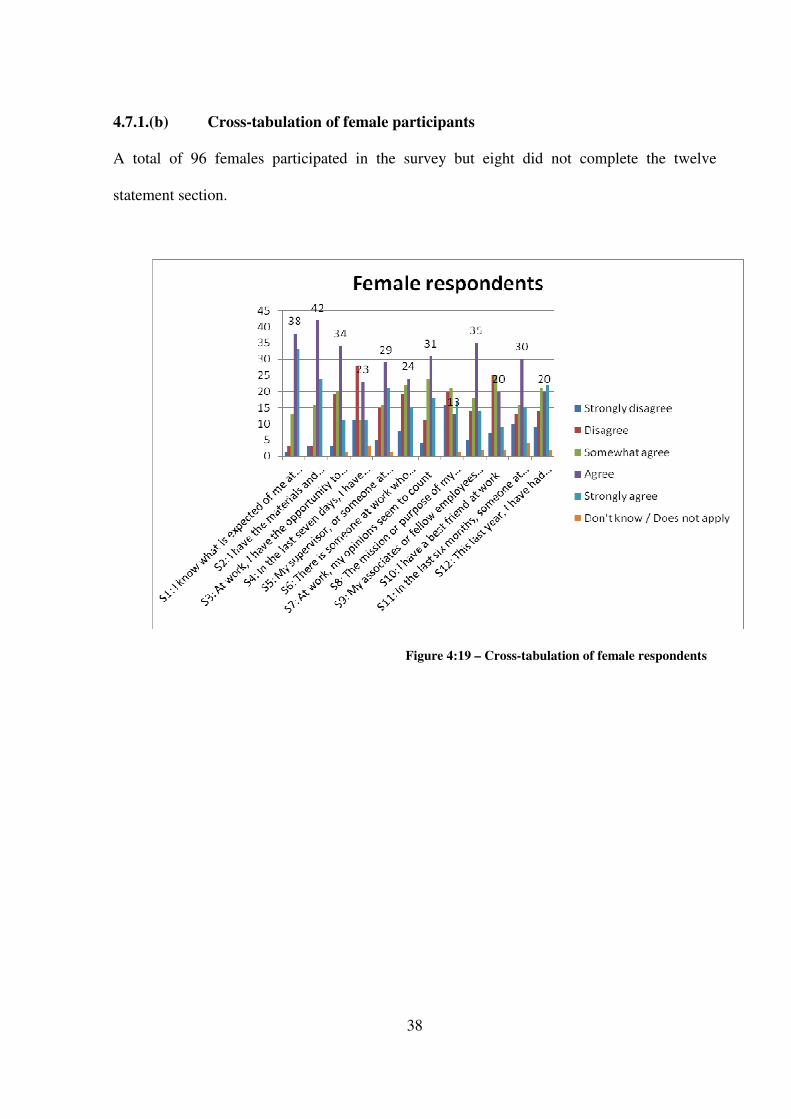
4.7.1.(b) Cross-tabulation of female participants
A total of 96 females participated in the survey but eight did not complete the twelve
statement section.
Figure 4:19 – Cross-tabulation of female respondents

39
Female respondents Strongly
disagree Disagree
Somewhat
agree Agree
Strongly
agree
Don't
know /
Does
not
apply
S1: I know what is expected
of me at work 1 3 13 38 33 0
S2: I have the materials and
equipment I need to do my
work right
3 3 16 42 24 0
S3: At work, I have the
opportunity to do what I do
best every day
3 19 20 34 11 1
S4: In the last seven days, I
have received recognition or
praise for doing good work
11 28 11 23 11 3
S5: My supervisor, or
someone at work, seems to
care about me as a person
5 15 16 29 21 1
S6: There is someone at
work who encourages my
development
8 19 22 24 15 0
S7: At work, my opinions
seem to count 4 11 24 31 18 0
S8: The mission or purpose
of my company makes me
feel my job is important
16 20 21 13 17 1
S9: My associates or fellow
employees are committed to
doing quality work
5 14 18 35 14 2
S10: I have a best friend at
work 7 25 25 20 9 2
S11: In the last six months,
someone at work has talked
to me about my progress
10 13 16 30 15 4
S12: This last year, I have
had opportunities at work to
learn and grow
9 14 21 20 22 2
Table 4:13 – Cross-tabulation of female respondents
40
4.7.2 Cross-tabulation of age groups
All twelve statements from the Gallup Q12®
workplace audit questionnaire were cross-
tabulated against the age groups 20-29 years old; 30-39 years old; 40-49 years old; and 50+
years old.
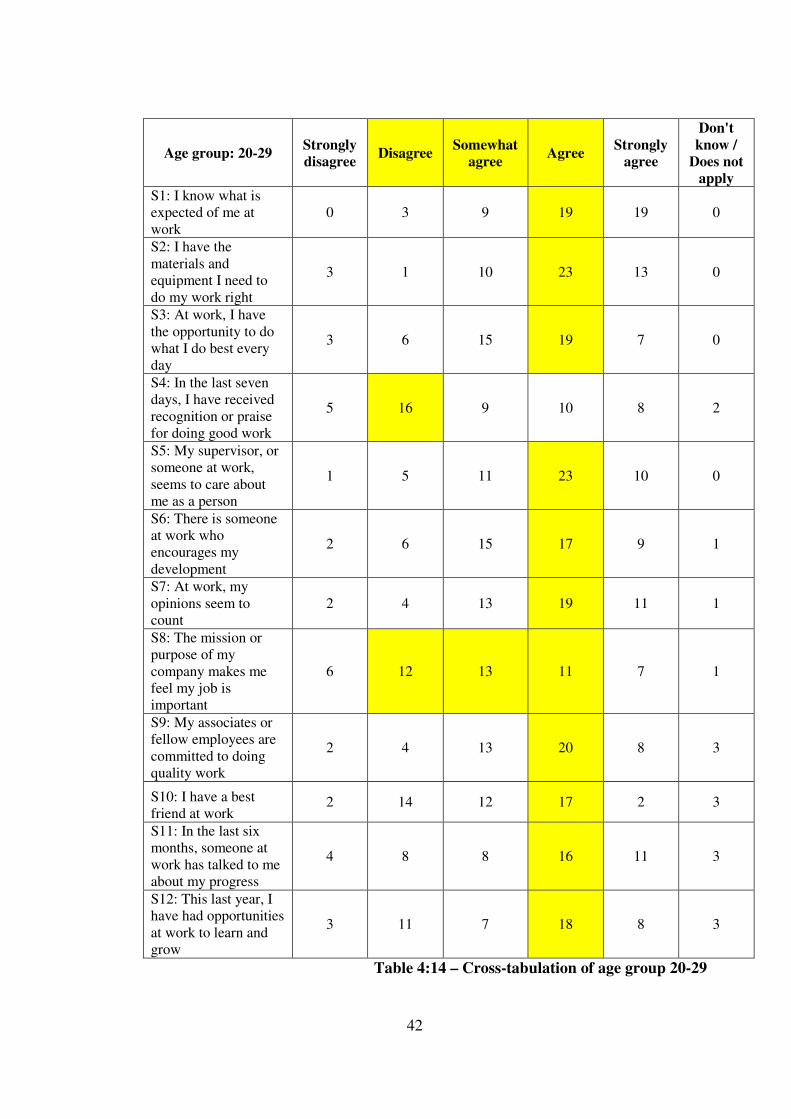
4.7.2.(a) Cross-tabulation of age group 20-29
All twelve statements from the Gallup Q12®
workplace audit questionnaire were cross-
tabulated against the 20-29 year old age category. There were 58 participants within this age
group but eight did not complete the twelve statements section. This age group was generally
in agreement with each of the twelve statements with the exception of statements four and
eight, although in statement eight the combined number of respondents who somewhat agreed
and agreed outweighed the respondents who disagreed with the statement. Statement four
related to receiving praise or recognition in the seven days prior to completion of the survey.
Statement eight questioned whether the respondent’s company mission made the respondent
feel that their job was important.
Graph and table for this category are presented on the following pages.

41
Figure 4:20 – Cross-tabulation of age group 20-29
42
Age group: 20-29 Strongly
disagree Disagree
Somewhat
agree Agree
Strongly
agree
Don't
know /
Does not
apply
S1: I know what is
expected of me at
work
0 3 9 19 19 0
S2: I have the
materials and
equipment I need to
do my work right
3 1 10 23 13 0
S3: At work, I have
the opportunity to do
what I do best every
day
3 6 15 19 7 0
S4: In the last seven
days, I have received
recognition or praise
for doing good work
5 16 9 10 8 2
S5: My supervisor, or
someone at work,
seems to care about
me as a person
1 5 11 23 10 0
S6: There is someone
at work who
encourages my
development
2 6 15 17 9 1
S7: At work, my
opinions seem to
count
2 4 13 19 11 1
S8: The mission or
purpose of my
company makes me
feel my job is
important
6 12 13 11 7 1
S9: My associates or
fellow employees are
committed to doing
quality work
2 4 13 20 8 3
S10: I have a best
friend at work 2 14 12 17 2 3
S11: In the last six
months, someone at
work has talked to me
about my progress
4 8 8 16 11 3
S12: This last year, I
have had opportunities
at work to learn and
grow
3 11 7 18 8 3
Table 4:14 – Cross-tabulation of age group 20-29
43
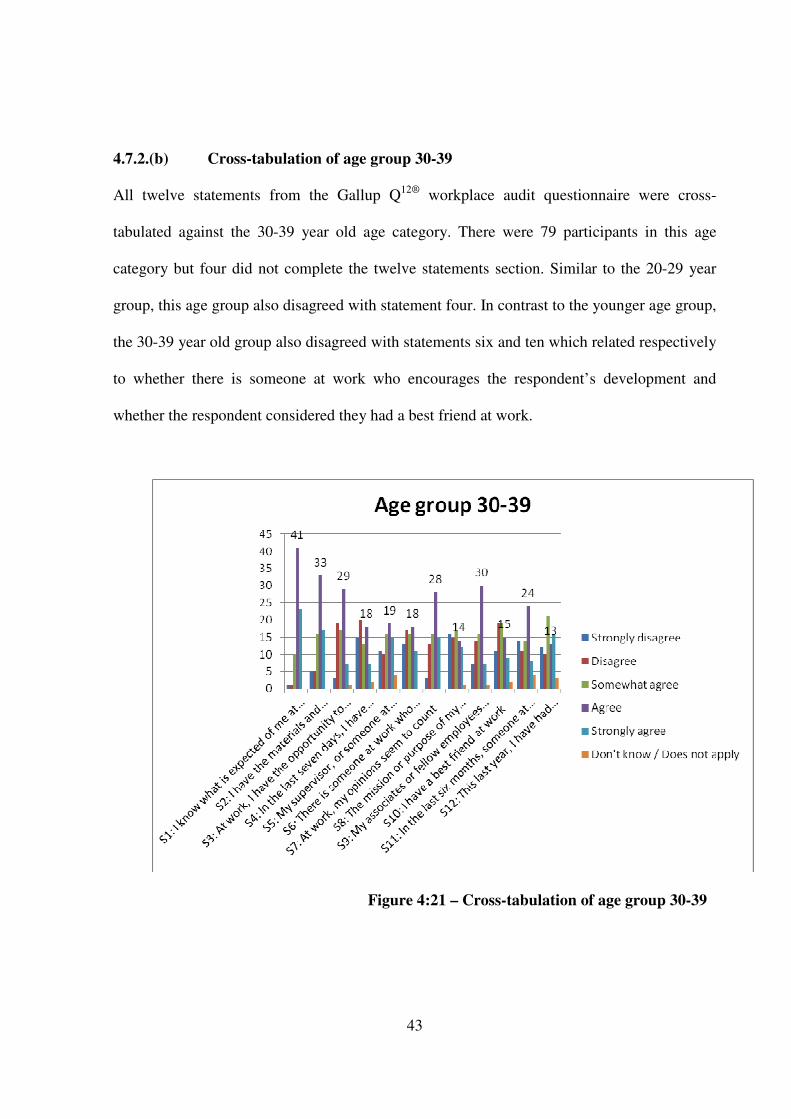
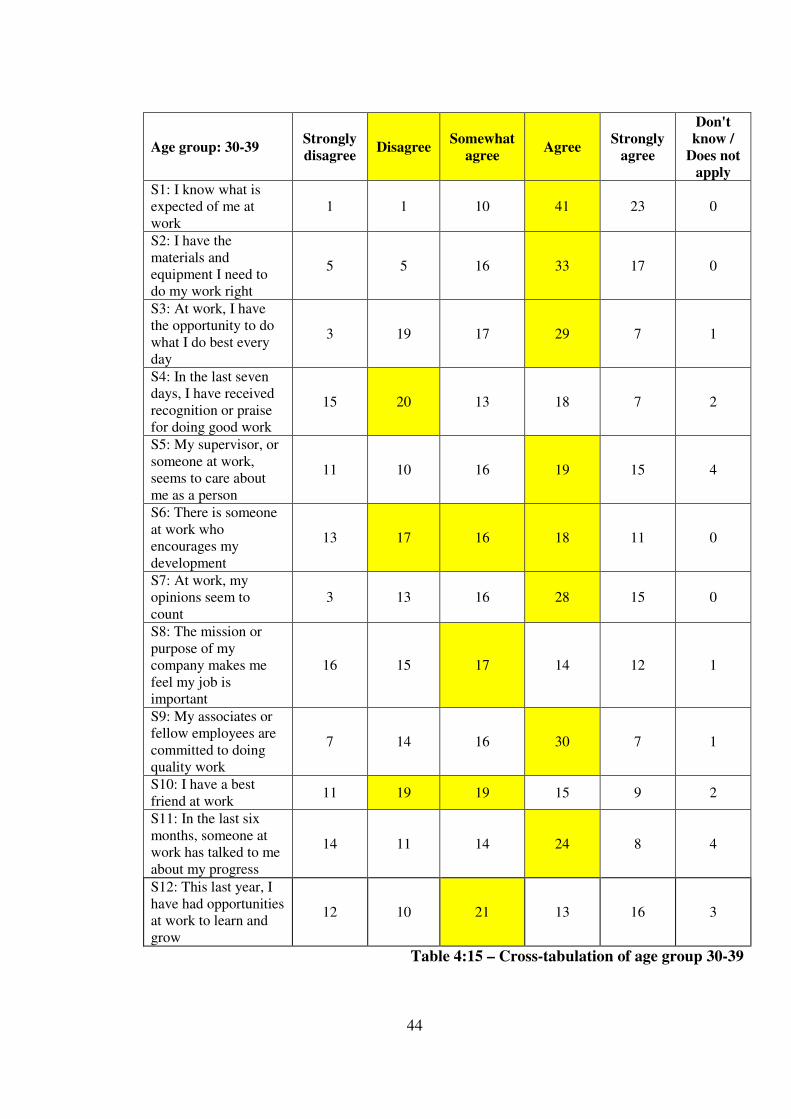
4.7.2.(b) Cross-tabulation of age group 30-39
All twelve statements from the Gallup Q12®
workplace audit questionnaire were cross-
tabulated against the 30-39 year old age category. There were 79 participants in this age
category but four did not complete the twelve statements section. Similar to the 20-29 year
group, this age group also disagreed with statement four. In contrast to the younger age group,
the 30-39 year old group also disagreed with statements six and ten which related respectively
to whether there is someone at work who encourages the respondent’s development and
whether the respondent considered they had a best friend at work.
Figure 4:21 – Cross-tabulation of age group 30-39
44
Age group: 30-39 Strongly
disagree Disagree
Somewhat
agree Agree
Strongly
agree
Don't
know /
Does not
apply
S1: I know what is
expected of me at
work
1 1 10 41 23 0
S2: I have the
materials and
equipment I need to
do my work right
5 5 16 33 17 0
S3: At work, I have
the opportunity to do
what I do best every
day
3 19 17 29 7 1
S4: In the last seven
days, I have received
recognition or praise
for doing good work
15 20 13 18 7 2
S5: My supervisor, or
someone at work,
seems to care about
me as a person
11 10 16 19 15 4
S6: There is someone
at work who
encourages my
development
13 17 16 18 11 0
S7: At work, my
opinions seem to
count
3 13 16 28 15 0
S8: The mission or
purpose of my
company makes me
feel my job is
important
16 15 17 14 12 1
S9: My associates or
fellow employees are
committed to doing
quality work
7 14 16 30 7 1
S10: I have a best
friend at work 11 19 19 15 9 2
S11: In the last six
months, someone at
work has talked to me
about my progress
14 11 14 24 8 4
S12: This last year, I
have had opportunities
at work to learn and
grow
12 10 21 13 16 3
Table 4:15 – Cross-tabulation of age group 30-39
45
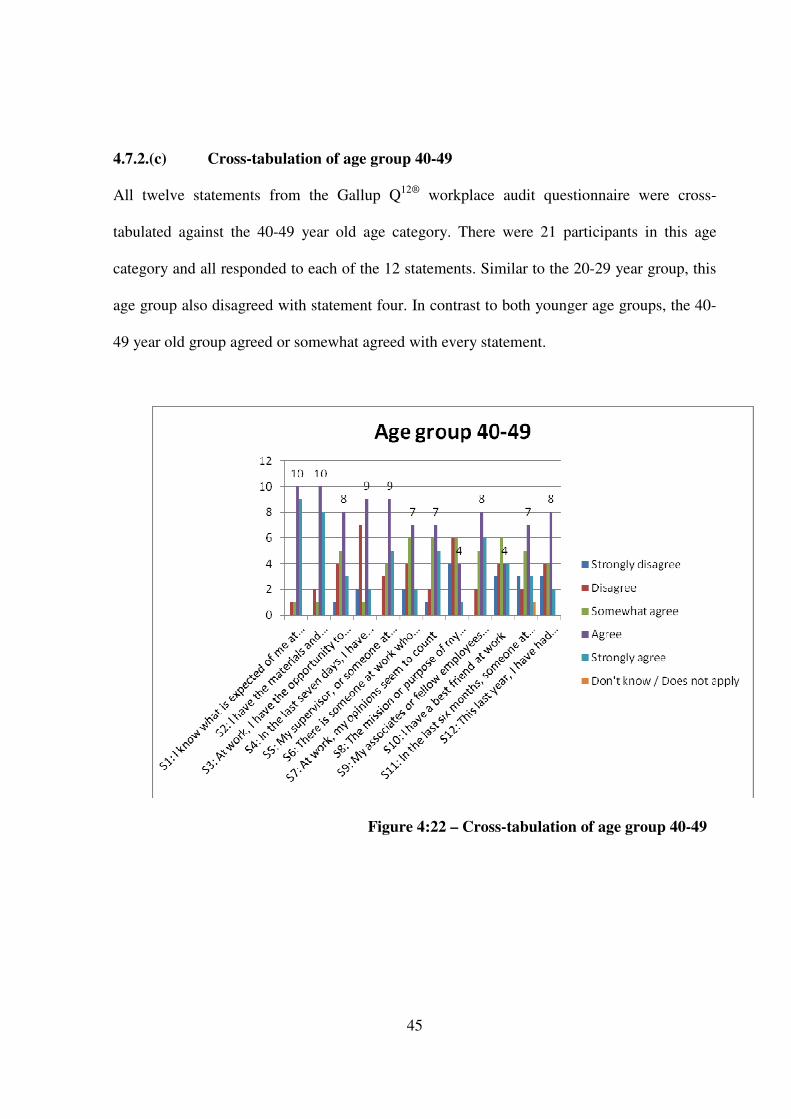
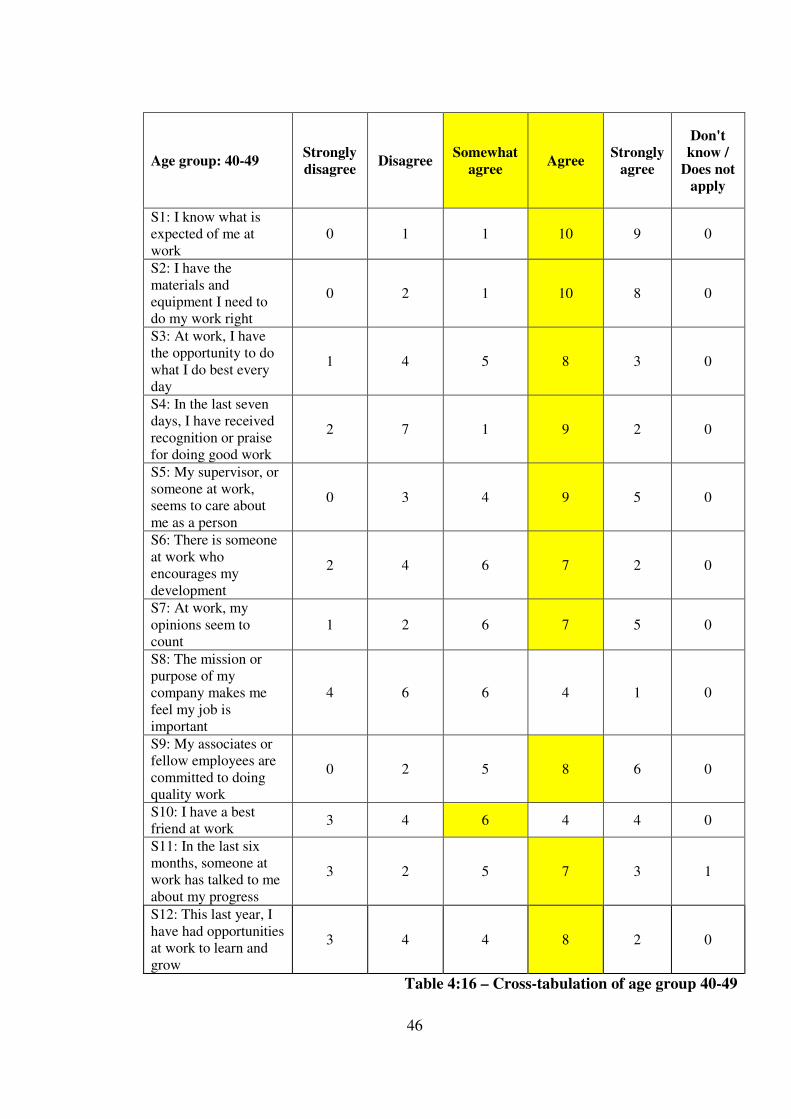
4.7.2.(c) Cross-tabulation of age group 40-49
All twelve statements from the Gallup Q12®
workplace audit questionnaire were cross-
tabulated against the 40-49 year old age category. There were 21 participants in this age
category and all responded to each of the 12 statements. Similar to the 20-29 year group, this
age group also disagreed with statement four. In contrast to both younger age groups, the 40-
49 year old group agreed or somewhat agreed with every statement.
Figure 4:22 – Cross-tabulation of age group 40-49
46
Age group: 40-49 Strongly
disagree Disagree
Somewhat
agree Agree
Strongly
agree
Don't
know /
Does not
apply
S1: I know what is
expected of me at
work
0 1 1 10 9 0
S2: I have the
materials and
equipment I need to
do my work right
0 2 1 10 8 0
S3: At work, I have
the opportunity to do
what I do best every
day
1 4 5 8 3 0
S4: In the last seven
days, I have received
recognition or praise
for doing good work
2 7 1 9 2 0
S5: My supervisor, or
someone at work,
seems to care about
me as a person
0 3 4 9 5 0
S6: There is someone
at work who
encourages my
development
2 4 6 7 2 0
S7: At work, my
opinions seem to
count
1 2 6 7 5 0
S8: The mission or
purpose of my
company makes me
feel my job is
important
4 6 6 4 1 0
S9: My associates or
fellow employees are
committed to doing
quality work
0 2 5 8 6 0
S10: I have a best
friend at work 3 4 6 4 4 0
S11: In the last six
months, someone at
work has talked to me
about my progress
3 2 5 7 3 1
S12: This last year, I
have had opportunities
at work to learn and
grow
3 4 4 8 2 0
Table 4:16 – Cross-tabulation of age group 40-49
47
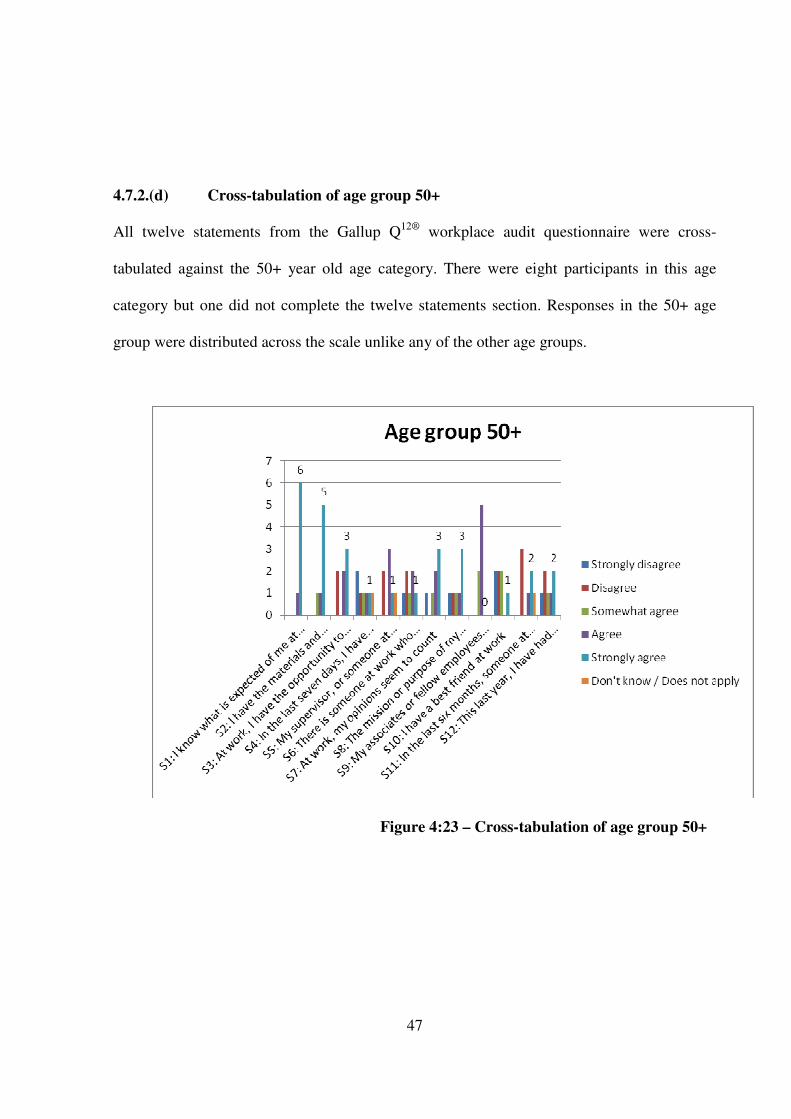
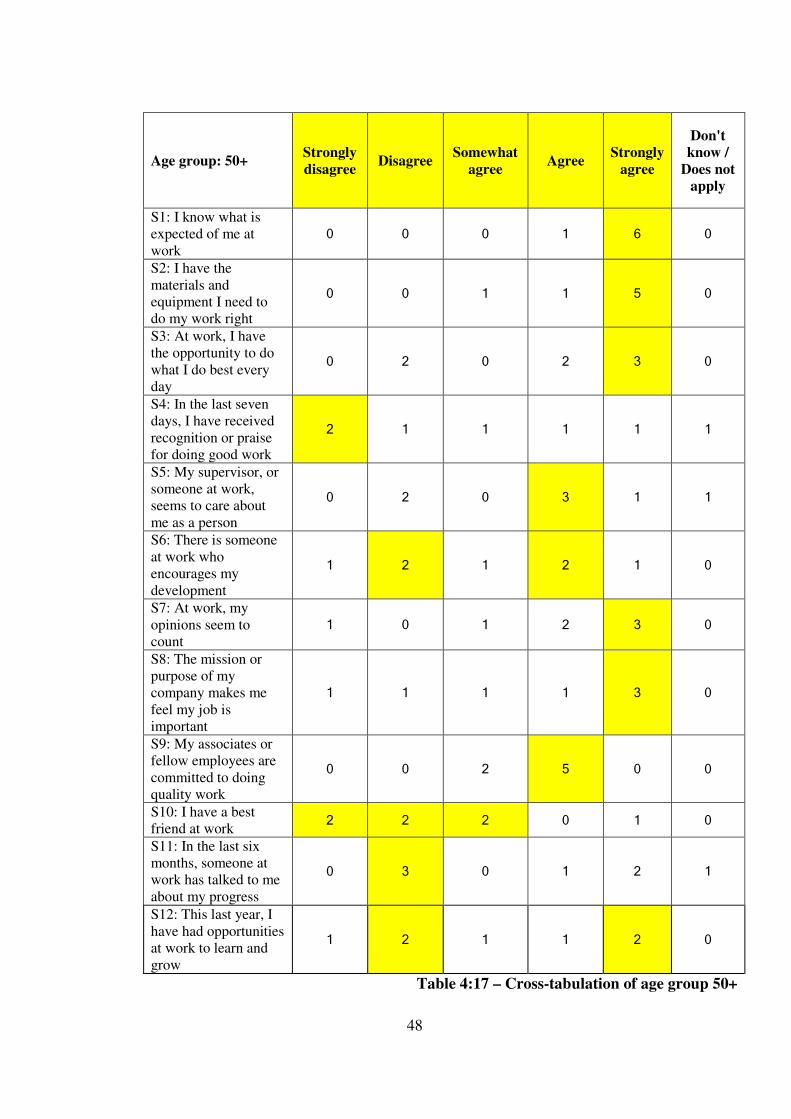
4.7.2.(d) Cross-tabulation of age group 50+
All twelve statements from the Gallup Q12®
workplace audit questionnaire were cross-
tabulated against the 50+ year old age category. There were eight participants in this age
category but one did not complete the twelve statements section. Responses in the 50+ age
group were distributed across the scale unlike any of the other age groups.
Figure 4:23 – Cross-tabulation of age group 50+
48
Age group: 50+ Strongly
disagree Disagree
Somewhat
agree Agree
Strongly
agree
Don't
know /
Does not
apply
S1: I know what is
expected of me at
work
0 0 0 1 6 0
S2: I have the
materials and
equipment I need to
do my work right
0 0 1 1 5 0
S3: At work, I have
the opportunity to do
what I do best every
day
0 2 0 2 3 0
S4: In the last seven
days, I have received
recognition or praise
for doing good work
2 1 1 1 1 1
S5: My supervisor, or
someone at work,
seems to care about
me as a person
0 2 0 3 1 1
S6: There is someone
at work who
encourages my
development
1 2 1 2 1 0
S7: At work, my
opinions seem to
count
1 0 1 2 3 0
S8: The mission or
purpose of my
company makes me
feel my job is
important
1 1 1 1 3 0
S9: My associates or
fellow employees are
committed to doing
quality work
0 0 2 5 0 0
S10: I have a best
friend at work 2 2 2 0 1 0
S11: In the last six
months, someone at
work has talked to me
about my progress
0 3 0 1 2 1
S12: This last year, I
have had opportunities
at work to learn and
grow
1 2 1 1 2 0
Table 4:17 – Cross-tabulation of age group 50+
49
4.7.3 Cross-tabulation against length of service
All twelve statements from the Gallup Q12®
workplace audit questionnaire were cross-
tabulated against length of service in each of the following categories: 1-2 years; 3-4 years; 5-
10 years; and more than 10 years.
4.7.3.(a) 1-2 years length of service
All twelve statements from the Gallup Q12®
workplace audit questionnaire were cross-
tabulated against the 1-2 years of service category. There were 41 participants in this category
but eight did not complete the twelve statements section.
Figure 4:24 – Cross-tabulation of 1-2 yrs service
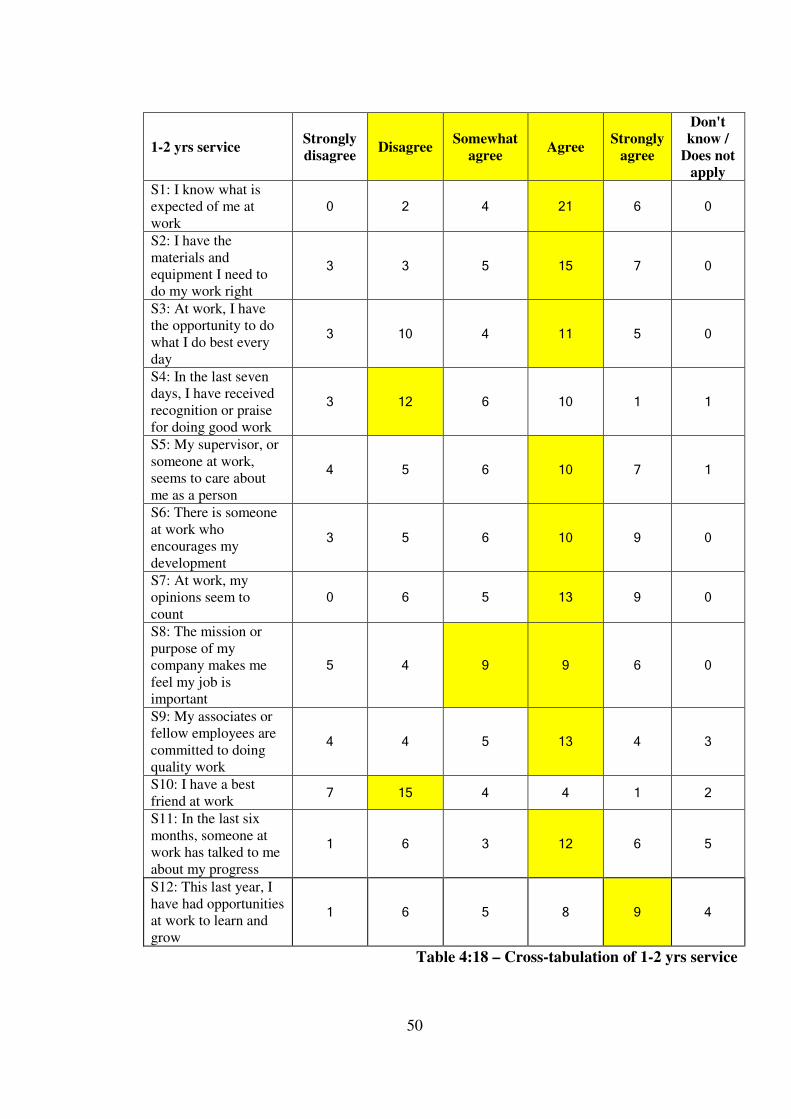
50
1-2 yrs service Strongly
disagree Disagree
Somewhat
agree Agree
Strongly
agree
Don't
know /
Does not
apply
S1: I know what is
expected of me at
work
0 2 4 21 6 0
S2: I have the
materials and
equipment I need to
do my work right
3 3 5 15 7 0
S3: At work, I have
the opportunity to do
what I do best every
day
3 10 4 11 5 0
S4: In the last seven
days, I have received
recognition or praise
for doing good work
3 12 6 10 1 1
S5: My supervisor, or
someone at work,
seems to care about
me as a person
4 5 6 10 7 1
S6: There is someone
at work who
encourages my
development
3 5 6 10 9 0
S7: At work, my
opinions seem to
count
0 6 5 13 9 0
S8: The mission or
purpose of my
company makes me
feel my job is
important
5 4 9 9 6 0
S9: My associates or
fellow employees are
committed to doing
quality work
4 4 5 13 4 3
S10: I have a best
friend at work 7 15 4 4 1 2
S11: In the last six
months, someone at
work has talked to me
about my progress
1 6 3 12 6 5
S12: This last year, I
have had opportunities
at work to learn and
grow
1 6 5 8 9 4
Table 4:18 – Cross-tabulation of 1-2 yrs service
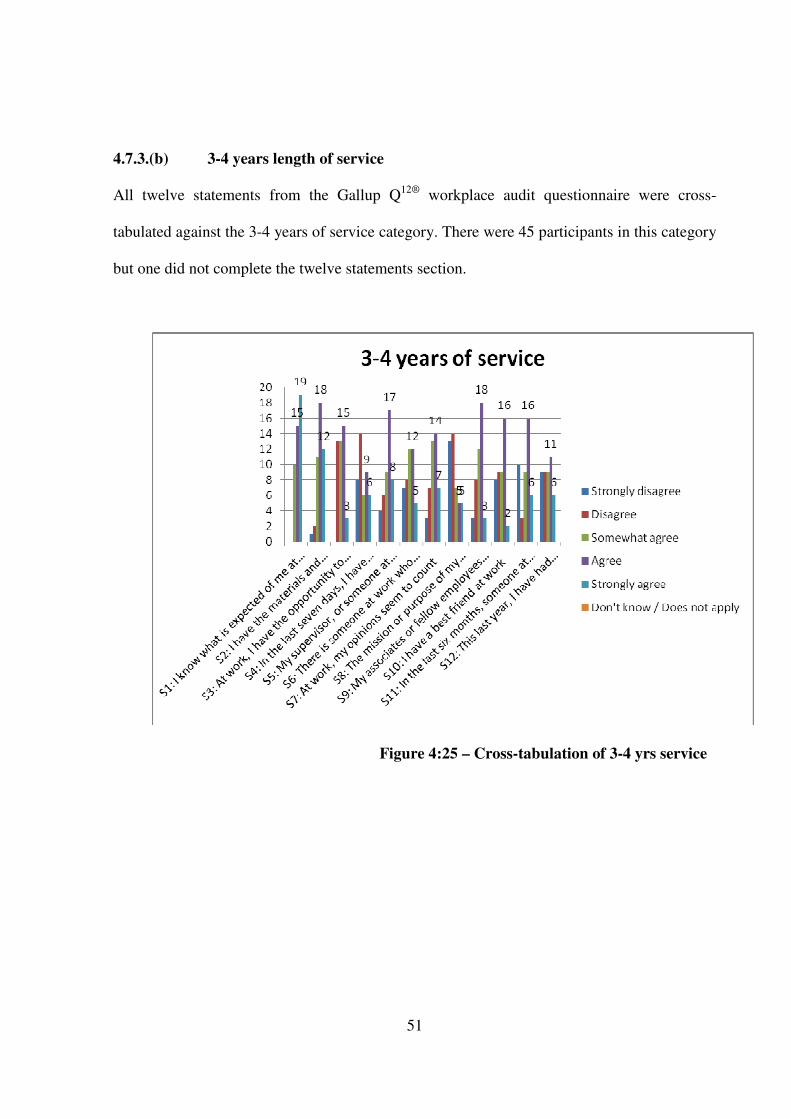
51
4.7.3.(b) 3-4 years length of service
All twelve statements from the Gallup Q12®
workplace audit questionnaire were cross-
tabulated against the 3-4 years of service category. There were 45 participants in this category
but one did not complete the twelve statements section.
Figure 4:25 – Cross-tabulation of 3-4 yrs service
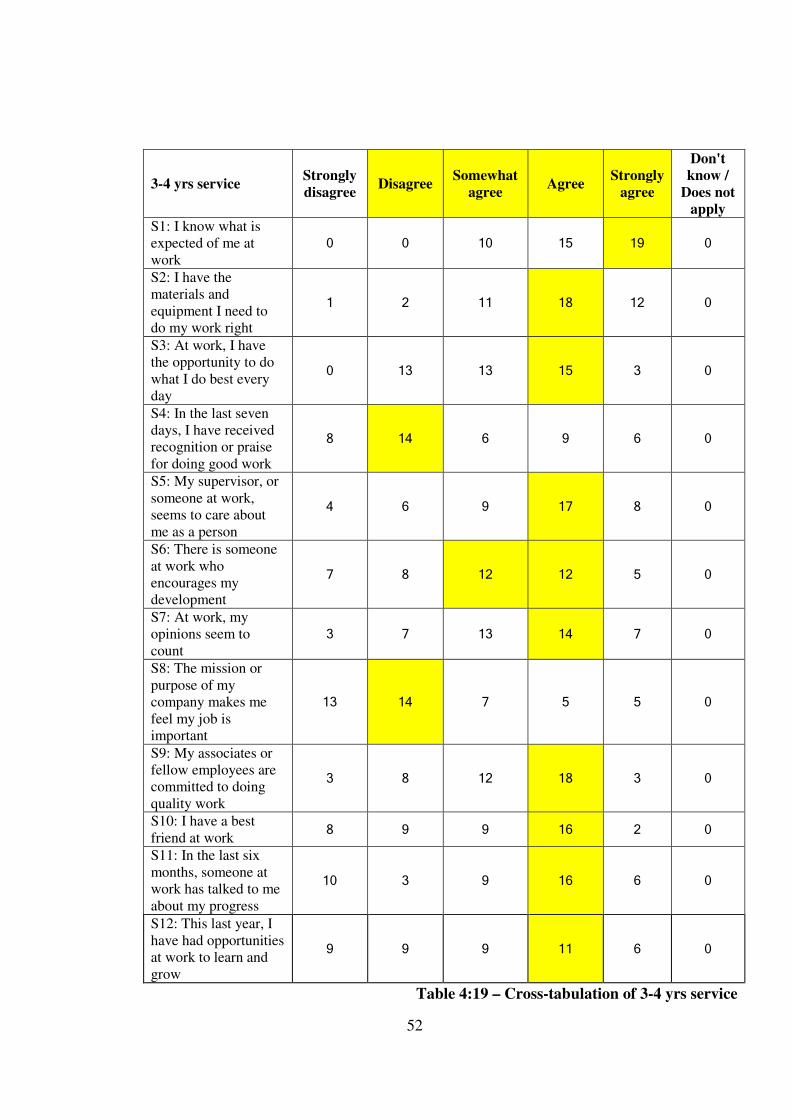
52
3-4 yrs service Strongly
disagree Disagree
Somewhat
agree Agree
Strongly
agree
Don't
know /
Does not
apply
S1: I know what is
expected of me at
work
0 0 10 15 19 0
S2: I have the
materials and
equipment I need to
do my work right
1 2 11 18 12 0
S3: At work, I have
the opportunity to do
what I do best every
day
0 13 13 15 3 0
S4: In the last seven
days, I have received
recognition or praise
for doing good work
8 14 6 9 6 0
S5: My supervisor, or
someone at work,
seems to care about
me as a person
4 6 9 17 8 0
S6: There is someone
at work who
encourages my
development
7 8 12 12 5 0
S7: At work, my
opinions seem to
count
3 7 13 14 7 0
S8: The mission or
purpose of my
company makes me
feel my job is
important
13 14 7 5 5 0
S9: My associates or
fellow employees are
committed to doing
quality work
3 8 12 18 3 0
S10: I have a best
friend at work 8 9 9 16 2 0
S11: In the last six
months, someone at
work has talked to me
about my progress
10 3 9 16 6 0
S12: This last year, I
have had opportunities
at work to learn and
grow
9 9 9 11 6 0
Table 4:19 – Cross-tabulation of 3-4 yrs service
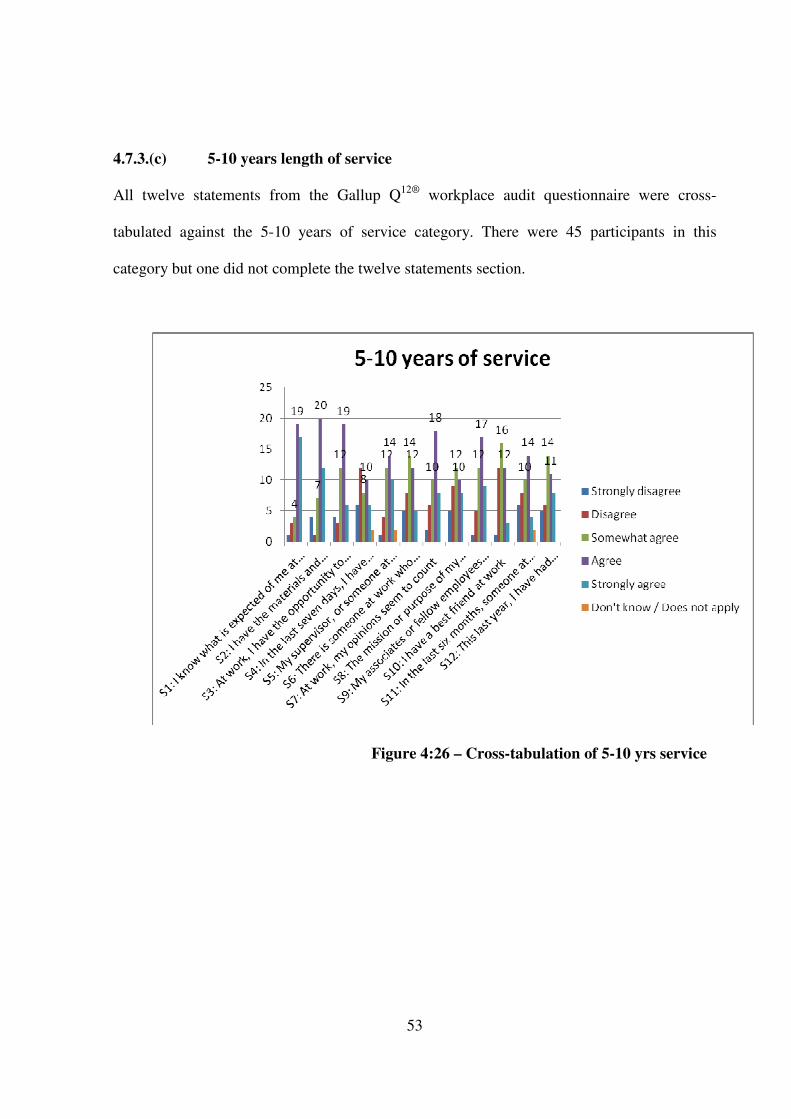
53
4.7.3.(c) 5-10 years length of service
All twelve statements from the Gallup Q12®
workplace audit questionnaire were cross-
tabulated against the 5-10 years of service category. There were 45 participants in this
category but one did not complete the twelve statements section.
Figure 4:26 – Cross-tabulation of 5-10 yrs service
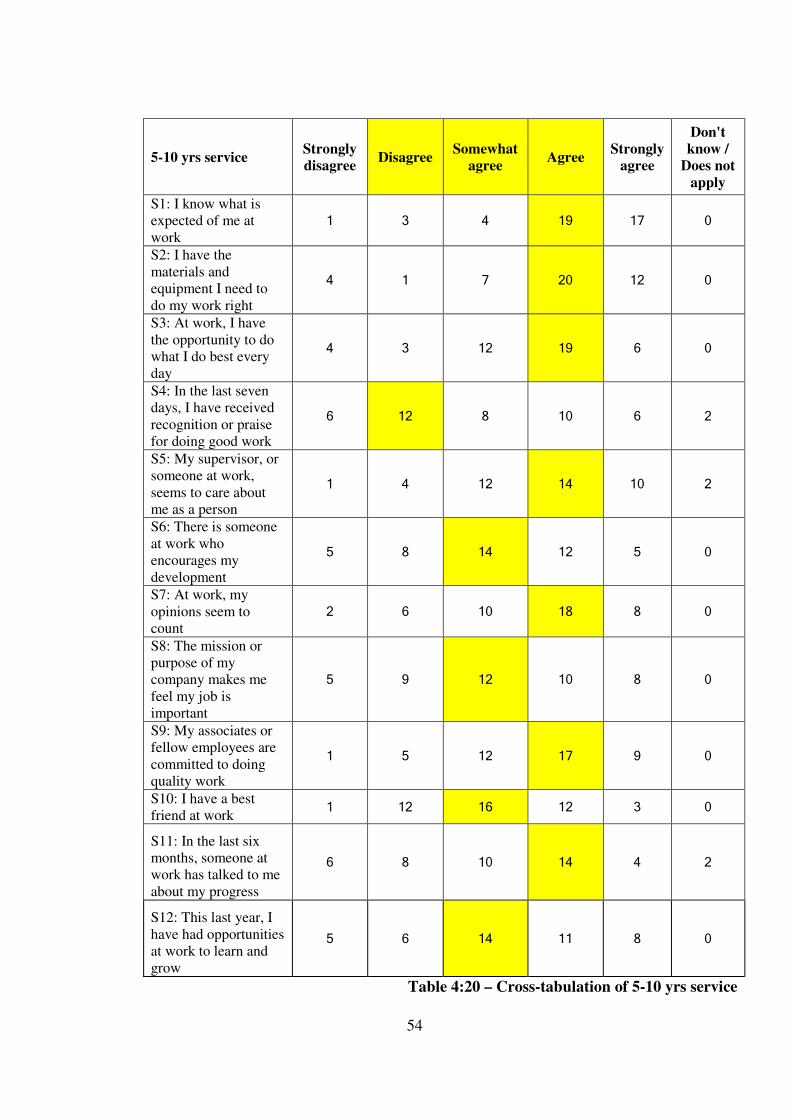
54
5-10 yrs service Strongly
disagree Disagree
Somewhat
agree Agree
Strongly
agree
Don't
know /
Does not
apply
S1: I know what is
expected of me at
work
1 3 4 19 17 0
S2: I have the
materials and
equipment I need to
do my work right
4 1 7 20 12 0
S3: At work, I have
the opportunity to do
what I do best every
day
4 3 12 19 6 0
S4: In the last seven
days, I have received
recognition or praise
for doing good work
6 12 8 10 6 2
S5: My supervisor, or
someone at work,
seems to care about
me as a person
1 4 12 14 10 2
S6: There is someone
at work who
encourages my
development
5 8 14 12 5 0
S7: At work, my
opinions seem to
count
2 6 10 18 8 0
S8: The mission or
purpose of my
company makes me
feel my job is
important
5 9 12 10 8 0
S9: My associates or
fellow employees are
committed to doing
quality work
1 5 12 17 9 0
S10: I have a best
friend at work 1 12 16 12 3 0
S11: In the last six
months, someone at
work has talked to me
about my progress
6 8 10 14 4 2
S12: This last year, I
have had opportunities
at work to learn and
grow
5 6 14 11 8 0
Table 4:20 – Cross-tabulation of 5-10 yrs service
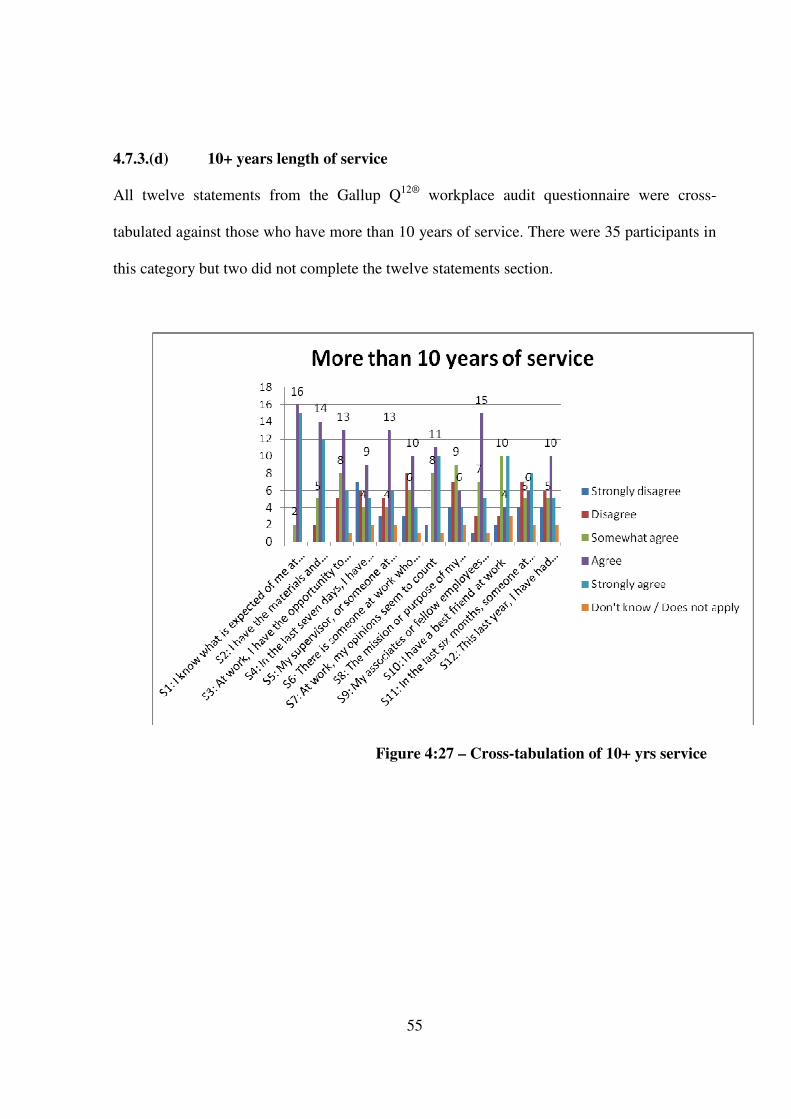
55
4.7.3.(d) 10+ years length of service
All twelve statements from the Gallup Q12®
workplace audit questionnaire were cross-
tabulated against those who have more than 10 years of service. There were 35 participants in
this category but two did not complete the twelve statements section.
Figure 4:27 – Cross-tabulation of 10+ yrs service
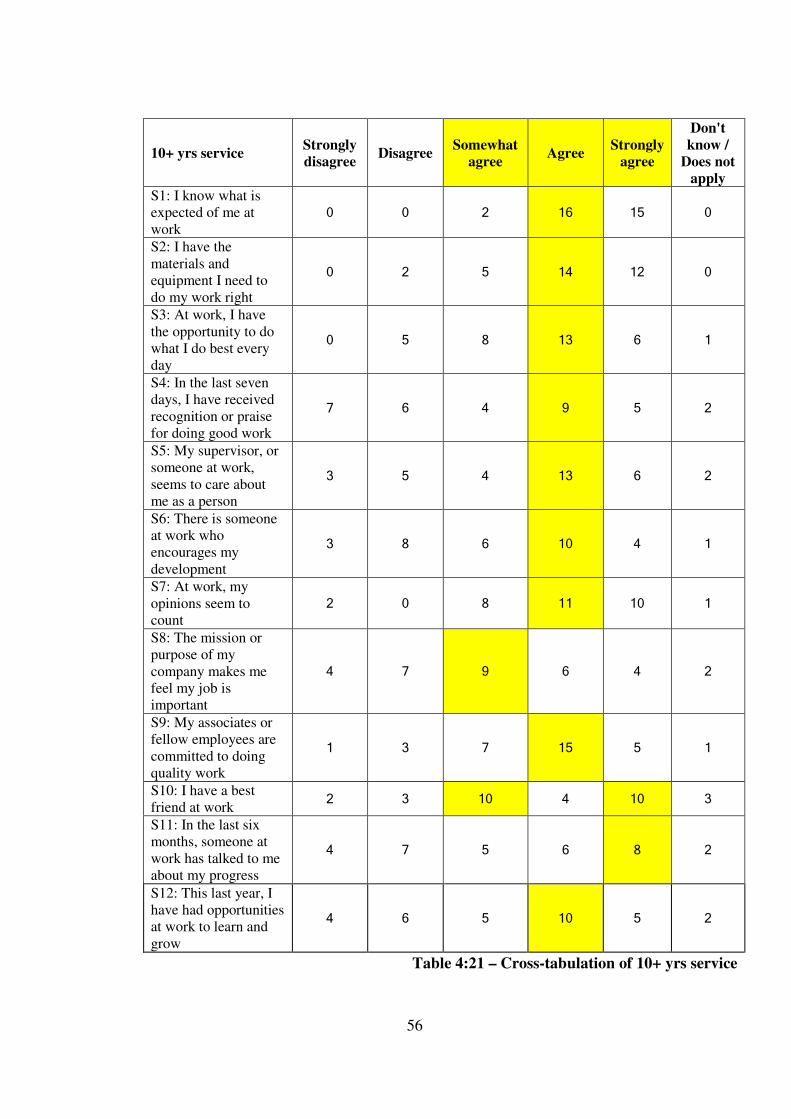
56
10+ yrs service Strongly
disagree Disagree
Somewhat
agree Agree
Strongly
agree
Don't
know /
Does not
apply
S1: I know what is
expected of me at
work
0 0 2 16 15 0
S2: I have the
materials and
equipment I need to
do my work right
0 2 5 14 12 0
S3: At work, I have
the opportunity to do
what I do best every
day
0 5 8 13 6 1
S4: In the last seven
days, I have received
recognition or praise
for doing good work
7 6 4 9 5 2
S5: My supervisor, or
someone at work,
seems to care about
me as a person
3 5 4 13 6 2
S6: There is someone
at work who
encourages my
development
3 8 6 10 4 1
S7: At work, my
opinions seem to
count
2 0 8 11 10 1
S8: The mission or
purpose of my
company makes me
feel my job is
important
4 7 9 6 4 2
S9: My associates or
fellow employees are
committed to doing
quality work
1 3 7 15 5 1
S10: I have a best
friend at work 2 3 10 4 10 3
S11: In the last six
months, someone at
work has talked to me
about my progress
4 7 5 6 8 2
S12: This last year, I
have had opportunities
at work to learn and
grow
4 6 5 10 5 2
Table 4:21 – Cross-tabulation of 10+ yrs service

57
CHAPTER 5: DISCUSSION
5.1 Introduction
The findings set out in the previous chapter will now be analysed with reference to
Forbringer’s four levels of grouping the Gallup Q12®
statements into four separate stages
where the previous stage must be achieved before the next can be successfully attempted as
well as to the literature reviewed in chapter two. Possible shortcomings to the research will be
set out as well as the research limitations and possible directions for future research.
5.2 Analysis of findings against Forbringer’s 4 levels
Forbringer (2002) grouped the Gallup Q12®
statements into four separate levels where the
previous level had to be achieved before the next level could be successfully attempted. He
provided the analogy of climbing a metaphorical mountain to describe the levels. The four
levels introduced by Forbringer are: Level 1: “What do I get?”; Level 2: “What do I give?”;
Level 3: “Do I belong here?”; and Level 4: “How can we all grow?”.
5.2.1 Level 1: “What do I get?”
The first two Gallup Q12®
statements, relating to knowing what is expected of one at work and
whether the necessary materials and equipment are available, are included in Forbringer’s
Level 1 which is concerned with satisfying basic needs. Once these needs are met, other
issues can become the locus of focus.
58
5.2.1.(a) S1 of the Gallup Q12®
46.1% of respondents agreed and 37% strongly agreed to the statement demonstrating that
most respondents are confident that they know what is expected of them in their organisation
and can move their focus to the next statement.
5.2.1.(b) S2 of the Gallup Q12®
43.5% of respondents agreed and 27.9% strongly agreed to the statement indicating that most
respondents are confident that they have the appropriate materials and equipment they need to
do their work right.
With high levels of agreement to the two first statements, respondents are well placed to move
to Level 2 and focus on what they give to the organisation.
5.2.2 Level 2: “What do I give?”
Statements three through six of the Gallup Q12®
statements, relating to the opportunity to do
one’s best daily; receiving recognition within the last seven days; having a colleague who
cares; and having someone at work who encourages one’s development, are included in
Forbringer’s Level 2 which is concerned with individual levels of contribution as well as
other people’s perception of same.
5.2.2.(a) S3 of the Gallup Q12®
37.7% of respondents agreed, 13% strongly agreed, and a further 24% to the statement
demonstrating that over 70% of the respondents are confident that they have the opportunity
to do what they do best daily.
59
5.2.2.(b) S4 of the Gallup Q12®
24.8% agreed, 11.8% strongly agreed, and a further 15.7% somewhat agreed to the statement
on receiving recognition or praise within the last seven days for doing good work. The
combined agreement rates of 52.3% outweighed those in disagreement (44.5%) by less than
10%.
5.2.2.(c) S5 of the Gallup Q12®
35.3% of respondents agreed, 20.3% strongly agreed, and a further 20.3% somewhat agreed
to the statement on having someone at work who seems to care about them as a person. 75.9%
of respondents agreed to the statement in contrast to 20.9% who disagreed or strongly
disagreed to it.
5.2.2.(d) S6 of the Gallup Q12®
28.8% of respondents agreed, 15% strongly agreed, and a further 24.8% somewhat agreed to
the statement on having someone at work who encourages their development. The combined
68.6% outweighed those in disagreement (30.8%) by over 30%.
With response levels ranging from 11%-20%, those in strong agreement with the four
statements in this section are in a position to move forward to Level 3.
5.2.3 Level 3: “Do I belong here?”
Statements seven through ten of the Gallup Q12®
statements, relating to whether one’s
opinions seems to count at work; whether the mission of the company makes one feel one’s
60
job is important; and whether one’s colleagues are committed to doing quality work, are
included in Forbringer’s Level 3 which is concerned with the widened perception of
individual fit within the organisation.
5.2.3.(a) S7 of the Gallup Q12®
36.6% of respondents agreed, 22.2% strongly agreed, and a further 23.5% somewhat agreed
to the statement that their opinions seem to count in work.
5.2.3.(b) S8 of the Gallup Q12®
24.2% of respondents somewhat agreed, 19.6% agreed and 15% strongly agreed to the
statement that the mission of the company makes them feel their job is important. The
combined 58.8% of positive responses outweighed those in disagreement (39.8%) by 20%.
5.2.3.(c) S9 of the Gallup Q12®
41.2% of respondents agreed, 13.7% strongly agreed, and a further 23.5% somewhat agreed
to the statement that their colleagues are committed to doing quality work. 19% of
respondents disagreed or strongly disagreed with the statement.
5.2.3.(d) S10 of the Gallup Q12®
25.5% of respondents somewhat agreed, 23.5% agreed, and a further 10.5% strongly agreed
to the statement that they have a best friend in work. 37.3% of respondents disagreed or
strongly disagreed with the statement.
61
Only those who strongly agree to the statements should move forward to Level 4 and this
represents between 13.7% and 23.5% of respondents.
5.2.4 Level 4: “How can we all grow?”
Statements eleven and twelve of the Gallup Q12®
statements, relating to being approached by
someone in work to talk about one’s progress; and having had the opportunities to learn and
grow in the past year, are included in Forbringer’s Level 4 which is concerned with self- and
team-development. This is the final stage and if reached it may not last for long as
circumstances change and people adapt to new situations.
5.2.4.(a) S11 of the Gallup Q12®
31.4% of respondents agreed, 17.6% somewhat agreed, and a further 15.7% strongly agreed
to the statement that someone in work had spoken to them about their progress in the past six
months. 29.4% of respondents disagreed or strongly disagreed with the statement.
5.2.4.(b) S12 of the Gallup Q12®
26.1% of respondents agreed, 21.6% somewhat agreed, and a further 18.3% strongly agreed
to the statement that they have had opportunities at work to learn and grow in the past year.
30% of respondents disagreed or strongly disagreed with the statement.
Those in strong agreement represent 15.7% to 18.3% of respondents and are at the summit of
the metaphorical mountain described by Forbringer. Their challenge is to maintain a balance
and their manager’s focus should be on ensuring that the employment needs set out in levels
one and two are met so that more employees can be brought up the engagement mountain.
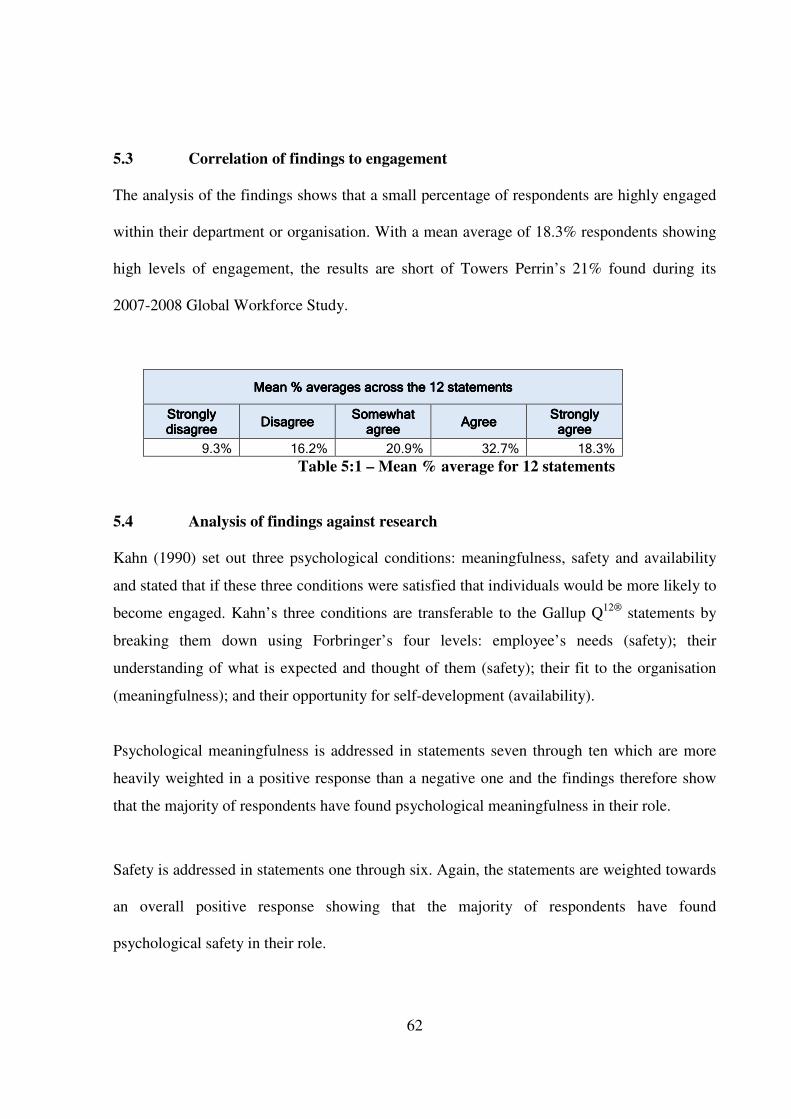
62
5.3 Correlation of findings to engagement
The analysis of the findings shows that a small percentage of respondents are highly engaged
within their department or organisation. With a mean average of 18.3% respondents showing
high levels of engagement, the results are short of Towers Perrin’s 21% found during its
2007-2008 Global Workforce Study.
Mean % averages across the 12 statementsMean % averages across the 12 statementsMean % averages across the 12 statementsMean % averages across the 12 statements
Strongly Strongly Strongly Strongly disagreedisagreedisagreedisagree
DisagreeDisagreeDisagreeDisagree Somewhat Somewhat Somewhat Somewhat agreeagreeagreeagree
AgreeAgreeAgreeAgree Strongly Strongly Strongly Strongly agreeagreeagreeagree
9.3% 16.2% 20.9% 32.7% 18.3%
Table 5:1 – Mean % average for 12 statements
5.4 Analysis of findings against research
Kahn (1990) set out three psychological conditions: meaningfulness, safety and availability
and stated that if these three conditions were satisfied that individuals would be more likely to
become engaged. Kahn’s three conditions are transferable to the Gallup Q12®
statements by
breaking them down using Forbringer’s four levels: employee’s needs (safety); their
understanding of what is expected and thought of them (safety); their fit to the organisation
(meaningfulness); and their opportunity for self-development (availability).
Psychological meaningfulness is addressed in statements seven through ten which are more
heavily weighted in a positive response than a negative one and the findings therefore show
that the majority of respondents have found psychological meaningfulness in their role.
Safety is addressed in statements one through six. Again, the statements are weighted towards
an overall positive response showing that the majority of respondents have found
psychological safety in their role.
63
Availability is addressed through statements eleven and twelve. Again, the statements are
weighted towards an overall positive response showing that the majority of respondents have
found psychological availability in their role.
Maslach et al (2001) set out six areas to measure job ‘burnout’ and reasoned that positive
responses would indicate employee engagement. Although this was later argued by Schaufeli,
the six areas are set out below and assessed against the results of the survey.
Area 1: Workload
There is not a clear statement that fits this area but statement six in relation to encouraging
development was selected to assess workload. The average response was positive for this
statement demonstrating that there is not an overloading workload on respondents.
Area 2: Control
Selecting statements two on availability of materials and equipment; statement three on
opportunity to do one’s best; and statement seven on one’s opinions being counted, the
average response was positive for this area showing that respondents feel they exercise a
degree of control in their organisational setting.
Area 3: Reward
Statements four on recognition; six on being encouraged to develop; and eleven on progress
may be applicable to this area. Disagreement on statement four indicates low levels of
employee engagement despite positive responses to statements six and eleven.
64
Area 4: Community
Statements five; seven; nine; and ten may be applicable to this area. Positive responses
outweighed negatives for all the above statements in this area.
Area 5: Fairness
Statements one; three; seven; nine; and twelve were selected for this area. Again, positive
responses indicate engagement within this area.
Area 6: Values
Statements eight; nine; eleven; and twelve were selected for measurement of this area.
Statement eight was almost evenly distributed across positive and negative responses; the
remaining statements were weighted positively.
The mainly positive findings set out for the above six areas demonstrate that job burnout is
not an issue for the respondents.
5.5 Possible shortcomings to the research
The research survey was made available to 860 individuals. This sample was not
representative of Dublin-based employees nor of European employees although the recipients
fit into both categories. A more select target population would have been preferential despite
the interesting open questions returned by foreign-based respondents.
65
5.6 Research limitations
Limitations in the research include the lack of identifiable business units. Respondents were
asked to outline their corporate title rather than business unit and therefore the research was
unable to identify participants by business unit as has been the case for a number of Gallup
meta-analyses. Cross-referencing the results against Maslach et al’s six areas was also
limiting as they previously stated “the importance of looking at the person in context, in terms
of his or her fit with the key domains of worklife” (Maslach et al, 2001). This was not
possible for the purpose of this research report.
5.7 Possible directions for future research
The results of this study suggest that employee engagement is currently a trending issue.
Given the lack of an agreed definition, future academic research would be well served by a
comprehensive review of current definitions with a view to introducing a concise,
understandable definition for future usage both by organisations and researchers. Within the
current economic environment it would be understandable for firms to ignore engagement as
they focus on fire-fighting but once the economic climate settles, disengaged employees may
well flee in their droves leaving knowledge gaps in their previous organisation. Future
research might be better served by combining interviews with quantitative survey tools in
order to look at the individual in context. Saks (2006) suggested studying antecedents or
predictors to employee engagement such as varying human resources practices. Another area
for academic research may be to investigate the correlation of engagement levels to
profitability to prove or disprove independently the claims of various consultancy firms.
66
CHAPTER 6: CONCLUSION
6.1 Introduction
Having set out the purpose of the review in chapter one, reviewed the literature in chapter two
and outlined the methodology in chapter three, the findings described in chapter four were not
surprising in that engagement levels across the respondent participants were overall negative
with only 18.3% highly engaged.
6.2 Engagement levels of respondents
Gallup’s Q12®
workplace audit states that only highly engaged employees will respond in
strong agreement to each of twelve statements (Forbringer, 2002). The findings did not
demonstrate a higher level of engagement to what was anticipated based on Towers Perrin’s
2007-2008 Global Workforce Study where engagement levels provided were at 21%. The
engagement levels found in this research report were at 18.3%, just below that level. Towers
Perrin categorises employees as ‘enrolled’ where they are capable but not fully engaged
(Towers Perrin, 2008). This category represented 32.7% of respondents to the online survey.
The remainder, the ‘disenchanted’ or disengaged made up 46.4% of respondents.
6.3 Future focus for managers
As discussed, managers’ focus should be on satisfying employee needs at levels one and two
of Forbringer’s four stages to ensure engagement and correlating profitability (Harter et al,
2002).
6.4 Future focus for research
67
Given the lack of an agreed definition of employee engagement, future academic research
would be well served by a comprehensive review of current definitions with a view to
introducing a concise, understandable definition for future usage both by organisations and
researchers. Future research might also be better served by combining interviews with
quantitative survey tools in order to look at the individual in context. Another area for
academic research may be to investigate the correlation of engagement levels to profitability
to prove or disprove independently the claims of various consultancy firms.
68
CHAPTER 7: REFERENCES / BIBLIOGRAPHY
ANON, 2010. Seaworks boss makes his point with a chainsaw. Human Resource Management
International Digest, 18(1), pp. 8.
BRYMAN, A. and BELL, E., 2007. Business Research Methods, 2nd
Edition. Oxford University
Press, Oxford.
CASISON, J., 2008. One Size Does Not Fit All. Incentive, 182(6), pp. 44.
CENTRAL STATISTICS OFFICE IRELAND, 2010. Principal Statistics: Employment and
Unemployment (ILO) ‘000s. Cork, Ireland. www.cso.ie/statistics/empandunempilo.htm
EVANS, D., 2010. An engaging performance. Training Journal, pp. 40.
FRAUENHEIM, E., 2009. Commitment Issues. Workforce Management, 88(12), pp. 20.
FORBRINGER, L.R., 2002. Overview of the Gallup Organization’s Q-12 Survey. O.E. Solutions,
Inc.
GILL, A., 2009. Employee engagement in a change environment. Strategic HR Review, 8(2), pp.
19.
GILL, R., 2010. Conceptual Framework for Using Computers to Enhance Employee Engagement
in Large Offices. Human Resource Development Review, 9(2), pp. 115.
GORDON, M., 2011. The Dialectics of the Exit Interview: A Fresh Look at Conversations About
Organizational Disengagement. Management Communication Quarterly, February 2011,
Vol. 25 No. 1, pp. 59-86.
HARTER, J.K., SCHMIDT, F.L. and HAYES, T.L., 2002. Business-unit-level relationship
between employee satisfaction, employee engagement, and business outcomes: A meta-
analysis. Journal of Applied Psychology, 87(2), pp. 268.
HARTER, J.K., SCHMIDT, F.L., KILHAM, E.A., and AGRAWAL, S., 2009. Q12®
Meta-
Analysis: The Relationship Between Engagement at Work and Organizational Outcomes.
Gallup, Inc. http://www.gallup.com/consulting/126806/Q12-Meta-Analysis.aspx
JAKOBSON, L., 2008. Getting an "A" in Engagement. Incentive, 182(8), pp. 16.
JONGENEEL, A. and RANDALL, P., 2009. Using World Café to rebuild optimism at Renault
Trucks UK. Strategic Communication Management, 13(4), pp. 28.
KAHN, W.A., 1990. Psychological Conditions of Personal Engagement and Disengagement at
Work. Academy of Management Journal, 33(4), pp. 692.
KATZENBACH, J., BROMFIELD, P., 2009. How to cut costs in a recession – with help from
employees. Strategy & Leadership, Vol. 37 Iss: 3, pp.9 – 16
KULAR, S., GATENBY, M., REES, C., SOANE, E., & TRUSS, K., 2008. Employee
Engagement: A Literature Review. KBS Working Paper, no. 19, Kingston Business School,
Kingston-upon-Thames
LAFF, M., 2007. Employee DISENGAGEMENT Strikes Early. T + D, 61(4), pp. 20.
LUTHANS, F. and STAJKOVIC, A.D., 1999. Reinforce for performance: The need to go beyond
pay and even rewards. The Academy of Management Executive, 13(2), pp. 49.
69
MACEY, W.H. and SCHNEIDER, B., 2008. The Meaning of Employee Engagement. Industrial &
Organizational Psychology, 1(1), pp. 3-30.
MAY, D.R., GILSON, R.L. and HARTER, L.M., 2004. The psychological conditions of
meaningfulness, safety and availability and the engagement of the human spirit at work.
Journal of Occupational and Organizational Psychology, 77, pp. 11.
PACE, A., 2010. Employee Engagement Remains Stable. T + D, 64(11), pp. 20.
PECH, R.J., 2009. Delegating and devolving power: a case study of engaged employees. The
Journal of business strategy, 30(1), pp. 27.
ROBERTSON-SMITH, G., MARKWICK, C., 2009. Report 469: Employee Engagement: A
review of current thinking. Institute for Employment Studies, June 2009.
ROCHE, W.K., TEAGUE, P., COUGHLAN, A., & FAHY, M., 2011. Human Resources in the
Recession: Managing and Representing People at Work in Ireland (Executive Summary).
Dublin, Government Publications.
ROWE, M., 2009. Beat the Recession Blues. Restaurant Hospitality, 93(12), pp. 26.
SAKS, A.M., 2006. Antecedents and consequences of employee engagement. Journal of
Managerial Psychology, 21(7), pp. 600.
SARGENT, P., 2010. The Quantitative Paradigm. Source: San Diego State University website:
www-rohan.sdsu.edu
SCHWARTZ, T., 2010. The Productivity Paradox: How Sony Pictures Gets More Out of People
by Demanding Less. Harvard business review, 88(6),
SCOTTISH EXECUTIVE SOCIAL RESEARCH, 2007. Employee Engagement in the Public
Sector: a review of the literature. Crown Copyright; www.scotland.gov.uk/socialresearch
SHORBAJI, R., MESSARRA, L. and KARKOULIAN, S., 2011. Core-Self Evaluation: Predictor
of Employee Engagement. The Business Review, Cambridge, 17(1), pp. 276.
SHUCK, B. and WOLLARD, K., 2010. Employee Engagement and HRD: A Seminal Review of
the Foundations. Human Resource Development Review, 9(1), pp. 89.
SHUCK, M. B., ROCCO, T. S., & ALBORNOZ, C.A., 2011. Exploring employee engagement
from the employee perspective: implications for HRD. Journal of European Industrial
Training, Vol. 35 Iss: 4, pp.300 – 325
STAJKOVIC, A.D. and LUTHANS, F., 1997. A meta-analysis of the effects of organizational
behavior modification on task performance, 1975-95. Academy of Management Journal,
40(5), pp. 1122.
STAJKOVIC, A.D. and LUTHANS, F., 1998. Self-efficacy and work-related performance: A
meta-analysis. Psychological bulletin, 124(2), pp. 240.
STAJKOVIC, A.D. and LUTHANS, F., 2001. Differential effects of incentive motivators on work
performance. Academy of Management Journal, 44(3), pp. 580.
STAJKOVIC, A.D. and LUTHANS, F., 2003. Behavioral management and task performance in
organizations: Conceptual background, meta-analysis, and test of alternative models.
Personnel Psychology, 56(1), pp. 155.
70
SWINDALL, C., 2010. The Epidemic of Employee Disengagement. Rural Telecommunications,
29(5), pp. 30.
TOWERS PERRIN (2008), Closing the Engagement Gap: A Road Map for Driving Superior
Business Performance. Towers Perrin Global Workforce Study 2007-2008
VAN EERDE, W. and THIERRY, H., 1996. Vroom's expectancy models and work-related
criteria: A meta-analysis. Journal of Applied Psychology, 81(5), pp. 575.
WUBBE, E., 2010. The Morale Stimulus Plan. The Secured Lender, 66(6), pp. 25.
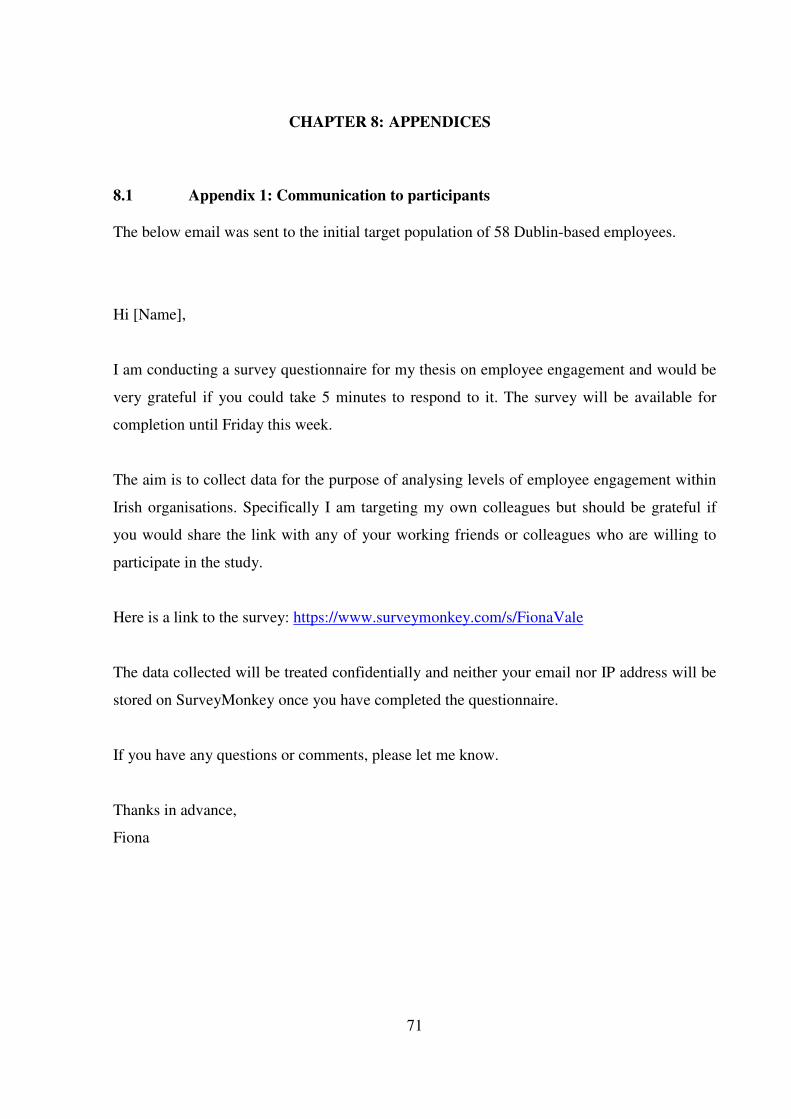
71
CHAPTER 8: APPENDICES
8.1 Appendix 1: Communication to participants
The below email was sent to the initial target population of 58 Dublin-based employees.
Hi [Name],
I am conducting a survey questionnaire for my thesis on employee engagement and would be
very grateful if you could take 5 minutes to respond to it. The survey will be available for
completion until Friday this week.
The aim is to collect data for the purpose of analysing levels of employee engagement within
Irish organisations. Specifically I am targeting my own colleagues but should be grateful if
you would share the link with any of your working friends or colleagues who are willing to
participate in the study.
Here is a link to the survey: https://www.surveymonkey.com/s/FionaVale
The data collected will be treated confidentially and neither your email nor IP address will be
stored on SurveyMonkey once you have completed the questionnaire.
If you have any questions or comments, please let me know.
Thanks in advance,
Fiona

72
8.2 Appendix 2: Survey questionnaire
A copy of the engagement survey sent electronically is on the following pages.

73

74

75

76

77
78
8.3 Appendix 3: Copy of responses
A copy of all measurable responses received is on the following pages. It should be noted that
questions six, seven, nine and eleven are not included as these were open-ended questions not
featured on the Gallup Q12®
workplace audit questionnaire and were not used for measuring
engagement levels.