
Titan Company - visit note-Jul-17-EDEL -...
15
Edelweiss Research is also available on www.edelresearch.com, Bloomberg EDEL <GO>, Thomson First Call, Reuters and Factset. Edelweiss Securities Limited Our recent interaction with Titan Company’s (Titan) management and visit to Taneira store (saree venture) in Bengaluru reinforce our confidence in the company’s bright prospects. Management perceives GST as a positive development and a potent catalyst for compliant players like Tanishq to gain market share. Growth remains key agenda— targeting 2.5x jump in jewellery business by FY22, ~20% CAGR from current INR102bn sales. Moreover, entry in the saree business via Taneira with 2 pilot stores in Bengaluru has exceeded Titan’s expectations; planning to test waters in Mumbai and Delhi as well. In Q1FY18, performance across businesses was good, especially jewellery (50% growth over Akshay Tritiya in FY17). Maintain ‘BUY’. GST: Jewellery to shine; slight negative for other segments Management believes GST will enhance overall compliance level in the jewellery industry—root out practice of making multiple bills for single transaction to circumvent the INR0.2mn PAN card rule. Though increase in tax rate on watches and sun glasses to 28% post GST from ~23‐24% earlier is a negative, Titan expects the impact to be negligible as it will avail 400‐500bps as input tax credit on rentals and advertisement. The company will, however, compensate distributors for any loss incurred due to increase in the tax rate. New businesses: On a roll; eyeing expansions The Skinn (perfumes) business is doing well and Titan is targeting doubling of sales led by entry in new categories (body mist) and expansion of distribution reach. Similarly, Taneira will be expanded pan‐India post completion of the test market phase—initial response has exceeded expectations. Also, in watches, new launches with smart features—Fastrack Reflex (smart band)—are on the anvil. Outlook and valuations: Positive; maintain ‘BUY’ We envisage Titan to be key beneficiary of share gains led by GST, while entry in new segments and retail expansion will boost growth. Moreover, rising share of studded jewellery and cost optimisation will aid margin. The stock is currently trading at 37.5x FY19E EPS. We recommend ‘BUY‘ and rate it ‘SO’ with target price of INR600. VISIT NOTE TITAN COMPANY Novel nudge, thriving share to prop up growth EDELWEISS 4D RATINGS Absolute Rating BUY Rating Relative to Sector Outperform Risk Rating Relative to Sector Low Sector Relative to Market Underweight MARKET DATA (R: TITN.BO, B: TTAN IN) CMP : INR 536 Target Price : INR 600 52‐week range (INR) : 569 / 296 Share in issue (mn) : 887.8 M cap (INR bn/USD mn) : 475 / 7,346 Avg. Daily Vol.BSE/NSE(‘000) : 1,744.3 SHARE HOLDING PATTERN (%) Current Q3FY17 Q2FY17 Promoters * 53.1 53.1 53.1 MF's, FI's & BK’s 5.4 6.0 4.5 FII's 21.1 20.2 22.0 Others 20.4 20.8 20.4 * Promoters pledged shares (% of share in issue) : NIL PRICE PERFORMANCE (%) Stock Nifty EW Retail Index 1 month 13.5 (0.4) (0.3) 3 months 16.6 4.1 4.0 12 months 32.2 14.8 23.7 Abneesh Roy +91 22 6620 3141 [email protected] Tanmay Sharma, CFA +91 22 4040 7586 [email protected] Alok Shah +91 22 6620 3040 [email protected] India Equity Research| Retail July 5, 2017 Financials Year to March FY16 FY17E FY18E FY19E Revenues (INR mn) 112,759 129,789 151,871 179,217 Rev. growth (%) (5.4) 15.1 17.0 18.0 EBITDA (INR mn) 9,347 11,555 15,035 19,176 Adjusted Profit (INR mn) 6,745 8,000 10,010 12,683 Adjusted Diluted EPS (INR) 7.6 9.0 11.3 14.3 EPS growth (%) (17.4) 18.6 25.1 26.7 Diluted P/E (x) 70.5 59.4 47.5 37.5 EV/EBITDA (x) 50.8 40.8 31.5 24.6 ROAE (%) 20.5 21.5 23.5 25.3
Transcript of Titan Company - visit note-Jul-17-EDEL -...
Edelweiss Research is also available on www.edelresearch.com, Bloomberg EDEL <GO>, Thomson First Call, Reuters and Factset. Edelweiss Securities Limited
Our recent interaction with Titan Company’s (Titan) management and visit to Taneira store (saree venture) in Bengaluru reinforce our confidence in the company’s bright prospects. Management perceives GST as a positive development and a potent catalyst for compliant players like Tanishq to gain market share. Growth remains key agenda—targeting 2.5x jump in jewellery business by FY22, ~20% CAGR from current INR102bn sales. Moreover, entry in the saree business via Taneira with 2 pilot stores in Bengaluru has exceeded Titan’s expectations; planning to test waters in Mumbai and Delhi as well. In Q1FY18, performance across businesses was good, especially jewellery (50% growth over Akshay Tritiya in FY17). Maintain ‘BUY’.
GST: Jewellery to shine; slight negative for other segments
Management believes GST will enhance overall compliance level in the jewellery
industry—root out practice of making multiple bills for single transaction to circumvent
the INR0.2mn PAN card rule. Though increase in tax rate on watches and sun glasses to
28% post GST from ~23‐24% earlier is a negative, Titan expects the impact to be
negligible as it will avail 400‐500bps as input tax credit on rentals and advertisement.
The company will, however, compensate distributors for any loss incurred due to
increase in the tax rate.
New businesses: On a roll; eyeing expansions
The Skinn (perfumes) business is doing well and Titan is targeting doubling of sales led
by entry in new categories (body mist) and expansion of distribution reach. Similarly,
Taneira will be expanded pan‐India post completion of the test market phase—initial
response has exceeded expectations. Also, in watches, new launches with smart
features—Fastrack Reflex (smart band)—are on the anvil.
Outlook and valuations: Positive; maintain ‘BUY’
We envisage Titan to be key beneficiary of share gains led by GST, while entry in new
segments and retail expansion will boost growth. Moreover, rising share of studded
jewellery and cost optimisation will aid margin. The stock is currently trading at 37.5x
FY19E EPS. We recommend ‘BUY‘ and rate it ‘SO’ with target price of INR600.
VISIT NOTE
TITAN COMPANYNovel nudge, thriving share to prop up growth
EDELWEISS 4D RATINGS
Absolute Rating BUY
Rating Relative to Sector Outperform
Risk Rating Relative to Sector Low
Sector Relative to Market Underweight
MARKET DATA (R: TITN.BO, B: TTAN IN)
CMP : INR 536
Target Price : INR 600
52‐week range (INR) : 569 / 296
Share in issue (mn) : 887.8
M cap (INR bn/USD mn) : 475 / 7,346
Avg. Daily Vol.BSE/NSE(‘000) : 1,744.3 SHARE HOLDING PATTERN (%)
Current Q3FY17 Q2FY17
Promoters *
53.1 53.1 53.1
MF's, FI's & BK’s 5.4 6.0 4.5
FII's 21.1 20.2 22.0
Others 20.4 20.8 20.4
* Promoters pledged shares (% of share in issue)
: NIL
PRICE PERFORMANCE (%)
Stock Nifty
EW Retail Index
1 month 13.5 (0.4) (0.3)
3 months 16.6 4.1 4.0
12 months 32.2 14.8 23.7
Abneesh Roy +91 22 6620 3141
Tanmay Sharma, CFA +91 22 4040 7586
Alok Shah +91 22 6620 3040
India Equity Research| Retail
July 5, 2017
FinancialsYear to March FY16 FY17E FY18E FY19ERevenues (INR mn) 112,759 129,789 151,871 179,217Rev. growth (%) (5.4) 15.1 17.0 18.0EBITDA (INR mn) 9,347 11,555 15,035 19,176Adjusted Profit (INR mn) 6,745 8,000 10,010 12,683Adjusted Diluted EPS (INR) 7.6 9.0 11.3 14.3EPS growth (%) (17.4) 18.6 25.1 26.7Diluted P/E (x) 70.5 59.4 47.5 37.5EV/EBITDA (x) 50.8 40.8 31.5 24.6ROAE (%) 20.5 21.5 23.5 25.3

Retail
2 Edelweiss Securities Limited
Titan Q1FY18 preview: Our expectation
Market share improvement is likely to sustain in Q1FY18 as well, further aided by GST
implementation. Titan had clocked good growth in Q1FY18 led by favourable base, strong
Akshay Tritiya (50% growth over Akshay Tritiya in FY17 period), new launches and refreshes
in existing brands as well as successful gold exchange programme and activations in studded
jewellery. We expect jewellery sales to jump ~25% YoY on a base of 3.2% (Q4FY17 sales had
jumped 55% YoY spearheaded by strong festive and wedding season on base of 1%). In
watches, retail formats are likely to record healthy revenue growth, but top line may remain
flat due to rescheduling of Titan and Fastrack activations. Eye plus retail format should
continue to post healthy LTL growth in Q1FY18. However, slowdown in sunglasses is likely to
dent overall sales growth. We estimate ~5% YoY growth in eyewear on a base on 2.9% YoY
in Q1FY17 (clocked 13.1% YoY in Q4FY17 on a base of 10% YoY). Table 1: Q1FY18E preview for Titan
Source: Edelweiss research
Meeting with management: Key takeaways
Jewellery
Titan’s focus is to grow jewellery sales 2.5x over the next 5 years.
On the margin front, dilution is unlikely; some margin expansion will be led by
operating leverage which will be reinvested in the business to drive overall growth.
Titan will even reinvest in new growth drivers such as Taneira and could even eye
inorganic growth.
Currently, the company is running a gold exchange scheme. Titan gets 40‐45% of gold
through the exchange route.
Dubai is mulling 5% sales tax on gold. This will eliminate the advantage of buying gold in
the country.
Post demonetisation, the company has gained market share. However, on‐ground
situation has recovered post that for unorganised jewellers, though compliance has
increased.
Making multiple bills for single transaction will become difficult under the GST regime
as tax will have to be paid on a particular product for which a mapping mechanism
will be in place, separate IDs for a product will be mandatory etc.
Currently, Tanishq is in close to 150 towns and could expand to more 100 towns. Rate
of new store addition is 25 stores per year. Hence, scope for expansion is humungous.
Titan is focusing on the omni‐channel as well as it can be effective in the jewellery
segment—a customer can choose an assortment online and purchase it offline, book
online etc. The company’s large collections are being downloaded by millions from its
website. This indicates that consumers are first witnessing products online and then
purchasing them offline.
Q1FY18E Q1FY17 Q4FY16 (IGAAP) YoY growth (%) Q4FY17 QoQ growth (%)
Revenues 33,422 27,988 24,563 19.4 34,297 (2.6)
EBITDA 3,309 2,922 2,101 13.3 2,721 21.6
PAT 2,382 2,236 1,841 6.5 2,029 17.4
Other income 150 134 237 273
Tax 752 471 139 658
EBITDA margin 9.9 10.4 7.9

Titan Company
3 Edelweiss Securities Limited
Tanishq advertisements have shifted from TV to online channels such as youtube.
E‐commerce will do well at a particular price point; not at a very high ticket price.
Caratlane is also clocking good growth, in line with expectations. Integration of this
business with Titan is progressing well and has also helped take the eyewear business
online. Titan’s current stake in Caratlane stands at 65%.
Consumer sentiments as well as demand recovered significantly (post demonetisation)
by the beginning of Q4FY17.
The company posted double digit growth in April. Akshay Tritiya was strong for the
jewellery business.
Not facing problems in getting franchisees for Tanishq.
Confident of strong growth in FY18 led by wedding season, high‐value diamond
jewellery and market share, GHS & network expansion.
Targeting ~17% YoY growth in FY18, similar to FY17.
Watches
Recently launched smartband Fastrack (Reflex) is doing well and the company is
placing re‐orders to meet the rising demand. It is manufactured in China.
The company is planning to launch a ladies smart watch in the near future which will be
lighter and a more feminine hybrid offering.
Juxt collection did well and has been completely sold out. However, Pro collection has
not been very successful.
To revive growth in watches, the company has many smart products in the pipeline.
Taneira (we visited the store as well)
Taneira has been doing very well and has exceeded initial expectations of the company.
The collection entails handloom sarees from across India (20 states).
Price point can range from INR2,500‐0.25mn for a saree.
Success of Taneira will be apparent by 2018 end.
The company is also organizing exhibitions for Taneira in Tier 1 and 2 cities to gauge
market potential in the coming year.
Standard size of a Taneira store can be 3,000‐4,000sq ft. However, Indira Nagar store is
a bungalow and the Jaya Nagar store is a 3 storey building. Both the stores are doing
well, but the company as of now is experimenting as far as store format is concerned.
Taneira will not be a daily wear brand and has been positioned as a special wear
occasion.
The company will do pilots in at least 2 or 3 more metros. Already has 2 stores in
Bengaluru (can launch 1 store each in Delhi and Mumbai).
GST
Under GST, while spectacles will be taxed at 12%, frames at 18%. A combination of
these will be taxed at 12%. Tax on sunglasses, however, has been increased to 28%—a
negative. Sunglasses were imported and effective rate was far lower and GST rate has
increased it significantly – sunglasses however is not a big part of the business (~earlier
it was less than 24%).
Retail
4 Edelweiss Securities Limited
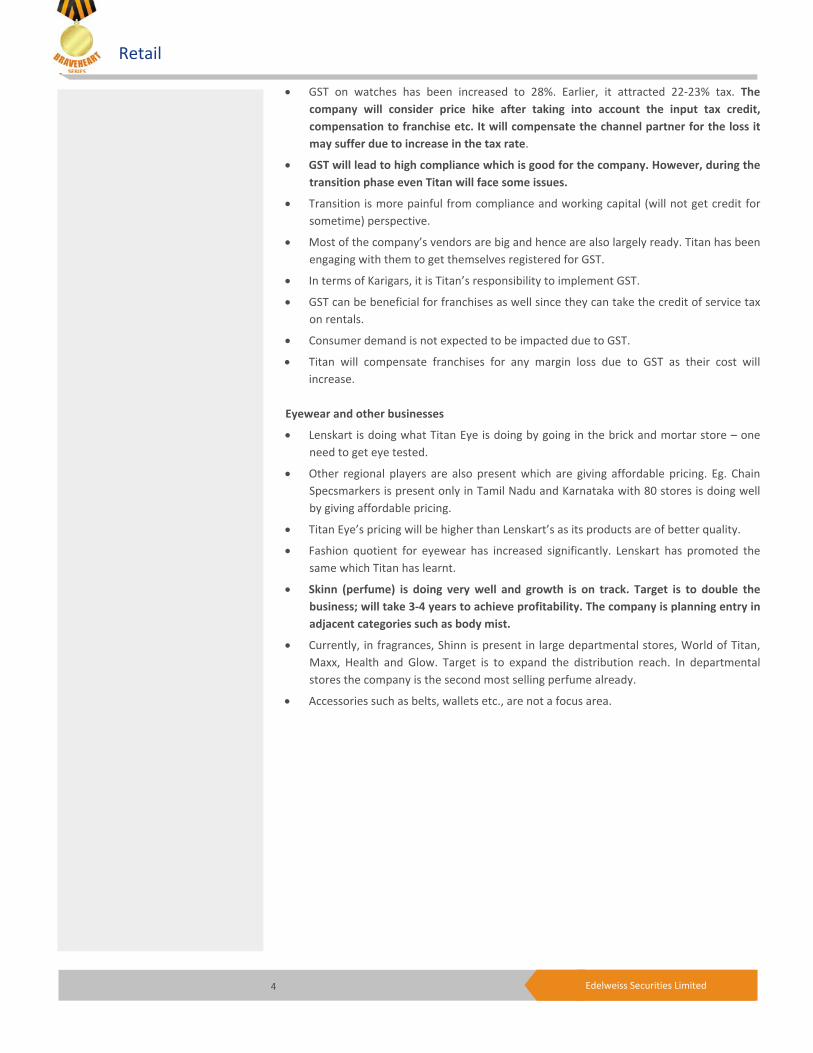
GST on watches has been increased to 28%. Earlier, it attracted 22‐23% tax. The
company will consider price hike after taking into account the input tax credit,
compensation to franchise etc. It will compensate the channel partner for the loss it
may suffer due to increase in the tax rate.
GST will lead to high compliance which is good for the company. However, during the
transition phase even Titan will face some issues.
Transition is more painful from compliance and working capital (will not get credit for
sometime) perspective.
Most of the company’s vendors are big and hence are also largely ready. Titan has been
engaging with them to get themselves registered for GST.
In terms of Karigars, it is Titan’s responsibility to implement GST.
GST can be beneficial for franchises as well since they can take the credit of service tax
on rentals.
Consumer demand is not expected to be impacted due to GST.
Titan will compensate franchises for any margin loss due to GST as their cost will
increase.
Eyewear and other businesses
Lenskart is doing what Titan Eye is doing by going in the brick and mortar store – one
need to get eye tested.
Other regional players are also present which are giving affordable pricing. Eg. Chain
Specsmarkers is present only in Tamil Nadu and Karnataka with 80 stores is doing well
by giving affordable pricing.
Titan Eye’s pricing will be higher than Lenskart’s as its products are of better quality.
Fashion quotient for eyewear has increased significantly. Lenskart has promoted the
same which Titan has learnt.
Skinn (perfume) is doing very well and growth is on track. Target is to double the
business; will take 3‐4 years to achieve profitability. The company is planning entry in
adjacent categories such as body mist.
Currently, in fragrances, Shinn is present in large departmental stores, World of Titan,
Maxx, Health and Glow. Target is to expand the distribution reach. In departmental
stores the company is the second most selling perfume already.
Accessories such as belts, wallets etc., are not a focus area.

Titan Company
5 Edelweiss Securities Limited
Fig. 1: Titan new venture in sarees – Taneira
Source: Company
Table 1: Trends at a glance
Source: Company, Edelweiss research
Q3FY15 Q4FY15 Q1FY16 Q2FY16 Q3FY16 Q4FY16 Q1FY17 Q2FY17 Q3FY17 Q4FY17
Watches & clocks sales growth (% YoY) (1.9) 1.8 9.1 5.5 9.3 (12.1) 1.5 (5.2) 5.1 10.8
Watches volume growth (% YoY) (4.0) (6.0) (4.0) ‐ ‐ (19.0) 1.0 (9.0) 6.0 6.0
Jewellery sales growth (% YoY) 11.2 (15.3) (10.9) (32.3) 20.1 1.0 3.2 0.2 15.2 55.0
Jewellery gramage growth (% YoY) 25.0 (11.0) (10.0) (10.0) 28.0 15.0 6.0 (32.0) 4.0 4.0
Gold price change (% YoY) (3.0) (5.0) (13.0) (7.0) 7.0 13.0 20.0 21.0 14.0 14.0
Eyewear sales growth (% YoY) NA NA 19.7 16.5 3.2 10.0 2.9 6.6 12.4 13.1
Others sales growth (% YoY) NA NA 36.3 (6.8) (5.7) (82.3) 36.4 20.0 44.5 19.2
World of Titan (3.0) 5.0 ‐ (4.0) 3.0 (9.0) 6.0 (2.0) 9.0 5.0
Tanishq (8.0) (25.0) (12.0) (40.0) 30.0 (5.0) 3.0 4.0 15.0 52.0
Goldplus 30.0 (4.0) (24.0) (28.0) (9.0) (16.0) (1.0) (7.0) 8.0 NA
Helios 4.0 3.0 4.0 14.0 14.0 15.0 13.0 1.0 11.0 (3.0)
Fastrack (6.0) (4.0) (4.0) (9.0) (5.0) (5.0) (1.0) (5.0) 1.0 (1.0)
LFS ‐ Watches (5.0) 8.0 ‐ 8.0 17.0 (7.0) 16.0 4.0 13.0 3.0
Titan Eye+ 9.0 ‐ 13.0 1.0 (2.0) 7.0 4.0 4.0 1.0
Watches & clocks 9.7 9.6 9.9 15.1 6.7 1.7 14.3 12.3 10.4 2.4
Jewellery 9.6 12.7 8.7 6.1 10.3 11.3 10.2 11.0 10.3 9.9
Eyewear NA 10.8 1.8 4.8 0.9 13.8 5.9 2.1 (3.2) 9.8
Others NA (14.4) (22.8) (9.3) (24.1) (70.0) (3.1) (8.2) (8.7) (103.4)
LTL sales growth (%)
PBIT margins %

Retail
6 Edelweiss Securities Limited
Table 2: Store expansion
Source: Company, Edelweiss research
Outlook and valuations: Positive; maintain ‘BUY’
Demand has started witnessing signs of improvement particularly urban demand. Titan
stands to benefit of retail expansion—added ~0.4mn sq ft of retail space in jewellery during
FY12‐16 on base of 0.46mn sq ft. However the company added only 62,000 sq ft in Tanishq –
has targeted to go for aggressive growth in FY18 and hence will focus on expansion in
smaller towns and increasing share in high‐margin wedding jewellery segment
(management believes ~15‐20 stores can be added annually to tap demand in smaller
towns).
We expect that growth in FY18 will remain strong not only led by entry into higher value
wedding jewellery segment, store expansion but also led by new version of GHS –
enrolment are increasing on a month on month basis and rising preference for Tanishq
brand, especially post the cut in making charges (which has made it accessible to a larger
consumer base), steady shift in preference to organised jewellers from unorganised players
and higher studded share. The year has started with a strong growth in the jewellery
business (50% YoY growth in Akshya Tritiya period) and the company has not seen much
impact due to GST implementation. Organised players such as Titan are gaining market
share led by demonetization and will also gain with GST coming in. and hence we expect
market share gains to sustain. Improvement in productivity in manufacturing, sourcing and
rising margin in studded jewellery have helped Titan maintain margin, despite cut in making
charges. Innovations like Uttara, Niloufer etc., have done well and will not only drive overall
growth, but also aid margin by increasing studded share.. Also, earlier launch of innovative
collections like Divyam and Zuhur will improve sales of higher‐ticket items in jewellery, thus
improving mix. Titan has also sharpened focus on wedding jewellery, which is a low hanging
fruit. Apart from jewellery, watches and eyewear segment has also started witnessing good
growth – expected to sustain helped by new launches and steps such as closure of loss
making stores, inventory management etc. We assign a target multiple of 42x to arrive at a
target price of INR600. We maintain ‘BUY /Sector Outperformer’.
Store expansion FY14 FY15 Q1FY16 Q2FY16 Q3FY16 Q4FY16 Q1FY17 Q2FY17 Q3FY17 Q4FY17
Jewellery 198 209 212 216 221 227 229 229 235 239
Tanishq 163 174 177 181 186 193 197 198 204 208
Goldplus 33 33 33 33 33 32 30 29 29 29
Mia NA NA NA NA NA NA NA NA 32 32
Carat Lane NA NA NA NA NA NA NA NA 14 15
Zoya 2 2 2 2 2 2 2 2 2 2
Watches 600 626 627 632 646 652 659 674 672 678
World of Titan 401 430 427 434 446 452 458 467 470 474
Fastrack 150 154 157 157 159 159 160 163 155 155
Helios 49 42 43 41 41 41 41 44 47 49
EyePlus 280 366 384 398 399 404 405 406 428 448
Total 1,078 1,201 1,223 1,246 1,266 1,283 1,293 1,309 1,335 1,365

Titan Company
7 Edelweiss Securities Limited
Company Description
Titan was incorporated in 1984 as a joint venture between the TATA Group and Tamil Nadu
Industrial Development Corporation (TIDCO), a Government of Tamil Nadu undertaking. The
company manufactures and markets quartz watches since 1987 and is now India’s leading
watch manufacturer and retailer. Gradually, jewellery, precision engineering, eyewear,
accessories, and licensed products were added to the watches portfolio. The Titan brand
was extended to Tanishq and other retail businesses. Jewellery business now contributes
~80% to sales with Tanishq being the largest (has jewellery retail space of ~0.9mn sq ft) and
most reputed jeweller in the organized space. Investment Theme
The Indian retail landscape is evolving with interplay of several demographic and economic
factors. The long‐term prospects backed by changing consumer behaviour in favour of larger
discretionary spending, has set the stage for a healthy growth in the retail space over the
next five years. The big opportunity lies in the growing share of organised retail with
growing trend among consumers to allocate a larger share of income to consumption and
gradual improvement in lifestyle.
Titan has assiduously positioned itself in the premium designer jewellery space. We believe
Titan has the ability to create significant value with its large distribution presence, strong
brand, designing skills and proven execution track record. Titan has proved its metal time
and again by emerging strong and successful against various regulatory hurdles that have
emerged over the past one year. With robust balance sheet, strong brand equity and
professional management team in place we remain bullish on Titan.
Key Risks
Reduction in customs duty: Customs duty which is currently at 10% has lead to rampant
smuggling and it is likely that it will be reduced in the near term. Any reduction in custom
duty will lead to write back in inventory.
Deterioration of macro conditions: Poor macro outlook could lead to prolonged slowdown
in the company’s growth as the company’s revenues depend on discretionary spend.
Volatility in gold prices: Gold prices have a significant bearing on gold demand. Any steep
rise in prices results in lower demand, and investment buying that comes in is low margin.
Margin pressure due to deterioration in product mix and investment buying: Down trading
in watches and jewellery divisions on account of fall in discretionary spending and higher
growth in tier II and IV towns could impact margins.
Business seasonal, restricted to marriage season and festivals: The jewellery segment is
seasonal with respect to marriage season and festivals. Additionally, the number of wedding
dates varies in a year. This could impact the company’s revenue.
Regulatory hurdles: As gold is one of the key import articles, Government actions to curb its
demand thereby impacts the jewellery business by reducing demand and/or increasing
costs like customs duty, lease rate, etc if not eased / tightened further pose a risk to the
jewellery business.

8 Edelweiss Securities Limited
Retail
Financial Statements
Income statement (INR mn)
Year to March FY16 FY17 FY18E FY19E
Net revenue 112,759 129,789 151,871 179,217
Materials costs 81,807 94,292 109,347 128,140
Gross profit 30,952 35,497 42,524 51,077
Employee costs 6,963 7,939 8,960 10,215
Other Expenses 10,347 11,374 13,213 15,413
Ad. & sales costs 4,295 4,630 5,315 6,273
EBITDA 9,347 11,555 15,035 19,176
Depreciation 982 1,105 1,319 1,455
EBIT 8,366 10,450 13,717 17,722
Add: Other income 739.2 704.9 739.9 540.51
Less: Interest Expense 424 377 562 655
Add: Exceptional items ‐ (1,027) ‐ ‐
Profit Before Tax 8,681 9,750 13,895 17,608
Less: Provision for Tax 1,916 2,760 3,891 4,930
Associate profit share 20 18 (6) (6)
Reported Profit 6,745 6,973 10,010 12,683
Exceptional Items ‐ (1,027) ‐ ‐
Adjusted Profit 6,745 8,000 10,010 12,683
Shares o /s (mn) 888 888 888 888
Adjusted Basic EPS 7.6 9.0 11.3 14.3
Diluted shares o/s (mn) 888 888 888 888
Adjusted Diluted EPS 7.6 9.0 11.3 14.3
Adjusted Cash EPS 8.7 10.3 12.8 15.9
Dividend per share (DPS) 2.2 2.4 3.4 4.3
Dividend Payout Ratio(%) 34.8 35.1 35.1 35.1
Common size metrics
Year to March FY16 FY17 FY18E FY19E
Materials costs 72.6 72.7 72.0 71.5
Staff costs 6.2 6.1 5.9 5.7
Ad. & sales costs 3.8 3.6 3.5 3.5
Other expenses 9.2 8.8 8.7 8.6
Depreciation 0.9 0.9 0.9 0.8
Interest Expense 0.4 0.3 0.4 0.4
EBITDA margins 8.3 8.9 9.9 10.7
EBIT margins 7.4 8.1 9.0 9.9
Net Profit margins 6.0 6.2 6.6 7.1
Growth ratios (%)
Year to March FY16 FY17 FY18E FY19E
Revenues (5.4) 15.1 17.0 18.0
EBITDA (18.6) 23.6 30.1 27.5
PBT (17.2) 12.3 42.5 26.7
Adjusted Profit (17.4) 18.6 25.1 26.7
EPS (17.4) 18.6 25.1 26.7
Key Assumptions
Year to March FY16 FY17 FY18E FY19E
Company
GDP(Y‐o‐Y %) 7.2 6.5 7.1 7.7
Inflation (Avg) 4.9 4.8 5.0 5.2
Repo rate (exit rate) 6.8 6.3 6.3 6.3
USD/INR (Avg) 65.0 67.5 67.0 67.0
Watch ‐ growth (%) 1.6 3.0 12.0 15.0
Jewellery ‐ growth (%) (7.6) 18.6 18.0 18.5
Eyewear ‐ growth (%) 11.8 8.5 12.0 15.0
EBITDA margin (%)
COGS as % of sales 72.6 72.7 72.0 71.5
Gold as % of COGS 80.5 80.5 80.5 80.5
Components as % of COGS 9.6 9.6 9.6 9.6
Purchases (% of COGS) 17.2 17.2 17.2 17.2
Staff costs (% of rev) 6.2 6.1 5.9 5.7
A&P as % of sales 3.8 3.6 3.5 3.5
Financial assumptions
Tax rate (%) 22.1 25.6 28.0 28.0
EBITDA margin 8.3 8.9 9.9 10.7
Capex (INR mn) 1,568 4,332 2,000 2,000
Debtor days 21 15 20 20
Inventory days 190 189 190 190
Payable days 82 90 90 90
Cash conversion cycle 128 114 120 120
Dep. (% gross block) 7.2 6.7 6.8 6.8
Interest rate on cash 54.9 13.3 14.0 16.0
Dividend payout ‐ 30.0 30.0 30.0
9 Edelweiss Securities Limited
Titan Company
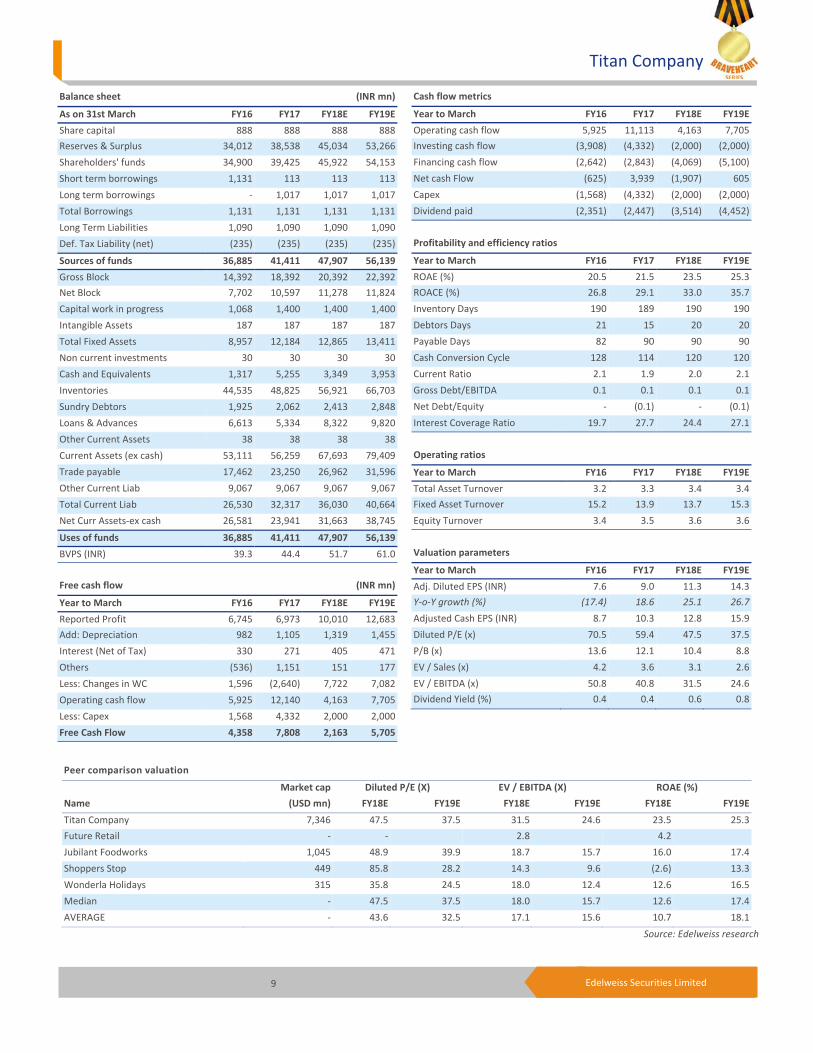
Peer comparison valuation
Market cap Diluted P/E (X) EV / EBITDA (X) ROAE (%)
Name (USD mn) FY18E FY19E FY18E FY19E FY18E FY19E
Titan Company 7,346 47.5 37.5 31.5 24.6 23.5 25.3
Future Retail ‐ ‐ 2.8 4.2
Jubilant Foodworks 1,045 48.9 39.9 18.7 15.7 16.0 17.4
Shoppers Stop 449 85.8 28.2 14.3 9.6 (2.6) 13.3
Wonderla Holidays 315 35.8 24.5 18.0 12.4 12.6 16.5
Median ‐ 47.5 37.5 18.0 15.7 12.6 17.4
AVERAGE ‐ 43.6 32.5 17.1 15.6 10.7 18.1
Source: Edelweiss research
Cash flow metrics
Year to March FY16 FY17 FY18E FY19E
Operating cash flow 5,925 11,113 4,163 7,705
Investing cash flow (3,908) (4,332) (2,000) (2,000)
Financing cash flow (2,642) (2,843) (4,069) (5,100)
Net cash Flow (625) 3,939 (1,907) 605
Capex (1,568) (4,332) (2,000) (2,000)
Dividend paid (2,351) (2,447) (3,514) (4,452)
Profitability and efficiency ratios
Year to March FY16 FY17 FY18E FY19E
ROAE (%) 20.5 21.5 23.5 25.3
ROACE (%) 26.8 29.1 33.0 35.7
Inventory Days 190 189 190 190
Debtors Days 21 15 20 20
Payable Days 82 90 90 90
Cash Conversion Cycle 128 114 120 120
Current Ratio 2.1 1.9 2.0 2.1
Gross Debt/EBITDA 0.1 0.1 0.1 0.1
Net Debt/Equity ‐ (0.1) ‐ (0.1)
Interest Coverage Ratio 19.7 27.7 24.4 27.1
Operating ratios
Year to March FY16 FY17 FY18E FY19E
Total Asset Turnover 3.2 3.3 3.4 3.4
Fixed Asset Turnover 15.2 13.9 13.7 15.3
Equity Turnover 3.4 3.5 3.6 3.6
Valuation parameters
Year to March FY16 FY17 FY18E FY19E
Adj. Diluted EPS (INR) 7.6 9.0 11.3 14.3
Y‐o‐Y growth (%) (17.4) 18.6 25.1 26.7
Adjusted Cash EPS (INR) 8.7 10.3 12.8 15.9
Diluted P/E (x) 70.5 59.4 47.5 37.5
P/B (x) 13.6 12.1 10.4 8.8
EV / Sales (x) 4.2 3.6 3.1 2.6
EV / EBITDA (x) 50.8 40.8 31.5 24.6
Dividend Yield (%) 0.4 0.4 0.6 0.8
Balance sheet (INR mn)
As on 31st March FY16 FY17 FY18E FY19E
Share capital 888 888 888 888
Reserves & Surplus 34,012 38,538 45,034 53,266
Shareholders' funds 34,900 39,425 45,922 54,153
Short term borrowings 1,131 113 113 113
Long term borrowings ‐ 1,017 1,017 1,017
Total Borrowings 1,131 1,131 1,131 1,131
Long Term Liabilities 1,090 1,090 1,090 1,090
Def. Tax Liability (net) (235) (235) (235) (235)
Sources of funds 36,885 41,411 47,907 56,139
Gross Block 14,392 18,392 20,392 22,392
Net Block 7,702 10,597 11,278 11,824
Capital work in progress 1,068 1,400 1,400 1,400
Intangible Assets 187 187 187 187
Total Fixed Assets 8,957 12,184 12,865 13,411
Non current investments 30 30 30 30
Cash and Equivalents 1,317 5,255 3,349 3,953
Inventories 44,535 48,825 56,921 66,703
Sundry Debtors 1,925 2,062 2,413 2,848
Loans & Advances 6,613 5,334 8,322 9,820
Other Current Assets 38 38 38 38
Current Assets (ex cash) 53,111 56,259 67,693 79,409
Trade payable 17,462 23,250 26,962 31,596
Other Current Liab 9,067 9,067 9,067 9,067
Total Current Liab 26,530 32,317 36,030 40,664
Net Curr Assets‐ex cash 26,581 23,941 31,663 38,745
Uses of funds 36,885 41,411 47,907 56,139
BVPS (INR) 39.3 44.4 51.7 61.0
Free cash flow (INR mn)
Year to March FY16 FY17 FY18E FY19E
Reported Profit 6,745 6,973 10,010 12,683
Add: Depreciation 982 1,105 1,319 1,455
Interest (Net of Tax) 330 271 405 471
Others (536) 1,151 151 177
Less: Changes in WC 1,596 (2,640) 7,722 7,082
Operating cash flow 5,925 12,140 4,163 7,705
Less: Capex 1,568 4,332 2,000 2,000
Free Cash Flow 4,358 7,808 2,163 5,705
10 Edelweiss Securities Limited
Retail
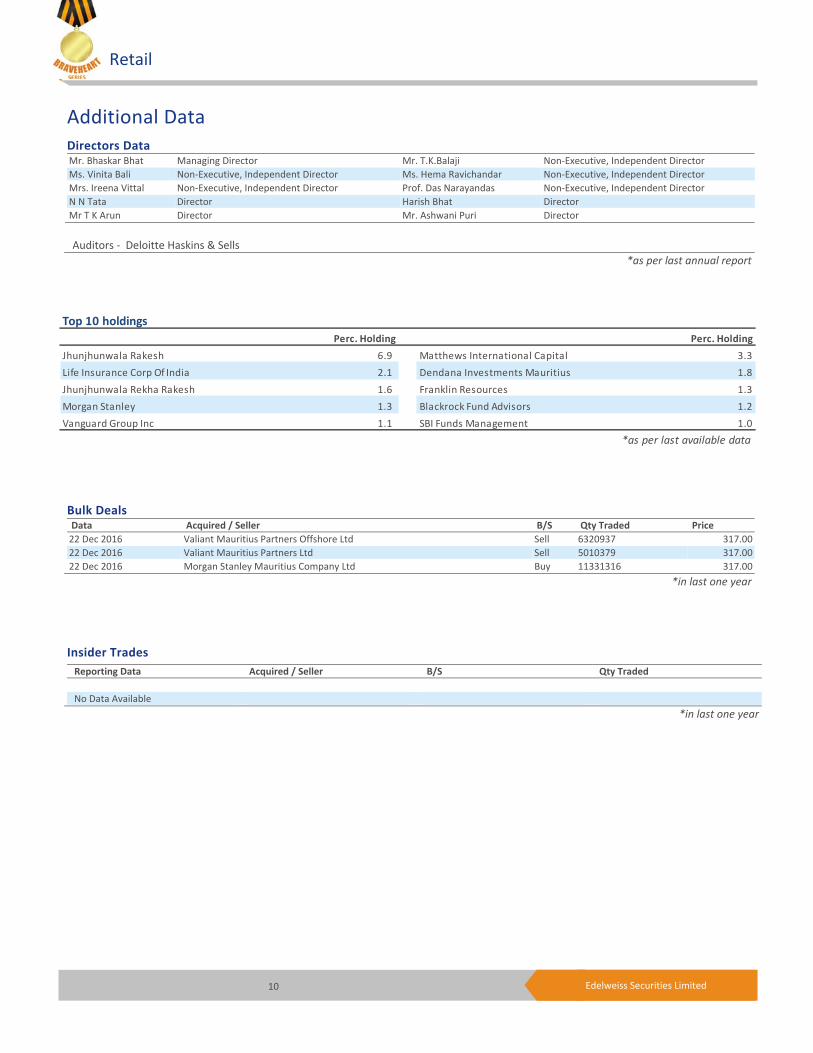
Top 10 holdings
Perc. Holding Perc. Holding
Jhunjhunwala Rakesh 6.9 Matthews International Capital 3.3
Life Insurance Corp Of India 2.1 Dendana Investments Mauritius 1.8
Jhunjhunwala Rekha Rakesh 1.6 Franklin Resources 1.3
Morgan Stanley 1.3 Blackrock Fund Advisors 1.2
Vanguard Group Inc 1.1 SBI Funds Management 1.0
*as per last available data
Insider Trades Reporting Data Acquired / Seller B/S Qty Traded
No Data Available
*in last one year
Bulk Deals Data Acquired / Seller B/S Qty Traded Price
22 Dec 2016 Valiant Mauritius Partners Offshore Ltd Sell 6320937 317.00
22 Dec 2016 Valiant Mauritius Partners Ltd Sell 5010379 317.00
22 Dec 2016 Morgan Stanley Mauritius Company Ltd Buy 11331316 317.00
*in last one year
Additional Data
Directors Data Mr. Bhaskar Bhat Managing Director Mr. T.K.Balaji Non‐Executive, Independent Director
Ms. Vinita Bali Non‐Executive, Independent Director Ms. Hema Ravichandar Non‐Executive, Independent Director
Mrs. Ireena Vittal Non‐Executive, Independent Director Prof. Das Narayandas Non‐Executive, Independent Director
N N Tata Director Harish Bhat Director
Mr T K Arun Director Mr. Ashwani Puri Director
Auditors ‐ Deloitte Haskins & Sells
*as per last annual report
11 Edelweiss Securities Limited
Company Absolute
reco Relative
reco Relative
risk
Company Absolute
reco
Relative
reco
Relative
Risk
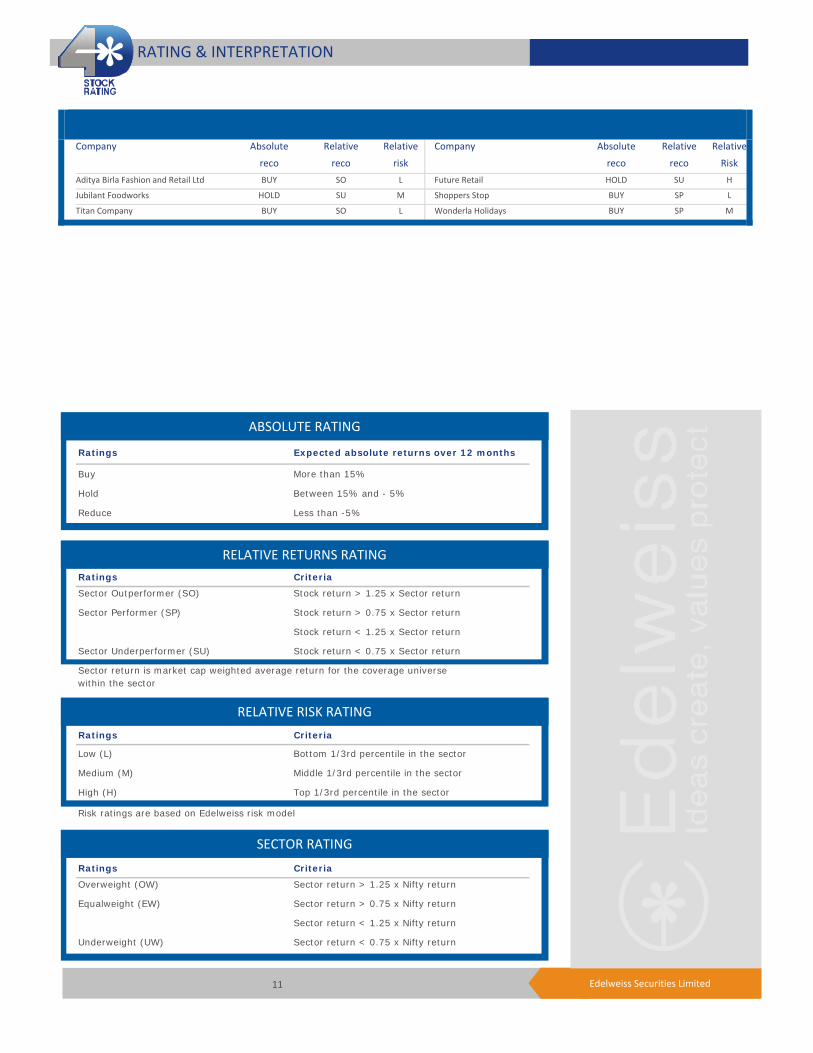
Aditya Birla Fashion and Retail Ltd BUY SO L Future Retail HOLD SU H
Jubilant Foodworks HOLD SU M Shoppers Stop BUY SP L
Titan Company BUY SO L Wonderla Holidays BUY SP M
RATING & INTERPRETATION
ABSOLUTE RATING
Ratings Expected absolute returns over 12 months
Buy More than 15%
Hold Between 15% and - 5%
Reduce Less than -5%
RELATIVE RETURNS RATING
Ratings Criteria
Sector Outperformer (SO) Stock return > 1.25 x Sector return
Sector Performer (SP) Stock return > 0.75 x Sector return
Stock return < 1.25 x Sector return
Sector Underperformer (SU) Stock return < 0.75 x Sector return
Sector return is market cap weighted average return for the coverage universe within the sector
RELATIVE RISK RATING
Ratings Criteria
Low (L) Bottom 1/3rd percentile in the sector
Medium (M) Middle 1/3rd percentile in the sector
High (H) Top 1/3rd percentile in the sector
Risk ratings are based on Edelweiss risk model
SECTOR RATING
Ratings Criteria
Overweight (OW) Sector return > 1.25 x Nifty return
Equalweight (EW) Sector return > 0.75 x Nifty return
Sector return < 1.25 x Nifty return
Underweight (UW) Sector return < 0.75 x Nifty return

12 Edelweiss Securities Limited
Retail
Edelweiss Securities Limited, Edelweiss House, off C.S.T. Road, Kalina, Mumbai – 400 098.
Board: (91‐22) 4009 4400, Email: [email protected]
Aditya Narain
Head of Research
Coverage group(s) of stocks by primary analyst(s): Retail
Aditya Birla Fashion and Retail Ltd, Future Retail, Jubilant Foodworks, Shoppers Stop, Titan Company, Wonderla Holidays
Distribution of Ratings / Market Cap
Edelweiss Research Coverage Universe
Rating Distribution* 161 67 11 240* 1stocks under review
Market Cap (INR) 156 62 11
Date Company Title Price (INR) Recos
Recent Research
29‐May‐17 Jubilant Foodworks
Tough quarter; surgery underway with new CEO in place; Result Update
940 Hold
25‐May‐17 Wonderla Holidays
Hyderabad park’s scale up heartening; GST key monitorable; Result Update
363 Buy
15‐May‐17 Aditya Birla Fashion and
Retail
Transparency improves, Pantaloons’ SSG to recover; Result Update
170 Buy
> 50bn Between 10bn and 50 bn < 10bn
Buy Hold Reduce Total
Rating Interpretation
Buy appreciate more than 15% over a 12‐month period
Hold appreciate up to 15% over a 12‐month period
Reduce depreciate more than 5% over a 12‐month period
Rating Expected to
One year price chart
200
280
360
440
520
600
Jul‐16
Aug‐16
Aug‐16
Sep‐16
Oct‐16
Oct‐16
Nov‐16
Dec‐16
Jan‐17
Jan‐17
Feb‐17
Mar‐17
Mar‐17
Apr‐17
May‐17
May‐17
Jun‐17
(INR)
Titan Company
13 Edelweiss Securities Limited
Titan Company
DISCLAIMER
Edelweiss Securities Limited (“ESL” or “Research Entity”) is regulated by the Securities and Exchange Board of India (“SEBI”) and is licensed to carry on the business of broking, depository services and related activities. The business of ESL and its Associates (list available on www.edelweissfin.com) are organized around five broad business groups – Credit including Housing and SME Finance, Commodities, Financial Markets, Asset Management and Life Insurance.
This Report has been prepared by Edelweiss Securities Limited in the capacity of a Research Analyst having SEBI Registration No.INH200000121 and distributed as per SEBI (Research Analysts) Regulations 2014. This report does not constitute an offer or solicitation for the purchase or sale of any financial instrument or as an official confirmation of any transaction. Securities as defined in clause (h) of section 2 of the Securities Contracts (Regulation) Act, 1956 includes Financial Instruments and Currency Derivatives. The information contained herein is from publicly available data or other sources believed to be reliable. This report is provided for assistance only and is not intended to be and must not alone be taken as the basis for an investment decision. The user assumes the entire risk of any use made of this information. Each recipient of this report should make such investigation as it deems necessary to arrive at an independent evaluation of an investment in Securities referred to in this document (including the merits and risks involved), and should consult his own advisors to determine the merits and risks of such investment. The investment discussed or views expressed may not be suitable for all investors.
This information is strictly confidential and is being furnished to you solely for your information. This information should not be reproduced or redistributed or passed on directly or indirectly in any form to any other person or published, copied, in whole or in part, for any purpose. This report is not directed or intended for distribution to, or use by, any person or entity who is a citizen or resident of or located in any locality, state, country or other jurisdiction, where such distribution, publication, availability or use would be contrary to law, regulation or which would subject ESL and associates / group companies to any registration or licensing requirements within such jurisdiction. The distribution of this report in certain jurisdictions may be restricted by law, and persons in whose possession this report comes, should observe, any such restrictions. The information given in this report is as of the date of this report and there can be no assurance that future results or events will be consistent with this information. This information is subject to change without any prior notice. ESL reserves the right to make modifications and alterations to this statement as may be required from time to time. ESL or any of its associates / group companies shall not be in any way responsible for any loss or damage that may arise to any person from any inadvertent error in the information contained in this report. ESL is committed to providing independent and transparent recommendation to its clients. Neither ESL nor any of its associates, group companies, directors, employees, agents or representatives shall be liable for any damages whether direct, indirect, special or consequential including loss of revenue or lost profits that may arise from or in connection with the use of the information. Our proprietary trading and investment businesses may make investment decisions that are inconsistent with the recommendations expressed herein. Past performance is not necessarily a guide to future performance .The disclosures of interest statements incorporated in this report are provided solely to enhance the transparency and should not be treated as endorsement of the views expressed in the report. The information provided in these reports remains, unless otherwise stated, the copyright of ESL. All layout, design, original artwork, concepts and other Intellectual Properties, remains the property and copyright of ESL and may not be used in any form or for any purpose whatsoever by any party without the express written permission of the copyright holders.
ESL shall not be liable for any delay or any other interruption which may occur in presenting the data due to any reason including network (Internet) reasons or snags in the system, break down of the system or any other equipment, server breakdown, maintenance shutdown, breakdown of communication services or inability of the ESL to present the data. In no event shall ESL be liable for any damages, including without limitation direct or indirect, special, incidental, or consequential damages, losses or expenses arising in connection with the data presented by the ESL through this report.
We offer our research services to clients as well as our prospects. Though this report is disseminated to all the customers simultaneously, not all customers may receive this report at the same time. We will not treat recipients as customers by virtue of their receiving this report.
ESL and its associates, officer, directors, and employees, research analyst (including relatives) worldwide may: (a) from time to time, have long or short positions in, and buy or sell the Securities, mentioned herein or (b) be engaged in any other transaction involving such Securities and earn brokerage or other compensation or act as a market maker in the financial instruments of the subject company/company(ies) discussed herein or act as advisor or lender/borrower to such company(ies) or have other potential/material conflict of interest with respect to any recommendation and related information and opinions at the time of publication of research report or at the time of public appearance. ESL may have proprietary long/short position in the above mentioned scrip(s) and therefore should be considered as interested. The views provided herein are general in nature and do not consider risk appetite or investment objective of any particular investor; readers are requested to take independent professional advice before investing. This should not be construed as invitation or solicitation to do business with ESL.

14 Edelweiss Securities Limited
Retail
ESL or its associates may have received compensation from the subject company in the past 12 months. ESL or its associates may have managed or co‐managed public offering of securities for the subject company in the past 12 months. ESL or its associates may have received compensation for investment banking or merchant banking or brokerage services from the subject company in the past 12 months. ESL or its associates may have received any compensation for products or services other than investment banking or merchant banking or brokerage services from the subject company in the past 12 months. ESL or its associates have not received any compensation or other benefits from the Subject Company or third party in connection with the research report. Research analyst or his/her relative or ESL’s associates may have financial interest in the subject company. ESL and/or its Group Companies, their Directors, affiliates and/or employees may have interests/ positions, financial or otherwise in the Securities/Currencies and other investment products mentioned in this report. ESL, its associates, research analyst and his/her relative may have other potential/material conflict of interest with respect to any recommendation and related information and opinions at the time of publication of research report or at the time of public appearance.
Participants in foreign exchange transactions may incur risks arising from several factors, including the following: ( i) exchange rates can be volatile and are subject to large fluctuations; ( ii) the value of currencies may be affected by numerous market factors, including world and national economic, political and regulatory events, events in equity and debt markets and changes in interest rates; and (iii) currencies may be subject to devaluation or government imposed exchange controls which could affect the value of the currency. Investors in securities such as ADRs and Currency Derivatives, whose values are affected by the currency of an underlying security, effectively assume currency risk.
Research analyst has served as an officer, director or employee of subject Company: No
ESL has financial interest in the subject companies: No
ESL’s Associates may have actual / beneficial ownership of 1% or more securities of the subject company at the end of the month immediately preceding the date of publication of research report.
Research analyst or his/her relative has actual/beneficial ownership of 1% or more securities of the subject company at the end of the month immediately preceding the date of publication of research report: No
ESL has actual/beneficial ownership of 1% or more securities of the subject company at the end of the month immediately preceding the date of publication of research report: No
Subject company may have been client during twelve months preceding the date of distribution of the research report.
There were no instances of non‐compliance by ESL on any matter related to the capital markets, resulting in significant and material disciplinary action during the last three years except that ESL had submitted an offer of settlement with Securities and Exchange commission, USA (SEC) and the same has been accepted by SEC without admitting or denying the findings in relation to their charges of non registration as a broker dealer.
A graph of daily closing prices of the securities is also available at www.nseindia.com
Analyst Certification:
The analyst for this report certifies that all of the views expressed in this report accurately reflect his or her personal views about the subject company or companies and its or their securities, and no part of his or her compensation was, is or will be, directly or indirectly related to specific recommendations or views expressed in this report.
Additional Disclaimers
Disclaimer for U.S. Persons
This research report is a product of Edelweiss Securities Limited, which is the employer of the research analyst(s) who has prepared the research report. The research analyst(s) preparing the research report is/are resident outside the United States (U.S.) and are not associated persons of any U.S. regulated broker‐dealer and therefore the analyst(s) is/are not subject to supervision by a U.S. broker‐dealer, and is/are not required to satisfy the regulatory licensing requirements of FINRA or required to otherwise comply with U.S. rules or regulations regarding, among other things, communications with a subject company, public appearances and trading securities held by a research analyst account.
This report is intended for distribution by Edelweiss Securities Limited only to "Major Institutional Investors" as defined by Rule 15a‐6(b)(4) of the U.S. Securities and Exchange Act, 1934 (the Exchange Act) and interpretations thereof by U.S. Securities and Exchange Commission (SEC) in reliance on Rule 15a 6(a)(2). If the recipient of this report is not a Major Institutional Investor as specified above, then it should not act upon this report and return the same to the sender. Further, this report may not be copied, duplicated and/or transmitted onward to any U.S. person, which is not the Major Institutional Investor.

15 Edelweiss Securities Limited
Titan Company
Access the entire repository of Edelweiss Research on www.edelresearch.com
In reliance on the exemption from registration provided by Rule 15a‐6 of the Exchange Act and interpretations thereof by the SEC in order to conduct certain business with Major Institutional Investors, Edelweiss Securities Limited has entered into an agreement with a U.S. registered broker‐dealer, Edelweiss Financial Services Inc. ("EFSI"). Transactions in securities discussed in this research report should be effected through Edelweiss Financial Services Inc. Disclaimer for U.K. Persons
The contents of this research report have not been approved by an authorised person within the meaning of the Financial Services and Markets Act 2000 ("FSMA"). In the United Kingdom, this research report is being distributed only to and is directed only at (a) persons who have professional experience in matters relating to investments falling within Article 19(5) of the FSMA (Financial Promotion) Order 2005 (the “Order”); (b) persons falling within Article 49(2)(a) to (d) of the Order (including high net worth companies and unincorporated associations); and (c) any other persons to whom it may otherwise lawfully be communicated (all such persons together being referred to as “relevant persons”). This research report must not be acted on or relied on by persons who are not relevant persons. Any investment or investment activity to which this research report relates is available only to relevant persons and will be engaged in only with relevant persons. Any person who is not a relevant person should not act or rely on this research report or any of its contents. This research report must not be distributed, published, reproduced or disclosed (in whole or in part) by recipients to any other person. Disclaimer for Canadian Persons
This research report is a product of Edelweiss Securities Limited ("ESL"), which is the employer of the research analysts who have prepared the research report. The research analysts preparing the research report are resident outside the Canada and are not associated persons of any Canadian registered adviser and/or dealer and, therefore, the analysts are not subject to supervision by a Canadian registered adviser and/or dealer, and are not required to satisfy the regulatory licensing requirements of the Ontario Securities Commission, other Canadian provincial securities regulators, the Investment Industry Regulatory Organization of Canada and are not required to otherwise comply with Canadian rules or regulations regarding, among other things, the research analysts' business or relationship with a subject company or trading of securities by a research analyst. This report is intended for distribution by ESL only to "Permitted Clients" (as defined in National Instrument 31‐103 ("NI 31‐103")) who are resident in the Province of Ontario, Canada (an "Ontario Permitted Client"). If the recipient of this report is not an Ontario Permitted Client, as specified above, then the recipient should not act upon this report and should return the report to the sender. Further, this report may not be copied, duplicated and/or transmitted onward to any Canadian person. ESL is relying on an exemption from the adviser and/or dealer registration requirements under NI 31‐103 available to certain international advisers and/or dealers. Please be advised that (i) ESL is not registered in the Province of Ontario to trade in securities nor is it registered in the Province of Ontario to provide advice with respect to securities; (ii) ESL's head office or principal place of business is located in India; (iii) all or substantially all of ESL's assets may be situated outside of Canada; (iv) there may be difficulty enforcing legal rights against ESL because of the above; and (v) the name and address of the ESL's agent for service of process in the Province of Ontario is: Bamac Services Inc., 181 Bay Street, Suite 2100, Toronto, Ontario M5J 2T3 Canada. Disclaimer for Singapore Persons
In Singapore, this report is being distributed by Edelweiss Investment Advisors Private Limited ("EIAPL") (Co. Reg. No. 201016306H) which is a holder of a capital markets services license and an exempt financial adviser in Singapore and (ii) solely to persons who qualify as "institutional investors" or "accredited investors" as defined in section 4A(1) of the Securities and Futures Act, Chapter 289 of Singapore ("the SFA"). Pursuant to regulations 33, 34, 35 and 36 of the Financial Advisers Regulations ("FAR"), sections 25, 27 and 36 of the Financial Advisers Act, Chapter 110 of Singapore shall not apply to EIAPL when providing any financial advisory services to an accredited investor (as defined in regulation 36 of the FAR. Persons in Singapore should contact EIAPL in respect of any matter arising from, or in connection with this publication/communication. This report is not suitable for private investors.
Copyright 2009 Edelweiss Research (Edelweiss Securities Ltd). All rights reserved


