Tissue motion pattern of ventral neck muscles …343380/FULLTEXT01.pdf · 1 Tissue motion pattern...
31
Linköping University Post Print Tissue motion pattern of ventral neck muscles investigated by tissue velocity ultrasonography imaging Michael Peolsson, Lars-Ake Brodin and Anneli Peolsson N.B.: When citing this work, cite the original article. The original publication is available at www.springerlink.com: Michael Peolsson, Lars-Ake Brodin and Anneli Peolsson, Tissue motion pattern of ventral neck muscles investigated by tissue velocity ultrasonography imaging, 2010, European Journal of Applied Physiology, (109), 5, 899-908. http://dx.doi.org/10.1007/s00421-010-1420-z Copyright: Springer Science Business Media http://www.springerlink.com/ Postprint available at: Linköping University Electronic Press http://urn.kb.se/resolve?urn=urn:nbn:se:liu:diva-58330
Transcript of Tissue motion pattern of ventral neck muscles …343380/FULLTEXT01.pdf · 1 Tissue motion pattern...
Linköping University Post Print
Tissue motion pattern of ventral neck muscles
investigated by tissue velocity ultrasonography
imaging
Michael Peolsson, Lars-Ake Brodin and Anneli Peolsson
N.B.: When citing this work, cite the original article.
The original publication is available at www.springerlink.com:
Michael Peolsson, Lars-Ake Brodin and Anneli Peolsson, Tissue motion pattern of ventral
neck muscles investigated by tissue velocity ultrasonography imaging, 2010, European
Journal of Applied Physiology, (109), 5, 899-908.
http://dx.doi.org/10.1007/s00421-010-1420-z
Copyright: Springer Science Business Media
http://www.springerlink.com/
Postprint available at: Linköping University Electronic Press
http://urn.kb.se/resolve?urn=urn:nbn:se:liu:diva-58330
1
Tissue motion pattern of ventral neck muscles investigated by tissue velocity
ultrasonography imaging
1Michael Peolsson, Ph.D., R.N., C.E.,
1 Lars-Åke Brodin, Ph.D., MD,
2Anneli Peolsson,
Ph.D., R.PT.
1School for Technology and Health, KTH (Royal Institute of Technology), Stockholm,
Sweden. 2Department of Medical and Health Sciences, Division of Physiotherapy, Faculty of Health
Sciences, Linköping University, Linköping, Sweden.
Corresponding author:
Assoc. Prof. Anneli Peolsson
Department of Medical and Health Sciences
Division of Physiotherapy
Faculty of Health Sciences
Linköping University
SE-58183 Linköping
Sweden
Telephone: +046-13-221798
Facsimile: +46-13-221706
E-mail: [email protected]

2
Abstract
We designed this experimental study to investigate tissue motions and thus infer the
recruitment pattern of the ventral neck muscles (sternocleidomastoid (SCM), longus capitis
(Lca), and longus colli (Lco)) at the C4–C5 level in healthy volunteers during isometric
manual resistance of the head in flexion in a seated position. This exercise is used in the
physiotherapeutic treatment of neck pain and is assumed to activate the deep ventral muscles,
but the assumption has not been clearly evaluated. Neck flexors of 16 healthy volunteers
(mean age 24 years, SD 3.7) were measured using ultrasonography with strain and strain rate
(SR) tissue velocity imaging (TVI) during isometric contraction of flexor muscles. TVI
involves using Doppler imaging to study tissue dynamics. All three muscles showed a
deformation compared to rest. Except for the initial contraction phase, Lco exhibited a lower
strain than Lca and SCM but was the only muscle with a significant change in SR between the
phases. When the beginning of the contraction phase was analysed, Lco was the first to be
deformed among most volunteers, followed by Lca and then SCM. The exercise investigated
seems to be useful as a “stabilizing” exercise for Lco. Our suggestion is that in further
research, Lco and Lca should be investigated as separate muscles. TVI could be used to study
tissue motions and thus serve as an indicator of muscle patterning between the neck flexors,
with the possibility of separating Lco and Lca.
Keywords: Neck muscles, Ultrasonography, Coordination, Recruitment pattern
3
Introduction
The neck muscles predominantly (about 80%) provide the mechanical stability of the cervical
spine (Panjabi et al. 1998). Conley et al. (1995) reported the main flexors of the neck to be the
deep muscles, longus colli (Lco) and longus capitis (Lca), and the superficial
sternocleidomastoid (SCM). Several authors (Falla et al. 2004a, b; 2006; 2007a; Johnston et
al. 2008; Jull et al. 2004a; O‟Leary 2007) have described an association of disturbed
performance of the neuromuscular coordination among neck flexors and chronic neck pain in
people.
Activation of the deep ventral neck muscles or coordination between the deep and surface
flexor muscles in different tasks or situations has been studied with surface electromyography
(EMG) (Falla et al. 2004a, 2006, 2007a; Jull et al. 2004a; O‟Leary et al. 2007). Functional
(T2-weighted) magnetic resonance imaging (MRI) (Cagnie et al. 2008; Conley et al. 1995),
computerized tomography (CT) (Mayoux-Benhamou et al. 1994), and ultrasonography (US)
(Cagnie et al. 2009; Jesus et al. 2008) have been used to study differences in signal activity or
tissue deformations. With EMG, deep ventral neck muscles have been investigated invasively
by surface electrodes inserted via the nose and fixed to the posterior mucosa of the
oropharynx, which “indirectly” captures signals of interest from Lco and Lca, with some risk
of cross-talk from other muscles. US is non-invasive, less expensive than CT and MRI, and
offers the possibility of capturing functional movements in real time.
Traditional US (using the grey-scale technique), which was used in earlier studies of ventral
neck muscles (Cagnie et al. 2009; Jesus et al. 2008), provides information about anatomical
landmarks, giving data about the structure of the tissue, fascicle length, and pennation angle
(Blazevich et al. 2006; Chino et al. 2008; Fukunaga et al. 1997; Kawakami et al. 2006; Narici
4
1999; Oda et al. 2007). Muscle deformation in ventral neck muscles (Cagnie et al. 2009; Jesus
et al. 2008) has been studied during measurement of the change in cross-sectional area
(CSA)/muscle thickness during rest and contraction.
US in conjunction with tissue velocity imaging (TVI) makes it possible to identify active and
passive muscular movements (Brodin 2004; Grubb et al. 1995; Mannion et al. 2008; Peolsson
et al. 2008; Pulkowski et al. 2008). According to Mannion et al. (2008), TVI could be used to
study muscular feed-forward activity, and according to Pulkowski et al. (2008), to study the
onset of muscle activation. TVI could also be used to differentiate muscle dynamics between
patients with muscular disorder and healthy controls (Peolsson et al. 2008). TVI has not,
according to our knowledge, been used to study activation patterns of ventral neck muscles.
Strong evidence suggests the effectiveness of physical exercise in the rehabilitation of patients
with neck disorders (Kay et al. 2005), but a consensus is lacking regarding how to optimise
the exercise. A specific exercise of the deep ventral neck flexors (Jull et al. 2004b) is reported
to reduce pain in patients with neck pain (Falla et al. 2006). Physiotherapists (PTs) use
manual isometric resistance of the head in flexion in the seated position in the treatment of
patients with neck pain, which is assumed to activate the deep ventral neck muscles; however,
the truth of this assumption remains to be established. Thus, more knowledge is required
about the activation patterns in the ventral neck muscles in the clinical setting.
The purpose of this study was to use US with strain and SR TVI techniques to describe and
investigate tissue motions within each muscle (SCM, Lca, and Lco). The goal was to identify
the recruitment pattern of the ventral neck muscles at the C4–C5 level in healthy volunteers
during manual resistance of the head in flexion in the seated position.

5
Methods
Participants
The inclusion criterion for this study was a healthy neck. Exclusion criteria were pain >10
mm (Croft et al. 1998) on the Visual Analogue Scale (VAS) (Scott and Huskisson 1976) or
discomfort (>20%) (Fairbank et al. 1980) on the Neck Disability Index (NDI) (Vernon and
Mior 1991) from the neck during the last 3 months, repeatable neck discomfort, using any
kind of medical treatment for neck discomfort, trauma to the neck, severe back pain,
generalized myalgia, or the presence of rheumatologic or neurological diseases.
All participants were university student volunteers (responding to a group mailing) with the
following characteristics: 11 women and 5 men, mean age 24 years (SD 3.7, range 19–33).
They were without neck discomfort; pain on VAS averaged 1 mm (SD 2.1, range 0–8) and the
NDI average was 0.8% (SD 1.2, range 0–4). They had a high level of physical activity (mean
3.5, SD 0.6) on a 4-point scale (Peolsson et al. 2007). All participants, except one woman,
were right handed.
Identification of the ventral neck muscles
US was performed on the right side at the C4 segmental level. C4 was identified by palpation
by an experienced PT and marked with a pen. Apart from manual palpation to identify the
segmental level, the bifurcation of arteria vertebralis, commonly at the C4 level (as seen with
the US), verifies measurements at the segmental level of interest. The C4 level was also noted
on US by way of the horizontal projection plane of the PT‟s marker and the fork of the
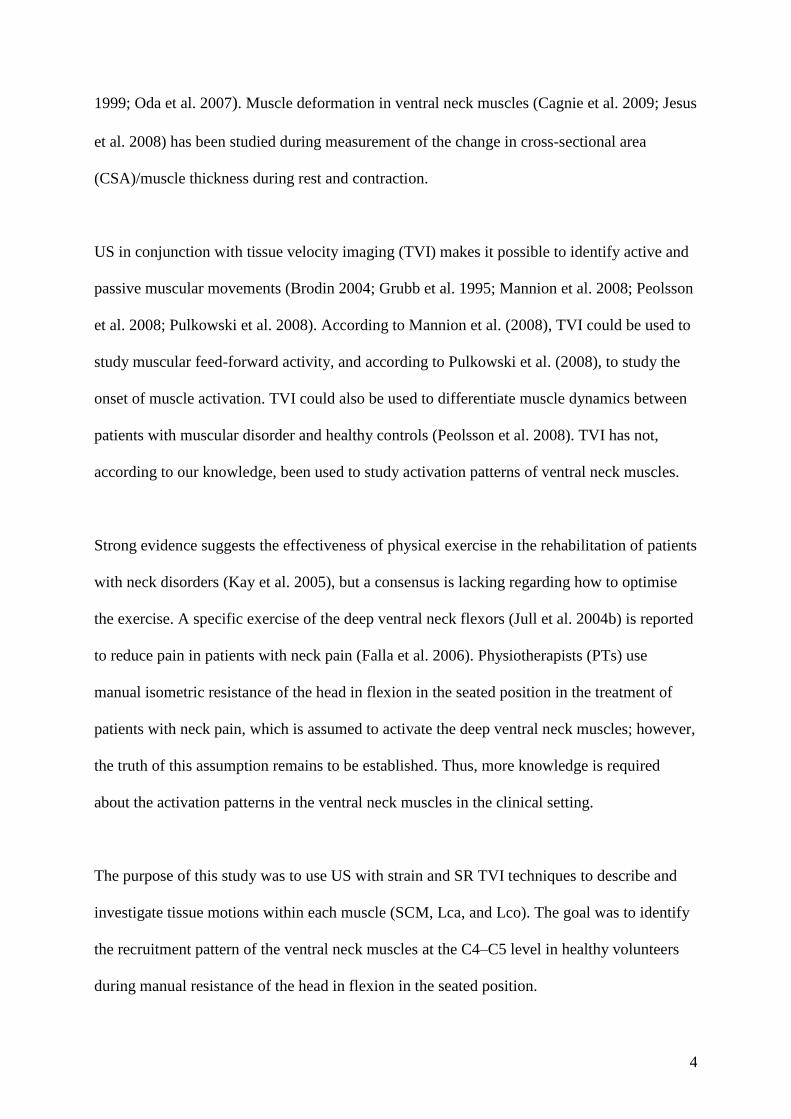
spinosis (Fig. 1). The probe was rotated around its axis 90 degrees from the transversal (axial)
to longitudinal (sagittal) projection (Fig. 1) to provide an optimal image plane for post-
process analysis. All registrations were taken in a longitudinal projection. Pulkovski et al.
6
(2008) reported a good reliability (intra-class correlation coefficient (ICC), 0.67–0.99) for
onset of muscle activation using TVI and a good correlation for onset of muscle activation
using TVI and EMG (r=0.78–0.80). The procedure used in the present study has also proved
to have good reliability for ventral neck muscles (ICC, 0.80–0.99) (Table 1) (Peolsson A,
unpublished data). The C4 segmental level was chosen to optimise the image field for
studying tissue motions and thus infer the coordination between the three muscles in the mid-
cervical spine. At the C4 level, we captured different parts of the Lco, Lca, and SCM. If the
registrations had been performed above the C4 level, we would have been unable to capture
the SCM; projections below C5 make it difficult to get clear pictures because of shadows.
Fig. 1 Anatomical landmarks of ventral neck muscles, from the superficial towards the deep
muscle layer: sternocleidomastoid (SCM), longus capitis (Lca), and longus colli (Lco) at the
C4–C5 level
Test procedure
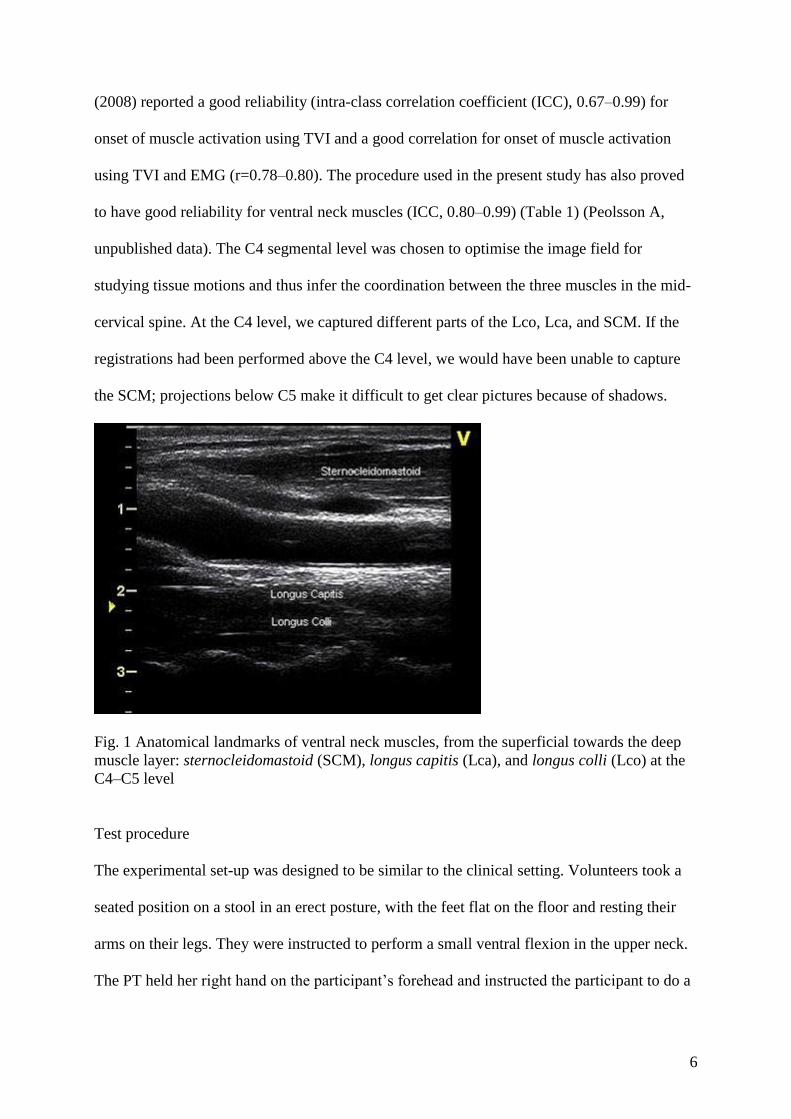
The experimental set-up was designed to be similar to the clinical setting. Volunteers took a
seated position on a stool in an erect posture, with the feet flat on the floor and resting their
arms on their legs. They were instructed to perform a small ventral flexion in the upper neck.
The PT held her right hand on the participant‟s forehead and instructed the participant to do a
7
sub-maximal isometric head flexion for about 8 s, as PTs do in neck rehabilitation (Fig. 2).
The PT gently increased the resistance in the beginning of the procedure and gradually
decreased it towards the end. Before all measurements, participants were informed about the
procedure and practiced it once.
Fig. 2 Test position of the submaximal head flexion during manual resistance
8
Equipment used
To measure deformation variables, an Ultrasound Vivid 7 Dimension system (GE Healthcare,
Horten, Norway) was used together with a 14-MHz linear transducer and research software.
The US images were analysed post-process using an external software package (EchoPac, GE
Healthcare, Horten, Norway) for offline analysis.
TVI
TVI offers two fundamental calculating parameters: tissue movement and tissue deformation
(D‟Hooge et al. 2000; Heimdal et al. 1998; Mirsky et al. 1973; Stoylen 2001). The difference
between the two is whether a velocity alteration is present during the movement. If a constant
force affects a tissue, the velocity parameter will remain constant, while an accelerating or
decelerating force affecting the tissue causes a tissue deformation. Consequently, the tissue
response will be either compression or elongation.
In the musculoskeletal case, several anatomical muscles often lie close to each other,
separated by a fascia. To study the regional deformation of each separate muscle layer and
thus to indicate the corresponding coordination pattern, regional velocities are required. Strain
rate (SR) (D‟Hooge et al. 2000; Heimdal et al. 1998) is such a tool. With this tool, the image
lines are divided at a specified measuring distance, offset by, for example, 5 mm, generating a
calculation grid (Fig. 3A). Within each and every grid, cell velocities are calculated (Fig. 3A).
The implication of this procedure is that tissue velocities are measured independently within
local regions. As a consequence, different muscle layers will be covered by different cells.
Regional SRs are calculated within each and every grid cell (Fig. 3B). When compared, the
relative differences between the cell velocities can be investigated, and the result can be
transformed into colour-coded, superimposed images.
9
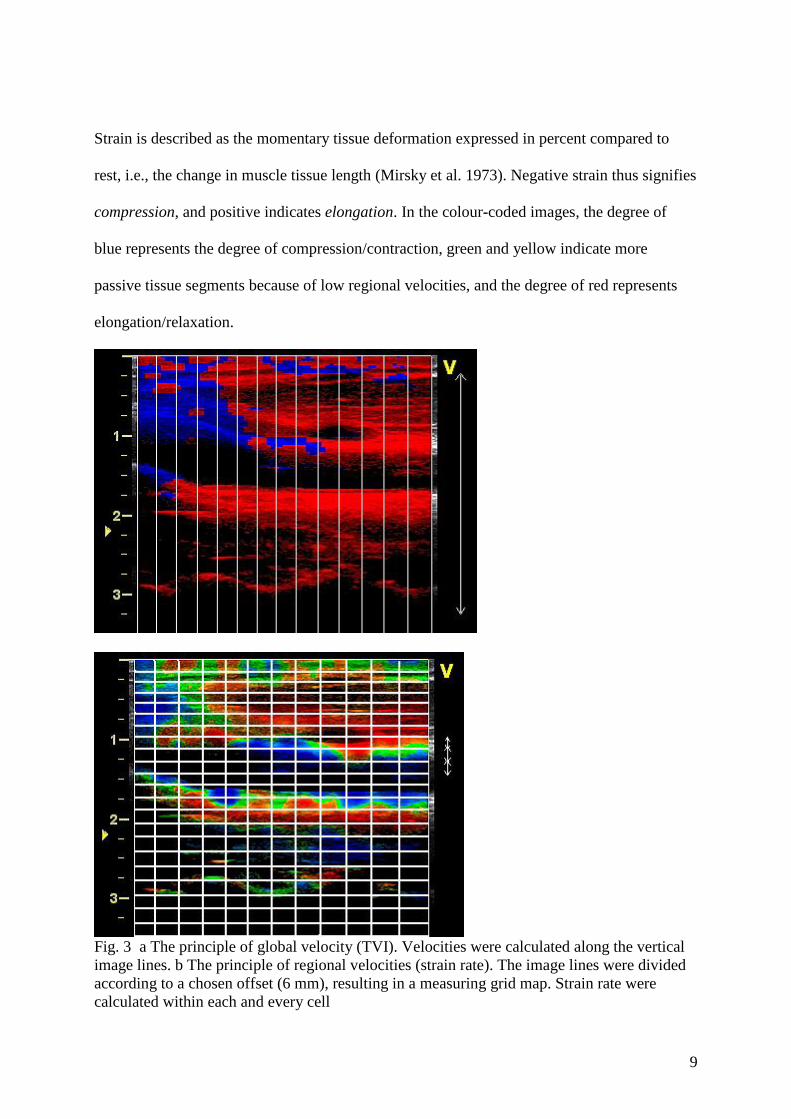
Strain is described as the momentary tissue deformation expressed in percent compared to
rest, i.e., the change in muscle tissue length (Mirsky et al. 1973). Negative strain thus signifies
compression, and positive indicates elongation. In the colour-coded images, the degree of
blue represents the degree of compression/contraction, green and yellow indicate more
passive tissue segments because of low regional velocities, and the degree of red represents
elongation/relaxation.
Fig. 3 a The principle of global velocity (TVI). Velocities were calculated along the vertical
image lines. b The principle of regional velocities (strain rate). The image lines were divided
according to a chosen offset (6 mm), resulting in a measuring grid map. Strain rate were
calculated within each and every cell

10
The final result is generation of a regional tissue deformation map, presented frame by frame
using these four colours (Fig. 3). The map also adds information about changes in the degree
of deformation (strain) and deformation rate (SR) as part of muscle deformation in real time.
Thus, the colour-coded images present qualitative information about tissue motions as an
indicator for inter-muscular coordination patterns during neck movements.
Quantification of tissue velocities from velocity images
To investigate tissue movements as an indicator of the coordination of the neck muscles
quantitatively, regions of interest (ROIs) are often manually placed within the images. A ROI
is a shape that can be drawn and placed arbitrarily. In this study, an ellipsis was chosen that
captured the centre part of the Lco, Lca, and SCM. The ROI was placed in the first frame of
the loop and then followed frame by frame in the video sequence. Within each ROI, average
SR and strain values were calculated frame by frame. As a result, the relationships between
the individual ROIs were delineated and are presented as one curve per ROI, as a function of
individual neck muscle deformation progression in real time (Fig. 4). Three variables were
calculated from the quantitative curves: RMS for SR and mean and maximal values for strain.
Definition of tissue motions as an indicator of activation order
To analyse tissue motions as an indicator of the order of muscle activation, three ROIs were
inserted into the LCa, LCo, and SCM, respectively, in the US grey-scale loop and coloured
individually (Fig. 4A). The ROIs followed the same tissue region during the whole
registration of the functional movement in real time. Fig. 4A contains the grey-scale US loop
(video). Figure 4B shows the corresponding colour-coded overlaid transparency video, which
contains the tissue velocity data (SR). The changes in the tissue velocity data were captured in
11
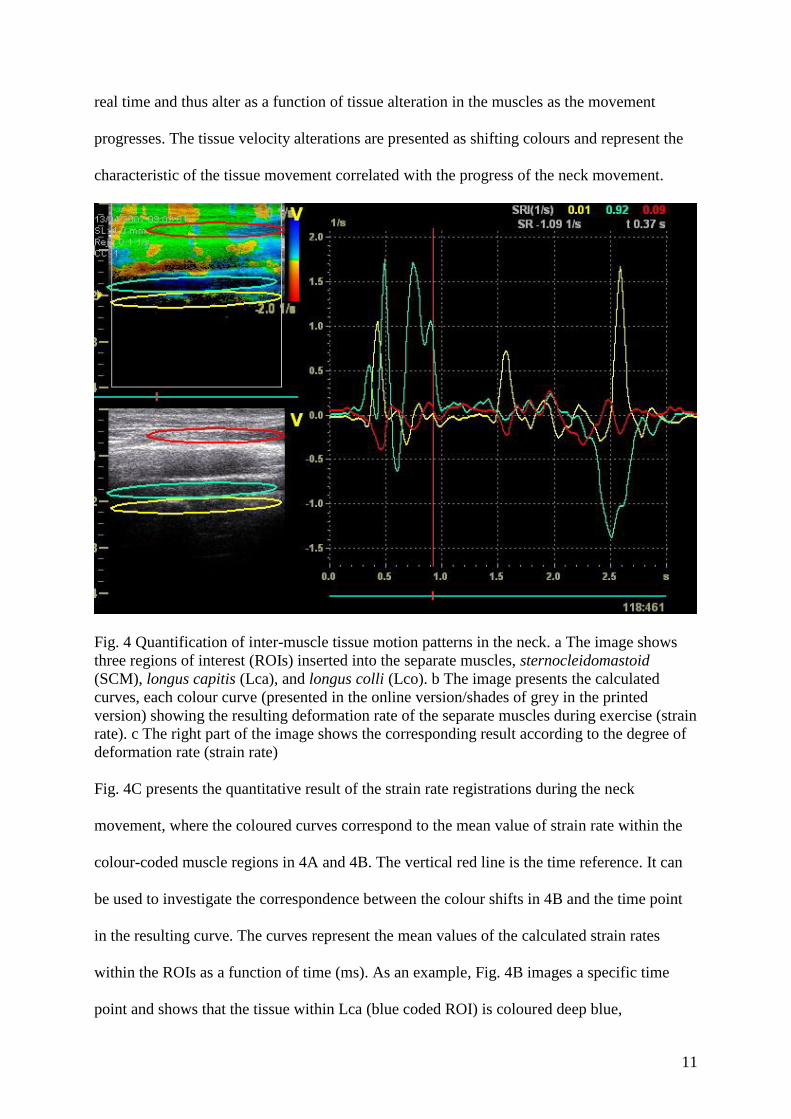
real time and thus alter as a function of tissue alteration in the muscles as the movement
progresses. The tissue velocity alterations are presented as shifting colours and represent the
characteristic of the tissue movement correlated with the progress of the neck movement.
Fig. 4 Quantification of inter-muscle tissue motion patterns in the neck. a The image shows
three regions of interest (ROIs) inserted into the separate muscles, sternocleidomastoid
(SCM), longus capitis (Lca), and longus colli (Lco). b The image presents the calculated
curves, each colour curve (presented in the online version/shades of grey in the printed
version) showing the resulting deformation rate of the separate muscles during exercise (strain
rate). c The right part of the image shows the corresponding result according to the degree of
deformation rate (strain rate)
Fig. 4C presents the quantitative result of the strain rate registrations during the neck
movement, where the coloured curves correspond to the mean value of strain rate within the
colour-coded muscle regions in 4A and 4B. The vertical red line is the time reference. It can
be used to investigate the correspondence between the colour shifts in 4B and the time point
in the resulting curve. The curves represent the mean values of the calculated strain rates
within the ROIs as a function of time (ms). As an example, Fig. 4B images a specific time
point and shows that the tissue within Lca (blue coded ROI) is coloured deep blue,

12
representing higher strain rates (positive velocities represent contraction) while Lco (yellow
coded ROI) is coloured yellow/orange, representing low velocities and low activity. This
representation can also be seen in Fig. 4C where the blue ROI curve shows a larger strain rate
while the yellow alternates around the zero baseline (close to zero). The slopes of the curves
thus represent the magnitude of an increase (positive) or decrease (negative) in the tissue
velocity and the relationship between the tissue velocities in regard to the specific muscle
regions (LCa, LCo, or SCM). As a result, the curves can be used to decide the order of
deformation rate based on the initiation, direction, and magnitude of each muscle segment.
The vertical time line in Fig. 4C thus shows the deformation rate relationship among Lca,
Lco, and SCM. In this particular individual, Lca was contracted before Lco while SCM was
not contracted simultaneously.
Definition of the three phases
Three phases were identified based on SR curves during the isometric resistance exercise. The
first phase was derived from tissue motions indicating the activation of the neck muscles as a
consequence of maintaining the head position during the initial manual resistance compared
to the neck muscles at rest. This phase is indicated by a rapid increase in activity in the SR
curve and is labelled „the initial contraction phase‟. The second phase refers to the
maintenance of the muscle tension during the external hand-held resistance. The SR curve is
characterized by a flat, low activity level, indicating that the deformation has reached a
„steady-state level‟. This phase, called „the plateau phase‟, is indicated by a horizontal SR
curve. The third phase is characterized by a letting-go of the external hand-held resistance and
thus is labelled „the relaxation phase‟, as indicated by an inverted SR curve compared to the
initial contraction phase.
13
Statistical analysis
For descriptive statistics, median and interquartile range were used. For paired tests (of
patterns in the same sequence of movement of the same muscle), Friedman‟s test (three-group
analysis) and the Wilcoxon signed-rank test (two-group analysis) were used. For unpaired
tests (between the muscles), the Kruskal-Wallis (three-group analysis) and Mann-Whitney U
tests (two-group analysis) were used. A P value of ≤ 0.05 was considered to be statistically
significant.
14
Results
Muscle deformation and deformation rate
Muscles did not differ with regard to SR either in the total sequence or in the phases (Table
2). Except for maximum strain in the relaxation phase, Lco had lower mean and maximum
strain values in the total sequence as well as in the plateau and relaxation phases compared
with Lca and SCM (P = 0.0006–0.05) (Table 2). We identified no significant differences
between Lca and SCM in either of the phases or during the total sequence (Table 2).
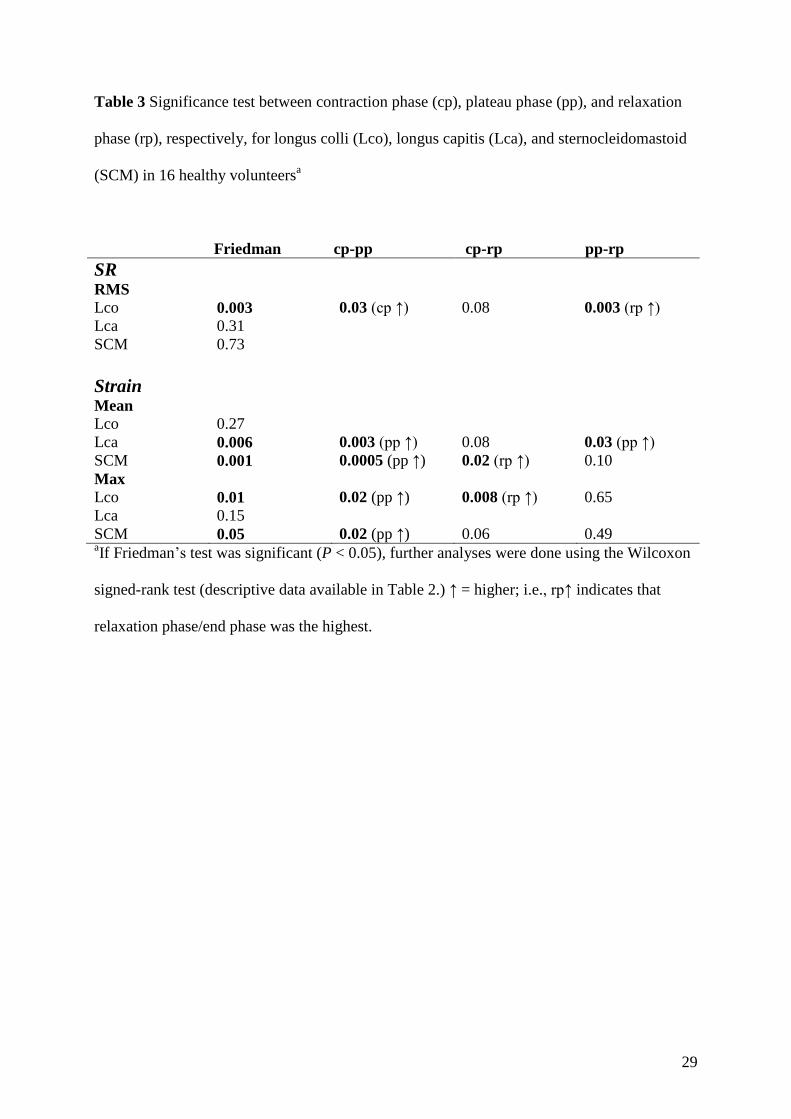
Differences in the three phases
Lco had a higher SR in both the contraction and relaxation phases compared to the plateau
phase (P = 0.003–0.03) (Table 3). Except for mean strain of Lco and maximum strain for Lca,
which did not differ among the phases, the strain was higher in the plateau phase than in the
contraction phase (P = 0.0005–0.02) (Table 3). For Lca, the mean strain in the plateau phase
was also higher than in the relaxation phase (P = 0.03) (Table 3); otherwise, there were no
differences between plateau phase and relaxation phase (Table 3). In the relaxation phase,
mean strain for SCM and maximum strain for Lco were higher than in the contraction phase
(P = 0.008–0.02) (Table 3).
Tissue motions as an indication of the order of muscle recruitment
When tissue motions were analysed as an indicator of the most common order of muscular
recruitment according to the initiation of the contraction phase, Lco was the first muscle to be
deformed in most volunteers prior to Lca (Table 4). Lco and SCM differed significantly (P =
0.03), and Lco and Lca showed a trend to a difference (P = 0.09) (Table 4). SCM was the last
muscle to be deformed in most volunteers (but non-significant vs. Lca, P = 0.68) (Table 4).

15
Discussion
Summary of results
All three muscles exhibited a change in deformation during the ventral isometric contraction
compared to rest. Despite great inter-individual variation and a small population, some
patterns and differences among muscles emerged. They did not differ significantly with
regard to SR either in the total sequence or in the phases. However, when the start of the
contraction phase was analysed, Lco was first to be deformed among most volunteers
followed by Lca and then SCM. Compared to Lca and SCM, and except for the contraction
phase, Lco had the lowest strain but was the only muscle with a significant change in SR
between the phases. One possible explanation for these results is that even if the exercise was
isometric, the PT applied and stopped the manual resistance gently, causing a small
movement in the start and end phases that elicited an Lco reaction. Such a conclusion could
be interpreted as confirmation of, in particular, Lco as a sensitive stabilizer in the cervical
spine (Boyd-Clark et al. 2002; Falla et al. 2007; Mayoux-Benhamou et al. 1994). Another
explanation for the results could be different biomechanical parameters, such as the length of
each muscle, the locations of origins and insertions, and/or the location where the force was
applied relative to the muscles; however, these parameters could not be measured with the
methodology used here.
Different tissue motion patterns of the three muscles
Previous authors (Conley et al. 1995; Falla et al. 2004a, c; 2006; 2007a; Jesus et al. 2008; Jull
et al. 2004a; O‟Leary et al. 2007) often referred to Lco and Lca as “deep ventral neck
muscles” and analysed the two together as one entity. In the present paper, the synergists Lco
and Lca emerge as having different tissue motions, indicating different activation patterns.
This finding verifies the results of Cagnie et al. (2008), who concluded that it is necessary to

16
distinguish between the two. The primary function of Lca is as a craniocervical flexor (Cagnie
et al. 2008). Lco, on the other hand, has been reported to have a high rate of muscle spindle
distribution (Boyd-Clark et al. 2002) and primarily serves a stabilizing and postural function
with a more important role for the cervical curvature than Lca (Falla et al. 2007b; Mayoux-
Benhamou et al. 1994).
Today there is no consensus about whether the deep flexor muscles or the SCM have the
higher activity during cervical flexion (Conley et al. 1995; Falla et al. 2006; Jesus et al. 2008;
Vasavada 1998). This lack of agreement could be the result of different experimental set-ups
with different study designs, purposes, participant positions, and exercises. In the present
study, using a sitting position and an exercise that differed from those previously examined,
Lco had lower strain than the other muscles, but the differences between Lca and SCM were
not significant.
Present results compared with earlier studies
No one has, to our knowledge, used US with TVI to study tissue motions as an indicator of
ventral neck muscle function. Jesus et al. (2008) and Cagnie et al. (2009) have presented data
using US, albeit with the grey-scale technique. Jesus et al. (2008) studied changes in CSA
between rest and activity in the supine position and found a greater thickness in the later
phases than in the starting phase, both for the deep muscles and for SCM. Cagnie et al. (2009)
measured CSA of Lco by US and the “gold standard” MRI in the supine position and found a
moderate validity (ICC 0.68–0.71) of US; in addition, they found with both techniques an
increase in CSA in Lco during activity compared with rest. In the present study of tissue
dynamics, a higher deformation in the later phases was found in Lca and SCM. The
deformation of Lco was mostly constant during the phases, possibly because of its postural

17
function (Falla et al. 2007b; Mayoux-Benhamou et al. 1994) in an upright position. An
explanation for the differences among the studies could be the different experimental set-ups
with the different US methods used and the different study purposes. All measurements were
done on healthy young adults. Jesus et al. (2008) did not differentiate between Lco and Lca,
and Cagnie et al. (2009) studied Lco only. Jesus et al. (2008) and Cagnie et al. (2009)
performed their measurements with volunteers in the supine position; in the present study,
volunteers were in a functional upright position.
Cagnie et al. (2009) discuss the difficulties associated with boundaries of Lco that are not
always distinct when measuring CSA of Lco with grey-scale US. They suggest that it would
have been helpful to watch the muscle contraction before taking measurements at rest. In the
present study using US with TVI, tissue dynamics during the contraction were studied but not
CSA. It is possible, however, that in the present study, a falsely low SR and strain of Lco
were captured because when the ROI of Lco is placed over two vertebral levels (C4 and C5),
the bony structure will be a part of the ROI. To avoid the bony structures, an alternative
analysis of several smaller ROIs summed together was done, but the outcome did not change;
thus, we infer that the results remain trustworthy.
Representativeness of the population
Young adults only were included in the present study, which could be a drawback in terms of
how representative the results are. Using MRI, Elliot et al. (2007) found a weak correlation
between age and relative CSA of neck extensor muscles at the level of C5. Rankin et al.
(2005) presented reference values of neck extensor muscle size and found muscle size to be
altered by gender but not by age. One can presume that this association is true also for the

18
neck flexors, and we believe that our population can be considered representative as an
indicator of muscle function in healthy individuals.
Only speculation is possible about whether or not the tissue motion patterns would have been
altered in patients with neck disorders compared to healthy participants, as a result of lowered
tonic deep muscle activity and higher activity in superficial torque-produced muscles (Falla
2004a, 2006, 2007a; Johnston et al. 2008; Jull et al. 2004a). Future studies involving patients
with neck disorders would be required to address this question.
Manual resistance
To imitate the clinical rehabilitation technique used by PTs, a submaximal non-standardized
resistance was used in the present study. In patients with severe neck pain, trying one
repetition maximum in isometric extension could be contraindicated because of pain, fear of
movement, and high segmental load (Choi et al. 2000). The results of the study could have
been different if a different load, i.e., maximal resistance, had been applied. SCM especially,
with its great moment-generating capacity (Vasavada 1998), could have behaved differently.
The results could also have been altered if measurements had been done at a different
segmental level. Additionally, use of a strain-gauge to control for potential differences in
resistance might have been advantageous.
TVI: strain and SR
SR is a parameter that is arguably related to the rate of contraction while strain can be viewed
as a description of the consequence expressed in terms of muscle expansion. On the one hand,
the colourization of these parameters gives visually qualitative information about the
progression of the specific muscle deformations as well as the time-related inter-muscular

19
coordination pattern during exercise. On the other hand, the curves give quantitative graphical
information about these items. The benefit of strain and SR, therefore, was that they identified
information about regional tissue deformation relative to nearby tissues. A drawback was that
all deformations were angle dependent; i.e., tissue velocities were measured in an axial
direction to the probe and not along the fascicles. Taking for perspective the principle of
muscle volume incompressibility, which states that if a muscle is shortened (contracted) in
one dimension, the muscle volume has to expand in the other two dimensions, the
measurements carry relative information that could not be used as absolute values. Another
drawback is that TVI provides an indirect measure of tissue movement patterning of the
ventral neck muscles. “Activation” and “recruitment pattern” are neurophysiological terms
and imply that electrical parameters were monitored (i.e., EMG). In this study, TVI provided
a method to assess tissue motion patterns within various muscles, which is argued to be an
indicator of tissue contraction patterning. However, because of the lack of possibility for
direct and non-invasive registrations with surface EMG of deep ventral neck muscles, TVI
seems to be useful.
As with all medical-imaging work, the question of quality needs to be considered concerning
image resolution and adequate anatomic imaging. This consideration is also necessary when
performing the time-consuming post-process analysis of TVI. Yet, we suggest that the
benefits of this methodology outweigh such costs. US is a safe, non-invasive, and reliable
technique, inexpensive compared to MRI, and has the great benefit of making it possible to
investigate muscle tissue response in real time during functional movements.
20
Conclusion
All three muscles showed a deformation during the submaximal ventral isometric contraction.
Except for the contraction phase, Lco exhibited a lower deformation than Lca and SCM and
was the only muscle with a significant change in deformation rate between the phases. When
the beginning of the contraction phase was analysed, Lco was the first to be deformed among
most volunteers, followed by Lca and then SCM. The exercise investigated here seems to be
useful as a “stabilizing” exercise for Lco. Our suggestion is that Lco and Lca in further
research should be investigated as separate muscles. US with TVI was sensitive enough to
identify Lco and Lca as separate muscles and to study tissue motions as an indicator of
coordination between the neck flexors.

21
Ethical standards
All procedures were conducted according to the Declaration of Helsinki. The experiments
complied with the current laws of Sweden, and the study was approved by the Ethics
Committee at the Faculty of Health Sciences, Linköping University.
Conflict of interest
The authors declare that they have no conflict of interest.

22
References
Blazevich AJ, Gill ND, Zhou S (2006) Intra- and intermuscular variation in human quadriceps
femoris architecture assessed in vivo. J Anat 209: 289-310.
Boyd-Clark LC, Briggs CA, Galea MP (2002) Muscle spindle distribution, morphology, and
density in longus colli and multifidus muscles of the cervical spine. Spine 27:694-701.
Brodin L-Å (2004) Tissue Doppler, a fundamental tool for parametric imaging. Clin Physiol
Funct Imaging 24:147-155.
Cagnie B, Dickx N, Peeters I, Tuytens J, Achten E, Cambier D et al. (2008) The use of
functional MRI to evaluate cervical flexor activity during different cervical flexion
exercises. J Appl Physiol 104:230-235.
Cagnie B, Derese E, Vandamme L, Verstraete K, Cambier D, Daneels L (2009). Validity and
reliability of ultrasonography for the longus colli in asymptomatic subjects. Man Ther
14;421-426.
Chino K, Oda T, Kurihara T, Nagayoshi T, Yoshikawa K, Kanehisa H et al. (2008) In vivo
fascicle behavior of synergistic muscles in concentric and eccentric plantar flexions in
humans. J Electromyogr Kinesiol 18:79-88.
Choi H, Vanderby R (2000) Muscle forces and spinal loads at C4/5 level during isometric
voluntary efforts. Med Sci Sports Exerc 32:830-838.
Conley MS, Meyer RA, Bloomberg JJ, Feeback DL, Dudley GA (1995) Noninvasive analysis
of human neck muscle function. Spine 20:2505-2512.
Croft PR, Macfarlane GJ, Papageorgiou AC, Thomas E, Silman AJ (1998) Outcome of low
back pain in general practice: a prospective study. BMJ 316:1356-1359.
D‟Hooge J, Heimdal A, Jamal F, Kukulski T, Bijnens B, Rademakers F et al. (2000) Regional
strain and strain rate measurements by cardiac ultrasound: principles, implementation
and limitations. Eur J Echocardiogr 1: 154-170.
23
Elliott JM, Jull GA, Noteboom JT, Durbridge GL, Gibbon WW (2007) Magnetic resonance
imaging study of cross-sectional area of the extensor musculature in an asymptomatic
cohort. Clin Anat 20:35-40.
Fairbank JCT, Couper J, Davies JB, O´Brien JP (1980) The Oswestry low back pain disability
questionnaire. Phys Ther 70:97-114.
Falla D, Bilenkij G, Jull G (2004A) Patients with chronic neck pain demonstrate altered
patterns of muscle activation during performance of a functional upper limb task. Spine
29:1436-1440.
Falla D, Jull G, Edwards S, Koh K, Rainoldi A (2004B) Neuromuscular efficiency of the
sternocleidomastoid and anterior scalene muscles in patients with chronic neck pain.
Disabil Rehabil 26:712-717.
Falla D, Jull G, Hodges PW (2004C) Feedforward activity of the cervical flexor muscles
during voluntary arm movements is delayed in chronic neck pain. Exp Brain Res
157:43-48.
Falla D, Jull G, Hodges P, Vicenzino B (2006) An endurance-strength training regime is
effective in reducing myoelectric manifestations of cervical flexor muscle fatigue in
females with chronic neck pain. Clin Neurophysiol 117:828-837.
Falla D, Jull G, Russell T, Vicenzino B, Hodges P (2007A) Effect of neck exercise on sitting
posture in patients with chronic neck pain. Phys Ther 87:408-417.
Falla D, O´Leary S, Fagan A, Jull G (2007B) Recruitment pattern of the deep cervical flexor
muscles during a postural correction exercise performed in sitting. Man Ther 12:139-
143.
Fukunaga T, Ichinose Y, Ito M, Kawakami Y, Fukashiro S (1997) Determination of fascicle
length and pennation in a contracting human muscle in vivo. J Appl Physiol 82:354-
358.
24
Grubb NR, Fleming A, Sutherland GR, Fox KA (1995) Skeletal muscle contraction in healthy
volunteers: assessment with Doppler tissue imaging. Radiol 194:837-842.
Heimdal A, Støylen A, Torp H, Skjaerpe T (1998) Real-time strain rate imaging of the left
ventricle by ultrasound. J Am Soc Echocardiogr 11: 1013-1019.
Jesus F, Ferreira PH, Ferreira M (2008) Ultrasonographic measurement of neck muscle
recruitment: a preliminary investigation. J Man Manip Ther 16:89-92.
Johnston V, Jull G, Souvlis T, Jimmieson NL (2008) Neck movement and muscle activity
characteristics in female office workers with neck pain. Spine 33:555-563.
Jull G, Kristjansson E, DallÀlba P (2004A) Impairment in the cervical flexors: a comparison
of whiplash and insidious onset neck pain patients. Man Ther 9:89-94.
Jull G, Falla D, Treleaven J, Sterling M, O´Leary S (2004B) A therapeutic exercise approach
for cervical disorders. In Boyling JD, Jull G, eds Grieve´s Modern Manual Therapy.
The Vertebral Column. Edinburgh, UK: Churchill Livingstone; pp 451-469.
Kawakami Y, Abe T, Kanehisa H, Fukunaga T (2006) Human skeletal muscle size and
architecture: variability and interdependence. Am J Hum Biol 18:845-848.
Kay TM, Gross A, Goldsmith C, Santaguida PL, Hoving J, Brinfort G et al. (2005) Exercises
for mechanical neck disorders. The Cochrane Database of Systematic Reviews Issue 3,
Art. No.: CD004250.
Mannion AF, Pulkovski N, Schenk P, Hodges PW, Gerber H, Loupas T et al. (2008) A new
method for the noninvasive determination of abdominal muscle feedforward activity
based on tissue velocity information from tissue Doppler imaging. J Appl Physiol
104:1192-1201
Mayoux-Benhamou MA, Revel M, Roudier R, Barbet JP, Bargy F (1994) Longus colli has a
postural function on cervical curvature. Surg Radiol Anat 16:367-371.

25
Mirsky I, Parmley WW (1973) Assessment of passive elastic stiffness for isolated heart
muscle and the intact heart. Circ Res 33:233-243.
Narici M (1999) Human skeletal muscle architecture studied in vivo by non-invasive imaging
techniques: functional significance and applications. J Electromyogr Kinesiol 9: 97-103.
Oda T, Himeno R, C Hay D, Chino K, Kurihara T, Nagayoshi T et al.(2007) In vivo behavior
of muscle fascicles and tendinous tissues in human tibialis anterior muscle during twitch
contraction. J Biomech 40:3114-3120.
O´Leary S, Jull G, Mehwa K, Vicenzino B (2007) Specificity in retraining craniocervical
flexor muscle muscle performance. J Orthop Sports Phys Ther 37:3-9.
Panjabi MM, Cholewicki J, Nibu K, Grauer J, Babat LB, Dvorak J (1998) Critical load of the
human cervical spine: an in vitro experimental study. Clin Biomech 13:11-17.
Pulkovski N, Schenk P, Maffiuletti NA, Mannion AF (2008) Tissue Doppler imaging for
detecting onset of muscle activity. Muscle Nerve 37:638-649.
Peolsson A, Almkvist C, Dahlberg C, Lindqvist S, Pettersson S (2007) Age- and sex-specific
reference values of a test of neck muscle endurance. J Manip Physiol Ther 30:171-177.
Peolsson, M., Larsson, B, Brodin, LA. Gerdle, B (2008) A pilot study using Tissue Velocity
Ultrasound Imaging (TVI) to assess muscle activity pattern in patients with chronic
trapezius myalgia. BMC Musculoskel Disord 9:127-141.
Rankin G, Stokes M, Newham DJ (2005) Size and shape of the posterior neck muscles
measured by ultrasound imaging: normal values in males and females of different ages.
Man Ther 10:108-115.
Scott J, Huskisson EC (1976) Graphic representation of pain. Pain 2:175-184.
Stoylen A (2001) Strain rate imaging of the left ventricle by ultrasound: Feasibility, clinical
validation and physiological aspects. Dissertation, Trondheim: NTNU, Norwegian
University of Science and technology.

26
Vasavada A (1998) Influence of muscle morphometry and moment arms on the moment-
generating capacity of human neck muscles. Spine 23:412-422.
Vernon H, Mior S (1991) The neck disability index: a study of reliability and validity. J
Manip Physiol Ther 14:409-415.

27
Table 1) Reliability data from two measurements (two weeks apart) in 10 of the 16 study
participants (age 23 years; SD 2.7, range 20–27)a
SR, RMS Strain mean Strain max
LCOb 0.98 0.84 0.84
LCA 0.89 0.84 0.83
SCM 0.99 0.80 0.90
aIntra-class correlation coefficient (ICC), two-way random absolute agreement, single
measure was used to obtain the ICC values of the total sequence. ICC values of the root mean
square (RMS) values of strain rate (SR) and mean and maximal (max) strain are presented for
each of the three muscles.
bLco = longus colli; Lca = longus capitis; SCM = sternocleidomastoid.

28
Table 2 Strain and strain rate (SR) of ventral neck muscles, longus colli (Lco), longus capitis
(Lca), and sternocleidomastoid (SCM) in 16 healthy volunteersa
Lco Lca SCM p p p p
K-W Lco-Lca Lco-SCM Lca-SCM
Total
sequence
SR
RMS 0.22 (0.17) 0.17 (0.11) 0.20 (0.18) 0.53
Strain
Mean 0.28 (6.58) 6.82 (10.30) 14.32 (26.56) 0.003 0.02 0.002 0.17
Max 3.66 (14.74) 18.46 (22.74) 34.59 (43.13) 0.002 0.05 0.0006
Contraction
phase
SR
RMS 0.16 (0.29) 0.14 (0.20) 0.18 (0.27) 0.85
Strain
Mean 0.18 (1.18) 0.41 (3.50) 0.54 (9.30) 0.21
Max 1.37 (3.35) 3.33 (10.56) 2.80 (31.88) 0.15
Plateau
phase
SR
RMS 0.13 (0.08) 0.12 (0.12) 0.16 (0.08) 0.10
Strain
Mean 0.03 (8.78) 10.21 (17.05) 18.94 (44.36) 0.001 0.008 0.0006 0.19
Max 9.44 (11.08) 21.51 (23.32) 28.34 (42.20) 0.006 0.02 0.03 0.22
Relaxation
phase
SR
RMS 0.28 (0.28) 0.14 (0.11) 0.16 (0.11) 0.75
Strain
Mean 0.25 (3.86) 2.86 (9.52) 6.58 (21.13) 0.003 0.02 0.001 0.27
Max 6.41 (10.18) 10.42 (21.21) 11.15 (39.64) 0.14
aMedian and interquartile range for measurements in SR, mean strain, and maximal (Max)
strain. Significance level (P) from Kruskal-Wallis test (K-W) is presented; if P < 0.05, results
from further analyses with Mann-Whitney U tests are also presented.
29
Table 3 Significance test between contraction phase (cp), plateau phase (pp), and relaxation
phase (rp), respectively, for longus colli (Lco), longus capitis (Lca), and sternocleidomastoid
(SCM) in 16 healthy volunteersa
Friedman cp-pp cp-rp pp-rp
SR
RMS
Lco 0.003 0.03 (cp ↑) 0.08 0.003 (rp ↑)
Lca 0.31
SCM 0.73
Strain
Mean
Lco 0.27
Lca 0.006 0.003 (pp ↑) 0.08 0.03 (pp ↑)
SCM 0.001 0.0005 (pp ↑) 0.02 (rp ↑) 0.10
Max
Lco 0.01 0.02 (pp ↑) 0.008 (rp ↑) 0.65
Lca 0.15
SCM 0.05 0.02 (pp ↑) 0.06 0.49 aIf Friedman‟s test was significant (P < 0.05), further analyses were done using the Wilcoxon
signed-rank test (descriptive data available in Table 2.) ↑ = higher; i.e., rp↑ indicates that
relaxation phase/end phase was the highest.

30
Table 4 The most common order of tissue deformations as an indicator of activation in the
ventral neck muscles (longus colli (Lco), longus capitis (Lca), and sternocleidomastoid
(SCM)) in 16 healthy volunteers at the start of the contraction phase during ventral isometric
contraction against manual resistance (1= the first muscle to be deformed, 3= latest muscle to
be deformed)a
Test SR Lco SR Lca SR SCM P value P value P value
Person Lco-Lca Lco-SCM Lca-SCM
1 2 1 3
2 1 2 3
3 2 1 3
4 2 1 3
5 1 2 3
6 3 2 1
7 2 1 3
8 1 3 2
9 1 2 3
10 2 3 1
11 2 3 1
12 2 1 3
13 2 3 1
14 1 3 2
15 1 3 2
16 1 3 2
∑ 26 34 36
Most
common
activation
order
1 2 3 0.09 0.03 0.68
aSignificance level, P, from Mann-Whitney U test results is presented. Video sequences
(obtained by Doppler-based tissue velocity imaging) were visually analysed with respect to
regional tissue velocity alternations correlated to the progress of the movement (see also
Figure 4).