TIPS DEVELOPMENT DIALOGUE SEMINAR South Africa and the Credit Crunch Ben Smit Bureau for Economic...
23
TIPS DEVELOPMENT DIALOGUE SEMINAR South Africa and the Credit Crunch Ben Smit Bureau for Economic Research University of Stellenbosch 15 May 2009
-
Upload
gregory-blaise-adams -
Category
Documents
-
view
213 -
download
0
Transcript of TIPS DEVELOPMENT DIALOGUE SEMINAR South Africa and the Credit Crunch Ben Smit Bureau for Economic...
TIPS DEVELOPMENT DIALOGUE SEMINAR
South Africa and the Credit Crunch
TIPS DEVELOPMENT DIALOGUE SEMINAR
South Africa and the Credit Crunch
Ben Smit
Bureau for Economic Research
University of Stellenbosch
15 May 2009

OutlineOutline
SA already in cyclical slowdown when
crisis struck
Financial indicators
Real indicators
Overall expected impact

SA cyclical slowdown: GDP growth rateSA cyclical slowdown: GDP growth rate
-5
-3
-1
1
3
5
7
1980 1985 1990 1995 2000 2005
y-o
-y %
ch
an
ge Ave 1985-94:
0.8% pa
Ave 1995-04:3.1% pa
4Q08 =-1.8% (SAAR)

RMB/ BER BCI
0
20
40
60
80
100
1986 1988 1990 1992 1994 1996 1998 2000 2002 2004 2006 2008
SA cyclical slowdown: RMB/BER BCISA cyclical slowdown: RMB/BER BCI
2009Q1
•Business confidence declined from 33 in 08Q4 to 27 in 09Q1
•Manufacturing 31 16
•Building 42 33
•New vehicles 0 5
•Retail 49 52
•Wholesale 44 31

Financial impact: Portfolio capital flowsFinancial impact: Portfolio capital flows
-60000
-50000
-40000
-30000
-20000
-10000
0
10000
20000
30000
40000
2002 2003 2004 2005 2006 2007 2008 2009
Ran
d (
mill
ion
s)
Oct ‘08

Financial impact: Exchange ratesFinancial impact: Exchange rates
4
5
6
7
8
9
10
11
12
13
14
2002 2003 2004 2005 2006 2007 2008 2009
Rand/ euro Rand/ $
Oct ‘08

100
10100
20100
30100
40100
50100
60100
70100
80100
Jan-99 Jan-00 Jan-01 Jan-02 Jan-03 Jan-04 Jan-05 Jan-06 Jan-07 Jan-08 Jan-09
100
5100
10100
15100
20100
25100
30100
35100
Resources (lhs) All Share
Financial impact: JSE share pricesFinancial impact: JSE share prices
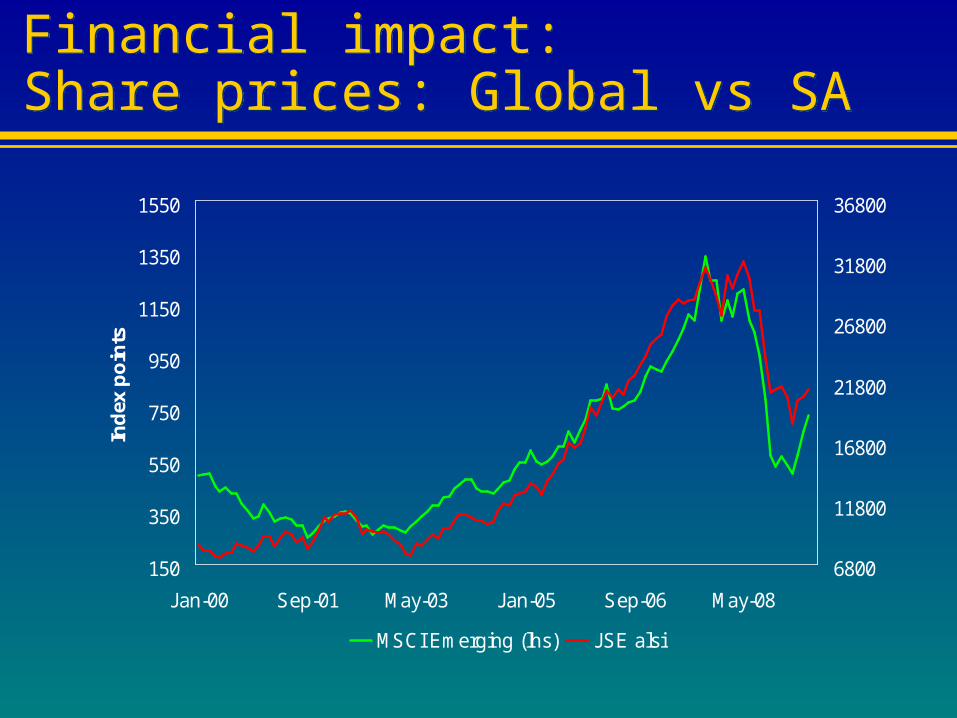
Financial impact: Share prices: Global vs SAFinancial impact: Share prices: Global vs SA
150
350
550
750
950
1150
1350
1550
Jan-00 Sep-01 May-03 Jan-05 Sep-06 May-08
Ind
ex p
oin
ts
6800
11800
16800
21800
26800
31800
36800
MSCI Emerging (lhs) JSE alsi
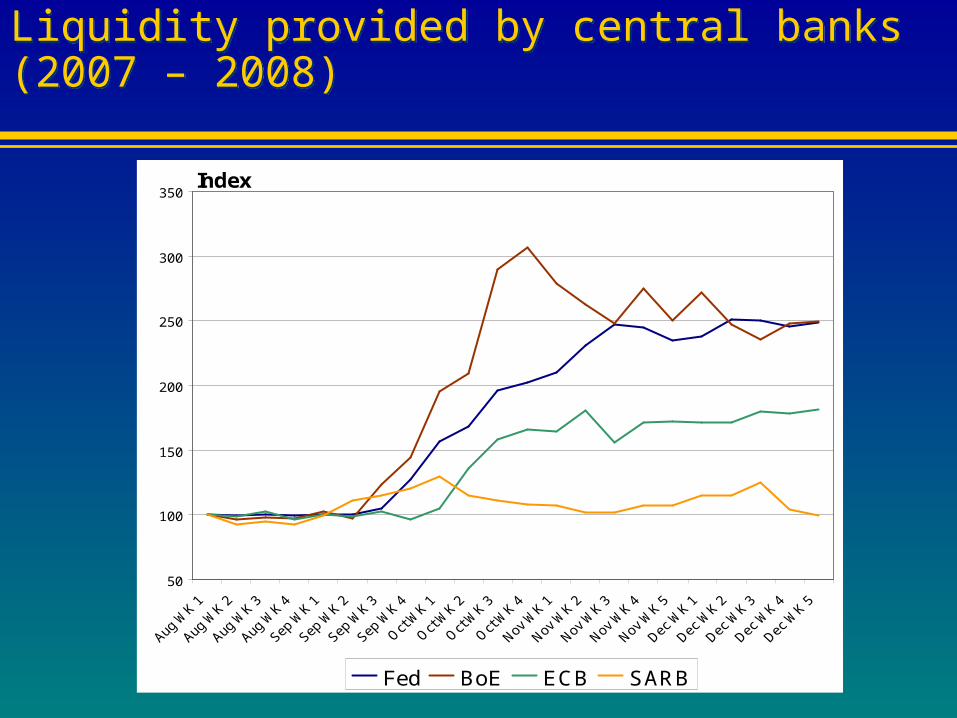
Liquidity provided by central banks (2007 – 2008)Liquidity provided by central banks (2007 – 2008)
50
100
150
200
250
300
350Index
Fed BoE ECB SARB

Real sector: Exports decline sharplyReal sector: Exports decline sharply
Jan/Feb ’09 vs Jan/Feb
‘08
Jan/Feb ’09 vs Nov/Dec
‘08
Contribution to ’08 total
exports
Vehicle and Transport Equipment -7.65% -47.90% 10.3%
Machinery, Mechanical Appliances & Electrical Equipment
-27.06% -28.68% 9.8%
Mineral Products (Total) 36.37% 16.66% 18.0%
Mineral Products (Coal only) 59.23% -25.10% 5.9%
Diamonds -63.21% -25.85% 2.3%
Gold 25.94% -13.42% 6.9%
Platinum -38.26% -20.88% 12.1%
Base Metals & Articles thereof -32.91% -19.20% 17.3%
Chemical Products -5.03% -26.33% 7.1%
Food & Agricultural Categories 48.41% 11.76% 7.2%
Total Exports -5.03% -26.33%
Source of basic data: Customs & Excise

Real sector:Manufacturing: Investec PMI vs Prod VolReal sector:Manufacturing: Investec PMI vs Prod Vol
35
40
45
50
55
60
65
Jan-02 Jan-03 Jan-04 Jan-05 Jan-06 Jan-07 Jan-08 Jan-09
index
-15
-10
-5
0
5
10
15
2 m
onth
s sm
ooth
ed
Investec PMI Mnfr Prod 2mm
April2009
l

30
35
40
45
50
55
60
65
Jan-98 Oct-99 Dec-00 02-Feb 03-Apr 04-Jun 05-Aug 06-Oct 07-Dec Feb-09
Ind
ex p
oin
ts
SA PMI Global PMI
Real Sector:
Manufacturing PMI: SA vs Global
Expansion
Contraction

-60
-40
-20
0
20
40
60
92 94 96 98 00 02 04 06 08
Net
bala
nce
Real sector:BER Manufacturing Survey: Export volumes changes
Real sector:BER Manufacturing Survey: Export volumes changes
Expected
-54

-80
-60
-40
-20
0
20
40
60
80
100
74 76 78 80 82 84 86 88 90 92 94 96 98 00 02 04 06 08
Net
bala
nce
Real sector:BER manufacturing survey:Domestic sales volume changes
Real sector:BER manufacturing survey:Domestic sales volume changes
Expected
-65

-80
-60
-40
-20
0
20
40
60
80
100
74 76 78 80 82 84 86 88 90 92 94 96 98 00 02 04 06 08
Net
bala
nce
Real sector:BER manufacturing survey:Production volume changes
Real sector:BER manufacturing survey:Production volume changes
Expected
-63
-30
-20
-10
0
10
20
30
40
92 94 96 98 00 02 04 06 08
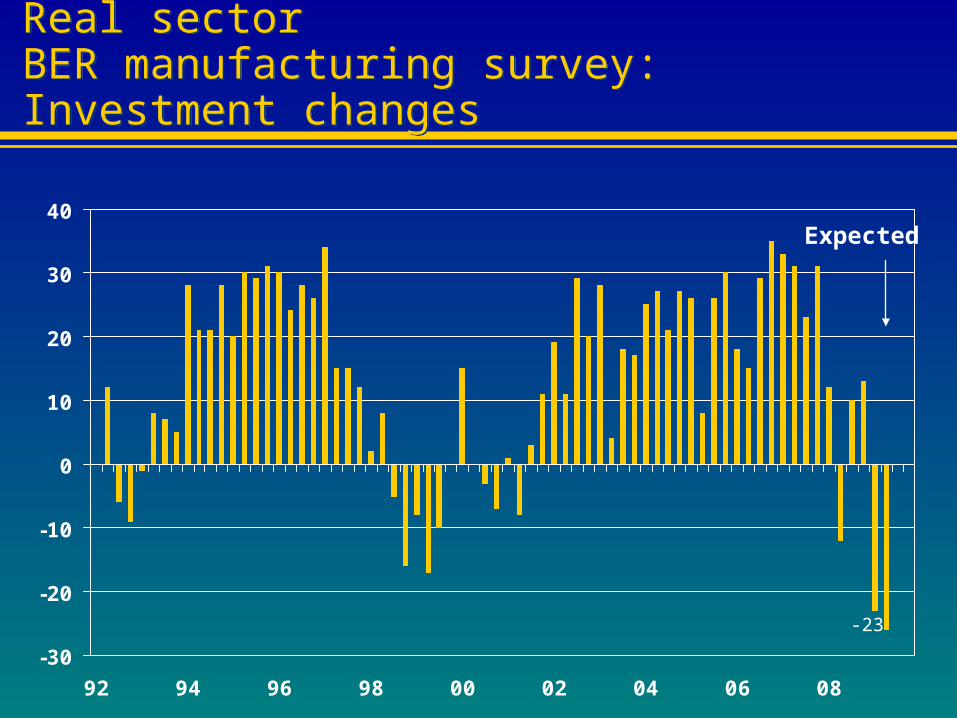
Real sectorBER manufacturing survey:Investment changes
Real sectorBER manufacturing survey:Investment changes
Expected
-23

Real sector:BER manufacturing survey:Expected total fixed investment in 12 months time
Real sector:BER manufacturing survey:Expected total fixed investment in 12 months time
-20
-10
0
10
20
30
40
50
60
93 94 95 96 97 98 99 00 01 02 03 04 05 06 07 08 09
Net
bal
ance
-8
-80
-60
-40
-20
0
20
40
60
80
100
1985 1987 1989 1991 1993 1995 1997 1999 2001 2003 2005 2007 2009
Manufacturing Retail B&C
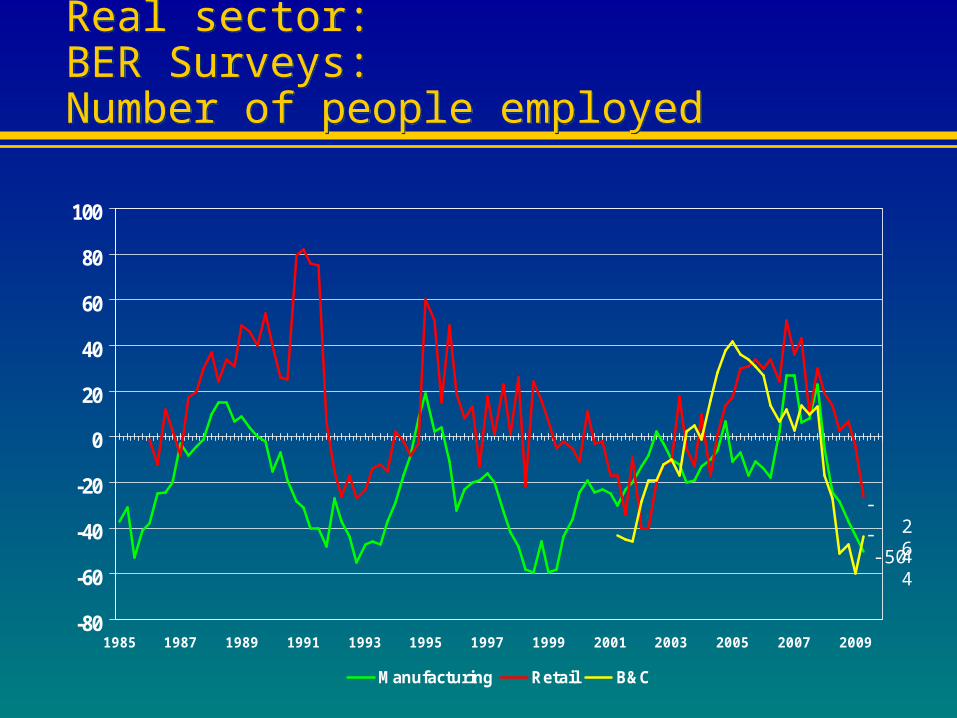
Real sector:BER Surveys:Number of people employed
Real sector:BER Surveys:Number of people employed
-26
-50-44

Real sector:BER manufacturing survey:Numbers employed vs hours worked
Real sector:BER manufacturing survey:Numbers employed vs hours worked
-80
-60
-40
-20
0
20
40
Mar-70 Jun-76 Sep-82 Dec-88 Mar-95 Jun-01 Sep-07
BE
R n
et b
alan
ce
Number of factory workers Average hours worked
-67
-43
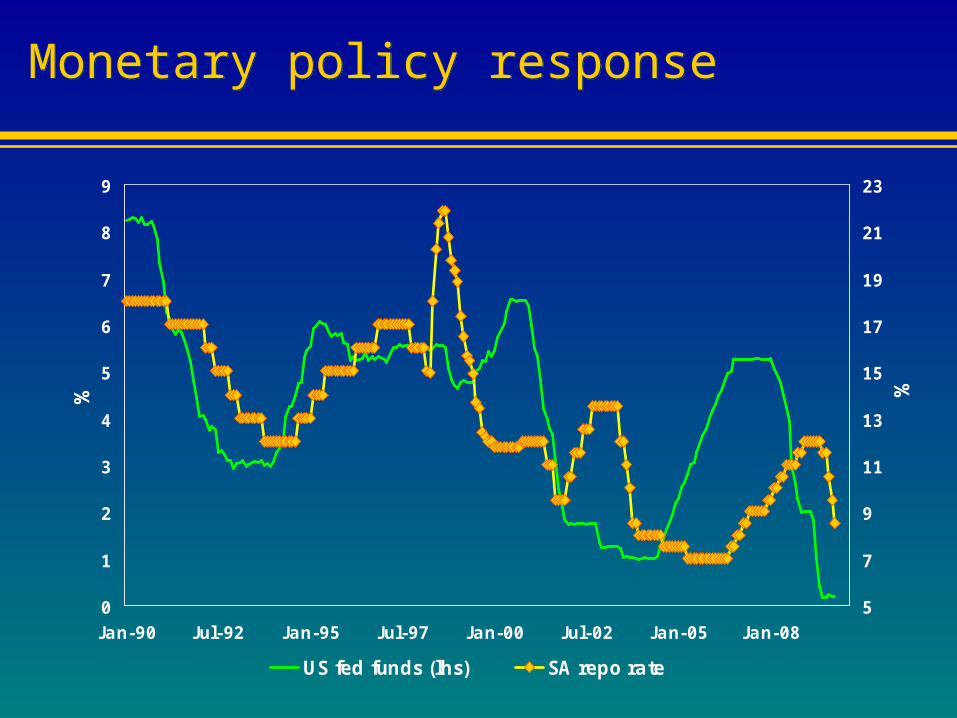
0
1
2
3
4
5
6
7
8
9
Jan-90 Jul-92 Jan-95 Jul-97 Jan-00 Jul-02 Jan-05 Jan-08
%
5
7
9
11
13
15
17
19
21
23
%
US fed funds (lhs) SA repo rate
Monetary policy responseMonetary policy response

Fiscal Policy responseFiscal Policy response
Budget more expansive than expected, unlikely to prevent sharp growth slowdown
Budget may benefit SA focused construction companies, non-durable retailers (social grant increases, 45% of personal tax relief for people with taxable income below R150k p.a.)
Extension of child support grant to 15 – research being done of feasibility of further extension to 18 years of ago
Massive public sector investment (R787 over MTEF) key growth support, but also risks (offshore funding constrained in current environment) – Acsa already hinted may spend less
-6
-4
-2
0
2
4
6
8
10
1994 1997 2000 2003 2006 2009
% o
f G
DP
Budget balance Public sector borrowing requirement

Overall SA impact of the global crisis/recession in 2009Overall SA impact of the global crisis/recession in 2009
08Q3 09Q2
South Africa***
- GDP growth 3.2 -0.8
- Export growth 6.7 -9.1
Global GDP growth
- World
- IMF** 3.0 -1.3
- JPM* 2.3 -2.6
- Advanced countries
- IMF** 0.5 -3.8
- JPM* 1.4 -3.4
- Emerging markets
- IMF** 6.1 1.6
- JPM* 6.0 0.2*Aug ’08 vs May ’09
**Oct ’08 vs April ’09
*** BER forecast

Bureau for Economic Research
Economic information that works for you
Bureau for Economic Research
Economic information that works for you
Website: www.ber.sun.ac.za
E-mail: [email protected]
Tel No: 021-887 2810