![Health Systems in Myanmar new.ppt [Read-Only]yangon.sites.unicnetwork.org/files/2013/05/Health...Health Systems in Myanmar Dr. Nilar Tin Director Planning Department of Health Ministry](https://static.fdocuments.net/doc/165x107/5ab044837f8b9adb688eb63a/health-systems-in-myanmar-newppt-read-only-systems-in-myanmar-dr-nilar-tin-director.jpg)
Tin mining in Myanmar Production and potential · Tin mining in Myanmar: Production and potential...
15
Tin mining in Myanmar: Production and potential Nicholas J. Gardiner a,n , John P. Sykes b,c,d , Allan Trench b,e , Laurence J. Robb a a Department of Earth Sciences, University of Oxford, Oxford OX1 3AN, United Kingdom b Centre for Exploration Targeting, Department of Mineral and Energy Economics, Curtin Graduate School of Business, Perth, Western Australia 6000, Australia c Centre for ExplorationTargeting, School of Earth and Environment, The University of Western Australia, Crawley, Western Australia 6009, Australia d Greenfields Research, Hunters Chase, Highfield Farm, Hartwith, Harrogate, North Yorkshire HG3 3HA, United Kingdom e CRU Group, Chancery House, 53-64 Chancery Lane, London WC2A 1QS, United Kingdom article info Article history: Received 3 July 2015 Received in revised form 4 October 2015 Accepted 5 October 2015 Keywords: Tin Mining Myanmar - Burma China - Yunnan Man Maw Dawei-Tavoy Cassiterite Sn production abstract In 2014, Myanmar (Burma) confounded industry analysts by emerging to become the World's third biggest tin producer, experiencing a 5-year tin production increase of ca. 4900%. This surprise emergence of Myanmar as a major tin producer is a possible Black Swan event that potentially has significant re- percussions both for the future of global tin production, and for the economic development of Myanmar. This is a disruptive event that has likely contributed to a substantial drop in tin prices in 2015. The Myanmar production increase came from a new mine site in Wa State, and not from the traditional tin- producing areas in the South. We discuss tin mining and potential in Myanmar and consider whether it could provide a foundation for the economic rehabilitation of the country. & 2015 Elsevier Ltd. All rights reserved. 1. Introduction In 2014, Myanmar (Burma) confounded industry analysts by emerging as the world's third major tin producer (Fig. 1), experi- encing a tin production increase over 2009–2014 of circa (ca.) 4900% (Table 1). The squeeze on global tin prices over much of the last decade finally caused new supply to emerge from what has recently been a relatively overlooked minerals jurisdiction. Al- though Myanmar was a major tin and tungsten producer pre- World War II, since the 1960s much of its mining industry has been an essentially artisanal operation, in 2013 representing less than 0.1% of the country's GDP (Gardiner et al., 2014). This emer- gence of Myanmar is a potential “Black Swan” event in tin pro- duction – an event that was improbable, but nonetheless of high impact (Taleb, 2008). Combined with the decline of traditional tin producers (Kettle et al., 2014b), the sudden rise of the Myanmar tin mining industry has the potential to refocus global tin pro- duction over the next decade. As a minerals jurisdiction, Myanmar was a significant producer of both tin and tungsten pre-World War II, however its industry was considerably downsized in the last 60 years largely due to the domestic political situation (e.g., Gardiner et al. (2014), Gardiner and Sykes (2015)). As the country opens up both politically and economically, we investigate the outlook for the tin industry within Myanmar and ask whether the combination of renewed global interest in tin, and Myanmar's ongoing political and eco- nomic change, mean the country can keep its recent momentum and again become a major producer of tin, tungsten and associated metals. Finally, we consider whether renewed growth in Myan- mar's tin production sector can help instigate broader and stronger economic growth and social development within the country. 2. Tin production: a global perspective The tin price crash of the mid-1980s, the result of the collapse of the International Tin Agreement (Anonymous, 1986), resulted in two decades of depressed global tin prices (Fig. 2). The ensuing economic and social impact on the traditional tin-producing re- gions of Southwest England, Australia and Southeast Asia (pri- marily Malaysia and Thailand) was considerable, resulting in a legacy of mine decommissioning and the relocation of tin pro- duction to cheaper producers such as Brazil, China and Indonesia (Kettle et al., 2014b; Thoburn, 1994). However since 2008, global tin prices have recovered to reach a consistent high of ca. US $20,000/t (per metric tonne) in real terms, a level not seen for over 30 years. This has largely been driven by a combination of new Contents lists available at ScienceDirect journal homepage: www.elsevier.com/locate/resourpol Resources Policy http://dx.doi.org/10.1016/j.resourpol.2015.10.002 0301-4207/& 2015 Elsevier Ltd. All rights reserved. n Corresponding author. Current address: Centre for Exploration Targeting – Curtin Node, Department of Applied Geology, Western Australian School of Mines, Curtin University, Perth, WA 6845, Australia. E-mail address: [email protected] (N.J. Gardiner). Resources Policy 46 (2015) 219–233
Transcript of Tin mining in Myanmar Production and potential · Tin mining in Myanmar: Production and potential...
Resources Policy 46 (2015) 219–233
Contents lists available at ScienceDirect
Resources Policy
http://d0301-42
n CorrCurtin NCurtin U
E-m
journal homepage: www.elsevier.com/locate/resourpol
Tin mining in Myanmar: Production and potential
Nicholas J. Gardiner a,n, John P. Sykes b,c,d, Allan Trench b,e, Laurence J. Robb a
a Department of Earth Sciences, University of Oxford, Oxford OX1 3AN, United Kingdomb Centre for Exploration Targeting, Department of Mineral and Energy Economics, Curtin Graduate School of Business, Perth, Western Australia 6000,Australiac Centre for Exploration Targeting, School of Earth and Environment, The University of Western Australia, Crawley, Western Australia 6009, Australiad Greenfields Research, Hunters Chase, Highfield Farm, Hartwith, Harrogate, North Yorkshire HG3 3HA, United Kingdome CRU Group, Chancery House, 53-64 Chancery Lane, London WC2A 1QS, United Kingdom
a r t i c l e i n f o
Article history:Received 3 July 2015Received in revised form4 October 2015Accepted 5 October 2015
Keywords:Tin MiningMyanmar - BurmaChina - YunnanMan MawDawei-TavoyCassiterite Sn production
x.doi.org/10.1016/j.resourpol.2015.10.00207/& 2015 Elsevier Ltd. All rights reserved.
esponding author. Current address: Centreode, Department of Applied Geology, Westerniversity, Perth, WA 6845, Australia.ail address: [email protected] (
a b s t r a c t
In 2014, Myanmar (Burma) confounded industry analysts by emerging to become the World's thirdbiggest tin producer, experiencing a 5-year tin production increase of ca. 4900%. This surprise emergenceof Myanmar as a major tin producer is a possible Black Swan event that potentially has significant re-percussions both for the future of global tin production, and for the economic development of Myanmar.This is a disruptive event that has likely contributed to a substantial drop in tin prices in 2015. TheMyanmar production increase came from a new mine site in Wa State, and not from the traditional tin-producing areas in the South. We discuss tin mining and potential in Myanmar and consider whether itcould provide a foundation for the economic rehabilitation of the country.
& 2015 Elsevier Ltd. All rights reserved.
1. Introduction
In 2014, Myanmar (Burma) confounded industry analysts byemerging as the world's third major tin producer (Fig. 1), experi-encing a tin production increase over 2009–2014 of circa (ca.)4900% (Table 1). The squeeze on global tin prices over much of thelast decade finally caused new supply to emerge from what hasrecently been a relatively overlooked minerals jurisdiction. Al-though Myanmar was a major tin and tungsten producer pre-World War II, since the 1960s much of its mining industry hasbeen an essentially artisanal operation, in 2013 representing lessthan 0.1% of the country's GDP (Gardiner et al., 2014). This emer-gence of Myanmar is a potential “Black Swan” event in tin pro-duction – an event that was improbable, but nonetheless of highimpact (Taleb, 2008). Combined with the decline of traditional tinproducers (Kettle et al., 2014b), the sudden rise of the Myanmartin mining industry has the potential to refocus global tin pro-duction over the next decade.
As a minerals jurisdiction, Myanmar was a significant producerof both tin and tungsten pre-World War II, however its industrywas considerably downsized in the last 60 years largely due to the
for Exploration Targeting –
n Australian School of Mines,
N.J. Gardiner).
domestic political situation (e.g., Gardiner et al. (2014), Gardinerand Sykes (2015)). As the country opens up both politically andeconomically, we investigate the outlook for the tin industrywithin Myanmar and ask whether the combination of renewedglobal interest in tin, and Myanmar's ongoing political and eco-nomic change, mean the country can keep its recent momentumand again become a major producer of tin, tungsten and associatedmetals. Finally, we consider whether renewed growth in Myan-mar's tin production sector can help instigate broader and strongereconomic growth and social development within the country.
2. Tin production: a global perspective
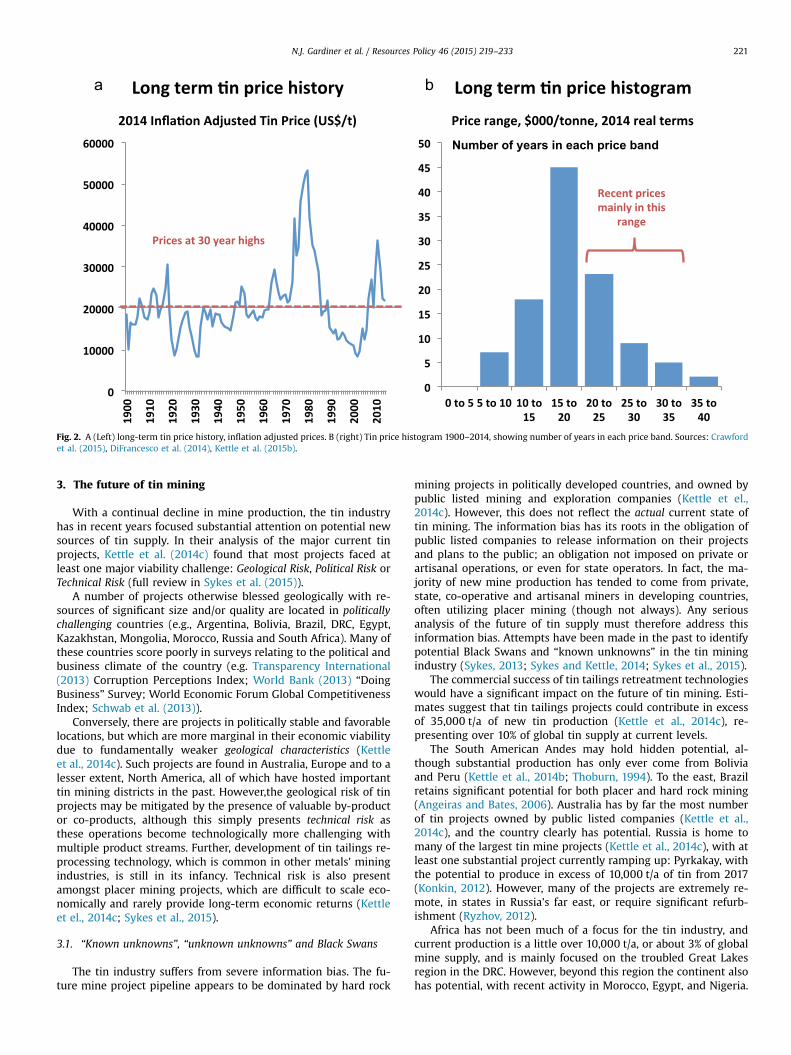
The tin price crash of the mid-1980s, the result of the collapseof the International Tin Agreement (Anonymous, 1986), resulted intwo decades of depressed global tin prices (Fig. 2). The ensuingeconomic and social impact on the traditional tin-producing re-gions of Southwest England, Australia and Southeast Asia (pri-marily Malaysia and Thailand) was considerable, resulting in alegacy of mine decommissioning and the relocation of tin pro-duction to cheaper producers such as Brazil, China and Indonesia(Kettle et al., 2014b; Thoburn, 1994). However since 2008, globaltin prices have recovered to reach a consistent high of ca. US$20,000/t (per metric tonne) in real terms, a level not seen for over30 years. This has largely been driven by a combination of new
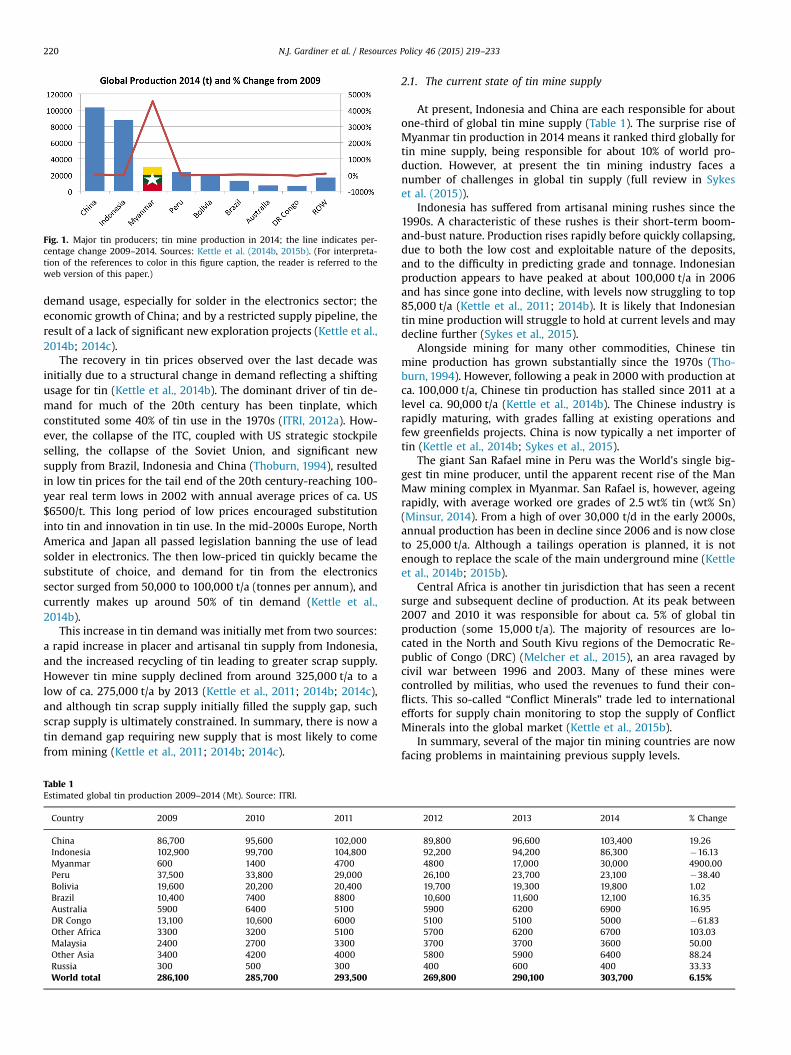
Fig. 1. Major tin producers; tin mine production in 2014; the line indicates per-centage change 2009–2014. Sources: Kettle et al. (2014b, 2015b). (For interpreta-tion of the references to color in this figure caption, the reader is referred to theweb version of this paper.)
N.J. Gardiner et al. / Resources Policy 46 (2015) 219–233220
demand usage, especially for solder in the electronics sector; theeconomic growth of China; and by a restricted supply pipeline, theresult of a lack of significant new exploration projects (Kettle et al.,2014b; 2014c).
The recovery in tin prices observed over the last decade wasinitially due to a structural change in demand reflecting a shiftingusage for tin (Kettle et al., 2014b). The dominant driver of tin de-mand for much of the 20th century has been tinplate, whichconstituted some 40% of tin use in the 1970s (ITRI, 2012a). How-ever, the collapse of the ITC, coupled with US strategic stockpileselling, the collapse of the Soviet Union, and significant newsupply from Brazil, Indonesia and China (Thoburn, 1994), resultedin low tin prices for the tail end of the 20th century-reaching 100-year real term lows in 2002 with annual average prices of ca. US$6500/t. This long period of low prices encouraged substitutioninto tin and innovation in tin use. In the mid-2000s Europe, NorthAmerica and Japan all passed legislation banning the use of leadsolder in electronics. The then low-priced tin quickly became thesubstitute of choice, and demand for tin from the electronicssector surged from 50,000 to 100,000 t/a (tonnes per annum), andcurrently makes up around 50% of tin demand (Kettle et al.,2014b).
This increase in tin demand was initially met from two sources:a rapid increase in placer and artisanal tin supply from Indonesia,and the increased recycling of tin leading to greater scrap supply.However tin mine supply declined from around 325,000 t/a to alow of ca. 275,000 t/a by 2013 (Kettle et al., 2011; 2014b; 2014c),and although tin scrap supply initially filled the supply gap, suchscrap supply is ultimately constrained. In summary, there is now atin demand gap requiring new supply that is most likely to comefrom mining (Kettle et al., 2011; 2014b; 2014c).
Table 1Estimated global tin production 2009–2014 (Mt). Source: ITRI.
Country 2009 2010 2011
China 86,700 95,600 102,000Indonesia 102,900 99,700 104,800Myanmar 600 1400 4700Peru 37,500 33,800 29,000Bolivia 19,600 20,200 20,400Brazil 10,400 7400 8800Australia 5900 6400 5100DR Congo 13,100 10,600 6000Other Africa 3300 3200 5100Malaysia 2400 2700 3300Other Asia 3400 4200 4000Russia 300 500 300World total 286,100 285,700 293,500
2.1. The current state of tin mine supply
At present, Indonesia and China are each responsible for aboutone-third of global tin mine supply (Table 1). The surprise rise ofMyanmar tin production in 2014 means it ranked third globally fortin mine supply, being responsible for about 10% of world pro-duction. However, at present the tin mining industry faces anumber of challenges in global tin supply (full review in Sykeset al. (2015)).
Indonesia has suffered from artisanal mining rushes since the1990s. A characteristic of these rushes is their short-term boom-and-bust nature. Production rises rapidly before quickly collapsing,due to both the low cost and exploitable nature of the deposits,and to the difficulty in predicting grade and tonnage. Indonesianproduction appears to have peaked at about 100,000 t/a in 2006and has since gone into decline, with levels now struggling to top85,000 t/a (Kettle et al., 2011; 2014b). It is likely that Indonesiantin mine production will struggle to hold at current levels and maydecline further (Sykes et al., 2015).
Alongside mining for many other commodities, Chinese tinmine production has grown substantially since the 1970s (Tho-burn, 1994). However, following a peak in 2000 with production atca. 100,000 t/a, Chinese tin production has stalled since 2011 at alevel ca. 90,000 t/a (Kettle et al., 2014b). The Chinese industry israpidly maturing, with grades falling at existing operations andfew greenfields projects. China is now typically a net importer oftin (Kettle et al., 2014b; Sykes et al., 2015).
The giant San Rafael mine in Peru was the World's single big-gest tin mine producer, until the apparent recent rise of the ManMaw mining complex in Myanmar. San Rafael is, however, ageingrapidly, with average worked ore grades of 2.5 wt% tin (wt% Sn)(Minsur, 2014). From a high of over 30,000 t/d in the early 2000s,annual production has been in decline since 2006 and is now closeto 25,000 t/a. Although a tailings operation is planned, it is notenough to replace the scale of the main underground mine (Kettleet al., 2014b; 2015b).
Central Africa is another tin jurisdiction that has seen a recentsurge and subsequent decline of production. At its peak between2007 and 2010 it was responsible for about ca. 5% of global tinproduction (some 15,000 t/a). The majority of resources are lo-cated in the North and South Kivu regions of the Democratic Re-public of Congo (DRC) (Melcher et al., 2015), an area ravaged bycivil war between 1996 and 2003. Many of these mines werecontrolled by militias, who used the revenues to fund their con-flicts. This so-called “Conflict Minerals” trade led to internationalefforts for supply chain monitoring to stop the supply of ConflictMinerals into the global market (Kettle et al., 2015b).
In summary, several of the major tin mining countries are nowfacing problems in maintaining previous supply levels.
2012 2013 2014 % Change
89,800 96,600 103,400 19.2692,200 94,200 86,300 �16.134800 17,000 30,000 4900.0026,100 23,700 23,100 �38.4019,700 19,300 19,800 1.0210,600 11,600 12,100 16.355900 6200 6900 16.955100 5100 5000 �61.835700 6200 6700 103.033700 3700 3600 50.005800 5900 6400 88.24400 600 400 33.33269,800 290,100 303,700 6.15%
a b
Fig. 2. A (Left) long-term tin price history, inflation adjusted prices. B (right) Tin price histogram 1900–2014, showing number of years in each price band. Sources: Crawfordet al. (2015), DiFrancesco et al. (2014), Kettle et al. (2015b).
N.J. Gardiner et al. / Resources Policy 46 (2015) 219–233 221
3. The future of tin mining
With a continual decline in mine production, the tin industryhas in recent years focused substantial attention on potential newsources of tin supply. In their analysis of the major current tinprojects, Kettle et al. (2014c) found that most projects faced atleast one major viability challenge: Geological Risk, Political Risk orTechnical Risk (full review in Sykes et al. (2015)).
A number of projects otherwise blessed geologically with re-sources of significant size and/or quality are located in politicallychallenging countries (e.g., Argentina, Bolivia, Brazil, DRC, Egypt,Kazakhstan, Mongolia, Morocco, Russia and South Africa). Many ofthese countries score poorly in surveys relating to the political andbusiness climate of the country (e.g. Transparency International(2013) Corruption Perceptions Index; World Bank (2013) “DoingBusiness” Survey; World Economic Forum Global CompetitivenessIndex; Schwab et al. (2013)).
Conversely, there are projects in politically stable and favorablelocations, but which are more marginal in their economic viabilitydue to fundamentally weaker geological characteristics (Kettleet al., 2014c). Such projects are found in Australia, Europe and to alesser extent, North America, all of which have hosted importanttin mining districts in the past. However,the geological risk of tinprojects may be mitigated by the presence of valuable by-productor co-products, although this simply presents technical risk asthese operations become technologically more challenging withmultiple product streams. Further, development of tin tailings re-processing technology, which is common in other metals' miningindustries, is still in its infancy. Technical risk is also presentamongst placer mining projects, which are difficult to scale eco-nomically and rarely provide long-term economic returns (Kettleet el., 2014c; Sykes et al., 2015).
3.1. “Known unknowns”, “unknown unknowns” and Black Swans
The tin industry suffers from severe information bias. The fu-ture mine project pipeline appears to be dominated by hard rock
mining projects in politically developed countries, and owned bypublic listed mining and exploration companies (Kettle et el.,2014c). However, this does not reflect the actual current state oftin mining. The information bias has its roots in the obligation ofpublic listed companies to release information on their projectsand plans to the public; an obligation not imposed on private orartisanal operations, or even for state operators. In fact, the ma-jority of new mine production has tended to come from private,state, co-operative and artisanal miners in developing countries,often utilizing placer mining (though not always). Any seriousanalysis of the future of tin supply must therefore address thisinformation bias. Attempts have been made in the past to identifypotential Black Swans and “known unknowns” in the tin miningindustry (Sykes, 2013; Sykes and Kettle, 2014; Sykes et al., 2015).
The commercial success of tin tailings retreatment technologieswould have a significant impact on the future of tin mining. Esti-mates suggest that tin tailings projects could contribute in excessof 35,000 t/a of new tin production (Kettle et al., 2014c), re-presenting over 10% of global tin supply at current levels.
The South American Andes may hold hidden potential, al-though substantial production has only ever come from Boliviaand Peru (Kettle et al., 2014b; Thoburn, 1994). To the east, Brazilretains significant potential for both placer and hard rock mining(Angeiras and Bates, 2006). Australia has by far the most numberof tin projects owned by public listed companies (Kettle et al.,2014c), and the country clearly has potential. Russia is home tomany of the largest tin mine projects (Kettle et al., 2014c), with atleast one substantial project currently ramping up: Pyrkakay, withthe potential to produce in excess of 10,000 t/a of tin from 2017(Konkin, 2012). However, many of the projects are extremely re-mote, in states in Russia's far east, or require significant refurb-ishment (Ryzhov, 2012).
Africa has not been much of a focus for the tin industry, andcurrent production is a little over 10,000 t/a, or about 3% of globalmine supply, and is mainly focused on the troubled Great Lakesregion in the DRC. However, beyond this region the continent alsohas potential, with recent activity in Morocco, Egypt, and Nigeria.
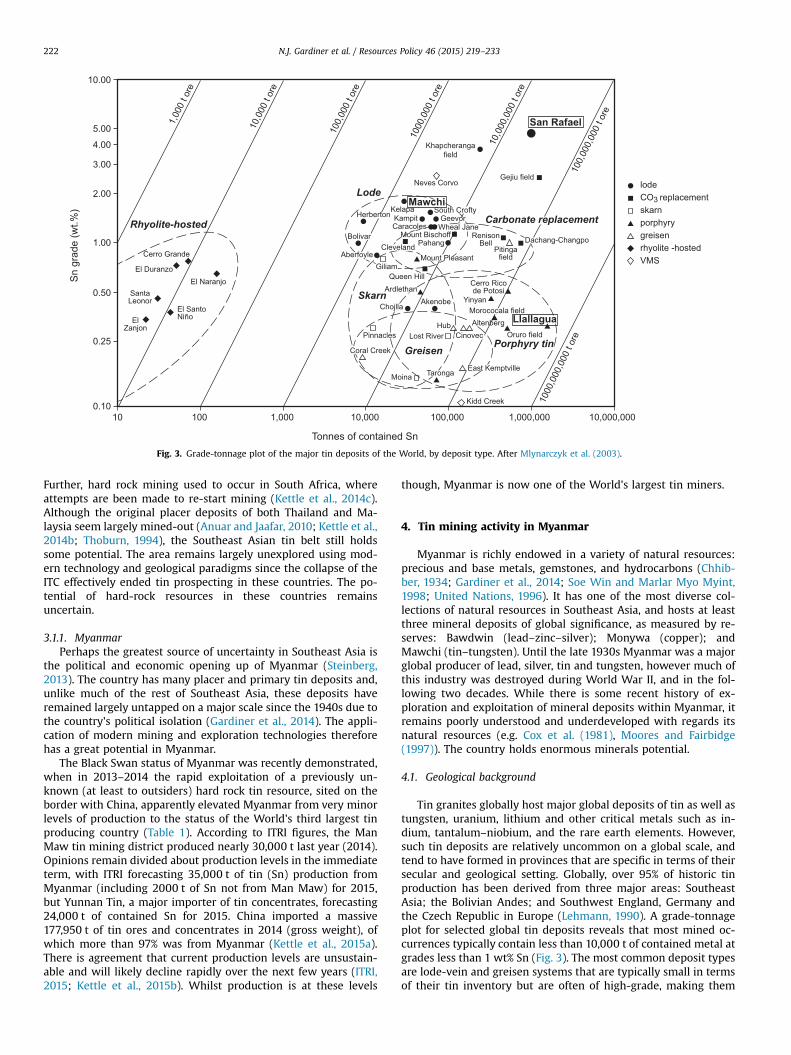
Fig. 3. Grade-tonnage plot of the major tin deposits of the World, by deposit type. After Mlynarczyk et al. (2003).
N.J. Gardiner et al. / Resources Policy 46 (2015) 219–233222
Further, hard rock mining used to occur in South Africa, whereattempts are been made to re-start mining (Kettle et al., 2014c).Although the original placer deposits of both Thailand and Ma-laysia seem largely mined-out (Anuar and Jaafar, 2010; Kettle et al.,2014b; Thoburn, 1994), the Southeast Asian tin belt still holdssome potential. The area remains largely unexplored using mod-ern technology and geological paradigms since the collapse of theITC effectively ended tin prospecting in these countries. The po-tential of hard-rock resources in these countries remainsuncertain.
3.1.1. MyanmarPerhaps the greatest source of uncertainty in Southeast Asia is
the political and economic opening up of Myanmar (Steinberg,2013). The country has many placer and primary tin deposits and,unlike much of the rest of Southeast Asia, these deposits haveremained largely untapped on a major scale since the 1940s due tothe country's political isolation (Gardiner et al., 2014). The appli-cation of modern mining and exploration technologies thereforehas a great potential in Myanmar.
The Black Swan status of Myanmar was recently demonstrated,when in 2013–2014 the rapid exploitation of a previously un-known (at least to outsiders) hard rock tin resource, sited on theborder with China, apparently elevated Myanmar from very minorlevels of production to the status of the World's third largest tinproducing country (Table 1). According to ITRI figures, the ManMaw tin mining district produced nearly 30,000 t last year (2014).Opinions remain divided about production levels in the immediateterm, with ITRI forecasting 35,000 t of tin (Sn) production fromMyanmar (including 2000 t of Sn not from Man Maw) for 2015,but Yunnan Tin, a major importer of tin concentrates, forecasting24,000 t of contained Sn for 2015. China imported a massive177,950 t of tin ores and concentrates in 2014 (gross weight), ofwhich more than 97% was from Myanmar (Kettle et al., 2015a).There is agreement that current production levels are unsustain-able and will likely decline rapidly over the next few years (ITRI,2015; Kettle et al., 2015b). Whilst production is at these levels
though, Myanmar is now one of the World's largest tin miners.
4. Tin mining activity in Myanmar
Myanmar is richly endowed in a variety of natural resources:precious and base metals, gemstones, and hydrocarbons (Chhib-ber, 1934; Gardiner et al., 2014; Soe Win and Marlar Myo Myint,1998; United Nations, 1996). It has one of the most diverse col-lections of natural resources in Southeast Asia, and hosts at leastthree mineral deposits of global significance, as measured by re-serves: Bawdwin (lead–zinc–silver); Monywa (copper); andMawchi (tin–tungsten). Until the late 1930s Myanmar was a majorglobal producer of lead, silver, tin and tungsten, however much ofthis industry was destroyed during World War II, and in the fol-lowing two decades. While there is some recent history of ex-ploration and exploitation of mineral deposits within Myanmar, itremains poorly understood and underdeveloped with regards itsnatural resources (e.g. Cox et al. (1981), Moores and Fairbidge(1997)). The country holds enormous minerals potential.
4.1. Geological background
Tin granites globally host major global deposits of tin as well astungsten, uranium, lithium and other critical metals such as in-dium, tantalum–niobium, and the rare earth elements. However,such tin deposits are relatively uncommon on a global scale, andtend to have formed in provinces that are specific in terms of theirsecular and geological setting. Globally, over 95% of historic tinproduction has been derived from three major areas: SoutheastAsia; the Bolivian Andes; and Southwest England, Germany andthe Czech Republic in Europe (Lehmann, 1990). A grade-tonnageplot for selected global tin deposits reveals that most mined oc-currences typically contain less than 10,000 t of contained metal atgrades less than 1 wt% Sn (Fig. 3). The most common deposit typesare lode-vein and greisen systems that are typically small in termsof their tin inventory but are often of high-grade, making them
N.J. Gardiner et al. / Resources Policy 46 (2015) 219–233 223
amenable to small-scale selective mining practices. By contrast,porphyry tin deposits, such as those that typify the Bolivian tinbelt, are less abundant globally and generally of a lower-grade, but
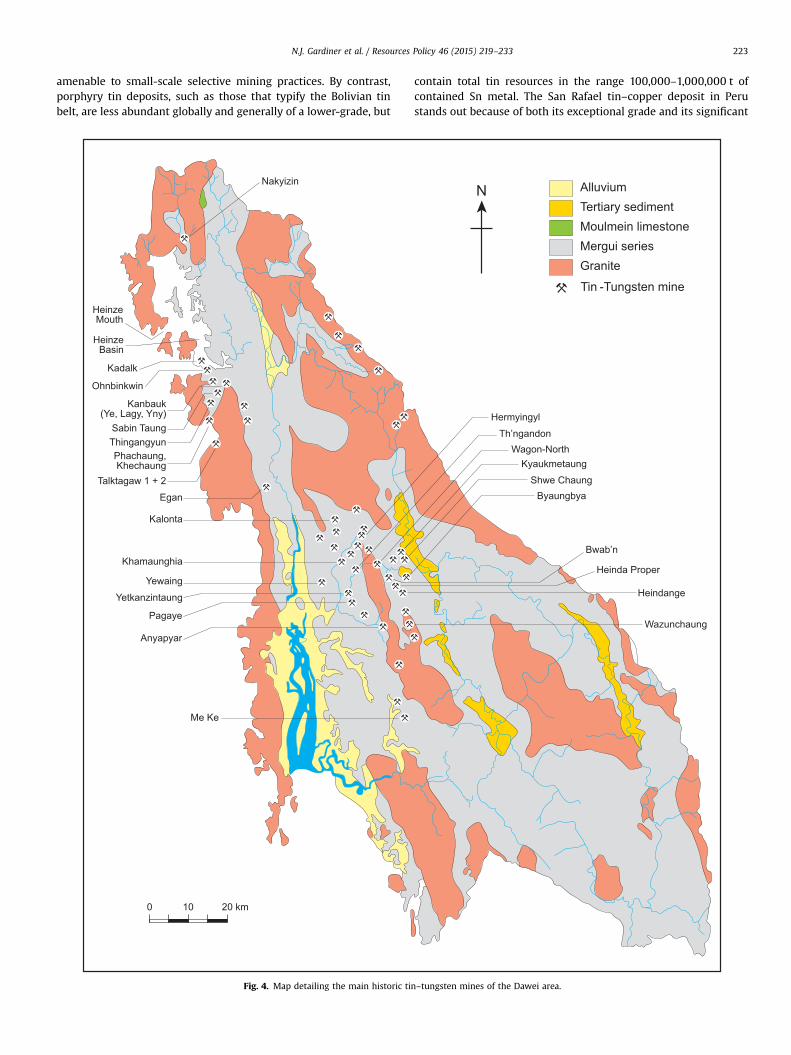
Fig. 4. Map detailing the main historic tin
contain total tin resources in the range 100,000–1,000,000 t ofcontained Sn metal. The San Rafael tin–copper deposit in Perustands out because of both its exceptional grade and its significant
–tungsten mines of the Dawei area.
N.J. Gardiner et al. / Resources Policy 46 (2015) 219–233224
size. Also highlighted is the Mawchi Mine in Myanmar, which aswell as being an historically dominant tungsten producer, is also asignificant lode-based tin deposit grading at nearly 2 wt% Sn.
4.2. Major tin producing areas in Myanmar
The tin deposits of Myanmar, Malaysia and Thailand are di-rectly related to the intrusion of a series of granite belts that runbroadly N–S for 100 s kms across much of Southeast Asia. Collec-tively, these belts have been responsible for some 54% of totalglobal tin production (Schwartz et al., 1995), making them theworld's premier tin producing region. In Malaysia and Thailand, tinproduction was largely accomplished through industrial-scaleriver- and coastal-dredging of alluvial deposits. In Myanmar,however, there are extensive primary deposits alongside the pro-ducts of weathering of the host rocks: elluvial (in-situ) and alluvialplacers (transported and deposited) placers.
Myanmar tin production has been focused in a belt from theeast of Yangon extending southwards along the Myeik Archipela-go, especially around the port town of Dawei (Tavoy) – whichhosts many primary deposits – and Myeik (Mergui) in the farsouth – where deposits tend to be more of alluvial and elluvial-type. In this region, over 100 primary tin deposits have been his-torically recognized (United Nations, 1996). However, significanttin mineralization is also found elsewhere within the WesternProvince, including the historic Mawchi Mine in Karen State, onceone of the largest global producers of tungsten as well as tin. Tindeposits have also been reported within the Shan Plateau to theeast.
Although many primary deposits exist in Myanmar, the countryalso hosts extensive placer deposits, the products of weathering ofthe mineralized granites or host country rocks. This weathering,which in tropical Myanmar can produce lateritic horizons of up to20 m in depth, produces either in-situ elluvial deposits, or alluvialconcentrations of cassiterite in streams and river gravels. Suchalluvial deposits are particularly advantageous for the artisanalminer. There is no primary ore to crush; they can be easily ex-cavated using as basic a tool as a shovel, or with more mechanizedtechniques; and following excavation, a simple gravity separationprocess (e.g. a sluice or shaking table) allows recovery of tinconcentrate of varying grades.
4.2.1. The Dawei tin districtIn the south, tin production is centered on the port town of
Dawei where over 50 historical mines have been recorded, in-cluding the famous mines at Hermyingyi, Heinda, Pagaye, Pa-chaung and Kalonta (Chhibber, 1934). Fig. 4 shows a map of theDawei district with major tin mines marked, many of which weredeveloped by the British during the mining boom of the early 20thcentury. The Dawei tin district hosts large, important tin–tungstenlode mines, typified by the Hermyingyi mine. However, major al-luvial deposits are also worked. The Heinda Mine, 25 km NE ofDawei, is a major open-pit placer tin mine that has been con-tinuously operated for over 100 years, and is still a major producertoday. Since 1999, Heinda has been operated by Myanmar Pong-pipat Co., a Thai company.
4.2.2. Shan States tinWithin the Shan States in eastern Myanmar, tin-bearing gran-
ites have been reported. Major Shan producing areas include theMan Maw tin district, Namkham, and Mu Se in the northern ShanStates. Than Htun et al. (2014) reported a new tin deposit dis-covery in 2011 sited near Mong Ton and Mong Hsat-a relativelyunexplored part of the southern Shan States close to the Thaiborder. The Shan States are politically and geographically moreremote than the southern tin districts, and accordingly their
operations tend to be less well understood. The proximity to Chinameans much tin production tends to be exported directly over theborder.
4.3. Historical framework
Artisanal mining and smelting of tin deposits by Burmese andChinese occurred during mediaeval times, and activity was re-ported as early as 1599 (Chhibber, 1934). In 1839 a German geol-ogist, Helfer (1839), reported tin-bearing veining at Wumpo nearDawei, later developed as the Egani mine. O'Riley (1862) dis-covered the Mawchi Mine by tracing cassiterite gravels upstreamof the Kemapyu Chaung river. Between 1888 and 1892 a sys-tematic exploration of the Dawei and Myeik tin districts was un-dertaken under the auspices of the Indian Geological Survey(Hughes, 1889). This survey work was later expanded, most no-tably under the stewardship of John Coggin Brown, with a parti-cular focus on the geology and mineralization of the Dawei district(Coggin Brown, 1918; Coggin Brown and Heron, 1923).
Under British control, the early 20th century showed an upturnand major industrialization of the Burmese mining industry, andthe tin districts did not escape attention. Major tin and tungstenmines were developed during this time largely producing for ex-port. Myanmar was an important producer of tungsten, a strategicwar material, during World War I – principally supplied by theMawchi Mine. Much of colonial Burma was surrendered to theJapanese during the Second World War. The Japanese operatedsome of the major mines during the period 1942–44 (e.g. Mawchi,the Bawdwin Pb–Zn–Ag mine). However the Allies, now includingthe Burmese Army (General Aung San aligned with the British aspart of a pact for post-war independence), reoccupied Burma in1944–45.
The immediate post-independence Burma saw a continuationof production and export of a range of commodities, including tinand tungsten. However, in 1962, General Ne Win led a militarycoup entrenching the rule of the Burmese army. A significant re-form was the launch of the “Burmese Way to Socialism”, whichpursued the full nationalization of the Burmese economy and apolicy of economic isolation from the rest of the World. The eco-nomic effects of this nationalization were profound: many com-modities only became available on the black market. By 1967 acountry that once was the largest exporter or rice was unable tofeed itself. As part of this act, all mines within Burma were broughtunder government control. This period in effect started the longdecline of the mining industry and the slide into the largely arti-sanal operations seen today.
In 1988 Myanmar passed foreign investment legislation al-lowing external financial and technological investment intocountry. Since then, and in contrast to the minerals industry, theoil and gas sector has seen significant overseas investment. Amajor foreign player has been the French oil company Total, whohave operated a number of offshore oil and gas installations, in-cluding the controversial Yadana gas pipeline, carrying gas fromthe Andaman sea into Thailand.
In 1994 a new Mining Law was put into place, repealing severalcolonial-era and post-independence pieces of legislation. The newlaw allowed prospecting, exploration and the granting of produc-tion permits.
4.4. The current industry
4.4.1. Challenges in sourcing tin production statisticsReliable tin mine production figures for Myanmar from the
mid-20th century to present are difficult to ascertain, a problemthat is endemic across the tin industry. The large amount of tinsourced from artisanal and state producers makes estimating tin
Table 2Recent tin and tungsten production in Myanmar (Mt). Source: USGS.
2008 2009 2010 2011 2012
Tin, mine output, Sn contenta,b
Of tin ores and concentrates 800 1000 4000 11000 10600Metal, refined 30 30 30 30 30TOTAL 830 1030 4030 11030 10630
Tungsten, mine output, W content:c
Of tungsten concentrate 5 4 2 n/a n/aOf tin-tungsten concentrate 131 83 161 140 140TOTAL 136 87 163 140 140
a Production of tin, mine output, Sn content production as reported by theGovernment was, in metric tons, 2008—499; 2009—518; 2010—374; 2011—350, and2012—350 (estimated).
b Data compiled from the United Nations Comtrade database for tin ores andconcentrates imported from Burma by China, Malaysia, and Thailand.
c Data are for the production by the state-owned mining enterprises under theMinistry of Mines.
N.J. Gardiner et al. / Resources Policy 46 (2015) 219–233 225
production very difficult, and the most reliable global figurescompiled for tin mining are provided by the USGS (e.g., UnitedStates Geological Survey (USGS), 1994; 2014; 2015) and ITRI (e.g.,Kettle et al., 2014b). Even for the USGS and ITRI, compiling figuresis challenging. At a global level, ITRI believes only three major tinproducing countries publish reliable government data on tinmining and smelting: Bolivia, Peru and Malaysia (P. Kettle, Perso-nal communication, 2015). Of the major tin producing countries,Australia produces the most reliable data, where industry-re-ported figures can be verified against those produced by theAustralian government's Office of the Chief Economist.
China has historically had two sources of government data forits tin mining activity: the China Nonferrous Metals Industry As-sociation (CNIA) and the National Bureau of Statistics (NBS). Nei-ther is considered reliable by ITRI, and further in 2013 CNIA ceasedpublishing statistics. ITRI therefore has to supplement NBS data onthe Chinese tin industry with more reliable global trade statisticsand local expert sources, maintaining an office in Beijing to ac-complish this (P. Kettle, Personal communication, 2015).
For the key tin producing regions of Indonesia and CentralAfrica a similar approach combining unreliable government data,with more reliable trade statistics and expert local knowledge isalso required. However, data collection in Central Africa has im-proved dramatically in recent years, as a by-product of the ITRI TinSupply Chain Initiative (iTSCI), which involves physically trackingsources of tin in the region.
These data cover most of the world tin mine and smelter pro-duction, however to ensure full global coverage ITRI uses theWorld Bureau of Metal Statistics alongside local expert knowledgeto collate data on minor tin producing countries. In its use of localexperts, ITRI is substantially assisted by its member companies,many of which are based in the most data-poor countries such asIndonesia and China. Nonetheless, ITRI believes production esti-mates from the key country of Indonesia to be amongst the leastreliable (P. Kettle, Personal communication, 2015). The problem isnow repeated in the key emerging tin mining country of Myanmar,where once again ITRI has to supplement unreliable governmentstatistics with more reliable trade statistics and expert localknowledge. As a result the three largest tin mining countries(China, Indonesia and Myanmar) accounting for nearly three-quarters of tin production are also the three with perhaps the leastreliable data available.
Nonetheless, some data, even unreliable data (a “known un-known”), is better than no data at all (an “unknown unknown”).Thus, taking note of the above comments, recent production fig-ures, have been estimated by both the USGS (Table 2), and by ITRI(Table 1).
4.4.2. Observations on tin mining in Myanmar based on field visitsMyanmar has the long-term potential to be a major producer of
tin, and therefore efforts are underway to better understand anddocument its domestic industry. In the absence of reliable gov-ernment and company information, local expertize remains themain source of information, and therefore in order to source suchinformation field visits are essential to make contact with localexperts and verify information (e.g. Gardiner (2015)). Below aresome of the observations made by field visits to Myanmar by ITRIrepresentatives and one of the paper authors (NJG).
Tin mining in Myanmar tends to be a seasonal activity, sincewater required for processing is in short supply by the end of thedry season (early April), and in excess during the summer rainyseason – flooding underground workings, and making alluvialexcavation impossible (Gardiner, 2015; Kettle et al., 2014a). Hence,tin production and concentration is often only operated eightmonths of the year, with the remaining four months as eitherdown-time or stockpiling. This is not helped by a lack of physical
and communications infrastructure.At present, there is no large-scale smelting facility within
Myanmar, and tin concentrate has to be exported to Thailand,Malaysia or China. The country does have a state-owned smelter inYangon, which has operated intermittently in recent years (ITRI,2014a). Indonesia's state-owned, and biggest, tin miner PT Timahwas planning construction of a smelter in southern Myanmarduring 2015, but this project was terminated in late 2014 (ITRI,2014b). The Ministry of Mines has invited expressions of interestfrom private sector firms to establish smelting and refining plantsin the country.
Small-scale miners in particular suffer from rudimentary pro-cessing facilities that usually produce poor quality concentrate(Gardiner, 2015; Kettle et al., 2014a). The grade of tin concentrateis often inadequate for direct export to regional smelting facilities.Further, the tungsten richness in some of the primary depositsserves to contaminate the tin concentrate. There are reports ofmagnetic separation plants being operated in tin districts tocleanup the concentrate. If properly extracted, tungsten provides avaluable by-product to the tin.
4.5. The competitiveness of Myanmar tin production
Despite the basic mining processes described above, the factthat tin mine production from Myanmar is expanding rapidly,even during a period of falling prices, suggests it has a verycompetitive cost position towards the bottom of the cost curve.Production in this part of the cost curve would secure generouseconomic rents, sufficient to pay back any capital invested, even ina declining price environment. Though no solid production costestimates exist for the Myanmar mine production due to the lackof information on the region and the newness of the operations,estimates of production costs for analogous artisanal productionfor high grade deposits in a developing world setting exist for theDRC, derived via the ITRI Tin Supply Chain Initiative (iTSCI). Here itis estimated the artisanal miners are paid around US$5 to US$6 perkilo of cassiterite (Kettle et al., 2015c). Pure cassiterite wouldcontain 79% tin, so assuming clean ore and full recovery; the ap-proximate cost per tonne of tin in pure cassiterite ore (at this stageeffectively a concentrate) would be around US$6500 /t to US$7500 /t. Assumedly the artisanal miners' costs would have to beless than this, otherwise it would not be worth mining. In additionto the fee paid for cassiterite ore by local traders, there would alsobe smelting costs, some transport costs (usually overseas in thecase of Central Africa), and potentially local taxes and fees, to-gether adding a few thousand dollars per tonne of further costs.
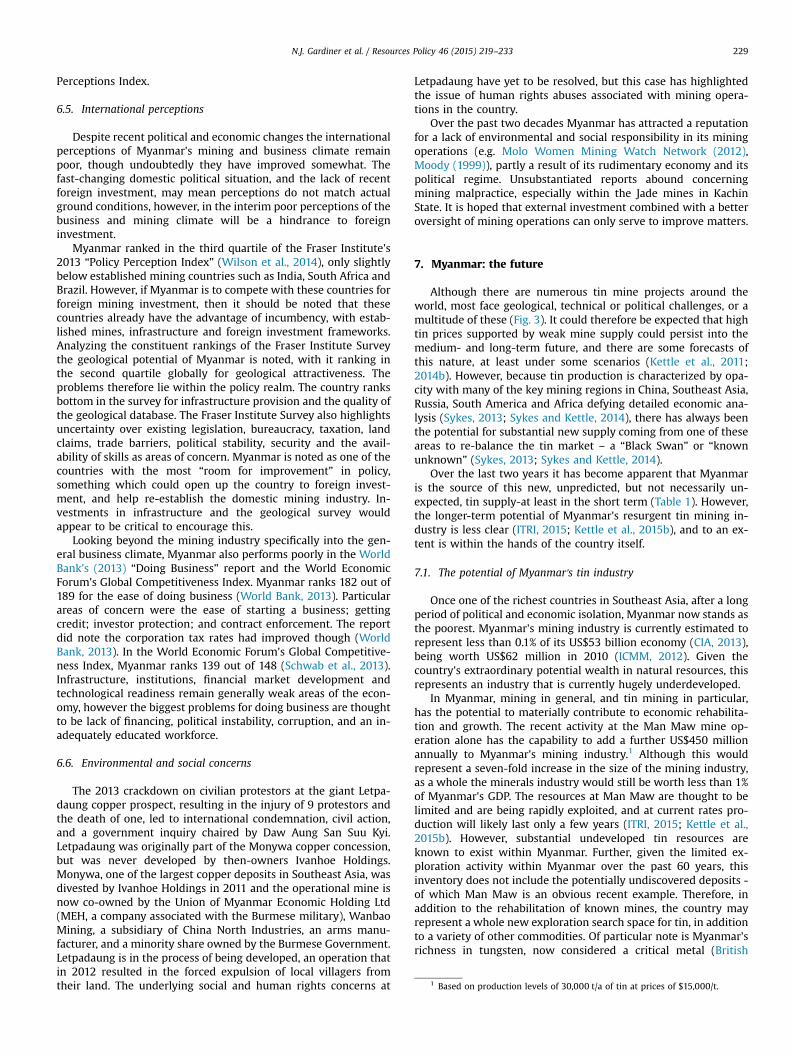
Fig. 5. Tin mining industry cost curve for 2013 provided by ITRI (Kettle et al.,2014b), showing the cost positions of the major tin miners China and Indonesia.Indonesia is the marginal cost producer in the industry. Annual tin mine produc-tion is about 300,000 t.
N.J. Gardiner et al. / Resources Policy 46 (2015) 219–233226
However, it is plausible that total costs would remain below US$10,000/t. Again, it seems plausible that the production from Wastate in Myanmar would be in a similarly competitive cost positioncompared to current tin prices.
The new tin production from Myanmar is therefore likely to beat least partly responsible for the price decline itself. New supplycan send a market into surplus, or at least reduce a market deficit;however, the position of the new supply on the cost curve is themain determinant of how much downward pressure is put onprices. If the new supply is marginal in cost, sitting at the end ofthe cost curve, the price response can be minimal, as any price fallswould make the new supply uncompetitive and remove thissupply from the market, creating a shortage of supply again,leading to increased prices, thus encouraging the new supply tocome back on-stream. The market is self-correcting in this situa-tion. However, if the new supply comes on stream in a lower partof the cost curve, then the more expensive, marginal supply at thetop end of the cost curve is no longer required. Prices will fall andthis uncompetitive supply will be removed from the market. Themore the new low cost supply expands, the more marginal supplyis removed from the market and greater the price fall. Dependenton the structure of the cost curve these price falls can be of varyinglevels. A flat cost curve suggests there is little scope for substantialprice falls, and generally leads to more stable prices. However, asteep or stepped cost curve can lead to substantial prices falls. Ifthe new low cost supply is maintained over the long term it canlead to a structural change in industry costs and thus long termprices, rather than the merely cyclical effects of removing andadding marginal cost supply.
Fig. 5 shows a cost curve for the tin mining industry in 2013taken from Kettle et al. (2014b). The figure demonstrates that In-donesian production, both artisanal and state, makes up the ma-jority of the marginal end of the cost curve, largely dominating themost expensive third of the cost curve. This is a result of the sub-stantial cost inflation within the Indonesian tin mining industryover the last decade, and described earlier in this paper. The 2013tin mine cost curve of the most recent of this kind in the publicdomain and suggests 90th percentile costs of around US$20,000/tand costs of about US$17,000/t at the beginning of the 4th quartile.The cost profile of the tin mining industry is not quite this clearthough and some changes have occurred since 2013. First, each ofthe segments of the cost curve for Indonesia, represent a type of tinmine production, not a single mine site; for example: “artisanalgravel pumps”, “artisanal suction boats”, “state bucket ladderdredges”, or “state cutter suction dredges”. Though each of thesegments has certain cost characteristics, because they are amal-gamations of operations there is some variability of costs withineach of these segments dependent on the geological quality ofdeposits and technical ability of various mining operations. The costfor each segment is more like a typical cost, with some operationslikely more expensive and some cheaper. As such each of the stepsshould be seen as a “soft floor” in providing resistance to prices falls,rather than a “hard floor”. As prices fall, a whole segment of pro-duction may come under economic strain, however within thissegment only the most expensive operations will close, whilst thecheaper operations will remain competitive. Secondly since 2013,there has been substantial fall in oil prices, which may have assistedthe state and private producers, who use unsubsidized diesel fuel,in lowering production costs by several thousand dollars per tonneof tin produced (artisanal miners saw the prices falls mitigated bythe end of fuel subsidies in Indonesia), making the floor slightlylower in 2015. Finally, since 2013, exchange rate movements havebeen to the advantage of Indonesian miners, reducing costs onaverage by around US$1000/t (T. Mulqueen, Personal communica-tion, 2015). Recent estimates from ITRI (published in May 2015),suggest that the 90th percentile is now around US$16,000/t and the
fourth quartile begins at about US$13,000/t (Kettle et al., 2015b).If the new production fromMyanmar, making up around 10% of
global mine supply is produced at less than $10,000/t, and thus sitsin a lower part of the cost curve, then this new supply will putsubstantial pressure on the marginal production in the industry,above the 90th percentile of the cost curve – mainly production inIndonesia, which apparently is no longer required by the market.Indeed prices do seem to have dropped to the estimated 90thpercentile floor level of around US$16,000/t and there are certainlyproblems in maintaining profitability in Indonesian tin mining(Kettle et al., 2015a; 2015b; 2015c). If the low cost production fromMyanmar is maintained this has the potential to re-shape the in-dustry cost curve, leading to longer-term lower tin prices, and areduced scale Indonesian industry. This of course, assumes thatthe new Myanmar production can be maintained over the longterm, and that the Indonesia industry is unable to re-structure itscost base – neither is a certain factor. The next sections of thispaper therefore discuss the scope for Myanmar maintaining thislow cost new tin supply over the long term.
4.6. Myanmar exploration activity and potential
The current industry still relies on antiquated geologic data(Kettle et al., 2014a). By 1995 it was estimated that only 51% ofMyanmar had been geologically mapped, largely on a 1 in. to1 mile scale (e.g. Moody (1999)). Resource estimations and gradesare imprecise, there being no mandated JORC-style reporting codeequivalent operating within Myanmar, and units can be confusing,often mixing obsolete imperial units with metric ones. Myanmaralso suffers from a lack of reliable assaying and analytical facilities,and most systematic minerals explorers export samples for routineanalysis.
Over the past few decades, several international missions toMyanmar have had a broad aim of identifying potential explora-tion and production targets. Of note are the United Nations mis-sions in the late 1960s to early 1970s, a German geological missionin the late 1970s, and an Australian initiative run by the Australian

N.J. Gardiner et al. / Resources Policy 46 (2015) 219–233 227
Development Assistance Bureau in the 1980s. Recent private mi-nerals exploration peaked in the mid-1990s with a flurry of ac-tivity largely driven by Australian juniors. However, this activitywas extinguished by the Asian crisis of the late 1990s. Since theopening up of the country in 2011, there has been renewed in-terest from foreign companies, albeit again largely Australian ju-niors (ITRI, 2013). The Department of Geological Survey and Mi-neral Exploration is seeking to improve its geological database andencourage exploration (Saw Lwin, 2012). However the uncertaintyover the Mining Act and the upcoming 2015 election is affectingpositive investment.
5. Myanmar – the Black Swan?
In 2013–2014, ITRI estimates imply that Myanmar emerged asthe World's third largest tin producer (Fig. 6A), a potentially sig-nificant breakthrough and one that surprised industry analysts.Although these are estimates-official production figures tend to beunreliable, and are based upon smelting quantities-they never-theless imply a significant upturn in Myanmar tin production, withsome 4900% increase over a 5-year period (Table 1). ITRI figuresfor Chinese tin concentration imports paint a similar picture(Fig. 6B), suggesting a significant uptick in imports from Myanmarthat help underpin the data.
Analysis has suggested that the bulk of this new production is notsourced from the traditional tin-production regions in southernMyanmar, but instead from an emerging mining area, the Man Mawmining district, situated in Wa State, an autonomous region in thenorthern Shan States (Gardiner and Sykes, 2015; Kettle et al., 2014a).
a
b
Fig. 6. A: Estimated Myanmar tin in concentrate production 2009–2014. Figures:ITRI. B: Estimated tin ores and concentrates (gross weight) imports into China2010–2014 split between Myanmar and rest of world. Source: ITRI.
5.1. Wa State and the Man Maw mining district
The Wa State is an autonomous state in the northern ShanStates, one that is not recognized by either the Myanmar Gov-ernment nor international bodies. It is currently subsumed underthe Wa Special Region No. 2. Fig. 7 shows a map of Wa State. WaState is occupied and administered by the United Wa State Army(UWSA), and has an estimated population of ca. 560,000. The Wapeople are ethnic Chinese, the working language is Chinese, andthe Renminbi is used as a currency. The UWSA effectively runs Waas an independent state, with its own foreign policy, and withdirect business dealings with China. As such, it is probable thatmost revenues from the tin mining activities go straight to the Wagovernment, largely by-passing the central Myanmar government.
The Man Maw Mine site is thought to lie ca. 90 km from PangKham, the capital of Wa State (Fig. 7). It has been estimated that themine site area has an extent of some 100 km2, making it a significantmine within Myanmar (Cui Lin, Personal communication, 2015). Al-though a single mining area, it is worked by a number of smallmining companies. The deposit is reported to be exclusively primaryore, grading 1–2% for the open pit operations and up to 40% for theunderground. Annual production has been estimated to reach nearly30,000 t of contained tin. Most of this production goes over theborder into China, either as crushed ore (typically grading at 10% Sn),or as semi-processed concentrate (20–25% Sn).
The future of tin production at Man Maw remains uncertain. Itis believed that tin mining in Wa State became active in 2010, butno official figures are available. There is little geological dataavailable, and consequently neither the remaining reserves, northe mine life expectancy, are known. Local facilities remain poorand roads are in a bad condition, however it is reported that somerepair work is being undertaken, and that a new power station isplanned. Further, at the time of writing (summer 2015), localfighting in the area has disrupted production.
6. The Myanmar business environment
At present the Burmese government in Nay Pyi Daw remains incontrol of much of the mining industry, a legacy of the mass na-tionalization in the 1960s. The Myanmar Ministry of Mines No.2 Mining Enterprise is the government body that oversees tin andrelated commodities.
6.1. The Mining Act and the production sharing contract
The current mining law (Myanmar Mines Law, 1994) is cur-rently in revision, and has been so for the past two years. One ofthe biggest issues with the current legislation, at least from theperspective of foreign investment, has been the Production Shar-ing Contract (PSC) agreement. This incorporates an agreementbetween the mining party and the Ministry of Mines, and, underthis scheme, the Ministry acts as a non-equity partner entitled tosome 32% of minerals extracted, or cash equivalent (althoughin some cases the exact percentage may be negotiable). In manyinstances the demands of the PSC is seen as over-punitive, ren-dering many projects uneconomic.
Other issues, for example the enshrinement of tenure, andsimple conversion of exploration to production licenses, are be-lieved to be addressed in the new mining law. This revision has,however, been anticipated for some time, and it remains unclearhow much of the 1994 law will be overhauled. It is probable thatthe scheduled elections in November 2015 will further delay therevision, and this has created some uncertainty in the foreign in-vestment climate.

Fig. 7. Map of Wa State. The location of the Man Maw mine site is thought to be some 90 km north or west of Pang Kham.
N.J. Gardiner et al. / Resources Policy 46 (2015) 219–233228
6.2. International sanctions and exporting
In 2012 economic sanctions against Myanmar were temporarilylifted by the United States, the European Union, Australia, Canadaand Japan. Limited sanctions remain, and although variable, ingeneral exclude direct business involvement with the military,government or identified associates. The temporary lifting ofsanctions was in response to perceived reforms by the governmentof U Thein Sein, and followed the 2010 release of Daw Aung SanSuu Kyi from house arrest.
6.3. Myanmar currency
The official currency of Myanmar, the Kyat, was moved from a“dual” fixed rate system to a managed floating rate in late 2012.
Previously, an official rate fixed at 6.4 MMK:USD was used forgovernment transactions, while unofficially the currency wasusually worth 800–1000 MMK:USD.
6.4. Transparency
In 2012 as part of the government reforms, Myanmar statedtheir plans to join the Extractive Industries Transparency Initiative(EITI), with an aim to improve transparency and accountability inits natural resources industry. The EITI is a global standard topromote open and accountable management of natural resources.In July 2014 Myanmar was formally accepted as an EITI “candidatecountry”. It has until 2016 to produce its first EITI report and beaccepted as a full member country. However, Myanmar performspoorly on the Transparency International (2013) Corruption
1 Based on production levels of 30,000 t/a of tin at prices of $15,000/t.
N.J. Gardiner et al. / Resources Policy 46 (2015) 219–233 229
Perceptions Index.
6.5. International perceptions
Despite recent political and economic changes the internationalperceptions of Myanmar's mining and business climate remainpoor, though undoubtedly they have improved somewhat. Thefast-changing domestic political situation, and the lack of recentforeign investment, may mean perceptions do not match actualground conditions, however, in the interim poor perceptions of thebusiness and mining climate will be a hindrance to foreigninvestment.
Myanmar ranked in the third quartile of the Fraser Institute's2013 “Policy Perception Index” (Wilson et al., 2014), only slightlybelow established mining countries such as India, South Africa andBrazil. However, if Myanmar is to compete with these countries forforeign mining investment, then it should be noted that thesecountries already have the advantage of incumbency, with estab-lished mines, infrastructure and foreign investment frameworks.Analyzing the constituent rankings of the Fraser Institute Surveythe geological potential of Myanmar is noted, with it ranking inthe second quartile globally for geological attractiveness. Theproblems therefore lie within the policy realm. The country ranksbottom in the survey for infrastructure provision and the quality ofthe geological database. The Fraser Institute Survey also highlightsuncertainty over existing legislation, bureaucracy, taxation, landclaims, trade barriers, political stability, security and the avail-ability of skills as areas of concern. Myanmar is noted as one of thecountries with the most “room for improvement” in policy,something which could open up the country to foreign invest-ment, and help re-establish the domestic mining industry. In-vestments in infrastructure and the geological survey wouldappear to be critical to encourage this.
Looking beyond the mining industry specifically into the gen-eral business climate, Myanmar also performs poorly in the WorldBank's (2013) “Doing Business” report and the World EconomicForum's Global Competitiveness Index. Myanmar ranks 182 out of189 for the ease of doing business (World Bank, 2013). Particularareas of concern were the ease of starting a business; gettingcredit; investor protection; and contract enforcement. The reportdid note the corporation tax rates had improved though (WorldBank, 2013). In the World Economic Forum's Global Competitive-ness Index, Myanmar ranks 139 out of 148 (Schwab et al., 2013).Infrastructure, institutions, financial market development andtechnological readiness remain generally weak areas of the econ-omy, however the biggest problems for doing business are thoughtto be lack of financing, political instability, corruption, and an in-adequately educated workforce.
6.6. Environmental and social concerns
The 2013 crackdown on civilian protestors at the giant Letpa-daung copper prospect, resulting in the injury of 9 protestors andthe death of one, led to international condemnation, civil action,and a government inquiry chaired by Daw Aung San Suu Kyi.Letpadaung was originally part of the Monywa copper concession,but was never developed by then-owners Ivanhoe Holdings.Monywa, one of the largest copper deposits in Southeast Asia, wasdivested by Ivanhoe Holdings in 2011 and the operational mine isnow co-owned by the Union of Myanmar Economic Holding Ltd(MEH, a company associated with the Burmese military), WanbaoMining, a subsidiary of China North Industries, an arms manu-facturer, and a minority share owned by the Burmese Government.Letpadaung is in the process of being developed, an operation thatin 2012 resulted in the forced expulsion of local villagers fromtheir land. The underlying social and human rights concerns at
Letpadaung have yet to be resolved, but this case has highlightedthe issue of human rights abuses associated with mining opera-tions in the country.
Over the past two decades Myanmar has attracted a reputationfor a lack of environmental and social responsibility in its miningoperations (e.g. Molo Women Mining Watch Network (2012),Moody (1999)), partly a result of its rudimentary economy and itspolitical regime. Unsubstantiated reports abound concerningmining malpractice, especially within the Jade mines in KachinState. It is hoped that external investment combined with a betteroversight of mining operations can only serve to improve matters.
7. Myanmar: the future
Although there are numerous tin mine projects around theworld, most face geological, technical or political challenges, or amultitude of these (Fig. 3). It could therefore be expected that hightin prices supported by weak mine supply could persist into themedium- and long-term future, and there are some forecasts ofthis nature, at least under some scenarios (Kettle et al., 2011;2014b). However, because tin production is characterized by opa-city with many of the key mining regions in China, Southeast Asia,Russia, South America and Africa defying detailed economic ana-lysis (Sykes, 2013; Sykes and Kettle, 2014), there has always beenthe potential for substantial new supply coming from one of theseareas to re-balance the tin market – a “Black Swan” or “knownunknown” (Sykes, 2013; Sykes and Kettle, 2014).
Over the last two years it has become apparent that Myanmaris the source of this new, unpredicted, but not necessarily un-expected, tin supply-at least in the short term (Table 1). However,the longer-term potential of Myanmar's resurgent tin mining in-dustry is less clear (ITRI, 2015; Kettle et al., 2015b), and to an ex-tent is within the hands of the country itself.
7.1. The potential of Myanmar's tin industry
Once one of the richest countries in Southeast Asia, after a longperiod of political and economic isolation, Myanmar now stands asthe poorest. Myanmar's mining industry is currently estimated torepresent less than 0.1% of its US$53 billion economy (CIA, 2013),being worth US$62 million in 2010 (ICMM, 2012). Given thecountry's extraordinary potential wealth in natural resources, thisrepresents an industry that is currently hugely underdeveloped.
In Myanmar, mining in general, and tin mining in particular,has the potential to materially contribute to economic rehabilita-tion and growth. The recent activity at the Man Maw mine op-eration alone has the capability to add a further US$450 millionannually to Myanmar's mining industry.1 Although this wouldrepresent a seven-fold increase in the size of the mining industry,as a whole the minerals industry would still be worth less than 1%of Myanmar's GDP. The resources at Man Maw are thought to belimited and are being rapidly exploited, and at current rates pro-duction will likely last only a few years (ITRI, 2015; Kettle et al.,2015b). However, substantial undeveloped tin resources areknown to exist within Myanmar. Further, given the limited ex-ploration activity within Myanmar over the past 60 years, thisinventory does not include the potentially undiscovered deposits -of which Man Maw is an obvious recent example. Therefore, inaddition to the rehabilitation of known mines, the country mayrepresent a whole new exploration search space for tin, in additionto a variety of other commodities. Of particular note is Myanmar'srichness in tungsten, now considered a critical metal (British

Table
3ATh
elargestmines
per
commod
ityba
sedon
estimated
annual
grossreve
nues.Th
istabledem
onstratesthat
itis
not
plausibleforMya
nmar
tobu
ilditsecon
omyen
tirely
ongrow
thin
tinmining,
asthesemines
aretypically
econ
omically
very
small.Th
eco
untrywill
nee
dto
diversify
into
other
bulk
andba
seco
mmod
itiesto
dev
elop
itsecon
omyviamining.
Annual
grossreve
nues
arecalculatedba
sedon
2013
commod
itypricesprovided
bytheUSG
S(A
nderson,2
015;
Bray,20
15;Brininstoo
l,20
15;Geo
rge,
2015
;Kuck
,201
5;To
lcin,2
015;
Tuck
,201
5)multiplie
dby
approximatean
nual
productionof
thelargestmineforthat
commod
ity,usingdatafrom
compan
yan
dindep
enden
tsources
(Norils
kNicke
l,20
14).
Commodity
Commod
ityPrice-20
13(U
S$/t)
Larg
estMine
2013
Annual
Pro
duction(K
t)20
13Sh
areofGlobal
Pro
-duction(%
)20
13Es
timated
Gro
ssRev
-en
ues
(US$
B)
Source
Cop
per
7326
Esco
ndida,
Chile
,BHPBilliton
þothers
1200
78.8
Brininstoo
l,20
15;CRU
Iron
Ore
7326
Yandi,Australia
,BHPBilliton
71000
27.4
Tuck
,201
5;CRU
Gold
4549
3241
Muruntau,U
zbek
istan,N
avoi
MMC(estim
ate)
0.07
53
3.4
Geo
rge,
2015
;CRU
Nicke
l16
863
PolarDivision,R
ussia,N
orils
kNicke
l12
35
2.1
Kuck
,201
5;Norils
kNicke
l,20
14;
CRU
Zinc
1909
Ram
pura
Agu
cha,
India,V
edan
taRe
sources
(Hindustan
Zinc)
730
51.4
Tolcin,2
015;
CRU
Bau
xite
27Weipa,
Australia
,Rio
Tinto
2630
09
0.7
Bray,
2015
;CRU
Lead
2143
Can
nington
,Australia
,BHPBilliton
(now
South32
)22
04
0.5
Tolcin,2
015;
CRU
Tin
2209
0Sa
nRafae
l,Pe
ru,M
insu
r23
.78
0.5
Anderson,2
015;
ITRI
N.J. Gardiner et al. / Resources Policy 46 (2015) 219–233230
Geological Survey (BGS), 2012). It therefore seems plausible thatdespite the high political risk, which appears to be declining,Myanmar retains the potential for a significant future role in thetin industry.
7.2. Economic development via tin mining in Myanmar
The small amounts of value created from a single newly-de-veloped tin mine highlights the problem of developing an econ-omy through mining, and exacerbating the so-called “resourcecurse” (e.g., Collier (2007, 2010)). A definition of “careful ex-ploitation” may therefore incorporate an ultimate aim to replacesuch depletable sub-soil assets with more sustainable and valuableassets, particularly human capital and physical infrastructure, withlonger-term positive growth potential. Collier (2010) suggested afour-part process for how a country might turn its mineral richesinto economic wealth, discussed below.
Firstly, discovery of natural assets involves exploration con-ducted to reveal as much as possible of the nation's non-renew-able resource wealth, and allows a government a better appre-ciation of the value of its sub-soil assets. Such discovery en-courages foreign investment and helps rebalance the knowledgeasymmetry that developing nations often suffer from when ne-gotiating with a more astute foreign investor. This requires prop-erly trained and equipped geological surveys. In Myanmar there isa significant lack of properly trained local geologists with up-to-date search knowledge and technology within the country. Anyeffectively trained Burmese geologist is usually trained abroad,and then often stays abroad.
Capturing natural asset economic rents by the governmentrequires appropriate taxation and support systems to be in placeto ensure the government receives its fair share of the non-re-newable resource revenues. Here, transparency is a priority, andschemes such as EITI discussed earlier will help. Issues sur-rounding sovereignty of central government, an issue currentlywithin Myanmar as it grapples with its Union, obviously has animpact on central revenues.
Saving of the mining revenues by government requires thatnon-renewable resource revenues should largely be saved, ratherthan consumed, to create a national endowment. Norway is theglobal case study in this instance.
Finally, commitment to investment focused on long-term non-minerals-related growth requires appropriate mechanisms to be inplace to ensure the revenues are spent on sustainable assets uponwhich the economy can be built and grow, such as developinghuman capital and physical infrastructure.
Undoubtedly not all of the tin, or indeed other mineral re-sources, have yet been discovered in Myanmar, and thus ideallythe country needs assistance to allow it to better understand itsdomestic geology and metals potential. The history of geologicalmissions operating within Myanmar has served to help improvethis knowledge. However, even if further mineral discoveries aremade, the country is perceived to have high political risk (Schwabet al., 2013; Transparency International, 2013; World Bank, 2013),which operates to reduce commodity unit value, and thereforetotal economic size of any resources discovered (as higher dis-count rates are applied in discounted cash flow calculations, forexample). To mitigate this risk, it is therefore key that Myanmarstarts to generate larger revenues from mining for a number ofreasons. Such activity develops trust in a mining sector partiallyfunded by foreign investors; it develops the capacity of the gov-ernment to effectively regulate the sector; and it contributes largertax revenues, which can contribute towards economic develop-ment in Myanmar.
With respect to building a much larger mining industry inMyanmar, tin represents a good starting point. Placer tin mines are
N.J. Gardiner et al. / Resources Policy 46 (2015) 219–233 231
capital light and quick to develop, tin is (generally) metallurgicallysimple to process, and Myanmar is geographically well-placedclose to the world's large custom tin smelters in Thailand, Malaysiaand China, meaning construction of expensive domestic down-stream facilities are not yet required. The shorter developmenttimeframe for placer tin mines would mean that capital is re-turned quickly in comparison to the timeframes normally ex-pected in primary mining, which can be several years or decades(Kettle et al., 2014c). All this helps mitigate the impact of long-term exposure to high political risk and provides revenues to thegovernment in a timelier manner.
The likely next stage of developing the country's hard rock tinresources is also relatively simple compared to many of the otherhard rock resources in other mineral sectors, since even a largeprimary tin mine is relatively small compared to other commod-ities. The world's largest tin mine, San Rafael, an undergroundoperation, can process only around one million tonnes of ore peryear (Pareja, 2011), whilst the world's largest underground coppermine, El Teniente, can process around fifty times that amount(Codelco, 2011). Similarly, the processing and smelting technologyfor tin in oxide form is relatively straightforward for the mostamenable deposits (ITRI, 2012b; Smith, 1996).
Ultimately, however, tin mining can never provide large en-ough revenues upon which to build an economy, as it can supportneither big enough mines nor a large enough number of mines inone country. Even world-class tin mines such as San Rafael onlygenerate a few hundred million dollars of revenues per year, muchof which is then absorbed by operating and capital costs, leavingmuch less for tax revenues, as demonstrated in Table 3A and B.The largest bulk commodity and base metal mines (e.g., in copperand nickel) generate billions of dollars of revenues per year.Myanmar will therefore need to develop larger mines in largercommodity markets, such as base metals and bulk commodities;to build its economy on mining (Table 3A and B).
Thus, whilst the size of tin mines suggests that the countrycannot be developed on the back of the tin industry alone, thesimplicity of tin mining suggests that the tin industry could cat-alyze the development of a larger and more diversified miningindustry, to the benefit of an improved national economy.
7.3. The potential for mining in Myanmar beyond tin
Myanmar contains substantial undeveloped and undoubtedlyundiscovered resources of a range of other commodities (e.g.Gardiner et al. (2014)). A number of these commodities are ge-netically linked to tin, the most important of these being tungsten.There is therefore potential in Myanmar for diversification into
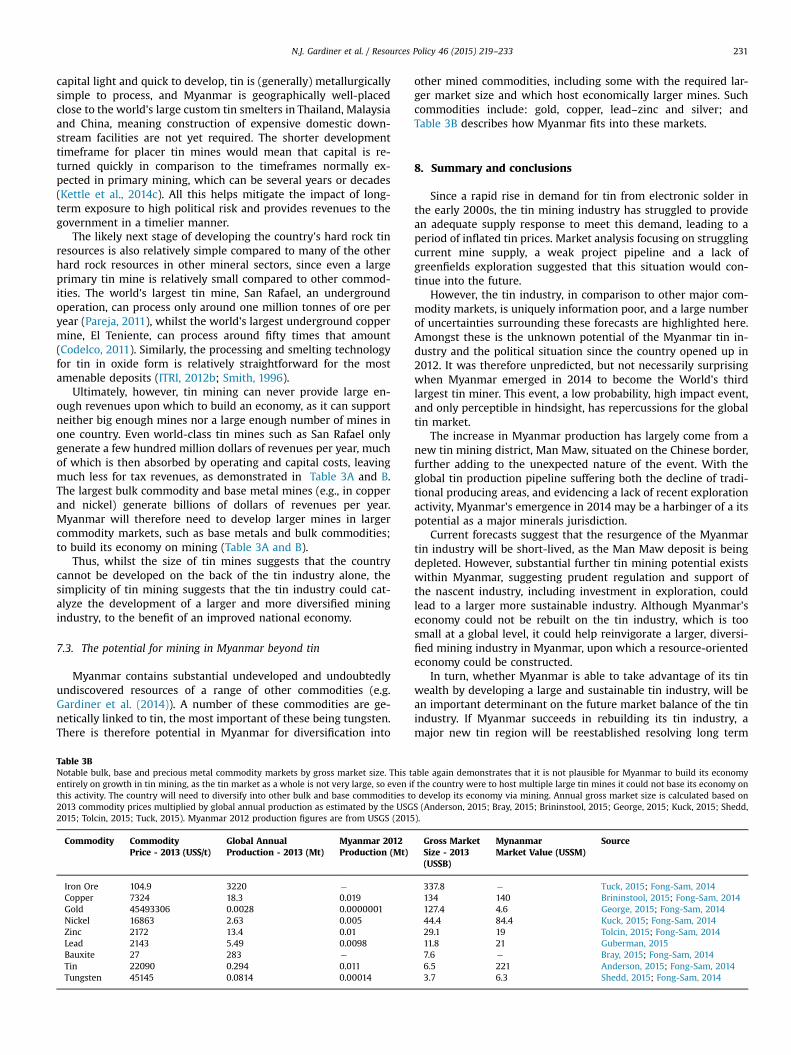
Table 3BNotable bulk, base and precious metal commodity markets by gross market size. This tentirely on growth in tin mining, as the tin market as a whole is not very large, so even ithis activity. The country will need to diversify into other bulk and base commodities to2013 commodity prices multiplied by global annual production as estimated by the USG2015; Tolcin, 2015; Tuck, 2015). Myanmar 2012 production figures are from USGS (2015
Commodity CommodityPrice - 2013 (US$/t)
Global AnnualProduction - 2013 (Mt)
Myanmar 2012Production (Mt)
Iron Ore 104.9 3220 �Copper 7324 18.3 0.019Gold 45493306 0.0028 0.0000001Nickel 16863 2.63 0.005Zinc 2172 13.4 0.01Lead 2143 5.49 0.0098Bauxite 27 283 �Tin 22090 0.294 0.011Tungsten 45145 0.0814 0.00014
other mined commodities, including some with the required lar-ger market size and which host economically larger mines. Suchcommodities include: gold, copper, lead–zinc and silver; andTable 3B describes how Myanmar fits into these markets.
8. Summary and conclusions
Since a rapid rise in demand for tin from electronic solder inthe early 2000s, the tin mining industry has struggled to providean adequate supply response to meet this demand, leading to aperiod of inflated tin prices. Market analysis focusing on strugglingcurrent mine supply, a weak project pipeline and a lack ofgreenfields exploration suggested that this situation would con-tinue into the future.
However, the tin industry, in comparison to other major com-modity markets, is uniquely information poor, and a large numberof uncertainties surrounding these forecasts are highlighted here.Amongst these is the unknown potential of the Myanmar tin in-dustry and the political situation since the country opened up in2012. It was therefore unpredicted, but not necessarily surprisingwhen Myanmar emerged in 2014 to become the World's thirdlargest tin miner. This event, a low probability, high impact event,and only perceptible in hindsight, has repercussions for the globaltin market.
The increase in Myanmar production has largely come from anew tin mining district, Man Maw, situated on the Chinese border,further adding to the unexpected nature of the event. With theglobal tin production pipeline suffering both the decline of tradi-tional producing areas, and evidencing a lack of recent explorationactivity, Myanmar's emergence in 2014 may be a harbinger of a itspotential as a major minerals jurisdiction.
Current forecasts suggest that the resurgence of the Myanmartin industry will be short-lived, as the Man Maw deposit is beingdepleted. However, substantial further tin mining potential existswithin Myanmar, suggesting prudent regulation and support ofthe nascent industry, including investment in exploration, couldlead to a larger more sustainable industry. Although Myanmar'seconomy could not be rebuilt on the tin industry, which is toosmall at a global level, it could help reinvigorate a larger, diversi-fied mining industry in Myanmar, upon which a resource-orientedeconomy could be constructed.
In turn, whether Myanmar is able to take advantage of its tinwealth by developing a large and sustainable tin industry, will bean important determinant on the future market balance of the tinindustry. If Myanmar succeeds in rebuilding its tin industry, amajor new tin region will be reestablished resolving long term
able again demonstrates that it is not plausible for Myanmar to build its economyf the country were to host multiple large tin mines it could not base its economy ondevelop its economy via mining. Annual gross market size is calculated based on
S (Anderson, 2015; Bray, 2015; Brininstool, 2015; George, 2015; Kuck, 2015; Shedd,).
Gross MarketSize - 2013(US$B)
MynanmarMarket Value (US$M)
Source
337.8 � Tuck, 2015; Fong-Sam, 2014134 140 Brininstool, 2015; Fong-Sam, 2014127.4 4.6 George, 2015; Fong-Sam, 201444.4 84.4 Kuck, 2015; Fong-Sam, 201429.1 19 Tolcin, 2015; Fong-Sam, 201411.8 21 Guberman, 20157.6 � Bray, 2015; Fong-Sam, 20146.5 221 Anderson, 2015; Fong-Sam, 20143.7 6.3 Shedd, 2015; Fong-Sam, 2014

N.J. Gardiner et al. / Resources Policy 46 (2015) 219–233232
supply shortage issues in the tin industry. If Myanmar fails to builda sustainable tin industry, then when the immediately accessibletin resources are depleted the tin industry will return to a periodof supply uncertainty and shortage, with associated elevated andvolatile tin prices.
Acknowledgments
We are indebted to ITRI for assistance in the preparation of thismanuscript, in particular to Peter Kettle and Tom Mulqueen fortheir market and cost data, and to Cui Lin for information on theMan Maw mine site. The Oxford University Fell Fund (Ref.DGD07260) and Highland Metals Pte Ltd are acknowledged forsupporting NJG and the Oxford Burma project respectively. JPSacknowledges financial support from the Centre for ExplorationTargeting. JPS and AT acknowledge the continued support of col-leagues at the Centre for Exploration Targeting and Department ofMineral and Energy Economics, Curtin University. We thank DaveSansom for figure drafting. NJG thanks U Aung Tin for showinghim the Dawei tin district. The authors also acknowledge LauraBrooks, Robert Edwards, Neil Hawkes, Kirill Kirilenko, HelenO'Cleary and Paul Williams of CRU Group for the assistance withTable 3A. An abridged version of this paper was presented at theITRI International Tin Forum, Shanghai, May 2015 (Gardiner andSykes, 2015). We thank Gary Campbell for careful editorial hand-ling, and greatly appreciate constructive comments from twoanonymous reviewers, which have significantly improved themanuscript.
References
Anderson, C.S., 2015. Mineral Commodity Summaries: Tin, United States GeologicalSurvey (USGS), January.
Angeiras, A.G., Bates, J.H., 2006. The Brazilian Enigma: Future Tin Mine Potentialand Realising Future Production. In: ITRI International Tin Conference, Rio deJaneiro, Brazil, 18 May.
Anonymous, 1986. Resources Policy, March, 2–3.Anuar, A., Jaafar, N., 2010. Investments and Cost Profile for Sustainable Tin Pro-
duction in Southeast Asia. In: ITRI International Tin Conference, Vancouver,Canada, 17–19 May.
Bray, E.L., 2015. Mineral Commodity Summaries: Bauxite and Alumina, UnitedStates Geological Survey (USGS), January.
Brininstool, M., 2015. Mineral Commodity Summaries: Copper, United States Geo-logical Survey (USGS), January.
British Geological Survey (BGS), 2012. Risk List: An Update to the Supply Risk Indexfor Elements or Element Groups that are of Economic Value (online). ⟨http://www.bgs.ac.uk/mineralsuk/statistics/riskList.html⟩ (accessed: 17.01.2015).
Chhibber, H.L., 1934. The Mineral Resources of Burma. MacMillan and Co., London.CIA, 2013. The World Factbook. Central Intelligence Agency, USA.Codelco, 2011. Operations – Investment and Projects – El Teniente, 14 July (online).
⟨http://www.codelco.com/proyectos-e-inversiones/prontus_codelco/2011-07-14/170701.html⟩ (accessed: 29.06.2015).
Coggin Brown, J., 1918. The cassiterite deposits of Tavoy. Rec. Geol. Survey India 49,23–33.
Coggin Brown, J., Heron, A., 1923. The Geology and Ore Deposits of the TavoyDistrict. Geological Survey of India.
Collier, P., 2007. The Bottom Billion: Why the Poorest Countries Are Failing andWhat Can Be Done About It. Oxford University Press, Oxford.
Collier, P., 2010. The Plundered Planet: How to Reconcile Prosperity with Nature.Penguin Group, London.
Cox, R., Gaskell, J., Thomas, C., 1981. Burma: a Country with Major UnexploredMineral Potential. Institution of Mining and Metallurgy, London, pp. 34–45,Asian Mining’81.
Crawford, M., Church, J., Akin, B., 2015. Consumer Price Index (CPI) Detailed Report,United States Bureau of Labor Statistics, February.
DiFrancesco, C.A., Carlin, Jr., J.F., Tolcin, A.C., 2014. Tin Statistics, United StatesGeological Survey, 1 April.
Fong-Sam, Y., 2014, 2012 Minerals Yearbook: Burma [Advance Release], UnitedStates Geological Survey (USGS), November.
Gardiner, N.J., 2015. Burma’s Rising Star. Geoscientist, February, 10–13. GeologicalSociety of London.
Gardiner, N.J., Sykes, J.P., 2015. Myanmar: The Black Swan of Global Tin?. ITRI ChinaInternational Tin Forum, Shanghai, China, pp. 18–20, May.
Gardiner, N.J., Robb, L.J., Searle, M.P., 2014. The metallogenic provinces of Myanmar.Appl. Earth Sci. (Trans. Inst. Min. Metall. B) 123 (1), 25–38. http://dx.doi.org/10.1179/1743275814Y.0000000049.
George, M.W., 2015, Mineral Commodity Summaries: Gold, United States GeologicalSurvey (USGS), January.
Guberman, D.E., 2015, Mineral Commodity Summaries: Lead, United States Geo-logical Survey (USGS), January.Helfer, J.W., 1839. The Provinces of Ye, Tavoy andMergui on the Tenasserim Coast. Bengal Military Orphan Press, Calcutta.
Hughes, T.W.H., 1889. Tin Mining in Mergui District. Rec. Geol. Survey India 22,188–208.
ICMM, 2012. Mining's contribution to sustainable development: The role of miningin national economies, International Council on Mining & Metals, October 2012.
ITRI, 2012a. Tin for Tomorrow: Contributing to Global Sustainable Development.ITRI Ltd, St Albans, October 2012.
ITRI, 2012b. Tin mining and processing methods: ITRI Briefing. ITRI Ltd, St Albans.ITRI, 2013. Australian Juniors Eye Myanmar Tin Potential, 5 July (online). ⟨https://
www.itri.co.uk/index.php?option¼com_zoo&task¼ item&item_id¼2794&category_id¼13&Itemid¼149⟩ (accessed: 29.06.2015).
ITRI, 2014a. Myanmar Seeks Tin Smelting Joint Venture Partners, 19 September(online). ⟨https://www.itri.co.uk/index.php?option¼com_zoo&task¼ item&item_id¼3080&Itemid¼143⟩ (accessed: 20.06.2015).
ITRI, 2014b. Timah Forecasts Improved Results but Cancels Myanmar Investment,22 December (online)⟨https://www.itri.co.uk/index.php?option¼com_zoo&task¼ item&item_id¼3120&Itemid¼143⟩ (accessed: 14.06.2015).
ITRI, 2015. YTC Forecasts Decline in Myanmar Tin Production, 1 June (online).⟨https://www.itri.co.uk/index.php?option¼com_zoo&task¼ item&item_id¼3208&Itemid¼143⟩ (accessed: 14.06.2015).
Kettle, P., Pearce, J., Lin, C., Sykes, J.P., 2014b. Tin Industry Review: Managing theNext Tin Crisis. ITRI Ltd, St. Albans.
Kettle, P., Sykes, J.P., Staffurth, N., Davies, S., 2014c. New Tin Supply: A Global Surveyof Potential Mine Projects. ITRI Ltd and Greenfields Research Ltd, St. Albans andHarrogate.
Kettle, P., Lin, C., Tianhua, R., Mulqueen, T., Davidson, V., 2014a. CRUMonitor Tin:Myanmar vs Indonesia – Outcome Uncertain. CRU Group Ltd in association withITRI Ltd, St. Albans 11 December.
Kettle, P., Lin, C., Tianhua, R., Mulqueen, T., Davidson, V., 2015a. CRUMonitor Tin: AllEyes on Supplies. CRU Group Ltd in association with ITRI Ltd, St. Albans 19February.
Kettle, P., Lin, C., Tianhua, R., Mulqueen, T., Davidson, V., 2015b. CRUMonitor Tin: TinMarket Lacking Direction As Trading Slows. CRU Group Ltd in association withITRI Ltd, St. Albans 11 June.
Kettle, P., Lin, C., Tianhua, R., Mulqueen, T., Davidson, V., 2015c. CRUMonitor Tin:What’s Gone Wrong With The Tin Market?. CRU Group Ltd in association withITRI Ltd, St. Albans 16 April.
Kettle, P., Lin, C., Sykes, J.P., Pearce, J., Cusack, P., Wallace, T., 2011. Tin IndustryReview: Tin at the Crossroads. ITRI Ltd, St. Albans.
Konkin, P., 2012. Pyrkakay Tin Field. Chukotka Autonomous Okrug, Chaun Region,Northern Tin LLC, April.
Kuck, P.H., 2015. Mineral Commodity Summaries: Nickel. United States GeologicalSurvey (USGS), United States.
Lehmann, B., 1990. The Metallogeny of Tin. Springer-Verlag, Berlin, p. 211.Melcher, F., Graupner, T., Gabler, H.-E., Sitnikova, M., Henjes-Kunst, F., Oberthur, T.,
Gerdes, A., Dewaele, S., 2015. Tantalum-(niobium-tin) mineralization in Africanpegmatites and rare metal granites: constraints from Ta-Nb oxide mineralogy,geochemistry and U-Pb geochronology. Ore Geol. Rev. 64, 667–719.
Minsur, 2014, 2013 Annual Report, Lima, Peru, 31 March.Mlynarczyk, M.S.J., Sherlock, R.L., Andrews-Williams, A.E., 2003. San Rafael, Peru-
geology and structure of the World’s richest tin lode. Miner. Deposita 38,555–567.
Molo Women Mining Watch Network, 2012. Lost Paradise: Damaging Impact ofMawchi Tin Mines in Burma’s Karenni State. ⟨http://uscampaignforburma.org/statements-archive/23-archived-statements/4045-molo-women-mining-watch-network-burma-s-plans-to-expand-mawchi-tin-mines-risk-derailing-karenni-peace-process.html⟩ (accessed 02.07.2015).
Moody, R., 1999. Grave Diggers: A Report on Mining in Burma. Canada Asia PacificResource Network, Vancouver.
Moores, E., Fairbidge, R., (Eds.), 1997. Encyclopedia of European and Asian RegionalGeology. Chapman and Hall.
Norilsk Nickel, 2014. Press Release: MMC Norilsk Nickel Announces PreliminaryConsolidated Production Results for 4th Quarter and Full Year 2013 and Pro-duction Outlook for 2014. Moscow, Russia, 31 January.
O’Riley, E., 1862. Journal of a Tour to Karen-ni for the purpose of opening a tradingroad to Shan Traders from Mobyay and the adjacent Shan states, through thatterritory direct to Tungu. J. R. Geogr. Soc. 32, 164–216.
Pareja, L., 2011. Minsur, ITRI Investing in Tin Seminar, London, United Kingdom,5 December.
Ryzhov, S., 2012. Russian Tin Industry: History, Realities and Prospects. In: ITRIInternational Tin Conference, Cape Town, South Africa, 23–26 May.
Saw Lwin, S., 2012. Database Building in Ministry of Mines, Myanmar. Departmentof Geological Survey and Mineral Exploration, The Republic of the Union ofMyanmar, 13 March.
Schwab, K., Sala-I-Martin, X., Brende, B., 2013. The Global Competitiveness Report2013–2014, Full Data Edition. World Economic Forum (online). ⟨http://www.weforum.org/reports/global-competitiveness-report-2013-2014⟩ (accessed4.06.2015).
Schwartz, M.O., Rajah, S.S., Askury, A.K., Putthapiban, P., Djaswadi, S., 1995. The

N.J. Gardiner et al. / Resources Policy 46 (2015) 219–233 233
southeast asian Tin belt. Earth Sci. Rev. 38, 95–293.Shedd, K.B., 2015. Mineral Commodity Summaries: Tungsten. United States Geo-
logical Survey (USGS), January.Smith, R., 1996. An analysis of the processes for smelting tin. Mining history: the
bulletin of the peak district mines historical society. Historical Metallurgy So-ciety Special Publication: The Archaeology of Mining & Metallurgy in South-West Britain, 13, pp. 91–99.
Soe Win, Marlar Myo Myint, 1998. Mineral potential of Myanmar. Resource Geology48, 209-218.
Steinberg, D.I., 2013. Burma/Myanmar: What Everyone Needs to Know, 2nd EdOxford University Press, Oxford.
Sykes, J.P., Gardiner, N.J., Trench, A., Robb, L.J., Davis, R.S., 2015. The economics of tinmining in the early 21st century. Resour. Policy (In preparation).
Sykes, J.P., 2013. Structural changes in mine supply: case studies in tin and tanta-lum. In: Metal Pages Electronic & Specialty Metals Conference, Shanghai, China,11 September.
Sykes, J.P., Kettle, P., 2014. The implications of uncertainty in tin and tantalummining for the future of the electronics industry. In: Metal Pages China MetalsWeek Conference, Beijing, China, 17 September.
Taleb, N.N., 2008. The Black Swan: The Impact of the Highly Improbable. Penguin,London, Reissue Edition.
Than Htun, Somboon, K., Manaka, T., 2014. Preliminary Investigation of New TinDeposits in Mong Ton-Mong Hsat Area, Shan State (East), Myanmar. In: WinSwe, Soe Thura Tun, Myo Thant, Khin Zaw (Eds.), Thirteenth Regional Congresson Geology, Mineral and Energy Resources of Southeast Asia GEOSEA 2014
Abstracts, p. 8.Thoburn, J.T., 1994. The tin industry since the collapse of the International Tin
Agreement. Resour. Policy 20, 125–133.Tolcin, A.C., 2015. Mineral Commodity Summaries: Zinc. United States Geological
Survey (USGS), January.Transparency International, 2013. Corruption Perceptions Index, Berlin, Germany
(online). ⟨http://www.transparency.org/cpi2013/⟩ (accessed 4.06.2015).Tuck, C.A., 2015, Mineral Commodity Summaries: Iron Ore. United States Geological
Survey (USGS), January.United Nations, 1996. Geology and Mineral Resources of Myanmar. Atlas of the
mineral regions of the ESCAP region, United Nations Economic and SocialCommission for Asia and the Pacific v12.
United States Geological Survey (USGS), 1994. International Strategic Mineral IssuesSummary Report – Tungsten. United States Geological Survey Circular 930-O,United States.
United States Geological Survey (USGS), 2014. Mineral Resources Data System(MRDS) (online). ⟨http://mrdata.usgs.gov/mrds/⟩ (accessed 09.06.2015).
United States Geological Survey (USGS), 2015. Mineral Commodity Summaries2015. U.S. Geological Survey, 196 p.
Wilson, A., Cervantes, M., Green, K.P., 2014. Annual Survey of Mining Companies2013. Fraser Institute, Vancouver, Canada (online). ⟨http://www.fraserinstitute.org/research-news/display.aspx?id¼20902⟩ (accessed 4.06.2015).
World Bank, 2013. Doing Business 2014: Understanding Regulations for Small andMedium-Size Enterprises, 29 October (online) ⟨http://www.doingbusiness.org/reports/global-reports/doing-business-201⟩ (accessed 4.06.2015).