Tin Distribution and Fate in Tims Branch at the … INTERNSHIP TECHNICAL REPORT ... relatively inert...
77
DOE-FIU SCIENCE & TECHNOLOGY WORKFORCE DEVELOPMENT PROGRAM SUMMER INTERNSHIP TECHNICAL REPORT June 6, 2011 to August 12, 2011 Tin Distribution and Fate in Tims Branch at the Savannah River Site Principal Investigators: Amaury Betancourt (DOE Fellow) Florida International University Brian B. Looney, Mentor Savannah River National Laboratory Acknowledgments: S. Ann Thomas DOE, Savannah River Site, Aiken, SC Florida International University Collaborator and Program Director: Leonel Lagos Ph.D., PMP ® Prepared for: U.S. Department of Energy Office of Environmental Management Under Grant No. DE-EM0000598
-
Upload
hoangquynh -
Category
Documents
-
view
216 -
download
1
Transcript of Tin Distribution and Fate in Tims Branch at the … INTERNSHIP TECHNICAL REPORT ... relatively inert...

DOE-FIU SCIENCE & TECHNOLOGY WORKFORCE DEVELOPMENT PROGRAM
SUMMER INTERNSHIP TECHNICAL REPORT June 6, 2011 to August 12, 2011
Tin Distribution and Fate in Tims Branch at the Savannah River Site
Principal Investigators:
Amaury Betancourt (DOE Fellow) Florida International University
Brian B. Looney, Mentor
Savannah River National Laboratory
Acknowledgments: S. Ann Thomas
DOE, Savannah River Site, Aiken, SC
Florida International University Collaborator and Program Director:
Leonel Lagos Ph.D., PMP®
Prepared for:
U.S. Department of Energy Office of Environmental Management
Under Grant No. DE-EM0000598

DISCLAIMER
This report was prepared as an account of work sponsored by an agency of the United States government. Neither the United States government nor any agency thereof, nor any of their employees, nor any of its contractors, subcontractors, nor their employees makes any warranty, express or implied, or assumes any legal liability or responsibility for the accuracy, completeness, or usefulness of any information, apparatus, product, or process disclosed, or represents that its use would not infringe upon privately owned rights. Reference herein to any specific commercial product, process, or service by trade name, trademark, manufacturer, or otherwise does not necessarily constitute or imply its endorsement, recommendation, or favoring by the United States government or any other agency thereof. The views and opinions of authors expressed herein do not necessarily state or reflect those of the United States government or any agency thereof.

ARC-2007-D2540-049-04 Tin Distribution and Fate in Tims Branch
iii
ABSTRACT
Tims Branch is a small stream on the Department of Energy (DOE) Savannah River Site (SRS) in Aiken, South Carolina. Since 1985, Tims Branch has been receiving treated groundwater, which has been treated by air stripping to remove chlorinated solvents. In November 2007, an innovative treatment process to remove mercury was initiated – this process uses tin chloride addition prior to air stripping to convert the mercury to a strippable form for removal by the existing treatment equipment. The untreated groundwater has a mercury concentration of approximately 250 parts per trillion (ppt), and the treated groundwater entering Tims Branch at the A014 Outfall has a mercury concentration of approximately 10 ppt. As a result of the tin chloride addition procedure, the mercury concentration in the treated groundwater entering Tims Branch has significantly decreased, but the tin concentration in the treated groundwater entering Tims Branch has significantly increased. The objective of the present research is to determine the distribution and fate of tin in Tims Branch. Sediments, water, and biofilm samples were collected along Tims Branch. The data indicate that tin is accumulating primarily in the sediments of Tims Branch closest to the outfall. In particular, two ponded areas showed significant accumulation of tin. One of the sites has a weir that is placed to prevent further erosion along the outfall tributary into Tims Branch, and this site is located approximately 1,900 feet from the outfall. The other site that showed significant accumulation of tin in the sediments is a beaver pond, namely Beaver Pond 2, which is located approximately 6,700 feet from the A014 Outfall. These two sites are promising locations to focus future research on potential tin impacts in this small stream ecosystem. The weir site, though relatively small in surface area (approximately 200 square meters), contains approximately 2.9% of the total tin released in Tims Branch from November 2007 to March 2011. Analysis of several biofilm samples showed that biofilm appears to be able to accumulate significant concentrations of tin. The biofilm samples were collected from fibrous substrates so the results represent the content of the biological community as well as particulates and detritus that have been physically collected and trapped over an extended timeframe. The results presented in the research show how tin has distributed in a real ecosystem following three and a half years of operation of a tin chloride treatment system designed to reduce mercury concentration in the treated groundwater entering the ecosystem. In addition, the results of the present research will help to understand where tin may distribute in a real ecosystem and if tin chloride treatment, used for treating water that has been contaminated with mercury, can be applied to other ecosystems that have been contaminated with mercury, such as the East Fork Poplar Creek (EFPC) in Oak Ridge, Tennessee. The analytical results for other media in Tims Branch, water and fish, will be presented in separate research reports.
ARC-2007-D2540-049-04 Tin Distribution and Fate in Tims Branch
iv
TABLE OF CONTENTS
ABSTRACT .................................................................................................................. iiiTABLE OF CONTENTS ................................................................................................... ivLIST OF FIGURES ............................................................................................................ vLIST OF TABLES ............................................................................................................. vi1. INTRODUCTION .......................................................................................................... 12. EXECUTIVE SUMMARY ............................................................................................ 43. RESEARCH DESCRIPTIONS ...................................................................................... 7
Field Sampling ................................................................................................................ 7Site Selection .............................................................................................................. 7Sample Collection ....................................................................................................... 7
Processing Sediment Samples for Analysis .................................................................... 9Biofilm Sample Preparation .......................................................................................... 12Water Sample Preparation ............................................................................................ 12Fish Samples ................................................................................................................. 12
4. RESULTS AND ANALYSIS ....................................................................................... 13Tin Concentration in Sediment Samples....................................................................... 13Approximate Calculation of Mass Balance of Tin in Sediments .................................. 17Tin Concentration in Biofilm Samples ......................................................................... 21
5. CONCLUSION ............................................................................................................. 236. REFERENCES ............................................................................................................. 24APPENDIX A: Tin Calibration Curve ............................................................................. 25
Preparation of Tin Standards and Tin Calibration Curve ............................................. 25Relative Standard Deviation (RSD) Discussion ........................................................... 26
APPENDIX B: Tims Branch Sites ................................................................................... 29APPENDIX C: Concentrations of Elements in Standards, Sediments, and Biofilm,
from X-Ray Fluorescence (XRF) Spectrophotometer Analysis .............. 33APPENDIX D: Mass Balance Calculations ..................................................................... 64

ARC-2007-D2540-049-04 Tin Distribution and Fate in Tims Branch
v
LIST OF FIGURES
Figure 1. Elevation versus horizontal distance along the tributary originating from the A014 Outfall and along the main stream of Tims Branch, up to Upper Three Runs Creek, adapted and edited from Hayes (1984). ............................ 2
Figure 2. Documentation of the final calibration – estimated tin concentration versus the volumetrically prepared reference concentration of tin. ............... 11
Figure 3. Tin concentration in sediments along Tims Branch at the different sites where sediments were sampled. .................................................................... 13
Figure 4. Beaver Pond 2 (site 20) with four sampling locations, approximately, where sediment samples were taken. ............................................................. 14
Figure 5. Tin concentration in sediments along Tims Branch versus distance from A014 Outfall. ................................................................................................. 15
Figure 6. The pond at the weir site (site 8), with sediment sampling sites marked. ..... 16Figure 7. Concentrations of tin in the sediments at different locations within the
pond at the weir site (site 8), organized from locations upstream to downstream within the weir site. ................................................................... 17
Figure 8. Satellite image of weir site (site 8) with mass balance calculations for tin in the sediments in the pond at the weir site. ................................................. 20
Figure 9. Tin concentration in biofilm along Tims Branch. ......................................... 21Figure 10. Calibration curve for tin analyzed with the Thermo Scientific Niton
XL3t GOLDD+ X-Ray Fluorescence (XRF) Spectrophotometer. Each n value represents the number of runs that each reference sample was analyzed. ........................................................................................................ 26
Figure 11. Plot of the estimated tin concentration versus the standard deviation for each reference standard sediment sample. ..................................................... 27
Figure 12. Tims Branch, from just upstream of the wetland treatment system to just downstream of Beaver Pond 1. ...................................................................... 29
Figure 13. Tims Branch, from the tributary that originates from the A014 Outfall, then the confluence with the A011 tributary, then the confluence of the A014 tributary and the main stream of Tims Branch, downstream to a Savannah River Ecology Laboratory sampling station that is just downstream of Steed Pond. ........................................................................... 30
Figure 14. Tims Branch, from a Savannah River Ecology Laboratory (SREL) sampling station downstream of Steed Pond, down through Beaver Pond 3 and to Beaver Pond 4. ........................................................................ 31
Figure 15. Tims Branch, from Beaver Pond 4 down to the confluence between Tims Branch and Upper Three Runs Creek. ........................................................... 32

ARC-2007-D2540-049-04 Tin Distribution and Fate in Tims Branch
vi
LIST OF TABLES
Table 1. Sampling Sites with Notes and Types of Samples Collected at each Site ....... 8Table 2. Estimated Theoretical Average Concentration of Tin in Sediments in
Tims Branch from November 2007 to August 2011 and from the A014 Outfall Downstream to the Confluence of Tims Branch to Upper Three Runs Creek ..................................................................................................... 18
Table 3. Tin Concentrations in Reference Standard Sediment Samples ..................... 25Table 4. Relative Standard Deviation (RSD) Values for the 31 Reported Elements
and the Number of Duplicates used in Calculating the RSD ......................... 28

ARC-2007-D2540-049-04 Tin Distribution and Fate in Tims Branch
1
1. INTRODUCTION
The Savannah River Site (SRS) is a United States government facility located on a 310 sq mile reservation in South Carolina. Operations at the site began in the 1950s and focused on production of nuclear materials and the associated support and waste management activities (SRS 2011). Over the years of operations at the site, contaminants have entered the environment, and work has been conducted within the site to remediate contaminated areas. The Savannah River National Laboratory has initiated an applied research effort to study Tims Branch, a small stream ecosystem in the northern portion of SRS. Tims Branch originates on the SRS and flows into Upper Three Runs Creek, which eventually flows into the Savannah River. The overall research effort will assess the fate and potential impacts of inorganic tin released into this stream as well as the potential benefits of concomitant reduction in mercury discharge. These chemical changes resulted from the November 2007 start-up of an innovative system treating water discharged to Tims Branch – the treatment process removes mercury by chemical reduction and air stripping. Since 1985, groundwater in the A/M Area of the SRS has been treated to reduce concentrations of chlorinated solvents (Looney et al. 2010). This treatment system consists of groundwater wells from which groundwater in the area is pumped to an air stripper, the M-1 air stripper, which removes chlorinated solvents. The treated groundwater is discharged to a tributary of Tims Branch (Looney et al. 2010). In November 2007, an additional operation was added to the treatment system to reduce mercury concentration in the groundwater (Looney et al. 2010). Just upstream of the air stripper, the pumped groundwater is amended with tin(II) chloride (SnCl2 or stannous chloride), which reacts with mercury in the water to reduce it to elemental mercury. The groundwater enters the M-1 air stripper and the elemental mercury, which is more volatile than dissolved mercury, is stripped from the water along with the chlorinated solvents. The mercury concentration in the untreated groundwater is initially approximately 250 ng/L (parts per trillion) and the treatment system reduces the concentration of mercury in the treated groundwater to approximately 10 ng/L (Looney et al. 2010). Thus, mercury concentration has significantly decreased in the treated groundwater entering Tims Branch after the initial startup of the tin chloride treatment process. The concentration of inorganic tin in the water, however, has increased. While tin is less toxic than mercury, it is important to understand tin behavior and the impacts of the treatment system (both negative and positive) in Tims Branch to help assess the process performance and potential viability for other sites. Based on thermodynamics, tin from the treatment process is predicted to be predominantly inorganic tin in the +4 oxidation state, tin(IV), primarily as a solid tin(IV) oxide or hydroxide. Any residual inorganic tin(II) would be subject to oxidation and precipitation as the water flows downstream in Tims Branch. Tin(IV) oxides are relatively inert particles of low toxicity that would be expected to deposit in sediments

ARC-2007-D2540-049-04 Tin Distribution and Fate in Tims Branch
2
and other niches where particles accumulate in the ecosystem. Thus, inorganic tin(IV) is the predominant chemical form for deposition and accumulation in sediments; once deposited in sediments, the literature suggests that a small fraction of the tin may be converted to organo-tin through methylation (Amouroux et al. 2000, and others). The potential significance of tin methylation will be evaluated in future studies. The treated groundwater from the M-1 air stripper treatment system flows out of the A014 Outfall, which is the origin of a tributary of Tims Branch (the A014 tributary). At approximately 750 feet from the A014 outfall, a second tributary combines with the A014 tributary, and this second tributary originates from the A011 Outfall (the A011 tributary). Eventually, the A014 tributary combines with the main stream of Tims Branch at approximately 4500 feet from the A014 Outfall (Hayes 1984). At this point along the stream, Tims Branch is very braided and appears to be a marsh. The following figure is a plot of elevation versus horizontal distance along Tims Branch in the Savannah River Site in Aiken, South Carolina. The figure is adapted from Hayes (1984) and has been edited to include additional features relevant to the present research. Along the A014 tributary and along the main stream of Tims Branch, there exist several areas of potential sediment accumulation. In the original figure that is found in Hayes (1984), the A014 Outfall was called the 300 Area Outfall. The figure has been edited to approximate the changes in elevation due to erosion resulting from the increased water flow rate into the A014 tributary starting in 1985 due to the M-1 air stripper water treatment system. The edited figure also includes additional sediment deposition sites, including an engineered erosion control pond (the “weir site”) and several beaver ponds.
Figure 1. Elevation versus horizontal distance along the tributary originating from the A014 Outfall and along the main stream of Tims Branch, up to Upper Three Runs Creek, adapted and edited from
Hayes (1984).

ARC-2007-D2540-049-04 Tin Distribution and Fate in Tims Branch
3
From the plot of elevation versus horizontal distance along the tributary of Tims Branch that originates at the A014 Outfall and along the main stream of Tims Branch, there are seven identified areas of potential sediment deposition and accumulation. In Figure 1, the rip rap is an area along the tributary that originates at the A014 Outfall that has a sudden drop in elevation, where sheet metal has been placed facing the flow of water in the tributary from one edge to the other in order to prevent further erosion from occurring. The rip rap site is visible but is difficult to access and is very rocky; it is uncertain if this site has any sediment deposition. The weir site is a location that has a large vertical pipe with a diameter of about three or four feet sticking up from the bottom of the tributary, allowing water to pass from a higher elevation to a lower elevation. The weir site has a sudden drop in elevation due to erosion. The vertical pipe has steel or iron bars on the top that prevent large debris from entering the pipe. The remaining sites for potential sediment accumulation are the braided stream, the beaver ponds, and Steed Pond. Steed Pond was not sampled because it is a radiological posted area. The objective of the present research is to provide an initial survey of the distribution and fate of inorganic tin released to Tims Branch. To ascertain where tin is being deposited and accumulated along Tims Branch, samples of sediment, water, and biofilm along Tims Branch were collected and analyzed for tin. Samples were taken along the tributary of Tims Branch that originates at the A014 Outfall and also along the main stream of Tims Branch, excluding Steed Pond because of the radiological posting at this location [Steed Pond was the primary location where uranium accumulated during site operations in the M Area (Evans et al. 1992)], and up to a point just before the confluence of Tims Branch with Upper Three Runs Creek. The importance of this research is to examine the risks and benefits of tin chloride treatment for reducing mercury inputs to ecosystems such as Tims Branch and the East Fork Poplar Creek (EFPC) in Oak Ridge, Tennessee. With a knowledge of where tin is accumulating in Tims Branch, further studies can investigate whether the concentrations of tin in sediments along Tims Branch at certain sites reach levels that may impact microorganisms and aquatic fauna and flora, and also whether or not the reduction of mercury concentration in the water in Tims Branch has beneficially decreased mercury concentration in Tims Branch fish.

ARC-2007-D2540-049-04 Tin Distribution and Fate in Tims Branch
4
2. EXECUTIVE SUMMARY
This research work has been supported by the DOE-FIU Science & Technology Workforce Initiative, an innovative program developed by the US Department of Energy’s Environmental Management (DOE-EM) and Florida International University’s Applied Research Center (FIU-ARC). During the summer of 2011, a DOE Fellow intern (Amaury Betancourt) spent 10 weeks doing a summer internship at Savannah River National Laboratory (SRNL) in the Savannah River Site (SRS) under the supervision and guidance of Dr. Brian B. Looney. The intern’s project was initiated in June 6, 2011, and continued through August 12, 2011 with the objective of determining the fate and distribution of tin in the Tims Branch ecosystem in the SRS. Tin enters the ecosystem from an innovative mercury treatment system in which tin chloride reacts with mercury in contaminated groundwater to reduce mercury and allow mercury to be stripped from the groundwater by using an air stripper. The treated groundwater enters Tims Branch with a reduced mercury concentration but an increased tin concentration. Therefore, the distribution and fate of tin within Tims Branch are important in determining possible effects of tin on fauna and flora in this ecosystem. The Savannah River Site (SRS) in Aiken, South Carolina, is a United States government facility. Historical operations at SRS include nuclear weapons production, nuclear power production, and, more recently, environmental cleanup operations, among other operations historically and currently. As a result of past research and operations at the site, contaminants have been released into the environment, and the SRS is currently involved in numerous projects for cleanup of the environments that have been affected by these contaminants. At the A/M area in the SRS, groundwater has been contaminated with chlorinated solvents and mercury. In 1985, the M-1 Air Stripper Treatment System was installed to volatilize the chlorinated solvents from the groundwater by pumping the groundwater through the air stripper, then releasing the treated water to Tims Branch, and further treating the off gas from the air stripper for the volatilized chlorinated solvents. However, the treatment system originally was not designed to remove mercury from the groundwater, and in November 2007 a tin chloride treatment process was added just upstream of the M-1 air stripper. The tin chloride reacts with dissolved mercury in the groundwater to reduce dissolved mercury to elemental mercury, which is more volatile and can be removed from the groundwater by the air stripper. The inlet concentration of mercury to the treatment system is approximately 250 parts per trillion (ppt). After the groundwater is treated in the treatment system, the resulting concentration of mercury in the treated groundwater is 10 ppt. The concentrations of the chlorinated solvents in the untreated groundwater have decreased over the years to levels that are low enough that do not require further treatment of the off gas of the air stripper. In addition, the mercury concentration in the off gas is also low enough that further treatment of the off gas of the air stripper is not necessary. Thus, the off gas of the M-1 air stripper is not treated further. Mercury concentration in the treated groundwater entering Tims Branch has significantly decreased since the startup of the tin chloride addition procedure to the M-1 Air Stripper
ARC-2007-D2540-049-04 Tin Distribution and Fate in Tims Branch
5
in November 2007. However, the concentration of tin entering Tims Branch has significantly increased. The objective of the present research is to determine the distribution and fate of tin in Tims Branch. To achieve this objective, different media along Tims Branch were sampled, specifically sediments, water, and biofilm. The focus of this report is on sediments and biofilm. Sediment and biofilm samples were collected along the tributary of Tims Branch that originates at the A014 Outfall, then along the main stream of Tims Branch up to a point just before the confluence of Tims Branch with Upper Three Runs Creek, which eventually leads into the Savannah River. The sediment sampling sites along Tims Branch, including the A014 tributary, include various areas where sediments potentially accumulate: a weir site that was placed to prevent further erosion along Tims Branch, a braided stream area, and numerous beaver ponds. From the numerous sites sampled, two sites in particular showed relatively high tin concentrations. The first site where tin appeared to be accumulating was the site with a weir, which had been installed to prevent further erosion from occurring along Tims Branch. Samples were taken from a pond just upstream of the weir, and relatively high mercury concentrations were measured for sediment depths from 0 to 3 inches deep. The second site where tin appeared to be accumulating was a site named Beaver Pond 2, which is downstream of the confluence of the tributary that originates at the A014 Outfall and the main stream of Tims Branch. The sediment sampling site that had the highest concentration of tin was a site just downstream of the A014 Outfall, but this site only had a high concentration in the sediment depth of 0 to 0.5 inches, just at the sediment surface, and the surface area of this site is relatively small. Therefore, tin did not appear to be accumulating in this location. Also, sites in between the A014 Outfall and the weir site also showed significant concentrations of tin in the sediments, although these sites also have small surface areas and do not appear to be sites of significant sediment accumulation. All the other sediment sampling sites downstream of Beaver Pond 2 did not show significant tin concentration in the sediments, except for the last sampling site before the confluence of Tims Branch with Upper Three Runs Creek. This last sampling site showed relatively high tin concentration in only the depth of sediment between 1.5 and 2.5 inches, and this site is relatively small in surface area, therefore tin accumulation does not appear to be significant at this site. Because tin was only detected in the sediment depths between 1.5 and 2.5 inches, it is possible that this tin may have come from historical releases into Tims Branch. In addition, several biofilm samples were taken at various sites along the A014 tributary. The concentrations of tin in each of the biofilm samples were significantly higher than the concentrations of tin in the sediment samples for each respective site. However, these samples were not collected by conventional means for sampling biofilm so the results are only interpreted as a scoping study. Tin may be accumulating in biofilm because of the roots in the biofilm that may attach to suspended sediments in the water, which may

ARC-2007-D2540-049-04 Tin Distribution and Fate in Tims Branch
6
include tin particles in the water. Further research on Biofilm in Tims Branch should be conducted. The present research suggests that further research on the effects of tin chloride treatment in Tims Branch should focus on the two sediment accumulation areas where tin was detected in significant concentrations: the weir site, which is located approximately 1,900 feet downstream the A014 Outfall, and Beaver Pond 2, which is located approximately 6,700 feet downstream the A014 Outfall. The results of the present research are important to be able to predict tin distribution and fate in a real ecosystem, namely Tims Branch, and the results may be applied to potential use of tin chloride remediation in other ecosystems that are contaminated with mercury, such as the East Fork Poplar Creek (EFPC) in Oak Ridge, Tennessee. Further research is necessary to assess the effects of tin on fish and other wildlife in these ecosystems. The results of the water samples and fish samples will be presented in a separate report.

ARC-2007-D2540-049-04 Tin Distribution and Fate in Tims Branch
7
3. RESEARCH DESCRIPTIONS
Field Sampling
Four field sampling trips were conducted to select sampling sites and to collect sediment, water, and biofilm samples along Tims Branch. Samples were collected from 19 different sites along Tims Branch, with different types of samples collected at each site, and multiple samples collected at different locations at some of the sites.
Site Selection
Sites were selected at various locations all along Tims Branch, up to just before the confluence of Tims Branch with Upper Three Runs, which eventually flows into the Savannah River. Sites were selected along Tims Branch to obtain an adequate mapping of the distribution of tin. Some specific sites were selected because of either adequate deposition of sediments at the site, interesting biofilm at the site, or because of a particular formation at the site, such as a beaver pond, which could cause accumulation of sediments. In addition, control samples of sediment, water, and biofilm were collected at an unnamed tributary in Tims Branch, which originates from the new A011 Outfall, and which eventually flows into the tributary of Tims Branch that originates at the A014 Outfall (from where the treated groundwater enters).
Sample Collection
Almost all of the sediment samples were collected with sample core liners, which are made of plastic. Each sediment sample was collected by placing one end of the sample core liner on the surface of the sediments and then pressing down and twisting slightly until the core liner was submerged in the sediments as deep as possible. Then, the sediment around the sample core liner was dug and the bottom of the sample core liner was held by one hand as the sample core liner was lifted. Sometimes, while the sample core liner was still inside the sediments, the cap was placed on top of the sample core liner, which was then lifted slowly from the sediments, and the sample remained in the sample core liner because of vacuum conditions in the space where the sample core was collected. Following this, a cap was placed on the top of the sample core liner (if not already placed) and then a cap was placed on the bottom of the sample core liner or plastic was wrapped on the bottom of the sample core liner to hold the sample in place. Each core sample was between 1.5 to 6.5 inches deep., with an average sample depth of around 4.5 inches. A total of 34 sediment samples were collected using sample core liners, and 2 additional sediment samples were collected using a United States BMH-53 bed material sampler to evaluate the field performance of this sampler. Water samples were collected with a cup-on-a-stick sampler. At each site where water samples were collected, two water samples were collected: one to be filtered and one to not be filtered. Filtering was done to be able to distinguish between dissolved tin, which was operationally defined as any tin that could pass through a 0.20 micrometer (μm) filter, and particulate tin, which was operationally defined as any tin that could not pass through the 0.20 μm filter.

ARC-2007-D2540-049-04 Tin Distribution and Fate in Tims Branch
8
At each location where a “biofilm” sample was taken, the sample was collected by removing a section of biofilm-coated substrate by hand and then placing the material in a plastic bag. Thus substrate for the biofilm was typically a mass of root fibers or similar fibrous material found in a stream “snag” area. Note that this was a screening study and samples collected in this manner contain significant quantities of detritus and particulate matter (relative to traditional biofilm samples that are collected on flat plates after a period of colonization/growth. The following table shows the sample sites and types of samples collected at each site.
Table 1. Sampling Sites with Notes and Types of Samples Collected at each Site
Site# Notes
Types of samples collected
Approximate Distance from
the A014 Outfall (feet)
0 Outlet of M-1 Air Stripper System Water N/A 1 A014 Outfall Water, Biofilm 5
2 Downstream about 20 feet from A014 Outfall
Sediment, Biofilm
20
3 Downstream of two culverts Sediment, 400
5*
On stream originating from A014 Outfall, just before confluence with stream originating from the new A011 Outfall
Sediment, Biofilm, Water
750
6 Control stream, originating from the new A011 Outfall
Sediment, Biofilm, Water
N/A
7
Downstream about 25 feet from the confluence of the streams originating from the new A011 Outfall and the A014 Outfall
Water
800
8 Weir site Sediment 1900 10 Upstream of Former A011 Outfall Sediment 3600
9 Former A011 Outfall Sediment, Biofilm, Water
3700
11
Beaver Pond 1, Control location, a former farm pond that is on the main northern tributary of Tims Branch that receives the discharge from the A-01 wetland treatment system
Sediment, Water
N/A
12
Braided stream, upstream of Beaver Pond 2 (Site 20), and downstream of Former A011 Outfall
Sediment
4700

ARC-2007-D2540-049-04 Tin Distribution and Fate in Tims Branch
9
Site# Notes
Types of samples collected
Approximate Distance from
the A014 Outfall (feet)
20 Beaver Pond 2, in between Former A011 Outfall and Steed Pond
Sediment 6700
13
Former United States Geological Survey (U.S.G.S.) sampling station, just downstream of Steed Pond
Sediment, Biofilm, Water
10500
15 Beaver Pond 3, downstream of the former U.S.G.S. sampling station
Sediment, Water 14000
16 Downstream of Beaver Pond 3, in a braided stream
Sediment, Water 15700
17 Beaver Pond 4, in between Beaver Ponds 3 and 5
Sediment, Water 18800
19 Beaver Pond 5, in pond Sediment, Water 21000
18 Beaver Pond 5, channel downstream of beaver dam
Sediment, Water 21500
14 Tims Branch, just before confluence of Tims Branch with Upper Three Runs
Sediment, Water 25700
#Sites are listed in order from upstream to downstream
*Site 4 was selected but was not sampled
Processing Sediment Samples for Analysis
Most core samples were taken in Summer 2011, and the specific dates of sampling and field trips were July 15, July 22, July 29, and August 9, all in 2011. Once sediment core samples were collected and brought back to the laboratory, each sediment core sample was partitioned into segments to analyze the tin concentration in the sediment at different depths. For the first inch and a half (1.5 in.), each sediment core sample was divided into three equal slices, each with a thickness of 0.5 in. Therefore, the top three sediment portions were divided into depths of 0 to 0.5 in., 0.5 to 1 in., and 1 to 1.5 in. The following sections of the sediment core sample were each divided into segments of thicknesses each of 1 inch. Most of the sediment samples were about 4.5 inches long, and therefore the remaining depths of each sediment sample were 1.5 to 2.5 in., 2.5 to 3.5 in., and 3.5 to 4.5 in. Some sediment core samples were longer or shorter than 4.5 in., and these samples have either more segments or less segments. An initial field sampling trip was carried out by Brian B. Looney and Dennis Jackson on March 16, 2011. Sediment samples were collected from a pond just upstream of a weir, which is along the tributary of Tims Branch that originates at the A014 Outfall. The weir allows water to flow from a part of Tims Branch with a higher elevation to a part of Tims

ARC-2007-D2540-049-04 Tin Distribution and Fate in Tims Branch
10
Branch with a lower elevation. This weir was placed to prevent further erosion from occurring, which is caused by the increase of volume flow rate of water that began in 1985 with the operation of the M-1 air stripper. In the present research, this site was later labeled Site 8 (Table 1). The sediment samples from the initial field sampling trip were divided into equal sections of 1.5 inches each. Therefore, the sediment sample depths of these samples are 0 to 1.5 in., 1.5 to 3 in., and 3 to 4.5 in. Only a few of the samples from the initial field sampling trip had a depth of 4.5 in., but all samples from the initial field sampling trip were at least 3 in. deep. Once the sediment samples from the Summer 2011 field sampling trip were divided into the appropriate segments, all the samples were dried in an oven at a fairly constant temperature around 60°C. Most samples were dried for about 24 hours. Some samples dried over one weekend and the temperature of drying for these samples began at around 60°C but dropped to about 39°C over the weekend. Nonetheless, these samples dried over the weekend. The samples from the March 2011 field sampling trip had been dried earlier by simply air drying inside plastic bags left open in a laboratory. The drying process was approximately one week for these sediment samples. In addition, two samples from site 8, the weir site, which were collected on the July 15 field and sampling trip, were air dried for approximately two weeks because these samples were originally only to be used as test samples for the US-BMH Bed Material Sampler, but were eventually used for determining tin concentration at a part of this site. Once samples were dried, each segment of dried sediment was disaggregated using a mortar and pestle, followed by passing the sample through a standard United States Sieve, Size 20, which has a pore size of 0.0331 inches (in.), or 850 micrometers (μm). During the shaking of each sample in the sieve, the remaining portion of sediment on top of the sieve was placed in the mortar and pestle again, disaggregated, and passed through the sieve again. Some sediment samples were disaggregated and passed through the sieve a third time. After this, the sediment sample was placed in a clean plastic bag, labeled, and the equipment was brushed with a clean paint brush to remove any debris. The process was repeated for all segments of sediments. Each sediment sample was then placed in a X-ray fluorescence (XRF) spectrophotometer plastic sample cup. Each sample cup was covered with a Prolene film wrap that has a thickness of 4.0 μm, or 0.00016 in. To be analyzed using the XRF spectrophotometer, each sample cup was placed upside down inside the sample station, and the sediment sample rested on the Prolene film wrap in each sample cup. The samples were analyzed using a Niton XL3t GOLDD+ analyzer in the Test All Geo mode. After evaluation of the XRF output for all of the samples and reference materials, the results for 31 elements were reported. The elements that were not reported were either below detection in all cases or were rejected due to poor performance on certified
ARC-2007-D2540-049-04 Tin Distribution and Fate in Tims Branch
11
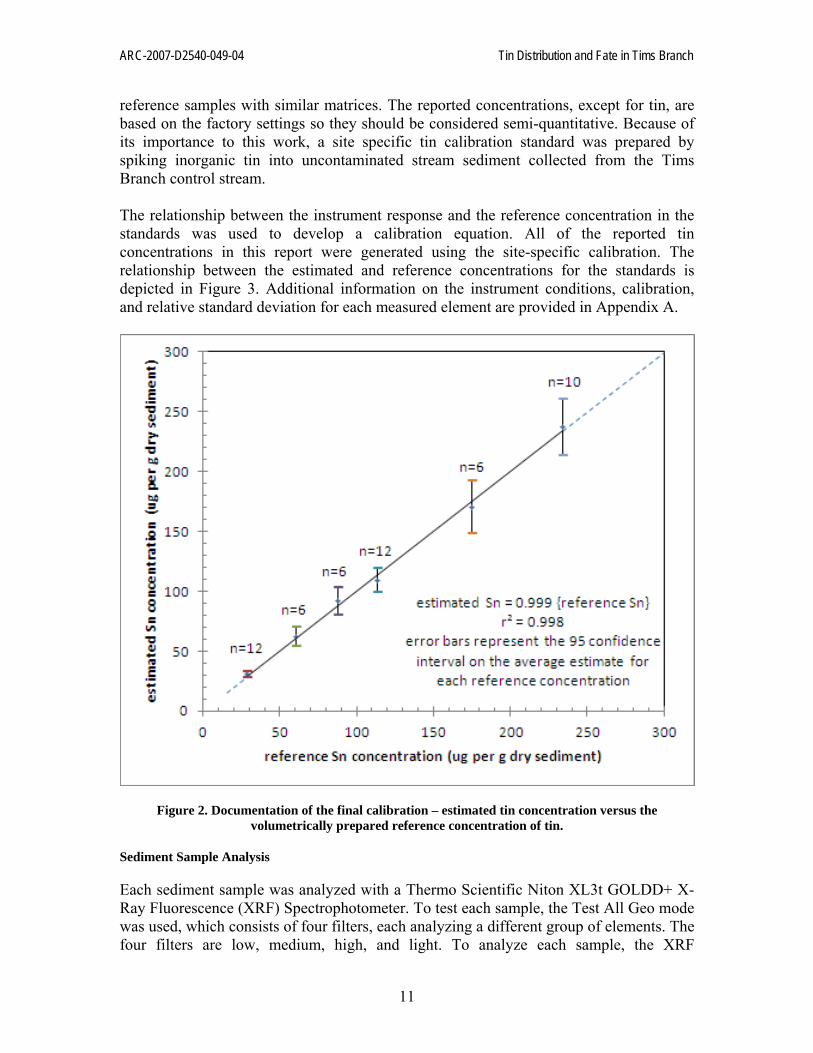
reference samples with similar matrices. The reported concentrations, except for tin, are based on the factory settings so they should be considered semi-quantitative. Because of its importance to this work, a site specific tin calibration standard was prepared by spiking inorganic tin into uncontaminated stream sediment collected from the Tims Branch control stream. The relationship between the instrument response and the reference concentration in the standards was used to develop a calibration equation. All of the reported tin concentrations in this report were generated using the site-specific calibration. The relationship between the estimated and reference concentrations for the standards is depicted in Figure 3. Additional information on the instrument conditions, calibration, and relative standard deviation for each measured element are provided in Appendix A.
Figure 2. Documentation of the final calibration – estimated tin concentration versus the volumetrically prepared reference concentration of tin.
Sediment Sample Analysis
Each sediment sample was analyzed with a Thermo Scientific Niton XL3t GOLDD+ X-Ray Fluorescence (XRF) Spectrophotometer. To test each sample, the Test All Geo mode was used, which consists of four filters, each analyzing a different group of elements. The four filters are low, medium, high, and light. To analyze each sample, the XRF
ARC-2007-D2540-049-04 Tin Distribution and Fate in Tims Branch
12
spectrophotometer was run for 60 seconds on each filter, for a total of 240 seconds (4 minutes), to analyze each sediment sample. Moreover, each sediment sample was analyzed twice and the results of each set of runs were averaged. Thus, a total of 8 minutes of analysis time was allotted for each sediment sample. In between the first and second sampling run for each sample, the sample was either shaken lightly or moved slightly in order for the XRF spectrophotometer to analyze a different section or different particles from the same sediment sample.
Biofilm Sample Preparation
Each biofilm sample was prepared and analyzed the same way as the sediment samples. Biofilm samples were more difficult to disaggregate because of the roots in the biofilm samples. Some biofilm samples that passed through the sieve had particles that were very small and which became airborne while samples were being poured from the sieve or while samples were being shaken. Most of the sample (including the fibrous substrate) for each biofilm sample remained in the sieve, however.
Water Sample Preparation
For each sampling site where a water sample was taken, a total of two water samples were actually collected. One of the water samples was filtered in order to remove suspended particles that were larger than 0.20 μm in diameter to analyze for the dissolved tin concentration (operationally defined as tin in the water that passes through a 0.20 μm filter), and the second water sample remained unfiltered to analyze for total tin in the water. Water samples were analyzed using inductively-coupled plasma – mass spectrometry (ICP-MS). Water samples were sent to the Savannah River Ecology Laboratory (SREL) to be analyzed. The results of the water samples will be reported in a separate report.
Fish Samples
Fish samples were collected from Tims Branch in 2006, which is prior to the startup and operation of the tin chloride treatment process, and in 2010, which is more than two years after the startup and during the operation of the tin chloride treatment process. The fish samples collected in 2006 will provide valuable information on mercury and, potentially, tin concentrations in fish prior to the startup and operation of the tin chloride treatment process, while the fish samples collected in 2010 will provide valuable information on mercury and, potentially, tin concentrations in fish after more than two years of operation of the tin chloride treatment process.

ARC-2007-D2540-049-04 Tin Distribution and Fate in Tims Branch
13
4. RESULTS AND ANALYSIS
The objective of the present research is to determine the distribution and fate of tin along Tims Branch, following approximately three and a half years of continuous operation of a tin chloride treatment system in Tims Branch to reduce mercury concentrations in the branch. To accomplish this objective, sediments, water, and biofilm were sampled from Tims Branch.
Tin Concentration in Sediment Samples
The results of sediment samples are the focus of the present research, and the results of water samples will be discussed in a separate report. Biofilm samples were taken as a scoping study, and the results are presented here. The following figure shows the concentration of tin at each of the sampled sites in Tims Branch, with each concentration corrected using the calibration curve for tin (Appendix A, Figure 10), for depths in the sediments from the surface to 2.5 inches deep.
Figure 3. Tin concentration in sediments along Tims Branch at the different sites where sediments were sampled.
From the figure above, Figure 3, the two sites that seem to have the most significant tin accumulation in the sediments are site 8 and site 20. There are some interesting measurements of tin, such as from 1.5 to 2.5 inches deep at site 14. The tin present in the

ARC-2007-D2540-049-04 Tin Distribution and Fate in Tims Branch
14
sediments from 1.5 to 2.5 inches deep at site 14 suggests that tin may have been in historical effluent to Tims Branch. Multiple samples were taken from sites 8, 9, 12, and 20. In sites 8, 9, and 12, a sandy and a fine sample were taken from each site. In addition, in site 8, multiple samples were collected on March 16, 2011, and these samples are discussed after the discussion after the results of the Summer 2011 sample results. In site 20, which is Beaver Pond 2, four different samples were taken at different locations in Beaver Pond 2, and the approximate locations of each of these samples are shown in the following figure.
Figure 4. Beaver Pond 2 (site 20) with four sampling locations, approximately, where sediment samples were taken.
From Figure 3, tin concentrations in Beaver Pond 2 are highest at the inlet to Beaver Pond 2, which is sampling site 20 BP2D. Beaver Pond 2 is a site for sediment accumulation, as can be seen from Figure 3. The following graph shows the same data as in Figure 3 for tin concentration in sediments along Tims Branch, but the tin concentration is plotted versus approximate distance from A014 Outfall, along Tims Branch. These distances were estimated using Google Maps (2011). Originally, a global positioning system (GPS) device was to be used, but the GPS satellite signals were mostly unavailable while out in the forest and in Tims Branch.

ARC-2007-D2540-049-04 Tin Distribution and Fate in Tims Branch
15
Figure 5. Tin concentration in sediments along Tims Branch versus distance from A014 Outfall.
From the data of tin concentration and distribution in sediments along Tims Branch, it appears that tin has a patchy distribution, with some sites having a relatively high concentration, then sites further downstream with little or no tin, and then a site with a relatively high tin concentration. It appears that from Figure 3, of the seven potential sites for sediment accumulation, which are shown in Figure 1, only two have significant concentrations of tin in the sediments, and these are the weir site (site 8) and Beaver Pond 2 (site 20). This patchy distribution was expected due to the uneven distribution of sediments along Tims Branch, especially along a significant portion of the tributary that originates at the A014 Outfall. This tributary appears to have been more affected by the increased flow rate of water due to the installation of the M-1 air stripper treatment system in 1985 than the main stream of Tims Branch. At a point just downstream of Steed Pond, Tims Branch changes from a losing stream, in which the elevation is above the level of the groundwater and thus water seeps from the stream to the groundwater, to a gaining stream, in which the elevation is below the level of the groundwater and thus groundwater enters Tims Branch. Because of this, the increased flow rate of water due to the M-1 air stripper treatment system may be more of an increase for the part of Tims Branch that is a losing stream than for the part of Tims Branch that is a gaining stream. The first sediment accumulation area along the tributary of Tims Branch that originates at the A014 Outfall is the weir site. On March 16, 2011, Brian B. Looney and Dennis Jackson both collected field samples from the pond at the weir site. They collected a total of 13 samples from this site in order to obtain an estimate for a grid of tin distribution
ARC-2007-D2540-049-04 Tin Distribution and Fate in Tims Branch
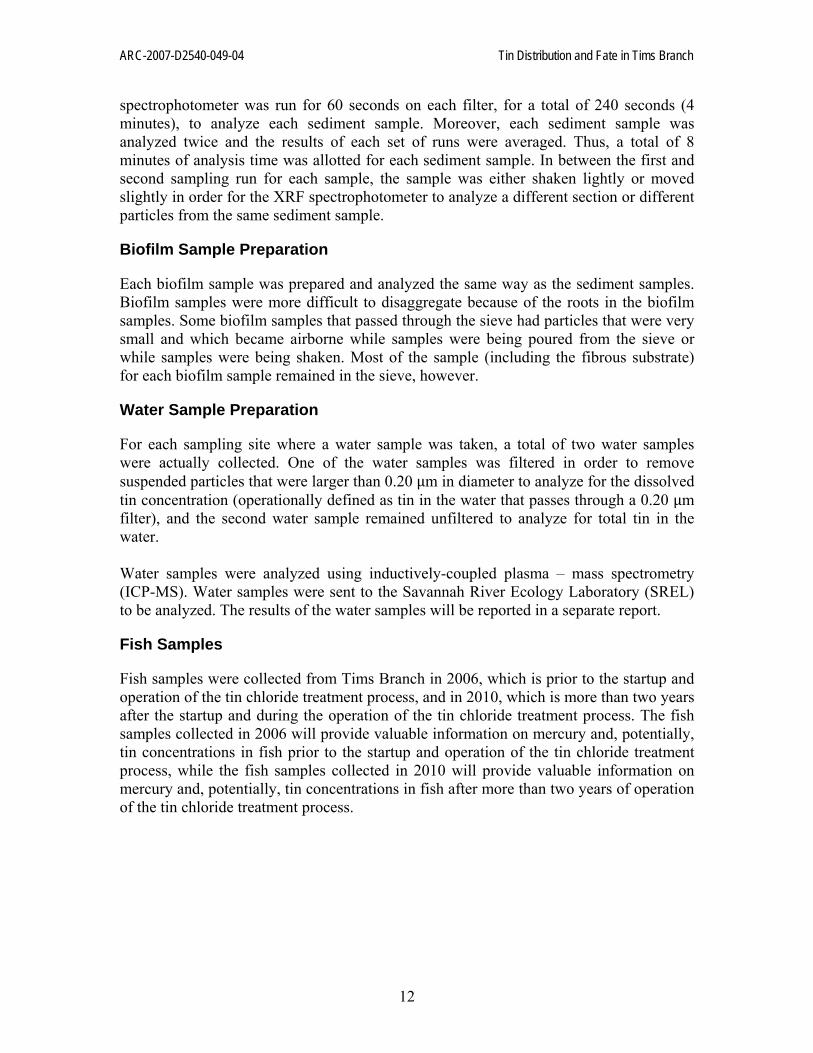
16
within the pond at the weir site. The following diagram shows the approximate locations where the samples were taken at the weir site on March 16, 2011.
Figure 6. The pond at the weir site (site 8), with sediment sampling sites marked.
The M-1 Air Stripper was shut down on Monday, March 14, 2011, for annual maintenance. On Tuesday, March 15, 2011, much of the pond at the weir site was exposed (due to the significantly decreased flow rate of water along the A014 tributary). Sediments were sampled on Wednesday, March 16, 2011, and the sediment sampling sites are shown above in Figure 6. Originally, a full set of transects were planned to be sampled at the weir site. This was planned in order to obtain a grid to determine tin distribution within the pond in the weir site. However, the sediment was too wet and soft to do a full set of transects as planned. Sediments were collected using core liners driven into sediment at accessible locations. During sampling, there was no control for compression of samples (due to vacuum during collecting sediments in core liners at each location), so depths are only approximate and the top 1.5 inches may represent a thicker layer. Thus, this is only a scoping sampling. In each core, two or three intervals were collected: 0 to 1.5 inches, 1.5 to 3 inches, and sometimes 3 to 4.5 inches deep. A total of 31 samples were prepared to be analyzed. The following graph shows the concentrations of tin in the sediments at different locations in the pond at the weir site (site 8), organized from upstream to downstream.

ARC-2007-D2540-049-04 Tin Distribution and Fate in Tims Branch
17
Figure 7. Concentrations of tin in the sediments at different locations within the pond at the weir site (site 8), organized from locations upstream to downstream within the weir site.
The concentration of tin in the sediments at the pond in the weir site appears to be highest at a location just south of the vertical pipe, in a section that had exposed sediments when sediment samples were taken on Wednesday, March 16, 2011. Comparing the concentrations of tin in the sediments in the pond at the weir site (Figure 7) to the concentrations of tin in the sediments at other sites (Figure 3), the weir site has significant tin accumulation in the sediments. Though the highest concentration of tin measured in the sediments along Tims Branch (including the tributary that originates at the A014 Outfall) is right by the A014 Outfall, there does not appear to be tin accumulation in the sediments at this site because this concentration is high only for the first 0.5 inches, and the tin concentration at this site drops significantly, by almost an order of magnitude, in the next 0.5 inches. In addition, the site right by the A014 Outfall has a small surface area, and thus is not a significant site for sediment accumulation. The two sites along Tims Branch (including the A014 tributary) with significant accumulation of tin in the sediments are the weir site (site 8) and Beaver Pond 2 (site 20).
Approximate Calculation of Mass Balance of Tin in Sediments
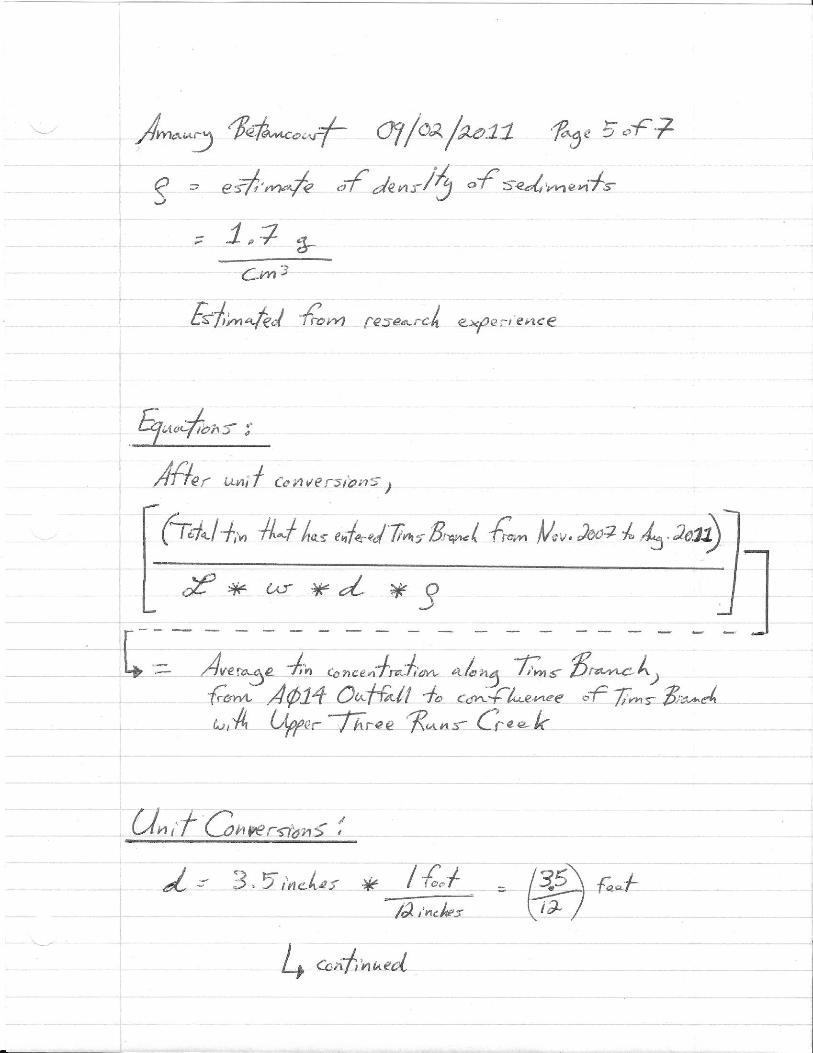
A rough approximation of the theoretical mass balance of tin in Tims Branch can be made through some simple calculations. A sample of the calculations for the mass balance are presented in Appendix D for one set of assumptions, including a length of Tims Branch of 26,000 feet, an average stream width of 6 feet, and a sediment depth with

ARC-2007-D2540-049-04 Tin Distribution and Fate in Tims Branch
18
tin accumulation of 3.5 inches deep. The following steps outline the basic calculations performed to estimate the theoretical mass balance of tin in Tims Branch:
1. Calculate the total estimated amount of tin released in Tims Branch starting in November 2007 up to August 2011.
2. Calculate the average theoretical concentration of tin in the sediments in Tims Branch from the A014 Outfall downstream to the confluence of Tims Branch with Upper Three Runs Creek, based on the total estimated amount of tin released in Tims Branch from November 2007 to August 2011.
The estimated total tin released in Tims Branch from November 2007 to August 2011 is approximately 43 kg. This number is calculated based on the assumptions that the flow rate of groundwater into the system is constant at 450 gallons per minute during the time period, and that the tin concentration in the groundwater is 12.88 micrograms per liter (μg/L). The average theoretical concentration of tin in the sediments in Tims Branch is calculated based on numerous assumptions, which are listed below:
1. The length of Tims Branch from the A014 Outfall to the confluence of Tims Branch with Upper Three Runs Creek is approximately 26,000 feet.
2. The average width of Tims Branch, from the A014 Outfall to the confluence of Tims Branch with Upper Three Runs Creek, is between 6 and 10 feet.
3. The depth of sediments in which tin has accumulated in significant amounts, due to the tin chloride treatment system, is between 1.5 and 3.5 inches.
A range of estimates for the average theoretical concentration of tin in the sediments in Tims Branch was calculated for the different estimated values of stream width and sediment depth in which tin accumulates in significant concentration. The table below shows the range of estimates of the average theoretical concentration of tin in the sediments in Tims Branch based on the assumptions listed above.
Table 2. Estimated Theoretical Average Concentration of Tin in Sediments in Tims Branch from November 2007 to August 2011 and from the A014 Outfall Downstream to the Confluence of Tims
Branch to Upper Three Runs Creek
Estimate of sediment depth (interval, from sediment surface to depth, where tin is significantly present)
Estimate of average width of stream (from A014 Outfall downstream to confluence of Tims Branch with Upper Three Runs Creek)
Estimated average tin concentration
(inches) (feet) (μg/g, or ppm) 1.5 6 46 2.5 6 28 3.5 6 20 1.5 7 40

ARC-2007-D2540-049-04 Tin Distribution and Fate in Tims Branch
19
Estimate of sediment depth (interval, from sediment surface to depth, where tin is significantly present)
Estimate of average width of stream (from A014 Outfall downstream to confluence of Tims Branch with Upper Three Runs Creek)
Estimated average tin concentration
(inches) (feet) (μg/g, or ppm) 2.5 7 24 3.5 7 17 1.5 8 35 2.5 8 21 3.5 8 15 1.5 9 31 2.5 9 18 3.5 9 13 1.5 10 28 2.5 10 17 3.5 10 12
Although the width of the stream varies significantly from the A014 Outfall downstream to the confluence of Tims Branch with Upper Three Runs Creek, the best estimate of the average width of the stream, based on field observations, is approximately 6 feet. In addition, based on the results of the sediment samples (Figure 3 and Figure 7), tin is present in significant concentrations in the sediments from the sediment surface (0 inches) to approximately 2.5 inches deep. Therefore, based on field observations and results of the present study, the best estimate of the theoretical average tin concentration in the sediments in Tims Branch (from the A014 Outfall downstream to the confluence of Tims Branch with Upper Three Runs Creek) is approximately 28 μg/g. From the experimental data in the present research, the estimated average tin concentration in the sediments in Tims Branch was calculated for the top 2.5 inches of sediment depth and from the A014 Outfall downstream to the confluence of Tims Branch with Upper Three Runs Creek. This average was calculated by using all of the measurements for all of the sites for the depth intervals of 0 to 0.5 inches, 0.5 to 1 inch, 1 to 1.5 inches, and 1.5 to 2.5 inches. This estimated average concentration is approximately 31 μg/g, which is relatively comparable to the theoretical approximation of the average tin concentration in the sediments, which is 28 μg/g. In addition, because extra data was taken at the weir site, an average tin concentration in the sediments at the weir site was calculated. The percent of the total tin released in Tims Branch from the tin chloride treatment process, from November 2011 to March 2011, that has deposited at the weir site has been estimated. Based on the data on tin in the sediments in the pond at the weir site (Figure 7), the estimated average concentration of tin in the top 1.5 inches of sediments is approximately 85 μg/g. This calculation is based on the assumption that tin accumulates significantly in the top 1.5 inches of sediments in the pond at the weir site, and tin is not significantly present at a depth of 3 inches or lower. The following satellite image shows a close-up of the weir site, and a larger scale view of where the weir site is located along Tims Branch is in Appendix B (Figure 13).

ARC-2007-D2540-049-04 Tin Distribution and Fate in Tims Branch
20
Figure 8. Satellite image of weir site (site 8) with mass balance calculations for tin in the sediments in the pond at the weir site.
The mass balance calculation for the pond at the weir site estimates a total deposition of approximately 1 kg of tin at the pond, from November 2007 to March 2011. This accounts for approximately 2.9% of the total tin released into Tims Branch from the tin chloride treatment process from November 2007 to March 2011. This calculation is based on the estimate that the pond has a surface area of approximately 200 square meters (m2). In addition, based on the results of the March 2011 samples of sediments from the weir site, most of the tin in the sediments at this site is estimated to be in the top 1.5 inches (in.). Furthermore, as with the mass balance of tin for the stretch of Tims Branch from the A014 Outfall to the confluence of Tims Branch with Upper Three Runs Creek, the density of the sediments are estimated to be approximately 1.7 grams per cubic centimeter (g/cm3). The weir site therefore appears to be a site of significant tin accumulation. Despite being a significant site for tin accumulation in the sediments, it seems that most of the tin in Tims Branch is past the weir site because only approximately 2.9% of the total tin released from the tin chloride treatment system from November 2007 to March 2011 is calculated to be at the weir site, and based on the sites sampled in the present research, it is not expected that any significant sediment accumulation sites exist upstream of the weir site. In addition, based on the estimated average tin concentration in the sediments

ARC-2007-D2540-049-04 Tin Distribution and Fate in Tims Branch
21
along Tims Branch from the A014 Outfall to the confluence of Tims Branch with Upper Three Runs Creek, which is approximately 31 μg/g, Beaver Pond 2 has concentrations of tin in the upper layers of sediment (Figure 3) that are relatively higher than the estimated average tin concentration in the sediments along Tims Branch. Relatively high concentrations of tin were detected in the upper 1.5 inches of sediments from site 3, which is approximately 400 feet downstream of the A014 Outfall, though the stream at this site is relatively narrow and does not appear to be a significant place for sediment or tin accumulation. The highest concentration of tin was observed in the upper 0.5 inches of sediments from site 2, and this site is by the A014 Outfall. However, this site does not appear to be a site for significant tin accumulation in the sediments because tin concentration was high only in the upper 0.5 inches of sediment and the surface area of this site is relatively small. The weir site and Beaver Pond 2 appear to be the significant sites of tin accumulation in the sediments in Tims Branch from the A014 Outfall downstream to the confluence of Tims Branch with Upper Three Runs Creek.
Tin Concentration in Biofilm Samples
In addition to analyzing the concentration of tin in sediments, biofilm samples were collected at some sites along the A014 tributary and one biofilm sample was collected from the main stream of Tims Branch. The following figure presents the data for biofilm from the sites where biofilm samples were collected.
Figure 9. Tin concentration in biofilm along Tims Branch.

ARC-2007-D2540-049-04 Tin Distribution and Fate in Tims Branch
22
As can be seen from the biofilm data in Figure 9, it appears that tin concentration is significantly higher in biofilm samples (Figure 9) than in sediment samples (Figure 3) at each site. It is likely that biofilm grows better in locations along Tims Branch where the flow of water is slower, such as a pocket along the stream, or along the edge of the stream, or even in a section of the stream with debris. In these sections and locations along the stream, because of the decreased flow of water, tin may accumulate more in the sediments and in biofilm. At sites along the stream where plants and roots are present, biofilm can grow on or attach to the roots. In addition, suspended sediment particles, which may include tin particles, can attach to the roots and biofilm. Over time, these suspended sediments may accumulate in the biofilm and therefore have a relatively high concentration of tin. It is also possible that some of the microorganisms in the biofilm samples may be taking in tin from the water and/or sediments attached to the biofilm. The biofilm scoping experiment warrants further research to explain these high concentrations of tin in the biofilm samples collected in this study. As discussed above, the biofilm samples were not collected through traditional means, and the results of the biofilm tests are meant only to be interpreted as a scoping study that deserve further research.

ARC-2007-D2540-049-04 Tin Distribution and Fate in Tims Branch
23
5. CONCLUSION
Tin concentration in sediments along the tributary of Tims Branch that originates at the A014 Outfall is elevated at various sites along this tributary. In particular, tin appears to be accumulating at two sites, one of which is on the main stream of Tims Branch, downstream of the confluence between the A014 tributary and the main stream of Tims Branch. The first site where tin appears to be accumulating is at the weir site (site 8), which is along the A014 tributary. The weir site is located approximately 1900 feet downstream of the A014 Outfall. Downstream of the confluence of the A014 tributary with the main stream of Tims Branch, tin concentration was elevated as well in the sediments in Beaver Pond 2 (site 20), which is located approximately 6700 feet downstream of the A014 Outfall. In the sites sampled downstream of Beaver Pond 2, no tin was detected until the last sampled site, site 14, which is a point on Tims Branch just upstream of the confluence of Tims Branch with Upper Three Runs Creek. However, the tin detected at this site (site 14) was only detected at a sediment depth between 1.5 to 2.5 inches, which may indicate that the tin is from historical effluent released into Tims Branch and not from the tin chloride treatment process. Therefore, further studies of the effects of the tin chloride treatment process on the flora and fauna in Tims Branch should focus on the weir site (site 8) and Beaver Pond 2 (site 20). These two sites appear to have the most tin accumulation from the sites sampled in the present research. The highest tin concentration in the sediments was located just near the A014 Outfall, at site 2, but this high concentration was only detected near the surface of the sediments, between 0 to 0.5 inches, and the tin concentration dropped significantly at a depth between 0.5 to 1 inch. In addition, the surface area of this site is small. Therefore, the sediments near the A014 Outfall do not appear to be significantly accumulating tin. The results of the biofilm analysis showed significant accumulation of tin in biofilm along different sites in the tributary of Tims Branch that originates at the A014 Outfall. The measured tin concentrations in the biofilm samples for the various sites sampled were each more than an order of magnitude greater than the tin concentration in the sediments at each respective site. However, the biofilm study in the present research should only be interpreted as a scoping study because biofilm samples were not collected by conventional means. Further studies on biofilm in Tims Branch are necessary and will most likely provide interesting insight into distribution and fate of tin in Tims Branch. The results of the present research may be useful for the potential future use of tin chloride treatment for other sites that are contaminated with mercury, such as the East Fork Poplar Creek (EFPC) in Oak Ridge, Tennessee. Further research on the distribution and fate of tin in Tims Branch and the effects of tin on the flora and fauna in Tims Branch will help to evaluate the success of the tin chloride treatment process. The results of water and fish samples from Tims Branch will be presented in a separate report.

ARC-2007-D2540-049-04 Tin Distribution and Fate in Tims Branch
24
6. REFERENCES
Amouroux, D., E. Tessier, and O. F. X. Donard. 2000. Volatilization of organotin compounds from estuarine and coastal environments, Environmental Science and Technology, 34:988-995.
Google. Maps and satellite images obtained from Google Maps.
<http://maps.google.com>. Accessed August 31, 2011. Hayes, D. W. 1984. Uranium Studies in the Tims Branch and Steed Pond System (U).
Westinghouse Savannah River Company, Savannah River Site, Aiken, South Carolina, 29808. Document identification is DPST-84-847, with additional numbers of 350897
Looney, B.B., D.G. Jackson, M.J. Peterson, T.J. Mathews, G. Southworth, L. Bryan, M.
Paller, C.A. Eddy-Dilek, and N. Halverson, 2010. Assessing Potential Impacts of Stannous Chloride Based Mercury Treatment on a Receiving Stream using Real-World Data from Tims Branch, Savannah River Site, SRNL-STI-2010-00393, available from the U.S. Department of Energy Office of Scientific and Technical Information (OSTI), <http://www.osti.gov>.
Savannah River Site (SRS) website. <http://www.srs.gov/general/about/history1.htm>.
Last updated February 22, 2010. Accessed August 27, 2011. Thompson, M. and R.J. Howarth, 1973. The rapid estimation of control and precision by
duplicate determinations, Analyst, 98:153-160.

ARC-2007-D2540-049-04 Tin Distribution and Fate in Tims Branch
25
APPENDIX A: Tin Calibration Curve
Preparation of Tin Standards and Tin Calibration Curve
Uncontaminated sediments from the control site, which is the tributary of Tims Branch that originates from the new A011 Outfall (Site 6), were collected and disaggregated to be used to prepare tin standards. A tin standard solution was prepared by mixing a measured mass of tin chloride dihydrate with water. The final tin concentration of this tin standard solution was 1.346 grams of tin per liter of solution (g/L, tin basis). To create a tin calibration curve for the X-ray fluorescence (XRF) spectrophotometer, individual samples of control site sediment were spiked with different volumes of the tin standard solution to create different sediment concentrations of tin. These different volumes are shown in the following table, with the resulting concentrations.
Table 3. Tin Concentrations in Reference Standard Sediment Samples
Soil concentration (added) Units Tin added Units
Stock added Units
Exact sediment mass Units
-- ug/g 0 ug 0 mL N/A g 28.6 ug/g 336 ug 0.25 mL 11.77 g 60.5 ug/g 673 ug 0.50 mL 11.12 g 87.5 ug/g 1010 ug 0.75 mL 11.53 g 113 ug/g 1350 ug 1.00 mL 11.87 g 175 ug/g 2020 ug 1.50 mL 11.55 g 234 ug/g 2690 ug 2.00 mL 11.50 g
The tin standards were then analyzed using the X-ray fluorescence (XRF) spectrophotometer and the results are plotted in the following graph.

ARC-2007-D2540-049-04 Tin Distribution and Fate in Tims Branch
26
Figure 10. Calibration curve for tin analyzed with the Thermo Scientific Niton XL3t GOLDD+ X-Ray Fluorescence (XRF) Spectrophotometer. Each n value represents the number of runs that each
reference sample was analyzed.
The calibration curve for tin is a plot of the concentration of tin measured volumetrically versus the concentration of tin measured using the X-ray fluorescence (XRF) spectrophotometer in each of the reference standard sediment samples for tin (Figure 10). The concentrations are measured in micrograms of tin per gram of sediment (μg of Sn/g of sediment, or simply μg/g), and these units are equivalent to parts per million (ppm). From the calibration curve for tin, it can be seen that the slope of the graph of tin concentration measured volumetrically versus tin concentration measured using the XRF spectrophotometer is approximately 1.150 and the y-intercept is close to zero. Therefore, as shown on the graph, the reference concentration of tin is approximated as the product of the correction factor, which is 1.150, and the concentration of tin measured using the XRF spectrophotometer.
Relative Standard Deviation (RSD) Discussion
The relative standard deviation (RSD) is a method of approximating the standard deviations of multiple samples over a range of concentrations. For this study, the RSD for tin was estimated in two ways: 1) based on multiple runs (n=6 to 12) of the reference standards, and 2) based on the differences observed in duplicate measurements for all of

ARC-2007-D2540-049-04 Tin Distribution and Fate in Tims Branch
27
the Tims Branch samples and standards. The RSD for all other elements was estimated based on the differences observed in duplicate measurements for all of the Tims Branch samples (no standards were run for these elements and the concentrations reported are based on the factory calibration). The various estimates of RSD are summarized below. The first method used to calculate the RSD for tin was by using the reference standards. Based on the standard curve (Figure 10), the instrument responses for all of the runs of the reference standards were each multiplied by 1.150 to generate a table of estimated concentrations. The standard deviation (sigma, or σ) was calculated and a bias correction was made for each concentration to achieve a more accurate estimate of population standard deviation at each concentration. The RSD is defined as the following linear equation: σconcentration = (RSD)(concentration). Therefore, the slope of the graph of concentration versus the standard deviation is the relative standard deviation (RSD). This analysis is shown in the following figure, which is a plot of the estimated tin concentration in each reference standard sediment sample versus standard deviation for each reference standard concentration. The relative standard deviation for tin in the following figure is based on the 26 sets of reference standard runs (52 total measurements, because each sample was run in duplicate).
Figure 11. Plot of the estimated tin concentration versus the standard deviation for each reference standard sediment sample.

ARC-2007-D2540-049-04 Tin Distribution and Fate in Tims Branch
28
The plot of the estimated tin concentration versus the standard deviation for each reference standard sediment sample (Figure 11) shows that the relative standard deviation is approximately 0.16. In addition, RSD values were calculated for the all 31 reported elements in Appendix C. These RSD values were calculated using the duplicate runs for each of the sediment samples analyzed using the XRF spectrophotometer, (see Thompson and Howarth 1973). A maximum of 221 samples (442 XRF analyses) were available to calculate RSD; the actual number of duplicates used for each element varied, however, and included only those duplicates in which both analyses were above the detection limit of the particular element. The resulting RSD values and the number of duplicates used to calculate the RSD are shown in the following table.
Table 4. Relative Standard Deviation (RSD) Values for the 31 Reported Elements and the Number of Duplicates used in Calculating the RSD
Element RSD n Element RSD n Sn 0.18 93 Mn 0.12 71 U 0.19 128 Ba 0.14 61 Ni 0.10 20 Cd 0.20 30 Mo 0.21 95 Pd 0.16 22 Zr 0.24 214 Nb 0.22 177 Sr 0.17 189 Bi 0.22 39 Rb 0.14 162 Cr 0.20 103 Th 0.22 177 V 0.18 197 Pb 0.14 62 Ti 0.17 214 As 0.20 68 Ca 0.22 101 Zn 0.14 151 K 0.16 212 W 0.13 3 Al 0.07 208 Cu 0.13 72 P 0.15 100 Co 0.06 4 Si 0.04 221 Fe 0.14 214 Cl 0.16 220
S 0.22 89
The RSD values for all the elements range from about 4% to 24% (0.04 to 0.24) with most values between 10% and 20% (0.01 to 0.02). This is typical performance for a XRF Spectrophotometer. As shown above, the RSD for tin was calculated two different ways: a) using only the reference standard sediment samples (26 sample sets, 52 measurements), and b) using all sample that had detectable tin in both duplicate runs (93 sample sets, 186 measurements). For tin, the universal duplicates included the prepared tin standards, standard reference materials from the United States National Institute of Standards and Technology (NIST), specifically NIST reference standard 2702 marine sediments, and many of the unknown sediment samples collected along Tims Branch. The RSD for tin based on the universal duplicates was 0.18, which is similar to the 0.16 estimated using the analyses of the reference standards.

ARC-2007-D2540-049-04 Tin Distribution and Fate in Tims Branch
29
APPENDIX B: Tims Branch Sites
The following satellite images, which were taken from Google Maps (2011), show the outline of Tims Branch and some tributaries. The following satellite image begins upstream of the Wetland Treatment System and up to a point downstream of Beaver Pond 1, which is a former farm pond. Sediment sampling sites are marked in all the satellite images.
Figure 12. Tims Branch, from just upstream of the wetland treatment system to just downstream of Beaver Pond 1.
The following satellite image begins at the A014 Outfall, then to the confluence of the A014 tributary with the tributary that originates at the A011 Outfall, then continuing through to the confluence of the tributary that originates at the A014 Outfall and the main stream of Tims Branch, up to a Savannah River Ecology Laboratory (SREL) sampling station, which is just downstream of Steed Pond. No sediment samples were taken from Steed Pond because it is a radiological posted area.

ARC-2007-D2540-049-04 Tin Distribution and Fate in Tims Branch
30
Figure 13. Tims Branch, from the tributary that originates from the A014 Outfall, then the confluence with the A011 tributary, then the confluence of the A014 tributary and the main stream of
Tims Branch, downstream to a Savannah River Ecology Laboratory sampling station that is just downstream of Steed Pond.
The following satellite image shows Tims Branch from a Savannah River Ecology Laboratory (SREL) sampling station just downstream of Steed Pond, down through Beaver Pond 3 and Beaver Pond 4.

ARC-2007-D2540-049-04 Tin Distribution and Fate in Tims Branch
31
Figure 14. Tims Branch, from a Savannah River Ecology Laboratory (SREL) sampling station downstream of Steed Pond, down through Beaver Pond 3 and to Beaver Pond 4.
The following satellite image shows Tims Branch from just upstream of Beaver Pond 4 to the confluence of Tims Branch with Upper Three Runs Creek.

ARC-2007-D2540-049-04 Tin Distribution and Fate in Tims Branch
32
Figure 15. Tims Branch, from Beaver Pond 4 down to the confluence between Tims Branch and Upper Three Runs Creek.
In total, 19 sediment samples were taken along Tims Branch, starting at a point just downstream of the A014 Outfall, then along the tributary that originates at the A014 Outfall, then a control sample at the tributary that originates at the A011 Outfall, then another control sample at Beaver Pond 1, which is a former farm pond, that is on the main stream of Tims Branch and that is upstream of the confluence of the A014 tributary and the main stream of Tims Branch, then along Tims Branch up to a point just upstream of the confluence of the main stream of Tims Branch and Upper Three Runs Creek.

ARC-2007-D2540-049-04 Tin Distribution and Fate in Tims Branch
33
APPENDIX C: Concentrations of Elements in Standards, Sediments, and Biofilm, from X-Ray Fluorescence (XRF)
Spectrophotometer Analysis

g/g SEM g/g SEM g/g SEM g/g SEM g/g SEM g/g SEM
Blank (SiO2) n/a < 12 < 3 < 25 < 2 < 25 < 3Blank (SiO2) n/a < 12 < 3 < 25 < 2 < 25 < 3Blank (SiO2) n/a < 12 < 3 < 25 < 2 < 25 < 3Blank (SiO2) n/a < 12 < 3 < 25 < 2 < 25 < 3Blank (SiO2) n/a < 12 < 3 < 25 < 2 < 25 < 3Blank (SiO2) n/a < 12 < 3 < 25 < 2 < 25 < 3Blank (SiO2) n/a < 12 < 3 < 25 < 2 < 25 < 3Blank (SiO2) n/a < 12 < 3 < 25 < 2 < 25 < 3
NIST 2702 Standard n/a 28 5 16 3 < 25 9 2 269 66 87 15NIST 2702 Standard n/a 31 6 13 2 < 25 9 2 290 71 93 16NIST 2702 Standard n/a 27 5 17 3 < 25 10 2 295 72 91 16NIST 2702 Standard n/a 30 6 13 2 < 25 9 2 296 72 90 16NIST 2702 Standard n/a 32 6 13 3 < 25 8 2 277 67 88 15NIST 2702 Standard n/a 40 7 13 2 < 25 10 2 299 73 90 16NIST 2702 Standard n/a 29 5 15 3 < 25 8 2 287 70 90 16
NIST 2709a STANDARD n/a < 12 6 1 < 25 2 0 130 32 183 32NIST 2709a STANDARD n/a < 12 6 1 < 25 3 1 128 31 182 32NIST 2709a STANDARD n/a < 12 6 1 < 25 < 2 128 31 181 32NIST 2709a STANDARD n/a < 12 8 1 < 25 2 1 124 30 182 32NIST 2709a STANDARD n/a < 12 < 3 < 25 3 1 120 29 183 32NIST 2709a STANDARD n/a < 12 < 3 < 25 3 1 130 32 182 32NIST 2709a STANDARD n/a < 12 8 1 < 25 2 1 110 27 182 32
Control Composite (no added tin) n/a < 12 < 3 < 25 < 2 61 15 9 2Tin Std 28.587 ppm n/a 31 6 < 3 < 25 < 2 84 20 10 2Tin Std 28.587 ppm n/a 31 6 < 3 < 25 < 2 71 17 8 1Tin Std 28.587 ppm n/a 31 6 < 3 < 25 < 2 94 23 7 1Tin Std 28.587 ppm n/a 33 6 < 3 < 25 < 2 95 23 9 2Tin Std 28.587 ppm n/a 22 4 < 3 < 25 < 2 68 17 9 2Tin Std 28.587 ppm n/a 35 6 < 3 < 25 < 2 127 31 6 1Tin Std 60.517 ppm n/a 68 12 < 3 < 25 < 2 80 19 4 1Tin Std 60.517 ppm n/a 63 12 < 3 < 25 < 2 77 19 6 1Tin Std 60.517 ppm n/a 120 22 < 3 < 25 < 2 238 58 9 2Tin Std 60.517 ppm n/a 84 16 < 3 < 25 < 2 93 23 7 1Tin Std 60.517 ppm n/a 56 10 < 3 < 25 < 2 65 16 8 1Tin Std 87.548 ppm n/a 96 18 < 3 < 25 < 2 181 44 9 2Tin Std 87.548 ppm n/a 96 18 < 3 < 25 < 2 76 19 5 1Tin Std 87.548 ppm n/a 83 15 < 3 < 25 < 2 63 15 9 2Tin Std 113.387 ppm n/a 108 20 < 3 < 25 < 2 66 16 8 1Tin Std 113.387 ppm n/a 106 20 < 3 < 25 < 2 77 19 7 1Tin Std 113.387 ppm n/a 109 20 < 3 < 25 < 2 82 20 9 2Tin Std 113.387 ppm n/a 96 18 < 3 < 25 < 2 103 25 7 1Tin Std 113.387 ppm n/a 99 18 < 3 < 25 < 2 55 13 5 1Tin Std 113.387 ppm n/a 137 25 < 3 < 25 < 2 239 58 7 1Tin Std 174.792 ppm n/a 180 33 < 3 < 25 < 2 75 18 8 1Tin Std 174.792 ppm n/a 161 30 < 3 < 25 < 2 76 19 14 2Tin Std 174.792 ppm n/a 145 27 < 3 < 25 < 2 76 19 7 1Tin Std 174.792 ppm n/a 169 31 < 3 < 25 < 2 168 41 11 2
Zr SrSn U Ni MoStd / Core / Sample ID Avg Depth

g/g SEM g/g SEM g/g SEM g/g SEM g/g SEM g/g SEM
Zr SrSn U Ni MoStd / Core / Sample ID Avg Depth
Tin Std 234.069 ppm n/a 228 42 < 3 < 25 < 2 82 20 9 2Tin Std 234.069 ppm n/a 274 51 < 3 < 25 < 2 73 18 9 2Tin Std 234.069 ppm n/a 201 37 < 3 < 25 < 2 67 16 16 3Tin Std 234.069 ppm n/a 236 44 < 3 < 25 < 2 82 20 8 1Tin Std 234.069 ppm n/a 247 46 < 3 < 25 < 2 114 28 7 1
Control 0-0.5 in. 0.25 < 12 < 3 < 25 < 2 42 10 6 1Control 0.5-1 in. 0.75 < 12 < 3 < 25 < 2 162 39 8 1Control 1-1.5 in. 1.25 < 12 < 3 < 25 < 2 194 47 7 1
Control 1.5-2.5 in. 2.00 < 12 < 3 < 25 < 2 80 20 12 2Control 2.5-3.5 in. 3.00 < 12 < 3 < 25 < 2 200 49 14 2
Site 2, 0-0.5 in. 0.25 381 70 < 3 < 25 < 2 92 22 7 1Site 2, 0.5-1 in. 0.75 49 9 < 3 < 25 < 2 93 23 6 1Site 2, 1-1.5 in. 1.25 53 10 < 3 < 25 < 2 269 66 5 1
Site 2, 1.5-2.5 in. 2.00 21 4 < 3 < 25 < 2 39 10 10 2Site 2, 2.5-3.5 in. 3.00 15 3 < 3 < 25 < 2 42 10 9 2Site 2, 3.5-4.5 in. 4.00 < 12 < 3 < 25 < 2 183 45 3 1Site 3, 0-0.5 in. 0.25 70 13 5 1 < 25 < 2 59 14 3 1Site 3, 0.5-1 in. 0.75 77 14 7 1 < 25 < 2 64 16 5 1Site 3, 1-1.5 in. 1.25 54 10 5 1 < 25 2 0 119 29 5 1Site 5, 0-0.5 in. 0.25 107 20 15 3 < 25 24 5 3838 936 5 1Site 5, 0.5-1 in. 0.75 51 9 9 2 < 25 33 7 3166 772 5 1Site 5, 1-1.5 in. 1.25 18 3 4 1 < 25 16 3 561 137 6 1
Site 5, 1.5-2.5 in. 2.00 < 12 < 3 < 25 4 1 216 53 4 1Site 5, 2.5-3.5 in. 3.00 < 12 4 1 < 25 3 1 200 49 6 1Site 5, 3.5-4.5 in. 4.00 56 10 10 2 < 25 17 4 873 213 9 2TBP-0, Control n/a < 12 4 1 < 25 < 2 122 30 7 1TBP-1, 0-1.5 in. 0.75 34 6 10 2 < 25 4 1 388 94 35 6TBP-1, 1.5-3 in. 2.25 < 12 < 3 < 25 < 2 43 11 6 1TBP-1, 3-4.5 in. 3.75 < 12 11 2 < 25 < 2 309 75 40 7TBP-2, 0-1.5 in. 0.75 53 10 16 3 < 25 9 2 519 126 45 8TBP-2, 1.5-3 in. 2.25 < 12 16 3 < 25 4 1 496 121 47 8TBP-2, 3-4.5 in. 3.75 < 12 16 3 < 25 3 1 399 97 56 10TBP-3, 0-1.5 in. 0.75 115 21 15 3 < 25 4 1 533 130 52 9TBP-3, 1.5-3 in. 2.25 48 9 13 2 < 25 3 1 359 87 36 6TBP-4, 0-1.5 in. 0.75 122 23 18 3 < 25 4 1 596 145 45 8TBP-4, 1.5-3 in. 2.25 < 12 13 2 < 25 5 1 459 112 32 6TBP-4, 3-4.5 in. 3.75 < 12 10 2 < 25 < 2 360 88 21 4TBP-5, 0-1.5 in. 0.75 21 4 < 3 < 25 < 2 133 32 8 1TBP-5, 1.5-3 in. 2.25 < 12 < 3 < 25 < 2 80 20 10 2TBP-6, 0-1.5 in. 0.75 265 49 13 2 < 25 < 2 450 110 39 7TBP-6, 1.5-3 in. 2.25 < 12 < 3 < 25 < 2 87 21 5 1TBP-6, 3-4.5 in. 3.75 < 12 < 3 < 25 < 2 106 26 7 1TBP-7, 0-1.5 in. 0.75 127 24 8 1 < 25 < 2 517 126 21 4TBP-7, 1.5-3 in. 2.25 28 5 4 1 < 25 < 2 177 43 11 2TBP-8, 0-1.5 in. 0.75 169 31 10 2 < 25 < 2 547 133 28 5TBP-8, 1.5-3 in. 2.25 < 12 < 3 < 25 < 2 89 22 4 1TBP-9, 0-1.5 in. 0.75 114 21 9 2 < 25 < 2 636 155 24 4

g/g SEM g/g SEM g/g SEM g/g SEM g/g SEM g/g SEM
Zr SrSn U Ni MoStd / Core / Sample ID Avg Depth
TBP-9, 1.5-3 in. 2.25 < 12 4 1 < 25 4 1 459 112 5 1TBP-10, 0-1.5 in. 0.75 59 11 7 1 < 25 < 2 329 80 14 2TBP-10, 1.5-3 in. 2.25 < 12 < 3 < 25 < 2 71 17 5 1TBP-11, 0-1.5 in. 0.75 < 12 < 3 < 25 < 2 41 10 3 1TBP-11, 1.5-3 in. 2.25 15 3 < 3 < 25 3 1 283 69 3 0TBP-12, 0-1.5 in. 0.75 27 5 4 1 < 25 < 2 212 52 9 2TBP-12, 1.5-3 in. 2.25 < 12 6 1 < 25 3 1 856 209 7 1TBP-12, 1.5-3 in. 3.75 16 3 8 1 < 25 < 2 1469 358 8 1TBP-13, 0-1.5 in. 0.75 88 16 17 3 < 25 3 1 405 99 26 5TBP-13, 1.5-3 in. 2.25 28 5 4 1 < 25 < 2 128 31 13 2
Site 8, fine, 0-0.5 in. 0.25 222 41 17 3 < 25 < 2 476 116 46 8Site 8, fine, 0.5-1 in. 0.75 195 36 18 3 < 25 4 1 478 117 48 8Site 8, fine, 1-1.5 in. 1.25 178 33 17 3 < 25 4 1 479 117 45 8
Site 8, fine, 1.5-2.5 in. 2.00 139 26 16 3 < 25 4 1 512 125 45 8Site 8, fine, 2.5-3.5 in. 3.00 16 3 15 3 < 25 4 1 539 131 38 7Site 8, fine, 3.5-4.5 in. 4.00 < 12 12 2 < 25 3 1 380 93 28 5Site 8, sandy, 0-0.5 in. 0.25 36 7 4 1 < 25 < 2 91 22 8 1Site 8, sandy, 0.5-1 in. 0.75 < 12 < 3 < 25 < 2 104 25 6 1Site 8, sandy, 1-1.5 in. 1.25 < 12 < 3 < 25 < 2 39 9 5 1
Site 8, sandy, 1.5-2.5 in. 2.00 71 13 5 1 < 25 < 2 182 44 15 3Site 8, sandy, 2.5-3.5 in. 3.00 < 12 < 3 < 25 < 2 256 62 11 2Site 8, sandy, 3.5-4.5 in. 4.00 < 12 < 3 < 25 < 2 436 106 4 1
Site 10, 0-1.5 in. 0.75 < 12 < 3 < 25 < 2 31 8 < 3Site 10, 1.5-3 in. 2.25 < 12 < 3 < 25 < 2 38 9 8 1Site 10, 3-4.5 in. 3.75 < 12 < 3 < 25 < 2 22 5 2 0
Site 9, mid, 0-0.5 in. 0.25 < 12 19 4 < 25 3 1 76 18 5 1Site 9, mid, 0.5-1 in. 0.75 < 12 316 59 230 23 30 6 351 86 26 4Site 9, mid, 1-1.5 in. 1.25 < 12 458 85 273 27 42 9 387 94 38 7
Site 9, mid, 1.5-2.5 in. 2.00 < 12 336 63 209 20 32 7 350 85 42 7Site 9, mid, 2.5-3.5 in. 3.00 < 12 393 73 239 23 34 7 374 91 49 9Site 9, mid, 3.5-4.5 in. 4.00 < 12 236 44 125 12 22 5 364 89 40 7Site 9, mid, 4.5-5.5 in. 5.00 < 12 185 34 77 8 17 4 298 73 33 6Site 9, edge, 0-0.5 in. 0.25 19 3 6 1 < 25 5 1 366 89 9 2Site 9, edge, 0.5-1 in. 0.75 20 4 5 1 < 25 12 3 945 230 7 1Site 9, edge, 1-1.5 in. 1.25 < 12 4 1 < 25 7 2 1186 289 4 1
Site 9, edge, 1.5-2.5 in. 2.00 91 17 17 3 < 25 5 1 2654 647 4 1Site 11, 0-0.5 in. 0.25 < 12 < 3 < 25 < 2 243 59 9 2Site 11, 0.5-1 in. 0.75 < 12 < 3 < 25 < 2 224 55 13 2Site 11, 1-1.5 in. 1.25 < 12 < 3 < 25 < 2 174 42 6 1
Site 11, 1.5-2.5 in. 2.00 < 12 < 3 < 25 < 2 126 31 2 0Site 11, 2.5-3 in. 2.75 < 12 < 3 < 25 < 2 41 10 4 1
Site 12, fine, 0-0.5 in. 0.25 25 5 48 9 < 25 5 1 141 34 12 2Site 12, 0.5-1 in. 0.75 < 12 47 9 < 25 4 1 115 28 13 2Site 12, 1-1.5 in. 1.25 < 12 104 19 < 25 8 2 185 45 15 3
Site 12, 1.5-2.5 in. 2.00 < 12 59 11 < 25 4 1 70 17 8 1Site 12, 2.5-3.5 in. 3.00 < 12 83 15 < 25 7 2 78 19 9 2
Site 12, sandy, 0-0.5 in. 0.25 < 12 < 3 < 25 < 2 60 15 2 0
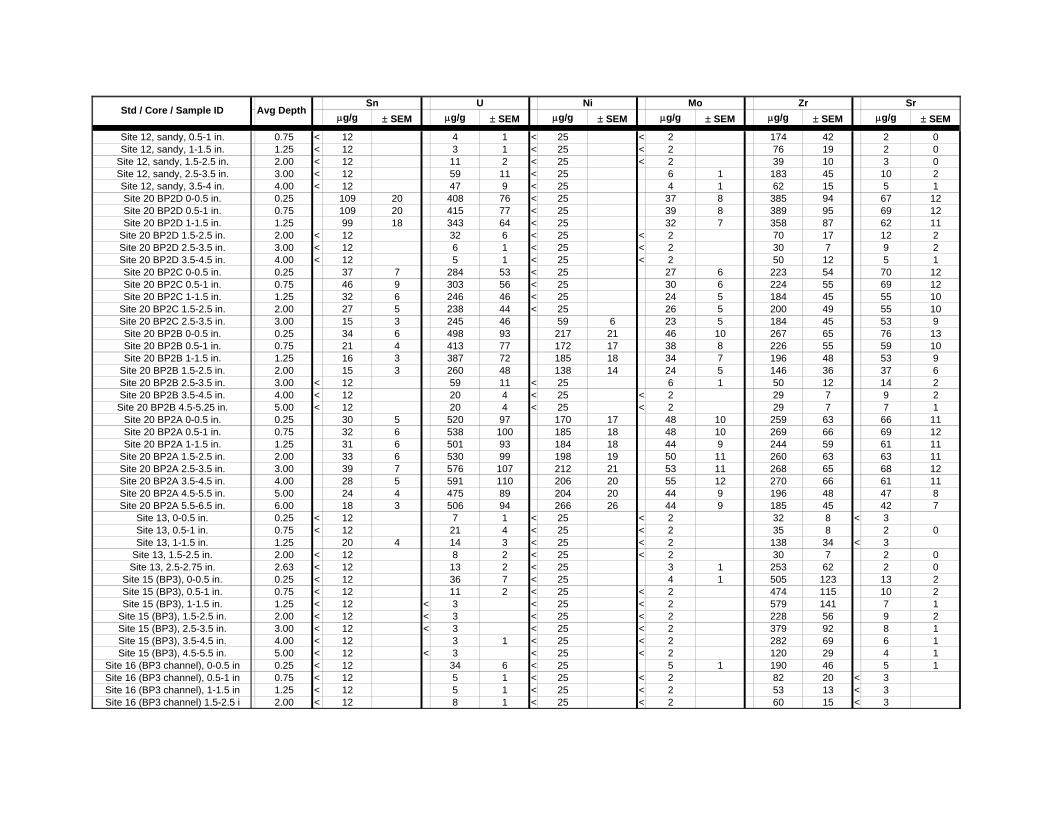
g/g SEM g/g SEM g/g SEM g/g SEM g/g SEM g/g SEM
Zr SrSn U Ni MoStd / Core / Sample ID Avg Depth
Site 12, sandy, 0.5-1 in. 0.75 < 12 4 1 < 25 < 2 174 42 2 0Site 12, sandy, 1-1.5 in. 1.25 < 12 3 1 < 25 < 2 76 19 2 0
Site 12, sandy, 1.5-2.5 in. 2.00 < 12 11 2 < 25 < 2 39 10 3 0Site 12, sandy, 2.5-3.5 in. 3.00 < 12 59 11 < 25 6 1 183 45 10 2Site 12, sandy, 3.5-4 in. 4.00 < 12 47 9 < 25 4 1 62 15 5 1Site 20 BP2D 0-0.5 in. 0.25 109 20 408 76 < 25 37 8 385 94 67 12Site 20 BP2D 0.5-1 in. 0.75 109 20 415 77 < 25 39 8 389 95 69 12Site 20 BP2D 1-1.5 in. 1.25 99 18 343 64 < 25 32 7 358 87 62 11
Site 20 BP2D 1.5-2.5 in. 2.00 < 12 32 6 < 25 < 2 70 17 12 2Site 20 BP2D 2.5-3.5 in. 3.00 < 12 6 1 < 25 < 2 30 7 9 2Site 20 BP2D 3.5-4.5 in. 4.00 < 12 5 1 < 25 < 2 50 12 5 1Site 20 BP2C 0-0.5 in. 0.25 37 7 284 53 < 25 27 6 223 54 70 12Site 20 BP2C 0.5-1 in. 0.75 46 9 303 56 < 25 30 6 224 55 69 12Site 20 BP2C 1-1.5 in. 1.25 32 6 246 46 < 25 24 5 184 45 55 10
Site 20 BP2C 1.5-2.5 in. 2.00 27 5 238 44 < 25 26 5 200 49 55 10Site 20 BP2C 2.5-3.5 in. 3.00 15 3 245 46 59 6 23 5 184 45 53 9Site 20 BP2B 0-0.5 in. 0.25 34 6 498 93 217 21 46 10 267 65 76 13Site 20 BP2B 0.5-1 in. 0.75 21 4 413 77 172 17 38 8 226 55 59 10Site 20 BP2B 1-1.5 in. 1.25 16 3 387 72 185 18 34 7 196 48 53 9
Site 20 BP2B 1.5-2.5 in. 2.00 15 3 260 48 138 14 24 5 146 36 37 6Site 20 BP2B 2.5-3.5 in. 3.00 < 12 59 11 < 25 6 1 50 12 14 2Site 20 BP2B 3.5-4.5 in. 4.00 < 12 20 4 < 25 < 2 29 7 9 2Site 20 BP2B 4.5-5.25 in. 5.00 < 12 20 4 < 25 < 2 29 7 7 1
Site 20 BP2A 0-0.5 in. 0.25 30 5 520 97 170 17 48 10 259 63 66 11Site 20 BP2A 0.5-1 in. 0.75 32 6 538 100 185 18 48 10 269 66 69 12Site 20 BP2A 1-1.5 in. 1.25 31 6 501 93 184 18 44 9 244 59 61 11
Site 20 BP2A 1.5-2.5 in. 2.00 33 6 530 99 198 19 50 11 260 63 63 11Site 20 BP2A 2.5-3.5 in. 3.00 39 7 576 107 212 21 53 11 268 65 68 12Site 20 BP2A 3.5-4.5 in. 4.00 28 5 591 110 206 20 55 12 270 66 61 11Site 20 BP2A 4.5-5.5 in. 5.00 24 4 475 89 204 20 44 9 196 48 47 8Site 20 BP2A 5.5-6.5 in. 6.00 18 3 506 94 266 26 44 9 185 45 42 7
Site 13, 0-0.5 in. 0.25 < 12 7 1 < 25 < 2 32 8 < 3Site 13, 0.5-1 in. 0.75 < 12 21 4 < 25 < 2 35 8 2 0Site 13, 1-1.5 in. 1.25 20 4 14 3 < 25 < 2 138 34 < 3
Site 13, 1.5-2.5 in. 2.00 < 12 8 2 < 25 < 2 30 7 2 0Site 13, 2.5-2.75 in. 2.63 < 12 13 2 < 25 3 1 253 62 2 0
Site 15 (BP3), 0-0.5 in. 0.25 < 12 36 7 < 25 4 1 505 123 13 2Site 15 (BP3), 0.5-1 in. 0.75 < 12 11 2 < 25 < 2 474 115 10 2Site 15 (BP3), 1-1.5 in. 1.25 < 12 < 3 < 25 < 2 579 141 7 1
Site 15 (BP3), 1.5-2.5 in. 2.00 < 12 < 3 < 25 < 2 228 56 9 2Site 15 (BP3), 2.5-3.5 in. 3.00 < 12 < 3 < 25 < 2 379 92 8 1Site 15 (BP3), 3.5-4.5 in. 4.00 < 12 3 1 < 25 < 2 282 69 6 1Site 15 (BP3), 4.5-5.5 in. 5.00 < 12 < 3 < 25 < 2 120 29 4 1
Site 16 (BP3 channel), 0-0.5 in 0.25 < 12 34 6 < 25 5 1 190 46 5 1Site 16 (BP3 channel), 0.5-1 in 0.75 < 12 5 1 < 25 < 2 82 20 < 3Site 16 (BP3 channel), 1-1.5 in 1.25 < 12 5 1 < 25 < 2 53 13 < 3Site 16 (BP3 channel) 1.5-2.5 i 2.00 < 12 8 1 < 25 < 2 60 15 < 3

g/g SEM g/g SEM g/g SEM g/g SEM g/g SEM g/g SEM
Zr SrSn U Ni MoStd / Core / Sample ID Avg Depth
Site 16 (BP3 channel) 2.5-3.5 i 3.00 < 12 < 3 < 25 < 2 22 5 < 3Site 17 (BP4) 0-0.5 in. 0.25 < 12 59 11 < 25 6 1 405 99 19 3Site 17 (BP4) 0.5-1 in. 0.75 < 12 58 11 < 25 4 1 480 117 24 4Site 17 (BP4) 1-1.5 in. 1.25 < 12 51 10 < 25 4 1 512 125 24 4
Site 17 (BP4) 1.5-2.5 in. 2.00 < 12 51 9 < 25 4 1 420 102 17 3Site 17 (BP4) 2.5-3.5 in. 3.00 < 12 30 6 < 25 2 1 421 103 13 2Site 17 (BP4) 3.5-4.5 in. 4.00 < 12 4 1 < 25 < 2 420 102 6 1Site 17 (BP4) 4.5-5.5 in. 5.00 < 12 6 1 < 25 < 2 463 113 7 1
Site 19 (BP5 pond) 0-0.5 in. 0.25 < 12 62 12 < 25 7 1 328 80 6 1Site 19 (BP5 pond) 0.5-1 in. 0.75 < 12 69 13 < 25 6 1 311 76 6 1Site 19 (BP5 pond) 1-1.5 in. 1.25 < 12 44 8 < 25 4 1 201 49 5 1
Site 19 (BP5 pond) 1.5-2.5 in. 2.00 < 12 23 4 < 25 2 0 152 37 5 1Site 19 (BP5 pond) 2.5-3.5 in. 3.00 < 12 24 5 < 25 < 2 348 85 3 1Site 18 (BP5 channel) 0-0.5 in. 0.25 < 12 159 30 < 25 13 3 600 146 14 3Site 18 (BP5 channel) 0.5-1 in. 0.75 < 12 142 26 < 25 14 3 544 133 16 3Site 18 (BP5 channel) 1-1.5 in. 1.25 < 12 73 14 < 25 4 1 435 106 11 2Site 18 (BP5 channel) 1.5-2.5 i 2.00 < 12 36 7 < 25 4 1 420 102 6 1Site 18 (BP5 channel) 2.5-3.5 i 3.00 < 12 6 1 < 25 < 2 66 16 < 3Site 18 (BP5 channel) 3.5-4.5 i 4.00 < 12 4 1 < 25 < 2 45 11 < 3Site 18 (BP5 channel) 4.5-5.5 i 5.00 < 12 14 3 < 25 < 2 382 93 3 1Site 18 (BP5 channel) 5.5-6 in. 6.00 20 4 9 2 < 25 11 2 872 213 2 0
Site 14, 0-0.5 in. 0.25 < 12 < 3 < 25 3 1 259 63 < 3Site 14, 0.5-1 in. 0.75 23 4 14 3 < 25 43 9 4357 1062 2 0Site 14, 1-1.5 in. 1.25 < 12 4 1 < 25 14 3 1128 275 2 0
Site 14, 1.5-2.5 in. 2.00 44 8 49 9 < 25 72 15 11367 2771 4 1Site 14, 2.5-3.5 in. 3.00 16 3 < 3 < 25 19 4 628 153 < 3Site 14, 3.5-3.75 in. 3.63 < 12 8 2 < 25 11 2 2474 603 < 3
control biofilm n/a < 12 10 2 < 25 < 2 229 56 38 7site 1 biofilm n/a 10640 1966 31 6 249 24 3 1 237 58 24 4Site 2 biofilm n/a 9737 1799 37 7 266 26 5 1 167 41 30 5Site 3 biofilm n/a 2577 476 29 5 < 25 3 1 293 71 20 3Site 5 biofilm n/a 2071 383 24 4 < 25 4 1 345 84 19 3Site 9 biofilm n/a 585 108 37 7 < 25 11 2 1455 355 27 5Site 13 biofilm n/a < 12 172 32 59 6 31 6 256 63 14 2

Blank (SiO2) n/aBlank (SiO2) n/aBlank (SiO2) n/aBlank (SiO2) n/aBlank (SiO2) n/aBlank (SiO2) n/aBlank (SiO2) n/aBlank (SiO2) n/a
NIST 2702 Standard n/aNIST 2702 Standard n/aNIST 2702 Standard n/aNIST 2702 Standard n/aNIST 2702 Standard n/aNIST 2702 Standard n/aNIST 2702 Standard n/a
NIST 2709a STANDARD n/aNIST 2709a STANDARD n/aNIST 2709a STANDARD n/aNIST 2709a STANDARD n/aNIST 2709a STANDARD n/aNIST 2709a STANDARD n/aNIST 2709a STANDARD n/a
Control Composite (no added tin) n/aTin Std 28.587 ppm n/aTin Std 28.587 ppm n/aTin Std 28.587 ppm n/aTin Std 28.587 ppm n/aTin Std 28.587 ppm n/aTin Std 28.587 ppm n/aTin Std 60.517 ppm n/aTin Std 60.517 ppm n/aTin Std 60.517 ppm n/aTin Std 60.517 ppm n/aTin Std 60.517 ppm n/aTin Std 87.548 ppm n/aTin Std 87.548 ppm n/aTin Std 87.548 ppm n/aTin Std 113.387 ppm n/aTin Std 113.387 ppm n/aTin Std 113.387 ppm n/aTin Std 113.387 ppm n/aTin Std 113.387 ppm n/aTin Std 113.387 ppm n/aTin Std 174.792 ppm n/aTin Std 174.792 ppm n/aTin Std 174.792 ppm n/aTin Std 174.792 ppm n/a
Std / Core / Sample ID Avg Depthg/g SEM g/g SEM g/g SEM g/g SEM g/g SEM g/g SEM
< 2 < 3 < 4 < 2.0 < 7 < 35< 2 < 3 < 4 < 2.0 < 7 < 35< 2 < 3 < 4 < 2.0 < 7 < 35< 2 < 3 < 4 < 2.0 < 7 < 35< 2 < 3 < 4 < 2.0 < 7 < 35< 2 < 3 < 4 < 2.0 < 7 < 35< 2 < 3 < 4 < 2.0 < 7 < 35< 2 < 3 < 4 < 2.0 < 7 < 35
67 9 25 6 117 17 34.9 6.9 480 69 < 3571 10 27 6 123 18 36.6 7.2 493 71 < 3570 10 27 6 113 16 40.2 8.0 501 72 < 3569 9 30 7 119 17 35.5 7.0 481 69 < 3568 9 27 6 115 16 36.7 7.3 475 69 < 3569 10 27 6 120 17 38.1 7.5 497 72 < 3570 10 28 6 120 17 38.5 7.6 487 70 < 3551 7 14 3 < 4 7.3 1.4 98 14 < 3551 7 12 3 < 4 7.8 1.5 92 13 < 3550 7 14 3 < 4 8.3 1.6 92 13 < 3550 7 14 3 < 4 7.0 1.4 93 13 < 3550 7 13 3 < 4 7.3 1.4 92 13 < 3550 7 14 3 < 4 7.1 1.4 93 13 < 3550 7 13 3 < 4 7.2 1.4 98 14 < 355 1 4 1 < 4 < 2.0 24 3 < 355 1 5 1 < 4 < 2.0 28 4 < 355 1 3 1 < 4 < 2.0 24 4 < 354 1 3 1 < 4 < 2.0 21 3 < 355 1 5 1 < 4 < 2.0 20 3 < 356 1 4 1 < 4 < 2.0 23 3 < 355 1 4 1 < 4 < 2.0 27 4 < 353 0 4 1 < 4 < 2.0 16 2 < 354 1 4 1 < 4 < 2.0 20 3 < 354 1 8 2 < 4 < 2.0 29 4 < 355 1 3 1 < 4 10.4 2.1 21 3 < 355 1 3 1 < 4 < 2.0 19 3 < 355 1 4 1 < 4 < 2.0 25 4 < 354 1 4 1 < 4 < 2.0 22 3 < 355 1 3 1 < 4 < 2.0 19 3 < 354 0 4 1 < 4 < 2.0 25 4 < 354 0 4 1 < 4 < 2.0 22 3 < 355 1 3 1 < 4 < 2.0 17 3 < 356 1 3 1 < 4 < 2.0 21 3 < 353 0 3 1 < 4 < 2.0 19 3 < 355 1 4 1 < 4 < 2.0 26 4 < 354 1 3 1 < 4 < 2.0 28 4 < 355 1 4 1 < 4 < 2.0 25 4 < 354 1 4 1 < 4 < 2.0 28 4 < 354 1 3 1 < 4 < 2.0 19 3 < 35
Zn WRb Th Pb As

Std / Core / Sample ID Avg Depth
Tin Std 234.069 ppm n/aTin Std 234.069 ppm n/aTin Std 234.069 ppm n/aTin Std 234.069 ppm n/aTin Std 234.069 ppm n/a
Control 0-0.5 in. 0.25Control 0.5-1 in. 0.75Control 1-1.5 in. 1.25
Control 1.5-2.5 in. 2.00Control 2.5-3.5 in. 3.00
Site 2, 0-0.5 in. 0.25Site 2, 0.5-1 in. 0.75Site 2, 1-1.5 in. 1.25
Site 2, 1.5-2.5 in. 2.00Site 2, 2.5-3.5 in. 3.00Site 2, 3.5-4.5 in. 4.00Site 3, 0-0.5 in. 0.25Site 3, 0.5-1 in. 0.75Site 3, 1-1.5 in. 1.25Site 5, 0-0.5 in. 0.25Site 5, 0.5-1 in. 0.75Site 5, 1-1.5 in. 1.25
Site 5, 1.5-2.5 in. 2.00Site 5, 2.5-3.5 in. 3.00Site 5, 3.5-4.5 in. 4.00TBP-0, Control n/aTBP-1, 0-1.5 in. 0.75TBP-1, 1.5-3 in. 2.25TBP-1, 3-4.5 in. 3.75TBP-2, 0-1.5 in. 0.75TBP-2, 1.5-3 in. 2.25TBP-2, 3-4.5 in. 3.75TBP-3, 0-1.5 in. 0.75TBP-3, 1.5-3 in. 2.25TBP-4, 0-1.5 in. 0.75TBP-4, 1.5-3 in. 2.25TBP-4, 3-4.5 in. 3.75TBP-5, 0-1.5 in. 0.75TBP-5, 1.5-3 in. 2.25TBP-6, 0-1.5 in. 0.75TBP-6, 1.5-3 in. 2.25TBP-6, 3-4.5 in. 3.75TBP-7, 0-1.5 in. 0.75TBP-7, 1.5-3 in. 2.25TBP-8, 0-1.5 in. 0.75TBP-8, 1.5-3 in. 2.25TBP-9, 0-1.5 in. 0.75
g/g SEM g/g SEM g/g SEM g/g SEM g/g SEM g/g SEM
Zn WRb Th Pb As
6 1 3 1 < 4 < 2.0 29 4 < 353 0 6 1 < 4 < 2.0 24 3 < 355 1 3 1 < 4 < 2.0 25 4 < 356 1 4 1 < 4 < 2.0 19 3 < 355 1 4 1 < 4 < 2.0 24 4 < 352 0 < 3 < 4 < 2.0 9 1 < 355 1 5 1 < 4 < 2.0 27 4 < 354 1 6 1 < 4 < 2.0 33 5 < 356 1 3 1 < 4 < 2.0 78 11 < 355 1 6 1 11 2 < 2.0 216 31 < 354 0 < 3 < 4 < 2.0 19 3 < 354 1 2 1 < 4 < 2.0 7 1 < 354 1 4 1 < 4 < 2.0 15 2 < 355 1 < 3 < 4 < 2.0 17 2 < 357 1 < 3 < 4 < 2.0 6 1 < 35
< 2 < 3 < 4 < 2.0 13 2 < 353 0 < 3 < 4 < 2.0 18 3 < 354 1 4 1 < 4 < 2.0 24 3 < 354 1 4 1 < 4 < 2.0 20 3 < 353 0 23 5 < 4 < 2.0 30 4 33 42 0 25 6 < 4 < 2.0 13 2 < 354 1 7 2 < 4 < 2.0 < 7 < 354 1 3 1 < 4 < 2.0 < 7 < 355 1 13 3 < 4 < 2.0 11 2 < 356 1 13 3 < 4 < 2.0 33 5 < 355 1 6 1 < 4 < 2.0 < 7 < 3518 2 21 5 23 3 8.4 1.7 141 20 < 352 0 3 1 < 4 < 2.0 < 7 < 3516 2 24 5 22 3 8.7 1.7 99 14 < 3523 3 30 7 35 5 11.5 2.3 210 30 < 3524 3 31 7 35 5 10.5 2.1 164 24 < 3522 3 36 8 35 5 12.2 2.4 128 18 < 3523 3 29 7 34 5 8.4 1.7 191 28 < 3516 2 20 4 22 3 6.7 1.3 152 22 < 3521 3 31 7 34 5 8.8 1.7 205 30 < 3515 2 22 5 23 3 5.7 1.1 139 20 < 3510 1 16 4 11 2 4.9 1.0 83 12 < 354 1 5 1 < 4 < 2.0 14 2 < 354 1 4 1 < 4 < 2.0 15 2 < 3516 2 27 6 25 4 8.3 1.6 130 19 < 352 0 4 1 < 4 < 2.0 11 2 < 354 1 4 1 < 4 < 2.0 12 2 < 358 1 16 4 9 1 4.3 0.9 68 10 < 354 0 9 2 < 4 < 2.0 30 4 < 3511 1 18 4 15 2 4.7 0.9 93 13 < 35
< 2 4 1 < 4 < 2.0 < 7 < 359 1 21 5 9 1 6.1 1.2 81 12 < 35

Std / Core / Sample ID Avg Depth
TBP-9, 1.5-3 in. 2.25TBP-10, 0-1.5 in. 0.75TBP-10, 1.5-3 in. 2.25TBP-11, 0-1.5 in. 0.75TBP-11, 1.5-3 in. 2.25TBP-12, 0-1.5 in. 0.75TBP-12, 1.5-3 in. 2.25TBP-12, 1.5-3 in. 3.75TBP-13, 0-1.5 in. 0.75TBP-13, 1.5-3 in. 2.25
Site 8, fine, 0-0.5 in. 0.25Site 8, fine, 0.5-1 in. 0.75Site 8, fine, 1-1.5 in. 1.25
Site 8, fine, 1.5-2.5 in. 2.00Site 8, fine, 2.5-3.5 in. 3.00Site 8, fine, 3.5-4.5 in. 4.00Site 8, sandy, 0-0.5 in. 0.25Site 8, sandy, 0.5-1 in. 0.75Site 8, sandy, 1-1.5 in. 1.25
Site 8, sandy, 1.5-2.5 in. 2.00Site 8, sandy, 2.5-3.5 in. 3.00Site 8, sandy, 3.5-4.5 in. 4.00
Site 10, 0-1.5 in. 0.75Site 10, 1.5-3 in. 2.25Site 10, 3-4.5 in. 3.75
Site 9, mid, 0-0.5 in. 0.25Site 9, mid, 0.5-1 in. 0.75Site 9, mid, 1-1.5 in. 1.25
Site 9, mid, 1.5-2.5 in. 2.00Site 9, mid, 2.5-3.5 in. 3.00Site 9, mid, 3.5-4.5 in. 4.00Site 9, mid, 4.5-5.5 in. 5.00Site 9, edge, 0-0.5 in. 0.25Site 9, edge, 0.5-1 in. 0.75Site 9, edge, 1-1.5 in. 1.25
Site 9, edge, 1.5-2.5 in. 2.00Site 11, 0-0.5 in. 0.25Site 11, 0.5-1 in. 0.75Site 11, 1-1.5 in. 1.25
Site 11, 1.5-2.5 in. 2.00Site 11, 2.5-3 in. 2.75
Site 12, fine, 0-0.5 in. 0.25Site 12, 0.5-1 in. 0.75Site 12, 1-1.5 in. 1.25
Site 12, 1.5-2.5 in. 2.00Site 12, 2.5-3.5 in. 3.00
Site 12, sandy, 0-0.5 in. 0.25
g/g SEM g/g SEM g/g SEM g/g SEM g/g SEM g/g SEM
Zn WRb Th Pb As
3 0 4 1 < 4 < 2.0 23 3 < 356 1 11 2 < 4 < 2.0 45 6 < 35
< 2 3 1 < 4 < 2.0 < 7 < 35< 2 2 1 < 4 < 2.0 < 7 < 35< 2 4 1 < 4 < 2.0 < 7 < 35
5 1 8 2 < 4 < 2.0 21 3 < 353 0 23 5 < 4 < 2.0 19 3 < 353 0 27 6 < 4 < 2.0 27 4 < 3510 1 17 4 13 2 4.4 0.9 88 13 < 355 1 9 2 < 4 3.5 0.7 40 6 < 3523 3 30 7 38 5 9.2 1.8 223 32 < 3524 3 33 7 38 5 7.3 1.4 224 32 < 3524 3 31 7 39 6 7.1 1.4 222 32 < 3523 3 30 7 36 5 8.8 1.7 207 30 < 3521 3 30 7 32 5 6.8 1.3 229 33 < 3515 2 21 5 19 3 6.0 1.2 143 21 < 355 1 5 1 < 4 < 2.0 19 3 < 352 0 4 1 < 4 < 2.0 15 2 < 352 0 3 1 < 4 < 2.0 < 7 < 355 1 9 2 < 4 < 2.0 38 5 < 356 1 6 1 < 4 < 2.0 20 3 < 35
< 2 4 1 < 4 < 2.0 10 1 < 35< 2 < 3 < 4 < 2.0 < 7 < 35
3 0 < 3 < 4 < 2.0 6 1 < 35< 2 3 1 < 4 < 2.0 < 7 < 35
2 0 2 1 < 4 < 2.0 < 7 < 3542 6 19 4 5 1 3.5 0.7 33 5 < 3562 8 16 4 11 2 4.7 0.9 41 6 < 3549 7 16 3 12 2 4.5 0.9 40 6 < 3557 8 19 4 15 2 6.4 1.3 47 7 < 3538 5 17 4 10 1 4.9 1.0 34 5 < 3531 4 13 3 7 1 3.7 0.7 31 5 < 352 0 8 2 < 4 < 2.0 22 3 < 35
< 2 18 4 < 4 < 2.0 12 2 < 35< 2 16 3 < 4 < 2.0 < 7 < 35
2 0 38 8 < 4 < 2.0 9 1 < 355 1 6 1 < 4 < 2.0 14 2 < 356 1 9 2 < 4 < 2.0 22 3 < 356 1 5 1 < 4 < 2.0 < 7 < 35
< 2 2 1 < 4 < 2.0 < 7 < 353 0 3 1 < 4 < 2.0 < 7 < 358 1 5 1 < 4 < 2.0 30 4 < 357 1 5 1 < 4 < 2.0 23 3 < 3515 2 8 2 < 4 < 2.0 34 5 < 358 1 4 1 < 4 < 2.0 < 7 < 3511 2 3 1 < 4 < 2.0 < 7 < 35
< 2 < 3 < 4 < 2.0 < 7 < 35

Std / Core / Sample ID Avg Depth
Site 12, sandy, 0.5-1 in. 0.75Site 12, sandy, 1-1.5 in. 1.25
Site 12, sandy, 1.5-2.5 in. 2.00Site 12, sandy, 2.5-3.5 in. 3.00Site 12, sandy, 3.5-4 in. 4.00Site 20 BP2D 0-0.5 in. 0.25Site 20 BP2D 0.5-1 in. 0.75Site 20 BP2D 1-1.5 in. 1.25
Site 20 BP2D 1.5-2.5 in. 2.00Site 20 BP2D 2.5-3.5 in. 3.00Site 20 BP2D 3.5-4.5 in. 4.00Site 20 BP2C 0-0.5 in. 0.25Site 20 BP2C 0.5-1 in. 0.75Site 20 BP2C 1-1.5 in. 1.25
Site 20 BP2C 1.5-2.5 in. 2.00Site 20 BP2C 2.5-3.5 in. 3.00Site 20 BP2B 0-0.5 in. 0.25Site 20 BP2B 0.5-1 in. 0.75Site 20 BP2B 1-1.5 in. 1.25
Site 20 BP2B 1.5-2.5 in. 2.00Site 20 BP2B 2.5-3.5 in. 3.00Site 20 BP2B 3.5-4.5 in. 4.00Site 20 BP2B 4.5-5.25 in. 5.00
Site 20 BP2A 0-0.5 in. 0.25Site 20 BP2A 0.5-1 in. 0.75Site 20 BP2A 1-1.5 in. 1.25
Site 20 BP2A 1.5-2.5 in. 2.00Site 20 BP2A 2.5-3.5 in. 3.00Site 20 BP2A 3.5-4.5 in. 4.00Site 20 BP2A 4.5-5.5 in. 5.00Site 20 BP2A 5.5-6.5 in. 6.00
Site 13, 0-0.5 in. 0.25Site 13, 0.5-1 in. 0.75Site 13, 1-1.5 in. 1.25
Site 13, 1.5-2.5 in. 2.00Site 13, 2.5-2.75 in. 2.63
Site 15 (BP3), 0-0.5 in. 0.25Site 15 (BP3), 0.5-1 in. 0.75Site 15 (BP3), 1-1.5 in. 1.25
Site 15 (BP3), 1.5-2.5 in. 2.00Site 15 (BP3), 2.5-3.5 in. 3.00Site 15 (BP3), 3.5-4.5 in. 4.00Site 15 (BP3), 4.5-5.5 in. 5.00
Site 16 (BP3 channel), 0-0.5 in 0.25Site 16 (BP3 channel), 0.5-1 in 0.75Site 16 (BP3 channel), 1-1.5 in 1.25Site 16 (BP3 channel) 1.5-2.5 i 2.00
g/g SEM g/g SEM g/g SEM g/g SEM g/g SEM g/g SEM
Zn WRb Th Pb As
< 2 3 1 < 4 < 2.0 < 7 < 35< 2 2 1 < 4 < 2.0 < 7 < 35< 2 < 3 < 4 < 2.0 < 7 < 35
8 1 4 1 < 4 < 2.0 14 2 < 356 1 < 3 < 4 < 2.0 < 7 < 3561 8 29 7 37 5 8.2 1.6 185 27 < 3562 8 27 6 40 6 8.7 1.7 185 27 < 3553 7 28 6 30 4 11.4 2.3 183 26 < 356 1 5 1 < 4 < 2.0 42 6 < 351 0 < 3 < 4 < 2.0 11 2 < 351 0 3 1 < 4 < 2.0 16 2 < 3548 7 24 5 27 4 10.6 2.1 219 32 < 3550 7 25 6 31 4 8.3 1.7 214 31 < 3541 6 19 4 19 3 6.6 1.3 195 28 < 3540 5 22 5 16 2 8.4 1.7 206 30 < 3541 6 18 4 18 3 7.3 1.4 213 31 < 3571 10 26 6 32 5 7.2 1.4 206 30 < 3558 8 22 5 24 4 5.8 1.1 175 25 < 3555 8 19 4 19 3 7.1 1.4 157 23 < 3537 5 13 3 8 1 5.4 1.1 108 16 < 357 1 4 1 < 4 < 2.0 32 5 < 35
< 2 < 3 < 4 < 2.0 20 3 < 35< 2 < 3 < 4 < 2.0 < 7 < 35
72 10 24 5 30 4 9.0 1.8 196 28 < 3575 10 26 6 31 4 9.5 1.9 220 32 < 3569 9 23 5 31 4 8.2 1.6 213 31 < 3573 10 23 5 31 5 8.9 1.8 195 28 < 3579 11 25 6 33 5 10.1 2.0 214 31 < 3580 11 26 6 34 5 8.0 1.6 190 27 < 3563 9 17 4 21 3 5.9 1.2 136 20 < 3566 9 17 4 21 3 7.2 1.4 146 21 < 35
< 2 < 3 < 4 2.7 0.5 < 7 < 35< 2 < 3 < 4 3.2 0.6 < 7 < 35< 2 < 3 < 4 3.1 0.6 < 7 < 35< 2 < 3 < 4 3.3 0.6 < 7 < 35< 2 6 1 < 4 2.9 0.6 < 7 < 35
8 1 12 3 < 4 < 2.0 19 3 < 353 0 7 2 < 4 < 2.0 < 7 < 352 0 11 2 < 4 < 2.0 < 7 < 354 1 6 1 < 4 < 2.0 < 7 < 353 0 7 2 < 4 < 2.0 < 7 < 352 0 6 1 < 4 < 2.0 < 7 < 35
< 2 5 1 < 4 < 2.0 < 7 < 355 1 4 1 < 4 4.0 0.8 < 7 < 35
< 2 3 1 < 4 < 2.0 < 7 < 35< 2 4 1 < 4 < 2.0 < 7 < 35< 2 3 1 < 4 < 2.0 < 7 < 35

Std / Core / Sample ID Avg Depth
Site 16 (BP3 channel) 2.5-3.5 i 3.00Site 17 (BP4) 0-0.5 in. 0.25Site 17 (BP4) 0.5-1 in. 0.75Site 17 (BP4) 1-1.5 in. 1.25
Site 17 (BP4) 1.5-2.5 in. 2.00Site 17 (BP4) 2.5-3.5 in. 3.00Site 17 (BP4) 3.5-4.5 in. 4.00Site 17 (BP4) 4.5-5.5 in. 5.00
Site 19 (BP5 pond) 0-0.5 in. 0.25Site 19 (BP5 pond) 0.5-1 in. 0.75Site 19 (BP5 pond) 1-1.5 in. 1.25
Site 19 (BP5 pond) 1.5-2.5 in. 2.00Site 19 (BP5 pond) 2.5-3.5 in. 3.00Site 18 (BP5 channel) 0-0.5 in. 0.25Site 18 (BP5 channel) 0.5-1 in. 0.75Site 18 (BP5 channel) 1-1.5 in. 1.25Site 18 (BP5 channel) 1.5-2.5 i 2.00Site 18 (BP5 channel) 2.5-3.5 i 3.00Site 18 (BP5 channel) 3.5-4.5 i 4.00Site 18 (BP5 channel) 4.5-5.5 i 5.00Site 18 (BP5 channel) 5.5-6 in. 6.00
Site 14, 0-0.5 in. 0.25Site 14, 0.5-1 in. 0.75Site 14, 1-1.5 in. 1.25
Site 14, 1.5-2.5 in. 2.00Site 14, 2.5-3.5 in. 3.00Site 14, 3.5-3.75 in. 3.63
control biofilm n/asite 1 biofilm n/aSite 2 biofilm n/aSite 3 biofilm n/aSite 5 biofilm n/aSite 9 biofilm n/aSite 13 biofilm n/a
g/g SEM g/g SEM g/g SEM g/g SEM g/g SEM g/g SEM
Zn WRb Th Pb As
< 2 < 3 < 4 < 2.0 < 7 < 3519 3 13 3 < 4 10.7 2.1 40 6 < 3524 3 16 3 9 1 10.2 2.0 48 7 < 3522 3 18 4 10 1 11.0 2.2 45 7 < 3517 2 13 3 6 1 9.5 1.9 39 6 < 3511 1 14 3 < 4 9.5 1.9 24 3 < 352 0 9 2 < 4 12.8 2.5 < 7 < 352 0 10 2 < 4 12.1 2.4 < 7 < 359 1 7 2 < 4 < 2.0 16 2 < 359 1 6 1 < 4 < 2.0 14 2 < 356 1 3 1 < 4 < 2.0 < 7 < 35
< 2 2 1 < 4 < 2.0 < 7 < 353 0 8 2 < 4 < 2.0 < 7 < 3523 3 19 4 < 4 4.0 0.8 29 4 < 3522 3 13 3 5 1 < 2.0 29 4 < 3511 2 10 2 < 4 < 2.0 14 2 < 355 1 10 2 < 4 < 2.0 < 7 < 35
< 2 < 3 < 4 < 2.0 < 7 < 35< 2 < 3 < 4 < 2.0 6 1 < 35< 2 10 2 < 4 < 2.0 < 7 < 35< 2 25 6 < 4 < 2.0 < 7 < 35< 2 3 1 < 4 < 2.0 < 7 < 35< 2 47 11 < 4 < 2.0 < 7 < 35< 2 9 2 < 4 < 2.0 < 7 < 35< 2 240 54 < 4 < 2.0 < 7 < 35< 2 7 2 < 4 < 2.0 < 7 < 35< 2 48 11 < 4 < 2.0 < 7 < 35
20 3 13 3 59 9 4.3 0.8 350 51 < 3524 3 19 4 23 3 7.9 1.6 273 39 211 2731 4 19 4 22 3 6.9 1.4 300 43 268 3413 2 12 3 12 2 < 2.0 170 25 < 3516 2 13 3 12 2 < 2.0 308 44 < 3514 2 35 8 8 1 < 2.0 161 23 < 3524 3 10 2 < 4 55.7 11.0 36 5 < 35

Blank (SiO2) n/aBlank (SiO2) n/aBlank (SiO2) n/aBlank (SiO2) n/aBlank (SiO2) n/aBlank (SiO2) n/aBlank (SiO2) n/aBlank (SiO2) n/a
NIST 2702 Standard n/aNIST 2702 Standard n/aNIST 2702 Standard n/aNIST 2702 Standard n/aNIST 2702 Standard n/aNIST 2702 Standard n/aNIST 2702 Standard n/a
NIST 2709a STANDARD n/aNIST 2709a STANDARD n/aNIST 2709a STANDARD n/aNIST 2709a STANDARD n/aNIST 2709a STANDARD n/aNIST 2709a STANDARD n/aNIST 2709a STANDARD n/a
Control Composite (no added tin) n/aTin Std 28.587 ppm n/aTin Std 28.587 ppm n/aTin Std 28.587 ppm n/aTin Std 28.587 ppm n/aTin Std 28.587 ppm n/aTin Std 28.587 ppm n/aTin Std 60.517 ppm n/aTin Std 60.517 ppm n/aTin Std 60.517 ppm n/aTin Std 60.517 ppm n/aTin Std 60.517 ppm n/aTin Std 87.548 ppm n/aTin Std 87.548 ppm n/aTin Std 87.548 ppm n/aTin Std 113.387 ppm n/aTin Std 113.387 ppm n/aTin Std 113.387 ppm n/aTin Std 113.387 ppm n/aTin Std 113.387 ppm n/aTin Std 113.387 ppm n/aTin Std 174.792 ppm n/aTin Std 174.792 ppm n/aTin Std 174.792 ppm n/aTin Std 174.792 ppm n/a
Std / Core / Sample ID Avg Depthg/g SEM g/g SEM g/g SEM g/g SEM g/g SEM g/g SEM
< 10 < 45 < 100 < 60 < 35 < 7.0< 10 < 45 < 100 < 60 < 35 < 7.0< 10 < 45 < 100 < 60 < 35 < 7.0< 10 < 45 < 100 < 60 < 35 < 7.0< 10 < 45 < 100 < 60 < 35 < 7.0< 10 < 45 < 100 < 60 < 35 < 7.0< 10 < 45 < 100 < 60 < 35 < 7.0< 10 < 45 < 100 < 60 < 35 < 7.0
118 16 < 45 86464 12084 2002 250 71 10 8.8 1.8123 17 < 45 90772 12687 2112 264 < 35 8.7 1.7121 16 < 45 91525 12792 2099 262 85 12 9.6 1.9116 16 < 45 88386 12353 2017 252 91 13 7.2 1.5125 17 < 45 86890 12144 2030 254 96 13 7.5 1.5128 17 < 45 89526 12512 2113 264 88 12 7.5 1.5116 16 < 45 90224 12610 2067 258 55 8 11.8 2.431 4 < 45 30600 4277 442 55 325 45 10.9 2.228 4 < 45 30561 4271 435 54 339 47 11.5 2.330 4 < 45 30057 4201 441 55 344 48 < 7.028 4 < 45 29939 4184 432 54 358 49 < 7.035 5 < 45 30445 4255 452 56 348 48 7.5 1.528 4 < 45 30241 4227 454 57 352 49 7.9 1.629 4 < 45 30409 4250 457 57 325 45 9.2 1.8
< 10 < 45 10045 1404 < 60 < 35 < 7.0< 10 < 45 11913 1665 < 60 < 35 < 7.0< 10 < 45 9179 1283 < 60 < 35 < 7.0< 10 < 45 6758 944 < 60 < 35 < 7.0< 10 < 45 8345 1166 < 60 < 35 < 7.0< 10 < 45 8545 1194 < 60 < 35 < 7.0< 10 < 45 10122 1415 < 60 < 35 < 7.0< 10 < 45 6782 948 < 60 < 35 < 7.0< 10 < 45 7406 1035 < 60 < 35 < 7.0< 10 < 45 9612 1343 < 60 < 35 < 7.0
21 3 < 45 10753 1503 < 60 < 35 < 7.0< 10 < 45 6856 958 < 60 < 35 < 7.0< 10 < 45 8225 1150 < 60 < 35 < 7.0< 10 < 45 7165 1001 < 60 < 35 < 7.0< 10 < 45 6524 912 < 60 < 35 < 7.0< 10 < 45 7488 1047 < 60 < 35 < 7.0< 10 < 45 6991 977 < 60 < 35 < 7.0< 10 < 45 7542 1054 < 60 < 35 < 7.0< 10 < 45 7468 1044 < 60 < 35 < 7.0< 10 < 45 6618 925 < 60 < 35 < 7.0< 10 < 45 10384 1451 < 60 < 35 < 7.0< 10 < 45 8507 1189 < 60 < 35 < 7.0< 10 < 45 8192 1145 < 60 < 35 < 7.0< 10 < 45 9343 1306 < 60 < 35 < 7.0< 10 < 45 8551 1195 < 60 < 35 < 7.0
Ba CdCu Co Fe Mn

Std / Core / Sample ID Avg Depth
Tin Std 234.069 ppm n/aTin Std 234.069 ppm n/aTin Std 234.069 ppm n/aTin Std 234.069 ppm n/aTin Std 234.069 ppm n/a
Control 0-0.5 in. 0.25Control 0.5-1 in. 0.75Control 1-1.5 in. 1.25
Control 1.5-2.5 in. 2.00Control 2.5-3.5 in. 3.00
Site 2, 0-0.5 in. 0.25Site 2, 0.5-1 in. 0.75Site 2, 1-1.5 in. 1.25
Site 2, 1.5-2.5 in. 2.00Site 2, 2.5-3.5 in. 3.00Site 2, 3.5-4.5 in. 4.00Site 3, 0-0.5 in. 0.25Site 3, 0.5-1 in. 0.75Site 3, 1-1.5 in. 1.25Site 5, 0-0.5 in. 0.25Site 5, 0.5-1 in. 0.75Site 5, 1-1.5 in. 1.25
Site 5, 1.5-2.5 in. 2.00Site 5, 2.5-3.5 in. 3.00Site 5, 3.5-4.5 in. 4.00TBP-0, Control n/aTBP-1, 0-1.5 in. 0.75TBP-1, 1.5-3 in. 2.25TBP-1, 3-4.5 in. 3.75TBP-2, 0-1.5 in. 0.75TBP-2, 1.5-3 in. 2.25TBP-2, 3-4.5 in. 3.75TBP-3, 0-1.5 in. 0.75TBP-3, 1.5-3 in. 2.25TBP-4, 0-1.5 in. 0.75TBP-4, 1.5-3 in. 2.25TBP-4, 3-4.5 in. 3.75TBP-5, 0-1.5 in. 0.75TBP-5, 1.5-3 in. 2.25TBP-6, 0-1.5 in. 0.75TBP-6, 1.5-3 in. 2.25TBP-6, 3-4.5 in. 3.75TBP-7, 0-1.5 in. 0.75TBP-7, 1.5-3 in. 2.25TBP-8, 0-1.5 in. 0.75TBP-8, 1.5-3 in. 2.25TBP-9, 0-1.5 in. 0.75
g/g SEM g/g SEM g/g SEM g/g SEM g/g SEM g/g SEM
Ba CdCu Co Fe Mn
< 10 < 45 9036 1263 < 60 < 35 < 7.0< 10 < 45 7581 1060 < 60 < 35 < 7.0< 10 < 45 7701 1076 < 60 < 35 < 7.0< 10 < 45 6074 849 < 60 < 35 < 7.0< 10 < 45 8495 1187 < 60 < 35 < 7.0< 10 < 45 2905 406 < 60 < 35 < 7.0< 10 < 45 12734 1780 < 60 < 35 < 7.0< 10 < 45 12142 1697 < 60 < 35 < 7.0
73 10 < 45 6248 873 < 60 < 35 < 7.0150 20 < 45 6944 971 < 60 < 35 < 7.0
< 10 < 45 1901 266 < 60 < 35 < 7.0< 10 < 45 1997 279 < 60 < 35 < 7.0< 10 < 45 2510 351 < 60 36 5 < 7.0< 10 < 45 2235 312 < 60 < 35 < 7.0< 10 < 45 4585 641 < 60 < 35 < 7.0< 10 < 45 2852 399 < 60 42 6 < 7.0< 10 < 45 2790 390 < 60 < 35 < 7.0< 10 < 45 4531 633 < 60 < 35 < 7.0< 10 < 45 5082 710 255 32 < 35 < 7.0
43 6 < 45 7932 1109 212 26 53 7 < 7.0< 10 < 45 6910 966 113 14 39 5 < 7.0< 10 < 45 9129 1276 < 60 < 35 < 7.0< 10 < 45 3842 537 < 60 38 5 < 7.0< 10 < 45 6121 856 < 60 < 35 < 7.0
30 4 < 45 13862 1937 298 37 64 9 < 7.0< 10 < 45 8231 1150 < 60 < 35 < 7.0
41 6 < 45 37186 5197 261 33 77 11 < 7.0< 10 < 45 4626 646 < 60 < 35 < 7.0
43 6 < 45 40108 5606 107 13 123 17 < 7.060 8 < 45 48537 6784 324 41 100 14 8.0 1.652 7 < 45 45663 6382 183 23 86 12 < 7.047 6 < 45 52520 7340 99 12 115 16 < 7.061 8 < 45 41566 5809 249 31 85 12 6.6 1.347 6 < 45 34508 4823 227 28 77 11 < 7.059 8 < 45 42460 5934 293 37 93 13 7.3 1.534 5 < 45 29452 4116 < 60 58 8 < 7.025 3 < 45 21118 2951 < 60 46 6 < 7.0
< 10 < 45 6255 874 < 60 < 35 < 7.0< 10 < 45 7493 1047 < 60 < 35 < 7.0
53 7 < 45 39502 5521 261 33 38 5 10.3 2.1< 10 < 45 5224 730 < 60 < 35 < 7.0< 10 < 45 6159 861 < 60 < 35 < 7.0
36 5 < 45 23521 3287 199 25 39 5 < 7.0< 10 < 45 12244 1711 < 60 33 5 < 7.0
40 5 < 45 27132 3792 206 26 < 35 < 7.0< 10 < 45 3647 510 < 60 < 35 < 7.0
36 5 < 45 25709 3593 107 13 < 35 < 7.0

Std / Core / Sample ID Avg Depth
TBP-9, 1.5-3 in. 2.25TBP-10, 0-1.5 in. 0.75TBP-10, 1.5-3 in. 2.25TBP-11, 0-1.5 in. 0.75TBP-11, 1.5-3 in. 2.25TBP-12, 0-1.5 in. 0.75TBP-12, 1.5-3 in. 2.25TBP-12, 1.5-3 in. 3.75TBP-13, 0-1.5 in. 0.75TBP-13, 1.5-3 in. 2.25
Site 8, fine, 0-0.5 in. 0.25Site 8, fine, 0.5-1 in. 0.75Site 8, fine, 1-1.5 in. 1.25
Site 8, fine, 1.5-2.5 in. 2.00Site 8, fine, 2.5-3.5 in. 3.00Site 8, fine, 3.5-4.5 in. 4.00Site 8, sandy, 0-0.5 in. 0.25Site 8, sandy, 0.5-1 in. 0.75Site 8, sandy, 1-1.5 in. 1.25
Site 8, sandy, 1.5-2.5 in. 2.00Site 8, sandy, 2.5-3.5 in. 3.00Site 8, sandy, 3.5-4.5 in. 4.00
Site 10, 0-1.5 in. 0.75Site 10, 1.5-3 in. 2.25Site 10, 3-4.5 in. 3.75
Site 9, mid, 0-0.5 in. 0.25Site 9, mid, 0.5-1 in. 0.75Site 9, mid, 1-1.5 in. 1.25
Site 9, mid, 1.5-2.5 in. 2.00Site 9, mid, 2.5-3.5 in. 3.00Site 9, mid, 3.5-4.5 in. 4.00Site 9, mid, 4.5-5.5 in. 5.00Site 9, edge, 0-0.5 in. 0.25Site 9, edge, 0.5-1 in. 0.75Site 9, edge, 1-1.5 in. 1.25
Site 9, edge, 1.5-2.5 in. 2.00Site 11, 0-0.5 in. 0.25Site 11, 0.5-1 in. 0.75Site 11, 1-1.5 in. 1.25
Site 11, 1.5-2.5 in. 2.00Site 11, 2.5-3 in. 2.75
Site 12, fine, 0-0.5 in. 0.25Site 12, 0.5-1 in. 0.75Site 12, 1-1.5 in. 1.25
Site 12, 1.5-2.5 in. 2.00Site 12, 2.5-3.5 in. 3.00
Site 12, sandy, 0-0.5 in. 0.25
g/g SEM g/g SEM g/g SEM g/g SEM g/g SEM g/g SEM
Ba CdCu Co Fe Mn
< 10 < 45 7218 1009 < 60 < 35 < 7.012 2 < 45 16800 2348 < 60 < 35 < 7.0
< 10 < 45 3783 529 < 60 < 35 < 7.0< 10 < 45 3450 482 < 60 < 35 < 7.0< 10 < 45 4463 624 < 60 < 35 < 7.0< 10 < 45 7480 1045 < 60 < 35 < 7.0< 10 < 45 12212 1707 < 60 < 35 < 7.0
18 2 < 45 14709 2056 < 60 40 5 < 7.042 6 < 45 23714 3314 241 30 < 35 < 7.011 2 < 45 14884 2080 < 60 36 5 < 7.067 9 < 45 44950 6282 232 29 71 10 9.7 1.965 9 < 45 43534 6084 228 28 68 9 8.4 1.764 9 < 45 42033 5875 208 26 71 10 9.4 1.957 8 < 45 41508 5801 185 23 81 11 < 7.052 7 < 45 36607 5116 91 11 75 10 < 7.034 5 < 45 28223 3945 < 60 54 7 < 7.0
< 10 < 45 7109 994 < 60 < 35 < 7.0< 10 < 45 5855 818 < 60 < 35 < 7.0< 10 < 45 4021 562 < 60 34 5 < 7.0
23 3 < 45 13954 1950 < 60 < 35 < 7.0< 10 < 45 8154 1140 < 60 < 35 < 7.0< 10 < 45 2207 309 < 60 44 6 < 7.0< 10 < 45 1083 151 < 60 42 6 < 7.0< 10 < 45 5909 826 < 60 < 35 < 7.0< 10 < 45 1520 212 < 60 < 35 < 7.0< 10 < 45 8203 1147 < 60 < 35 < 7.0
12 2 < 45 21888 3059 238 30 99 14 < 7.023 3 < 45 25285 3534 307 38 153 21 < 7.027 4 < 45 26539 3709 282 35 142 20 < 7.030 4 < 45 33556 4690 333 42 163 22 < 7.013 2 < 45 25185 3520 222 28 126 17 < 7.0
< 10 < 45 21641 3025 232 29 103 14 < 7.0< 10 < 45 11654 1629 < 60 < 35 < 7.0< 10 < 45 5181 724 < 60 < 35 < 7.0< 10 < 45 8400 1174 < 60 < 35 < 7.0
29 4 < 45 7883 1102 < 60 < 35 < 7.0< 10 < 45 6010 840 < 60 < 35 < 7.0< 10 < 45 9883 1381 < 60 < 35 < 7.0< 10 < 45 5297 740 < 60 < 35 < 7.0< 10 < 45 2317 324 < 60 < 35 < 7.0< 10 < 45 4061 568 < 60 < 35 < 7.0< 10 < 45 10326 1443 < 60 < 35 < 7.0< 10 < 45 9219 1289 < 60 < 35 < 7.0< 10 < 45 14648 2047 < 60 < 35 < 7.0< 10 < 45 6754 944 < 60 < 35 < 7.0< 10 < 45 7180 1003 < 60 < 35 < 7.0< 10 < 45 1649 231 < 60 < 35 < 7.0

Std / Core / Sample ID Avg Depth
Site 12, sandy, 0.5-1 in. 0.75Site 12, sandy, 1-1.5 in. 1.25
Site 12, sandy, 1.5-2.5 in. 2.00Site 12, sandy, 2.5-3.5 in. 3.00Site 12, sandy, 3.5-4 in. 4.00Site 20 BP2D 0-0.5 in. 0.25Site 20 BP2D 0.5-1 in. 0.75Site 20 BP2D 1-1.5 in. 1.25
Site 20 BP2D 1.5-2.5 in. 2.00Site 20 BP2D 2.5-3.5 in. 3.00Site 20 BP2D 3.5-4.5 in. 4.00Site 20 BP2C 0-0.5 in. 0.25Site 20 BP2C 0.5-1 in. 0.75Site 20 BP2C 1-1.5 in. 1.25
Site 20 BP2C 1.5-2.5 in. 2.00Site 20 BP2C 2.5-3.5 in. 3.00Site 20 BP2B 0-0.5 in. 0.25Site 20 BP2B 0.5-1 in. 0.75Site 20 BP2B 1-1.5 in. 1.25
Site 20 BP2B 1.5-2.5 in. 2.00Site 20 BP2B 2.5-3.5 in. 3.00Site 20 BP2B 3.5-4.5 in. 4.00Site 20 BP2B 4.5-5.25 in. 5.00
Site 20 BP2A 0-0.5 in. 0.25Site 20 BP2A 0.5-1 in. 0.75Site 20 BP2A 1-1.5 in. 1.25
Site 20 BP2A 1.5-2.5 in. 2.00Site 20 BP2A 2.5-3.5 in. 3.00Site 20 BP2A 3.5-4.5 in. 4.00Site 20 BP2A 4.5-5.5 in. 5.00Site 20 BP2A 5.5-6.5 in. 6.00
Site 13, 0-0.5 in. 0.25Site 13, 0.5-1 in. 0.75Site 13, 1-1.5 in. 1.25
Site 13, 1.5-2.5 in. 2.00Site 13, 2.5-2.75 in. 2.63
Site 15 (BP3), 0-0.5 in. 0.25Site 15 (BP3), 0.5-1 in. 0.75Site 15 (BP3), 1-1.5 in. 1.25
Site 15 (BP3), 1.5-2.5 in. 2.00Site 15 (BP3), 2.5-3.5 in. 3.00Site 15 (BP3), 3.5-4.5 in. 4.00Site 15 (BP3), 4.5-5.5 in. 5.00
Site 16 (BP3 channel), 0-0.5 in 0.25Site 16 (BP3 channel), 0.5-1 in 0.75Site 16 (BP3 channel), 1-1.5 in 1.25Site 16 (BP3 channel) 1.5-2.5 i 2.00
g/g SEM g/g SEM g/g SEM g/g SEM g/g SEM g/g SEM
Ba CdCu Co Fe Mn
< 10 < 45 2068 289 < 60 < 35 < 7.0< 10 < 45 1980 277 < 60 < 35 < 7.0< 10 < 45 3181 445 < 60 < 35 < 7.0< 10 < 45 6084 850 < 60 < 35 < 7.0< 10 < 45 4161 582 < 60 < 35 < 7.0
69 9 < 45 58599 8190 446 56 82 11 9.0 1.871 10 < 45 59565 8325 410 51 104 14 6.9 1.470 9 < 45 62387 8719 345 43 72 10 10.9 2.2
< 10 < 45 12616 1763 < 60 < 35 < 7.0< 10 < 45 4064 568 < 60 < 35 < 7.0< 10 < 45 4168 583 < 60 < 35 < 7.0
52 7 < 45 83017 11603 447 56 < 35 14.6 2.959 8 < 45 73753 10308 389 49 64 9 11.0 2.247 6 < 45 54837 7664 247 31 71 10 7.9 1.646 6 < 45 49984 6986 211 26 57 8 13.2 2.746 6 < 45 43412 6067 207 26 49 7 5.7 1.253 7 < 45 57233 7999 234 29 131 18 < 7.042 6 < 45 46840 6547 < 60 61 8 9.1 1.840 5 < 45 42273 5908 193 24 76 10 < 7.029 4 < 45 29197 4081 < 60 53 7 < 7.0
< 10 < 45 10347 1446 < 60 < 35 < 7.0< 10 < 45 4558 637 < 60 < 35 < 7.0< 10 < 45 3153 441 < 60 < 35 < 7.0
58 8 < 45 59624 8333 219 27 71 10 9.5 1.960 8 < 45 64241 8979 272 34 93 13 < 7.053 7 < 45 59691 8343 222 28 77 11 < 7.053 7 < 45 59243 8280 227 28 94 13 9.2 1.960 8 < 45 60857 8506 243 30 126 17 < 7.053 7 < 45 54160 7570 251 31 120 17 < 7.039 5 < 45 41426 5790 226 28 82 11 < 7.046 6 < 45 42167 5893 268 34 71 10 < 7.0
< 10 < 45 7360 1029 < 60 < 35 < 7.0< 10 < 45 12223 1708 < 60 < 35 < 7.0< 10 < 45 8168 1142 < 60 < 35 < 7.0< 10 < 45 8331 1164 < 60 < 35 < 7.0< 10 < 45 6900 964 < 60 < 35 < 7.0< 10 < 45 6593 922 < 60 < 35 10.4 2.1< 10 < 45 4919 688 < 60 < 35 < 7.0< 10 < 45 2839 397 < 60 < 35 < 7.0< 10 < 45 5148 719 < 60 < 35 < 7.0< 10 < 45 2910 407 < 60 < 35 < 7.0< 10 < 45 2153 301 < 60 < 35 < 7.0< 10 < 45 1820 254 < 60 < 35 < 7.0
11 1 < 45 21473 3001 429 54 < 35 < 7.0< 10 < 45 1405 196 < 60 < 35 < 7.0< 10 < 45 1476 206 < 60 < 35 < 7.0< 10 < 45 1750 245 < 60 < 35 < 7.0

Std / Core / Sample ID Avg Depth
Site 16 (BP3 channel) 2.5-3.5 i 3.00Site 17 (BP4) 0-0.5 in. 0.25Site 17 (BP4) 0.5-1 in. 0.75Site 17 (BP4) 1-1.5 in. 1.25
Site 17 (BP4) 1.5-2.5 in. 2.00Site 17 (BP4) 2.5-3.5 in. 3.00Site 17 (BP4) 3.5-4.5 in. 4.00Site 17 (BP4) 4.5-5.5 in. 5.00
Site 19 (BP5 pond) 0-0.5 in. 0.25Site 19 (BP5 pond) 0.5-1 in. 0.75Site 19 (BP5 pond) 1-1.5 in. 1.25
Site 19 (BP5 pond) 1.5-2.5 in. 2.00Site 19 (BP5 pond) 2.5-3.5 in. 3.00Site 18 (BP5 channel) 0-0.5 in. 0.25Site 18 (BP5 channel) 0.5-1 in. 0.75Site 18 (BP5 channel) 1-1.5 in. 1.25Site 18 (BP5 channel) 1.5-2.5 i 2.00Site 18 (BP5 channel) 2.5-3.5 i 3.00Site 18 (BP5 channel) 3.5-4.5 i 4.00Site 18 (BP5 channel) 4.5-5.5 i 5.00Site 18 (BP5 channel) 5.5-6 in. 6.00
Site 14, 0-0.5 in. 0.25Site 14, 0.5-1 in. 0.75Site 14, 1-1.5 in. 1.25
Site 14, 1.5-2.5 in. 2.00Site 14, 2.5-3.5 in. 3.00Site 14, 3.5-3.75 in. 3.63
control biofilm n/asite 1 biofilm n/aSite 2 biofilm n/aSite 3 biofilm n/aSite 5 biofilm n/aSite 9 biofilm n/aSite 13 biofilm n/a
g/g SEM g/g SEM g/g SEM g/g SEM g/g SEM g/g SEM
Ba CdCu Co Fe Mn
< 10 < 45 722 101 < 60 < 35 < 7.012 2 < 45 35737 4995 399 50 < 35 8.1 1.623 3 < 45 36874 5154 422 53 35 5 < 7.0
< 10 < 45 32098 4486 300 37 45 6 < 7.0< 10 < 45 30608 4278 337 42 41 6 < 7.0< 10 < 45 25907 3621 205 26 < 35 < 7.0< 10 < 45 22775 3183 < 60 < 35 < 7.0< 10 < 45 20119 2812 < 60 < 35 < 7.0< 10 < 45 4714 659 < 60 < 35 < 7.0< 10 < 45 5686 795 194 24 < 35 < 7.0< 10 < 45 1941 271 < 60 < 35 < 7.0< 10 < 45 1250 175 < 60 < 35 < 7.0< 10 < 45 1581 221 < 60 < 35 < 7.0< 10 < 45 18970 2651 87 11 < 35 < 7.0< 10 < 45 11982 1675 < 60 < 35 < 7.0< 10 < 45 5855 818 < 60 < 35 < 7.0< 10 < 45 3424 479 < 60 < 35 < 7.0< 10 < 45 852 119 < 60 < 35 < 7.0< 10 < 45 1088 152 < 60 < 35 < 7.0< 10 < 45 1045 146 < 60 < 35 < 7.0< 10 < 45 865 121 < 60 < 35 < 7.0< 10 < 45 1089 152 101 13 < 35 < 7.0< 10 < 45 1345 188 74 9 < 35 < 7.0< 10 < 45 1513 211 68 8 < 35 < 7.0< 10 < 45 1657 232 < 60 71 10 < 7.0< 10 < 45 615 86 < 60 < 35 < 7.0< 10 < 45 1594 223 < 60 < 35 < 7.0
885 119 < 45 20705 2894 1262 158 < 35 12.7 2.6239 32 316 19 15255 2132 1153 144 < 35 93.7 18.8311 42 363 22 15386 2150 1248 156 < 35 87.0 17.5140 19 137 8 15726 2198 1102 138 < 35 30.5 6.1163 22 217 13 14489 2025 1342 168 < 35 27.0 5.4101 14 < 45 27485 3841 652 81 < 35 13.6 2.728 4 < 45 289151 40413 4103 513 < 35 14.5 2.9

g/g SEM g/g SEM g/g SEM g/g SEM g/g SEM g/g SEM
Blank (SiO2) n/a < 3 < 2 < 4 < 18 < 10 < 400Blank (SiO2) n/a < 3 < 2 < 4 < 18 < 10 < 400Blank (SiO2) n/a < 3 < 2 < 4 < 18 8 1 < 400Blank (SiO2) n/a < 3 < 2 < 4 < 18 13 2 < 400Blank (SiO2) n/a < 3 < 2 < 4 < 18 < 10 < 400Blank (SiO2) n/a < 3 < 2 < 4 < 18 7 1 < 400Blank (SiO2) n/a < 3 < 2 < 4 < 18 8 1 < 400Blank (SiO2) n/a < 3 < 2 < 4 < 18 < 10 < 400
NIST 2702 Standard n/a 4 1 61 13 13 3 489 97 645 117 7258 1211NIST 2702 Standard n/a 4 1 64 14 16 4 487 96 663 120 7498 1251NIST 2702 Standard n/a < 3 63 14 16 4 511 101 683 123 7284 1215NIST 2702 Standard n/a < 3 62 14 19 4 487 96 646 117 7311 1220NIST 2702 Standard n/a < 3 60 13 16 4 478 95 612 110 7130 1189NIST 2702 Standard n/a < 3 64 14 15 3 483 96 661 119 7329 1223NIST 2702 Standard n/a 4 1 63 14 16 4 477 94 661 119 7457 1244
NIST 2709a STANDARD n/a 4 1 11 2 < 4 207 41 370 67 3003 501NIST 2709a STANDARD n/a < 3 11 2 < 4 198 39 360 65 3003 501NIST 2709a STANDARD n/a < 3 10 2 < 4 181 36 384 69 2831 472NIST 2709a STANDARD n/a < 3 10 2 < 4 180 36 367 66 2929 489NIST 2709a STANDARD n/a < 3 10 2 < 4 174 34 355 64 2903 484NIST 2709a STANDARD n/a 4 1 11 2 < 4 202 40 349 63 2923 488NIST 2709a STANDARD n/a < 3 10 2 < 4 172 34 353 64 2964 494
Control Composite (no added tin) n/a < 3 2 0 < 4 33 7 72 13 2780 464Tin Std 28.587 ppm n/a < 3 3 1 < 4 32 6 90 16 2180 364Tin Std 28.587 ppm n/a < 3 2 0 < 4 34 7 79 14 1658 277Tin Std 28.587 ppm n/a < 3 3 1 < 4 16 3 48 9 1292 215Tin Std 28.587 ppm n/a < 3 2 0 < 4 18 4 43 8 1416 236Tin Std 28.587 ppm n/a < 3 2 0 < 4 21 4 59 11 1485 248Tin Std 28.587 ppm n/a < 3 3 1 < 4 < 18 69 13 1721 287Tin Std 60.517 ppm n/a < 3 2 0 < 4 < 18 53 10 1295 216Tin Std 60.517 ppm n/a < 3 2 0 < 4 32 6 73 13 1555 259Tin Std 60.517 ppm n/a < 3 11 2 < 4 27 5 80 15 1785 298Tin Std 60.517 ppm n/a < 3 3 1 < 4 26 5 60 11 1060 177Tin Std 60.517 ppm n/a < 3 3 1 < 4 16 3 56 10 1353 226Tin Std 87.548 ppm n/a < 3 4 1 < 4 52 10 80 14 1600 267Tin Std 87.548 ppm n/a < 3 4 1 < 4 < 18 59 11 1361 227Tin Std 87.548 ppm n/a < 3 2 0 < 4 20 4 57 10 1196 200Tin Std 113.387 ppm n/a < 3 2 0 < 4 < 18 59 11 1447 241Tin Std 113.387 ppm n/a < 3 2 0 < 4 < 18 52 9 1363 227Tin Std 113.387 ppm n/a < 3 2 0 < 4 17 3 77 14 1383 231Tin Std 113.387 ppm n/a < 3 2 0 < 4 23 5 68 12 1650 275Tin Std 113.387 ppm n/a < 3 < 2 < 4 22 4 54 10 1074 179Tin Std 113.387 ppm n/a < 3 5 1 < 4 42 8 83 15 1858 310Tin Std 174.792 ppm n/a < 3 4 1 < 4 < 18 66 12 1747 291Tin Std 174.792 ppm n/a < 3 3 1 < 4 20 4 69 12 1636 273Tin Std 174.792 ppm n/a < 3 2 0 < 4 48 9 70 13 1707 285Tin Std 174.792 ppm n/a < 3 3 1 < 4 < 18 54 10 1347 225
Pd Nb Bi CrStd / Core / Sample ID Avg Depth
V Ti
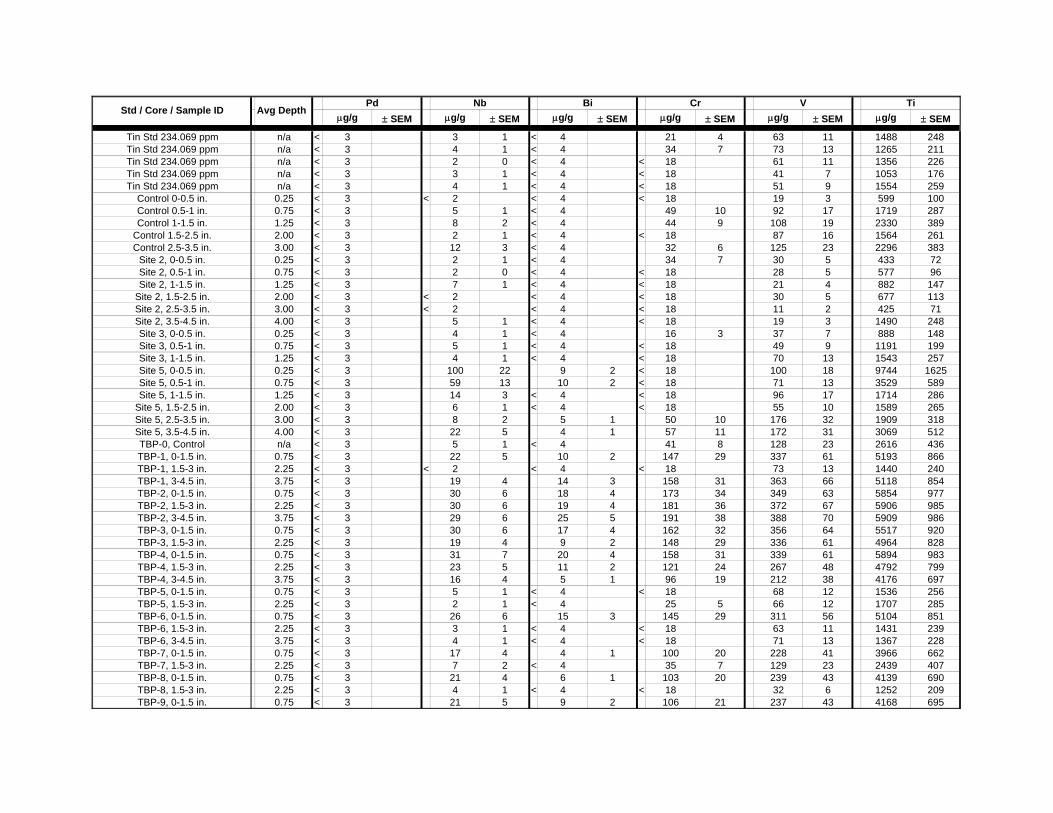
g/g SEM g/g SEM g/g SEM g/g SEM g/g SEM g/g SEM
Pd Nb Bi CrStd / Core / Sample ID Avg Depth
V Ti
Tin Std 234.069 ppm n/a < 3 3 1 < 4 21 4 63 11 1488 248Tin Std 234.069 ppm n/a < 3 4 1 < 4 34 7 73 13 1265 211Tin Std 234.069 ppm n/a < 3 2 0 < 4 < 18 61 11 1356 226Tin Std 234.069 ppm n/a < 3 3 1 < 4 < 18 41 7 1053 176Tin Std 234.069 ppm n/a < 3 4 1 < 4 < 18 51 9 1554 259
Control 0-0.5 in. 0.25 < 3 < 2 < 4 < 18 19 3 599 100Control 0.5-1 in. 0.75 < 3 5 1 < 4 49 10 92 17 1719 287Control 1-1.5 in. 1.25 < 3 8 2 < 4 44 9 108 19 2330 389
Control 1.5-2.5 in. 2.00 < 3 2 1 < 4 < 18 87 16 1564 261Control 2.5-3.5 in. 3.00 < 3 12 3 < 4 32 6 125 23 2296 383
Site 2, 0-0.5 in. 0.25 < 3 2 1 < 4 34 7 30 5 433 72Site 2, 0.5-1 in. 0.75 < 3 2 0 < 4 < 18 28 5 577 96Site 2, 1-1.5 in. 1.25 < 3 7 1 < 4 < 18 21 4 882 147
Site 2, 1.5-2.5 in. 2.00 < 3 < 2 < 4 < 18 30 5 677 113Site 2, 2.5-3.5 in. 3.00 < 3 < 2 < 4 < 18 11 2 425 71Site 2, 3.5-4.5 in. 4.00 < 3 5 1 < 4 < 18 19 3 1490 248Site 3, 0-0.5 in. 0.25 < 3 4 1 < 4 16 3 37 7 888 148Site 3, 0.5-1 in. 0.75 < 3 5 1 < 4 < 18 49 9 1191 199Site 3, 1-1.5 in. 1.25 < 3 4 1 < 4 < 18 70 13 1543 257Site 5, 0-0.5 in. 0.25 < 3 100 22 9 2 < 18 100 18 9744 1625Site 5, 0.5-1 in. 0.75 < 3 59 13 10 2 < 18 71 13 3529 589Site 5, 1-1.5 in. 1.25 < 3 14 3 < 4 < 18 96 17 1714 286
Site 5, 1.5-2.5 in. 2.00 < 3 6 1 < 4 < 18 55 10 1589 265Site 5, 2.5-3.5 in. 3.00 < 3 8 2 5 1 50 10 176 32 1909 318Site 5, 3.5-4.5 in. 4.00 < 3 22 5 4 1 57 11 172 31 3069 512TBP-0, Control n/a < 3 5 1 < 4 41 8 128 23 2616 436TBP-1, 0-1.5 in. 0.75 < 3 22 5 10 2 147 29 337 61 5193 866TBP-1, 1.5-3 in. 2.25 < 3 < 2 < 4 < 18 73 13 1440 240TBP-1, 3-4.5 in. 3.75 < 3 19 4 14 3 158 31 363 66 5118 854TBP-2, 0-1.5 in. 0.75 < 3 30 6 18 4 173 34 349 63 5854 977TBP-2, 1.5-3 in. 2.25 < 3 30 6 19 4 181 36 372 67 5906 985TBP-2, 3-4.5 in. 3.75 < 3 29 6 25 5 191 38 388 70 5909 986TBP-3, 0-1.5 in. 0.75 < 3 30 6 17 4 162 32 356 64 5517 920TBP-3, 1.5-3 in. 2.25 < 3 19 4 9 2 148 29 336 61 4964 828TBP-4, 0-1.5 in. 0.75 < 3 31 7 20 4 158 31 339 61 5894 983TBP-4, 1.5-3 in. 2.25 < 3 23 5 11 2 121 24 267 48 4792 799TBP-4, 3-4.5 in. 3.75 < 3 16 4 5 1 96 19 212 38 4176 697TBP-5, 0-1.5 in. 0.75 < 3 5 1 < 4 < 18 68 12 1536 256TBP-5, 1.5-3 in. 2.25 < 3 2 1 < 4 25 5 66 12 1707 285TBP-6, 0-1.5 in. 0.75 < 3 26 6 15 3 145 29 311 56 5104 851TBP-6, 1.5-3 in. 2.25 < 3 3 1 < 4 < 18 63 11 1431 239TBP-6, 3-4.5 in. 3.75 < 3 4 1 < 4 < 18 71 13 1367 228TBP-7, 0-1.5 in. 0.75 < 3 17 4 4 1 100 20 228 41 3966 662TBP-7, 1.5-3 in. 2.25 < 3 7 2 < 4 35 7 129 23 2439 407TBP-8, 0-1.5 in. 0.75 < 3 21 4 6 1 103 20 239 43 4139 690TBP-8, 1.5-3 in. 2.25 < 3 4 1 < 4 < 18 32 6 1252 209TBP-9, 0-1.5 in. 0.75 < 3 21 5 9 2 106 21 237 43 4168 695

g/g SEM g/g SEM g/g SEM g/g SEM g/g SEM g/g SEM
Pd Nb Bi CrStd / Core / Sample ID Avg Depth
V Ti
TBP-9, 1.5-3 in. 2.25 < 3 9 2 < 4 < 18 100 18 1914 319TBP-10, 0-1.5 in. 0.75 < 3 11 2 < 4 60 12 144 26 3016 503TBP-10, 1.5-3 in. 2.25 < 3 < 2 < 4 < 18 33 6 1139 190TBP-11, 0-1.5 in. 0.75 < 3 < 2 < 4 < 18 24 4 942 157TBP-11, 1.5-3 in. 2.25 < 3 5 1 < 4 < 18 36 6 1038 173TBP-12, 0-1.5 in. 0.75 < 3 9 2 < 4 < 18 84 15 1967 328TBP-12, 1.5-3 in. 2.25 < 3 16 4 12 3 41 8 124 22 2595 433TBP-12, 1.5-3 in. 3.75 < 3 21 5 14 3 46 9 129 23 3420 571TBP-13, 0-1.5 in. 0.75 < 3 20 4 5 1 87 17 220 40 3986 665TBP-13, 1.5-3 in. 2.25 < 3 6 1 < 4 63 12 134 24 2661 444
Site 8, fine, 0-0.5 in. 0.25 < 3 32 7 18 4 178 35 355 64 5948 992Site 8, fine, 0.5-1 in. 0.75 < 3 33 7 22 5 174 34 363 66 5923 988Site 8, fine, 1-1.5 in. 1.25 < 3 33 7 19 4 167 33 347 63 5882 981
Site 8, fine, 1.5-2.5 in. 2.00 < 3 33 7 20 4 172 34 360 65 5900 984Site 8, fine, 2.5-3.5 in. 3.00 < 3 29 6 19 4 155 31 342 62 5672 946Site 8, fine, 3.5-4.5 in. 4.00 < 3 19 4 10 2 125 25 261 47 4638 774Site 8, sandy, 0-0.5 in. 0.25 < 3 4 1 < 4 < 18 75 13 1737 290Site 8, sandy, 0.5-1 in. 0.75 < 3 4 1 < 4 < 18 71 13 2037 340Site 8, sandy, 1-1.5 in. 1.25 < 3 < 2 < 4 < 18 35 6 867 145
Site 8, sandy, 1.5-2.5 in. 2.00 < 3 10 2 < 4 55 11 160 29 3309 552Site 8, sandy, 2.5-3.5 in. 3.00 < 3 7 2 < 4 27 5 128 23 2340 390Site 8, sandy, 3.5-4.5 in. 4.00 < 3 12 3 < 4 < 18 20 4 2009 335
Site 10, 0-1.5 in. 0.75 < 3 4 1 < 4 < 18 < 10 461 77Site 10, 1.5-3 in. 2.25 < 3 < 2 < 4 < 18 92 17 923 154Site 10, 3-4.5 in. 3.75 < 3 < 2 < 4 < 18 12 2 223 37
Site 9, mid, 0-0.5 in. 0.25 < 3 2 0 < 4 < 18 53 10 995 166Site 9, mid, 0.5-1 in. 0.75 < 3 35 8 < 4 92 18 242 44 4635 773Site 9, mid, 1-1.5 in. 1.25 4 1 47 10 < 4 117 23 290 52 5081 848
Site 9, mid, 1.5-2.5 in. 2.00 < 3 39 9 < 4 126 25 285 51 5168 862Site 9, mid, 2.5-3.5 in. 3.00 < 3 43 9 < 4 146 29 353 64 5385 898Site 9, mid, 3.5-4.5 in. 4.00 < 3 33 7 < 4 112 22 292 53 5464 912Site 9, mid, 4.5-5.5 in. 5.00 < 3 26 6 < 4 98 19 262 47 5047 842Site 9, edge, 0-0.5 in. 0.25 < 3 16 3 < 4 21 4 90 16 1828 305Site 9, edge, 0.5-1 in. 0.75 < 3 17 4 6 1 < 18 60 11 1659 277Site 9, edge, 1-1.5 in. 1.25 < 3 26 6 6 1 < 18 49 9 2052 342
Site 9, edge, 1.5-2.5 in. 2.00 < 3 60 13 23 5 < 18 85 15 3911 652Site 11, 0-0.5 in. 0.25 < 3 8 2 < 4 18 4 89 16 2689 449Site 11, 0.5-1 in. 0.75 < 3 7 2 < 4 51 10 132 24 3646 608Site 11, 1-1.5 in. 1.25 < 3 5 1 < 4 < 18 69 12 2195 366
Site 11, 1.5-2.5 in. 2.00 < 3 2 0 < 4 < 18 24 4 1108 185Site 11, 2.5-3 in. 2.75 < 3 < 2 < 4 < 18 57 10 1154 192
Site 12, fine, 0-0.5 in. 0.25 < 3 10 2 < 4 23 5 98 18 2299 384Site 12, 0.5-1 in. 0.75 < 3 7 2 < 4 42 8 92 17 2166 361Site 12, 1-1.5 in. 1.25 < 3 12 3 < 4 59 12 159 29 2752 459
Site 12, 1.5-2.5 in. 2.00 < 3 6 1 < 4 < 18 80 14 1686 281Site 12, 2.5-3.5 in. 3.00 < 3 8 2 < 4 < 18 75 14 1846 308
Site 12, sandy, 0-0.5 in. 0.25 < 3 3 1 < 4 < 18 < 10 852 142

g/g SEM g/g SEM g/g SEM g/g SEM g/g SEM g/g SEM
Pd Nb Bi CrStd / Core / Sample ID Avg Depth
V Ti
Site 12, sandy, 0.5-1 in. 0.75 < 3 5 1 < 4 < 18 16 3 1757 293Site 12, sandy, 1-1.5 in. 1.25 < 3 7 1 < 4 < 18 20 4 868 145
Site 12, sandy, 1.5-2.5 in. 2.00 < 3 2 0 < 4 < 18 14 3 697 116Site 12, sandy, 2.5-3.5 in. 3.00 < 3 9 2 < 4 < 18 71 13 1447 241Site 12, sandy, 3.5-4 in. 4.00 < 3 5 1 < 4 < 18 53 10 1265 211Site 20 BP2D 0-0.5 in. 0.25 4 1 53 11 8 2 225 45 386 70 5646 942Site 20 BP2D 0.5-1 in. 0.75 4 1 56 12 6 1 211 42 385 69 5703 951Site 20 BP2D 1-1.5 in. 1.25 5 1 49 11 9 2 215 43 377 68 5632 940
Site 20 BP2D 1.5-2.5 in. 2.00 < 3 5 1 < 4 38 8 121 22 1954 326Site 20 BP2D 2.5-3.5 in. 3.00 < 3 < 2 < 4 < 18 56 10 753 126Site 20 BP2D 3.5-4.5 in. 4.00 < 3 < 2 < 4 < 18 31 6 891 149Site 20 BP2C 0-0.5 in. 0.25 6 1 42 9 5 1 225 45 385 70 5289 882Site 20 BP2C 0.5-1 in. 0.75 < 3 44 10 7 2 218 43 381 69 5323 888Site 20 BP2C 1-1.5 in. 1.25 3 1 34 7 < 4 172 34 333 60 4680 781
Site 20 BP2C 1.5-2.5 in. 2.00 4 1 35 8 5 1 166 33 349 63 4863 811Site 20 BP2C 2.5-3.5 in. 3.00 < 3 32 7 < 4 164 32 336 61 4721 788Site 20 BP2B 0-0.5 in. 0.25 3 0 55 12 < 4 196 39 391 71 5594 933Site 20 BP2B 0.5-1 in. 0.75 5 1 45 10 < 4 174 34 346 63 5042 841Site 20 BP2B 1-1.5 in. 1.25 5 1 41 9 < 4 157 31 315 57 4876 813
Site 20 BP2B 1.5-2.5 in. 2.00 < 3 28 6 < 4 135 27 270 49 4039 674Site 20 BP2B 2.5-3.5 in. 3.00 < 3 6 1 < 4 27 5 111 20 1575 263Site 20 BP2B 3.5-4.5 in. 4.00 < 3 < 2 < 4 < 18 58 10 932 155Site 20 BP2B 4.5-5.25 in. 5.00 < 3 < 2 < 4 < 18 37 7 635 106
Site 20 BP2A 0-0.5 in. 0.25 5 1 55 12 < 4 204 40 367 66 5230 873Site 20 BP2A 0.5-1 in. 0.75 5 1 57 12 < 4 208 41 389 70 5440 907Site 20 BP2A 1-1.5 in. 1.25 4 1 51 11 < 4 190 38 364 66 5245 875
Site 20 BP2A 1.5-2.5 in. 2.00 5 1 55 12 < 4 199 39 370 67 5426 905Site 20 BP2A 2.5-3.5 in. 3.00 4 1 60 13 < 4 207 41 376 68 5505 918Site 20 BP2A 3.5-4.5 in. 4.00 4 1 60 13 < 4 191 38 371 67 5447 909Site 20 BP2A 4.5-5.5 in. 5.00 3 0 45 10 < 4 176 35 330 60 4877 814Site 20 BP2A 5.5-6.5 in. 6.00 < 3 44 10 < 4 156 31 327 59 4554 760
Site 13, 0-0.5 in. 0.25 < 3 < 2 < 4 < 18 29 5 207 35Site 13, 0.5-1 in. 0.75 < 3 < 2 < 4 < 18 53 10 692 115Site 13, 1-1.5 in. 1.25 < 3 14 3 < 4 < 18 16 3 285 48
Site 13, 1.5-2.5 in. 2.00 < 3 < 2 < 4 < 18 21 4 351 59Site 13, 2.5-2.75 in. 2.63 < 3 4 1 < 4 < 18 19 3 702 117
Site 15 (BP3), 0-0.5 in. 0.25 3 0 15 3 < 4 < 18 109 20 3540 591Site 15 (BP3), 0.5-1 in. 0.75 < 3 12 3 < 4 < 18 96 17 3563 594Site 15 (BP3), 1-1.5 in. 1.25 < 3 12 3 < 4 < 18 49 9 3484 581
Site 15 (BP3), 1.5-2.5 in. 2.00 < 3 7 1 < 4 < 18 92 17 3389 565Site 15 (BP3), 2.5-3.5 in. 3.00 < 3 8 2 < 4 < 18 53 10 2860 477Site 15 (BP3), 3.5-4.5 in. 4.00 < 3 6 1 < 4 < 18 39 7 2806 468Site 15 (BP3), 4.5-5.5 in. 5.00 < 3 4 1 < 4 < 18 21 4 2051 342
Site 16 (BP3 channel), 0-0.5 in 0.25 < 3 6 1 < 4 < 18 58 11 1309 218Site 16 (BP3 channel), 0.5-1 in 0.75 < 3 < 2 < 4 < 18 < 10 999 167Site 16 (BP3 channel), 1-1.5 in 1.25 < 3 2 0 < 4 < 18 12 2 347 58Site 16 (BP3 channel) 1.5-2.5 i 2.00 < 3 < 2 < 4 < 18 26 5 422 70

g/g SEM g/g SEM g/g SEM g/g SEM g/g SEM g/g SEM
Pd Nb Bi CrStd / Core / Sample ID Avg Depth
V Ti
Site 16 (BP3 channel) 2.5-3.5 i 3.00 < 3 < 2 < 4 < 18 22 4 181 30Site 17 (BP4) 0-0.5 in. 0.25 < 3 22 5 < 4 81 16 203 37 4708 785Site 17 (BP4) 0.5-1 in. 0.75 < 3 26 6 < 4 111 22 267 48 5774 963Site 17 (BP4) 1-1.5 in. 1.25 < 3 26 6 5 1 93 18 258 47 5660 944
Site 17 (BP4) 1.5-2.5 in. 2.00 < 3 19 4 < 4 104 21 257 46 5261 878Site 17 (BP4) 2.5-3.5 in. 3.00 < 3 19 4 < 4 76 15 207 37 4869 812Site 17 (BP4) 3.5-4.5 in. 4.00 < 3 8 2 < 4 42 8 89 16 1815 303Site 17 (BP4) 4.5-5.5 in. 5.00 < 3 9 2 < 4 24 5 80 15 2463 411
Site 19 (BP5 pond) 0-0.5 in. 0.25 < 3 11 2 < 4 < 18 86 15 2823 471Site 19 (BP5 pond) 0.5-1 in. 0.75 < 3 10 2 < 4 31 6 106 19 2195 366Site 19 (BP5 pond) 1-1.5 in. 1.25 < 3 6 1 < 4 < 18 20 4 1797 300
Site 19 (BP5 pond) 1.5-2.5 in. 2.00 < 3 4 1 < 4 < 18 17 3 957 160Site 19 (BP5 pond) 2.5-3.5 in. 3.00 < 3 10 2 < 4 < 18 38 7 1289 215Site 18 (BP5 channel) 0-0.5 in. 0.25 < 3 24 5 4 1 93 18 209 38 4228 705Site 18 (BP5 channel) 0.5-1 in. 0.75 < 3 23 5 < 4 70 14 189 34 4032 673Site 18 (BP5 channel) 1-1.5 in. 1.25 < 3 14 3 < 4 18 4 107 19 2975 496Site 18 (BP5 channel) 1.5-2.5 i 2.00 < 3 10 2 < 4 < 18 79 14 2029 338Site 18 (BP5 channel) 2.5-3.5 i 3.00 < 3 < 2 < 4 < 18 < 10 688 115Site 18 (BP5 channel) 3.5-4.5 i 4.00 < 3 < 2 < 4 < 18 11 2 432 72Site 18 (BP5 channel) 4.5-5.5 i 5.00 < 3 9 2 < 4 < 18 31 6 1524 254Site 18 (BP5 channel) 5.5-6 in. 6.00 < 3 17 4 18 4 < 18 20 4 1352 226
Site 14, 0-0.5 in. 0.25 < 3 4 1 < 4 < 18 < 10 941 157Site 14, 0.5-1 in. 0.75 < 3 54 12 27 6 < 18 < 10 1292 216Site 14, 1-1.5 in. 1.25 < 3 33 7 < 4 < 18 < 10 2375 396
Site 14, 1.5-2.5 in. 2.00 < 3 106 23 130 28 < 18 78 14 2057 343Site 14, 2.5-3.5 in. 3.00 < 3 16 4 < 4 < 18 < 10 1197 200Site 14, 3.5-3.75 in. 3.63 < 3 34 7 35 8 < 18 22 4 3797 633
control biofilm n/a 4 1 12 3 < 4 66 13 184 33 2557 427site 1 biofilm n/a 7 1 156 34 6 1 220 44 120 22 1404 234Site 2 biofilm n/a 8 1 173 38 7 2 230 46 130 23 1074 179Site 3 biofilm n/a 3 0 82 18 < 4 86 17 152 27 2340 390Site 5 biofilm n/a 3 0 99 21 < 4 86 17 167 30 2129 355Site 9 biofilm n/a < 3 59 13 22 5 96 19 205 37 3685 615Site 13 biofilm n/a 6 1 110 24 < 4 172 34 164 30 1350 225

Blank (SiO2) n/aBlank (SiO2) n/aBlank (SiO2) n/aBlank (SiO2) n/aBlank (SiO2) n/aBlank (SiO2) n/aBlank (SiO2) n/aBlank (SiO2) n/a
NIST 2702 Standard n/aNIST 2702 Standard n/aNIST 2702 Standard n/aNIST 2702 Standard n/aNIST 2702 Standard n/aNIST 2702 Standard n/aNIST 2702 Standard n/a
NIST 2709a STANDARD n/aNIST 2709a STANDARD n/aNIST 2709a STANDARD n/aNIST 2709a STANDARD n/aNIST 2709a STANDARD n/aNIST 2709a STANDARD n/aNIST 2709a STANDARD n/a
Control Composite (no added tin) n/aTin Std 28.587 ppm n/aTin Std 28.587 ppm n/aTin Std 28.587 ppm n/aTin Std 28.587 ppm n/aTin Std 28.587 ppm n/aTin Std 28.587 ppm n/aTin Std 60.517 ppm n/aTin Std 60.517 ppm n/aTin Std 60.517 ppm n/aTin Std 60.517 ppm n/aTin Std 60.517 ppm n/aTin Std 87.548 ppm n/aTin Std 87.548 ppm n/aTin Std 87.548 ppm n/aTin Std 113.387 ppm n/aTin Std 113.387 ppm n/aTin Std 113.387 ppm n/aTin Std 113.387 ppm n/aTin Std 113.387 ppm n/aTin Std 113.387 ppm n/aTin Std 174.792 ppm n/aTin Std 174.792 ppm n/aTin Std 174.792 ppm n/aTin Std 174.792 ppm n/a
Std / Core / Sample ID Avg Depthg/g SEM g/g SEM g/g SEM g/g SEM g/g SEM g/g SEM
< 65 < 300 < 1000 < 250.0 411888 15196 140 22< 65 < 300 < 1000 < 250.0 410640 15150 160 25< 65 < 300 < 1000 < 250.0 412237 15209 217 34< 65 < 300 < 1000 < 250.0 412926 15235 163 26< 65 < 300 < 1000 < 250.0 411687 15189 237 37< 65 < 300 < 1000 < 250.0 407974 15052 207 33< 65 < 300 < 1000 < 250.0 393328 14512 60 9< 65 < 300 < 1000 < 250.0 402098 14835 107 17
2949 657 18866 3039 64025 4380 1063.0 157.4 218702 8069 6518 10273125 696 19323 3113 64035 4380 1128.9 167.1 217520 8025 6507 10253081 686 18980 3057 62615 4283 1096.3 162.3 216385 7983 6518 10273021 673 18702 3012 62258 4259 931.5 137.9 214475 7913 6446 10162941 655 18476 2976 60649 4149 908.3 134.5 209834 7742 6271 9882990 666 19025 3064 63057 4314 1135.6 168.1 215534 7952 6524 10282971 661 19357 3118 65126 4455 959.5 142.0 221960 8189 6636 104619211 4278 16944 2729 52974 3624 < 250.0 259118 9560 543 8619318 4302 16972 2734 52267 3575 < 250.0 258565 9540 571 9018881 4204 16853 2715 51415 3517 < 250.0 257273 9492 624 9818921 4213 16478 2654 50052 3424 < 250.0 254045 9373 616 9719101 4253 17007 2739 52330 3580 < 250.0 258298 9530 660 10419218 4279 16652 2682 52663 3603 < 250.0 259953 9591 618 9719114 4256 16960 2732 51899 3550 < 250.0 256328 9457 514 81139 31 994 160 43198 2955 < 250.0 233418 8612 354 56302 67 1040 168 47259 3233 < 250.0 222906 8224 998 15783 19 1049 169 43708 2990 < 250.0 248503 9168 1060 167
< 65 547 88 31823 2177 < 250.0 277381 10234 933 147121 27 1249 201 37308 2552 < 250.0 279835 10324 1096 173106 24 1554 250 35554 2432 < 250.0 256685 9470 1095 173
< 65 922 148 41588 2845 < 250.0 279404 10308 750 118< 65 722 116 40581 2776 < 250.0 263611 9726 1448 228< 65 714 115 43853 3000 < 250.0 268217 9896 1672 263< 65 902 145 38809 2655 < 250.0 292100 10777 1436 226< 65 1328 214 32012 2190 < 250.0 292642 10797 1491 235< 65 851 137 30880 2112 < 250.0 278483 10274 1471 232
171 38 882 142 39140 2677 < 250.0 268791 9917 1937 305< 65 629 101 36477 2495 < 250.0 281310 10379 1991 314
138 31 1492 240 35217 2409 < 250.0 283812 10471 1995 314146 33 652 105 40368 2761 < 250.0 263292 9714 2636 415
< 65 652 105 38003 2600 < 250.0 267744 9878 2605 410149 33 1061 171 34720 2375 < 250.0 267169 9857 2604 410
< 65 1232 198 39494 2702 < 250.0 268747 9915 2675 421< 65 565 91 31637 2164 < 250.0 269230 9933 2197 346< 65 728 117 35472 2426 < 250.0 261516 9648 2175 343< 65 802 129 42837 2930 < 250.0 253435 9350 3896 614< 65 1130 182 42448 2904 < 250.0 261820 9660 3572 563< 65 729 117 41989 2872 < 250.0 260567 9613 3710 585< 65 714 115 31764 2173 < 250.0 281347 10380 2917 460
Si ClCa K Al P

Std / Core / Sample ID Avg Depth
Tin Std 234.069 ppm n/aTin Std 234.069 ppm n/aTin Std 234.069 ppm n/aTin Std 234.069 ppm n/aTin Std 234.069 ppm n/a
Control 0-0.5 in. 0.25Control 0.5-1 in. 0.75Control 1-1.5 in. 1.25
Control 1.5-2.5 in. 2.00Control 2.5-3.5 in. 3.00
Site 2, 0-0.5 in. 0.25Site 2, 0.5-1 in. 0.75Site 2, 1-1.5 in. 1.25
Site 2, 1.5-2.5 in. 2.00Site 2, 2.5-3.5 in. 3.00Site 2, 3.5-4.5 in. 4.00Site 3, 0-0.5 in. 0.25Site 3, 0.5-1 in. 0.75Site 3, 1-1.5 in. 1.25Site 5, 0-0.5 in. 0.25Site 5, 0.5-1 in. 0.75Site 5, 1-1.5 in. 1.25
Site 5, 1.5-2.5 in. 2.00Site 5, 2.5-3.5 in. 3.00Site 5, 3.5-4.5 in. 4.00TBP-0, Control n/aTBP-1, 0-1.5 in. 0.75TBP-1, 1.5-3 in. 2.25TBP-1, 3-4.5 in. 3.75TBP-2, 0-1.5 in. 0.75TBP-2, 1.5-3 in. 2.25TBP-2, 3-4.5 in. 3.75TBP-3, 0-1.5 in. 0.75TBP-3, 1.5-3 in. 2.25TBP-4, 0-1.5 in. 0.75TBP-4, 1.5-3 in. 2.25TBP-4, 3-4.5 in. 3.75TBP-5, 0-1.5 in. 0.75TBP-5, 1.5-3 in. 2.25TBP-6, 0-1.5 in. 0.75TBP-6, 1.5-3 in. 2.25TBP-6, 3-4.5 in. 3.75TBP-7, 0-1.5 in. 0.75TBP-7, 1.5-3 in. 2.25TBP-8, 0-1.5 in. 0.75TBP-8, 1.5-3 in. 2.25TBP-9, 0-1.5 in. 0.75
g/g SEM g/g SEM g/g SEM g/g SEM g/g SEM g/g SEM
Si ClCa K Al P
178 40 1204 194 38205 2613 < 250.0 263115 9707 4868 767207 46 876 141 34126 2334 < 250.0 279564 10314 4412 695141 31 635 102 29239 2000 < 250.0 273818 10102 4111 648
< 65 1016 164 27953 1912 < 250.0 294953 10882 3898 614< 65 741 119 41181 2817 < 250.0 267851 9882 4836 762
156 35 623 100 16419 1123 < 250.0 338706 12496 241 3881 18 1030 166 45274 3097 235.7 34.9 259277 9566 394 62123 27 1122 181 53997 3694 < 250.0 243036 8967 364 571714 382 1579 254 37558 2569 < 250.0 254961 9407 455 722163 482 2731 440 46937 3211 269.8 39.9 236014 8708 431 68
< 65 851 137 23517 1609 4445.5 658.1 327456 12081 231 36< 65 814 131 15339 1049 500.6 74.1 357103 13175 157 25< 65 945 152 16616 1137 < 250.0 343166 12661 129 20
260 58 1521 245 15127 1035 < 250.0 343149 12660 227 36< 65 3005 484 13088 895 < 250.0 348491 12857 132 21< 65 509 82 15548 1064 < 250.0 349352 12889 258 41< 65 660 106 18323 1253 < 250.0 331420 12227 261 41
133 30 801 129 21234 1453 < 250.0 326017 12028 164 26224 50 1035 167 38300 2620 237.7 35.2 275584 10167 410 65
< 65 1081 174 37857 2590 1913.1 283.2 318817 11763 373 59< 65 821 132 30889 2113 < 250.0 340037 12545 242 38< 65 1245 200 37892 2592 < 250.0 277605 10242 392 62< 65 1022 165 33795 2312 < 250.0 303878 11211 259 41
415 92 1089 175 37698 2579 < 250.0 281761 10395 313 49185 41 1601 258 57691 3946 < 250.0 221179 8160 498 79
< 65 1760 283 52066 3562 432.9 64.1 251724 9287 447 701302 290 3006 484 84140 5756 663.5 98.2 181555 6698 572 90
< 65 985 159 43717 2990 < 250.0 277141 10225 420 66567 126 3167 510 85701 5862 560.8 83.0 170968 6308 583 921421 316 3435 553 93364 6387 < 250.0 187744 6927 596 94940 209 3329 536 97806 6691 < 250.0 178346 6580 598 94767 171 3594 579 99346 6796 658.6 97.5 175178 6463 643 1012403 535 3436 553 85937 5879 < 250.0 180419 6656 588 931797 400 3011 485 76765 5251 630.4 93.3 167323 6173 535 841402 312 3316 534 83864 5737 < 250.0 188647 6960 624 98404 90 2782 448 84830 5803 492.5 72.9 200097 7382 536 85
< 65 2150 346 76773 5252 343.4 50.8 212246 7831 504 79< 65 904 146 35977 2461 < 250.0 305945 11288 326 51
897 200 1299 209 39366 2693 < 250.0 256587 9467 472 741288 287 2774 447 84032 5748 607.5 89.9 176856 6525 591 93
< 65 864 139 41103 2812 < 250.0 288546 10646 316 50< 65 971 156 38947 2664 < 250.0 279803 10323 307 48
979 218 2189 353 73191 5007 < 250.0 197333 7280 573 90< 65 1350 217 57965 3965 240.3 35.6 239909 8851 426 67
1104 246 2246 362 80220 5488 < 250.0 198592 7327 568 90< 65 736 119 33505 2292 < 250.0 302540 11162 386 61
1090 243 2071 334 75201 5144 < 250.0 200034 7380 526 83

Std / Core / Sample ID Avg Depth
TBP-9, 1.5-3 in. 2.25TBP-10, 0-1.5 in. 0.75TBP-10, 1.5-3 in. 2.25TBP-11, 0-1.5 in. 0.75TBP-11, 1.5-3 in. 2.25TBP-12, 0-1.5 in. 0.75TBP-12, 1.5-3 in. 2.25TBP-12, 1.5-3 in. 3.75TBP-13, 0-1.5 in. 0.75TBP-13, 1.5-3 in. 2.25
Site 8, fine, 0-0.5 in. 0.25Site 8, fine, 0.5-1 in. 0.75Site 8, fine, 1-1.5 in. 1.25
Site 8, fine, 1.5-2.5 in. 2.00Site 8, fine, 2.5-3.5 in. 3.00Site 8, fine, 3.5-4.5 in. 4.00Site 8, sandy, 0-0.5 in. 0.25Site 8, sandy, 0.5-1 in. 0.75Site 8, sandy, 1-1.5 in. 1.25
Site 8, sandy, 1.5-2.5 in. 2.00Site 8, sandy, 2.5-3.5 in. 3.00Site 8, sandy, 3.5-4.5 in. 4.00
Site 10, 0-1.5 in. 0.75Site 10, 1.5-3 in. 2.25Site 10, 3-4.5 in. 3.75
Site 9, mid, 0-0.5 in. 0.25Site 9, mid, 0.5-1 in. 0.75Site 9, mid, 1-1.5 in. 1.25
Site 9, mid, 1.5-2.5 in. 2.00Site 9, mid, 2.5-3.5 in. 3.00Site 9, mid, 3.5-4.5 in. 4.00Site 9, mid, 4.5-5.5 in. 5.00Site 9, edge, 0-0.5 in. 0.25Site 9, edge, 0.5-1 in. 0.75Site 9, edge, 1-1.5 in. 1.25
Site 9, edge, 1.5-2.5 in. 2.00Site 11, 0-0.5 in. 0.25Site 11, 0.5-1 in. 0.75Site 11, 1-1.5 in. 1.25
Site 11, 1.5-2.5 in. 2.00Site 11, 2.5-3 in. 2.75
Site 12, fine, 0-0.5 in. 0.25Site 12, 0.5-1 in. 0.75Site 12, 1-1.5 in. 1.25
Site 12, 1.5-2.5 in. 2.00Site 12, 2.5-3.5 in. 3.00
Site 12, sandy, 0-0.5 in. 0.25
g/g SEM g/g SEM g/g SEM g/g SEM g/g SEM g/g SEM
Si ClCa K Al P
590 131 1295 209 44720 3059 < 250.0 245273 9049 384 61417 93 1751 282 60740 4155 338.6 50.1 207377 7651 2366 373
< 65 929 150 32166 2200 < 250.0 309312 11412 1106 174< 65 553 89 27809 1902 < 250.0 319707 11795 268 42< 65 490 79 23705 1622 < 250.0 333323 12298 305 48< 65 1117 180 47317 3237 241.1 35.7 287053 10591 389 61
148 33 1319 212 54101 3701 < 250.0 256059 9447 449 7191 20 1438 232 59123 4044 < 250.0 250495 9242 460 72
2041 454 2074 334 73444 5024 545.6 80.8 202063 7455 541 85429 96 1982 319 58493 4001 222.7 33.0 210291 7759 497 781443 321 3764 606 86931 5947 735.4 108.9 185422 6841 583 921147 255 3719 599 86839 5940 721.9 106.9 188289 6947 589 931059 236 3646 587 83901 5739 791.1 117.1 184796 6818 591 931018 227 3621 583 86586 5923 < 250.0 193792 7150 602 95689 153 3275 528 88872 6079 < 250.0 193917 7154 598 94415 92 2871 462 79761 5456 559.3 82.8 206368 7614 520 82
< 65 1230 198 46343 3170 263.4 39.0 269026 9926 429 68< 65 1058 170 37959 2597 < 250.0 287530 10608 362 57< 65 504 81 26687 1826 < 250.0 322184 11887 255 40
394 88 1864 300 61430 4202 326.8 48.4 231449 8539 505 80200 45 1610 259 47892 3276 < 250.0 270549 9982 373 59
< 65 361 58 16965 1160 < 250.0 366778 13532 332 52< 65 147 24 3585 245 < 250.0 395319 14585 151 24
120 27 1389 224 20340 1391 < 250.0 324972 11990 263 41< 65 299 48 5335 365 < 250.0 370979 13687 358 56< 65 605 97 20925 1431 264.8 39.2 328944 12136 273 43
1066 237 2410 388 58968 4034 1757.3 260.1 230500 8504 476 751248 278 2616 421 63915 4372 2173.0 321.7 222513 8209 499 791429 318 2633 424 66971 4581 1890.2 279.8 219248 8089 513 812235 498 2710 437 65518 4482 1744.8 258.3 195723 7221 513 811527 340 2682 432 68615 4694 1945.3 288.0 225058 8303 482 761322 294 2492 401 61533 4209 1894.5 280.5 222617 8213 486 77178 40 1184 191 35526 2430 350.5 51.9 288759 10654 400 63
< 65 683 110 24336 1665 < 250.0 347615 12825 250 39< 65 1308 211 21748 1488 < 250.0 331481 12230 349 55< 65 978 158 30663 2098 < 250.0 314089 11588 356 56
216 48 1577 254 47301 3236 482.6 71.4 272318 10047 469 74348 78 2129 343 53586 3666 511.3 75.7 227749 8403 498 78
< 65 1461 235 43058 2945 427.9 63.3 280370 10344 401 63< 65 735 118 27295 1867 < 250.0 324854 11985 288 45< 65 785 126 37346 2555 < 250.0 293250 10819 396 62
1252 279 1702 274 44266 3028 631.6 93.5 255789 9437 482 761329 296 1634 263 39073 2673 443.6 65.7 247359 9126 462 732514 560 1956 315 42869 2933 703.7 104.2 201551 7436 487 77808 180 1472 237 35794 2449 444.6 65.8 244122 9007 468 74251 56 1511 243 42007 2874 613.1 90.8 249235 9195 465 73
< 65 133 21 4945 338 < 250.0 390806 14418 305 48

Std / Core / Sample ID Avg Depth
Site 12, sandy, 0.5-1 in. 0.75Site 12, sandy, 1-1.5 in. 1.25
Site 12, sandy, 1.5-2.5 in. 2.00Site 12, sandy, 2.5-3.5 in. 3.00Site 12, sandy, 3.5-4 in. 4.00Site 20 BP2D 0-0.5 in. 0.25Site 20 BP2D 0.5-1 in. 0.75Site 20 BP2D 1-1.5 in. 1.25
Site 20 BP2D 1.5-2.5 in. 2.00Site 20 BP2D 2.5-3.5 in. 3.00Site 20 BP2D 3.5-4.5 in. 4.00Site 20 BP2C 0-0.5 in. 0.25Site 20 BP2C 0.5-1 in. 0.75Site 20 BP2C 1-1.5 in. 1.25
Site 20 BP2C 1.5-2.5 in. 2.00Site 20 BP2C 2.5-3.5 in. 3.00Site 20 BP2B 0-0.5 in. 0.25Site 20 BP2B 0.5-1 in. 0.75Site 20 BP2B 1-1.5 in. 1.25
Site 20 BP2B 1.5-2.5 in. 2.00Site 20 BP2B 2.5-3.5 in. 3.00Site 20 BP2B 3.5-4.5 in. 4.00Site 20 BP2B 4.5-5.25 in. 5.00
Site 20 BP2A 0-0.5 in. 0.25Site 20 BP2A 0.5-1 in. 0.75Site 20 BP2A 1-1.5 in. 1.25
Site 20 BP2A 1.5-2.5 in. 2.00Site 20 BP2A 2.5-3.5 in. 3.00Site 20 BP2A 3.5-4.5 in. 4.00Site 20 BP2A 4.5-5.5 in. 5.00Site 20 BP2A 5.5-6.5 in. 6.00
Site 13, 0-0.5 in. 0.25Site 13, 0.5-1 in. 0.75Site 13, 1-1.5 in. 1.25
Site 13, 1.5-2.5 in. 2.00Site 13, 2.5-2.75 in. 2.63
Site 15 (BP3), 0-0.5 in. 0.25Site 15 (BP3), 0.5-1 in. 0.75Site 15 (BP3), 1-1.5 in. 1.25
Site 15 (BP3), 1.5-2.5 in. 2.00Site 15 (BP3), 2.5-3.5 in. 3.00Site 15 (BP3), 3.5-4.5 in. 4.00Site 15 (BP3), 4.5-5.5 in. 5.00
Site 16 (BP3 channel), 0-0.5 in 0.25Site 16 (BP3 channel), 0.5-1 in 0.75Site 16 (BP3 channel), 1-1.5 in 1.25Site 16 (BP3 channel) 1.5-2.5 i 2.00
g/g SEM g/g SEM g/g SEM g/g SEM g/g SEM g/g SEM
Si ClCa K Al P
< 65 321 52 9524 652 < 250.0 378591 13968 230 36< 65 386 62 11186 765 < 250.0 370422 13666 253 40
87 19 311 50 10596 725 < 250.0 348234 12848 363 571018 227 1125 181 34937 2390 459.2 68.0 273559 10093 435 69
< 65 971 156 36164 2474 341.7 50.6 280888 10363 456 722472 551 3484 561 87650 5996 1526.9 226.0 168037 6200 636 1002113 471 3612 582 89996 6156 1426.2 211.1 165878 6120 592 931697 378 3520 567 86422 5912 1524.1 225.6 165887 6120 578 91358 80 1443 232 39484 2701 678.8 100.5 253332 9346 397 63
< 65 750 121 22797 1559 274.2 40.6 342228 12626 155 24< 65 735 118 26086 1784 466.9 69.1 341118 12585 216 34
2586 576 3416 550 80787 5526 2059.7 304.9 163947 6049 601 952062 459 3404 548 81959 5606 2090.0 309.4 167643 6185 578 911571 350 3161 509 73034 4996 1766.5 261.5 169988 6272 519 821622 361 3251 524 74592 5103 1739.8 257.6 175294 6467 523 821175 262 3144 506 71064 4861 1762.3 260.9 173559 6403 493 781500 334 3644 587 82062 5614 1787.3 264.6 172273 6356 579 911199 267 3398 547 78300 5356 1788.9 264.8 186468 6880 540 851153 257 3255 524 74266 5080 1679.8 248.7 185191 6832 493 78940 209 2855 460 67843 4641 1543.5 228.5 197424 7284 455 72125 28 1364 220 44602 3051 1073.1 158.9 252777 9326 510 80
< 65 930 150 29022 1985 678.3 100.4 310168 11443 206 32< 65 690 111 22132 1514 603.7 89.4 341504 12600 233 37
1839 410 3394 547 74928 5126 2067.1 306.0 171757 6337 516 811797 400 3499 564 77796 5322 2003.9 296.7 164641 6074 529 831666 371 3356 541 72443 4956 2098.1 310.6 159950 5901 505 801497 333 3443 555 78201 5349 2137.2 316.4 169042 6237 530 841482 330 3527 568 79638 5448 2268.4 335.8 167119 6166 534 841382 308 3442 554 78662 5381 2578.6 381.7 173771 6411 493 781317 293 3353 540 73927 5057 2601.8 385.2 174365 6433 511 811575 351 3151 508 67195 4597 2398.2 355.0 165950 6123 465 73
< 65 87 14 1760 120 1286.3 190.4 333132 12291 283 45< 65 341 55 5627 385 1562.0 231.2 295150 10889 369 58< 65 186 30 3592 246 1356.7 200.8 335173 12366 335 53< 65 135 22 4188 286 1386.8 205.3 318613 11755 351 55< 65 281 45 7178 491 1956.6 289.7 327955 12100 365 57
896 200 1301 210 19600 1341 < 250.0 268762 9916 615 97588 131 1295 209 23137 1583 1076.7 159.4 296083 10924 483 76
< 65 830 134 20905 1430 < 250.0 344066 12694 378 60705 157 1240 200 26203 1792 644.2 95.4 305484 11271 481 76
< 65 1083 174 25758 1762 542.5 80.3 327043 12066 446 70< 65 1023 165 22993 1573 446.1 66.0 318167 11739 430 68< 65 862 139 18157 1242 < 250.0 326335 12040 380 60
138 31 855 138 11525 788 830.2 122.9 239908 8851 610 96< 65 185 30 2503 171 < 250.0 368213 13585 286 45< 65 213 34 3425 234 < 250.0 367225 13548 201 32< 65 287 46 4840 331 357.1 52.9 362205 13363 316 50

Std / Core / Sample ID Avg Depth
Site 16 (BP3 channel) 2.5-3.5 i 3.00Site 17 (BP4) 0-0.5 in. 0.25Site 17 (BP4) 0.5-1 in. 0.75Site 17 (BP4) 1-1.5 in. 1.25
Site 17 (BP4) 1.5-2.5 in. 2.00Site 17 (BP4) 2.5-3.5 in. 3.00Site 17 (BP4) 3.5-4.5 in. 4.00Site 17 (BP4) 4.5-5.5 in. 5.00
Site 19 (BP5 pond) 0-0.5 in. 0.25Site 19 (BP5 pond) 0.5-1 in. 0.75Site 19 (BP5 pond) 1-1.5 in. 1.25
Site 19 (BP5 pond) 1.5-2.5 in. 2.00Site 19 (BP5 pond) 2.5-3.5 in. 3.00Site 18 (BP5 channel) 0-0.5 in. 0.25Site 18 (BP5 channel) 0.5-1 in. 0.75Site 18 (BP5 channel) 1-1.5 in. 1.25Site 18 (BP5 channel) 1.5-2.5 i 2.00Site 18 (BP5 channel) 2.5-3.5 i 3.00Site 18 (BP5 channel) 3.5-4.5 i 4.00Site 18 (BP5 channel) 4.5-5.5 i 5.00Site 18 (BP5 channel) 5.5-6 in. 6.00
Site 14, 0-0.5 in. 0.25Site 14, 0.5-1 in. 0.75Site 14, 1-1.5 in. 1.25
Site 14, 1.5-2.5 in. 2.00Site 14, 2.5-3.5 in. 3.00Site 14, 3.5-3.75 in. 3.63
control biofilm n/asite 1 biofilm n/aSite 2 biofilm n/aSite 3 biofilm n/aSite 5 biofilm n/aSite 9 biofilm n/aSite 13 biofilm n/a
g/g SEM g/g SEM g/g SEM g/g SEM g/g SEM g/g SEM
Si ClCa K Al P
< 65 77 12 855 59 < 250.0 387857 14310 239 38347 77 2634 424 37184 2544 1324.6 196.1 244971 9038 481 76384 86 3273 527 46808 3202 1216.2 180.1 232633 8583 503 79173 38 3036 489 48107 3291 < 250.0 255440 9424 516 81295 66 3032 488 42903 2935 1069.1 158.3 229865 8481 486 77
< 65 2633 424 41809 2860 797.4 118.0 242116 8933 516 81< 65 707 114 22118 1513 < 250.0 282626 10427 447 70< 65 1028 166 25414 1738 < 250.0 280480 10348 473 75
127 28 1270 205 21282 1456 782.7 115.9 292385 10787 446 70237 53 1233 199 23213 1588 872.5 129.2 269631 9948 480 76
< 65 669 108 15999 1094 497.4 73.6 359459 13262 289 46< 65 452 73 10627 727 292.8 43.3 359988 13281 172 27< 65 683 110 14878 1018 507.0 75.0 340797 12573 264 42< 65 2378 383 50838 3478 2477.5 366.8 235006 8670 500 79< 65 2217 357 48421 3312 1698.7 251.5 248842 9181 464 73< 65 1447 233 33067 2262 1395.8 206.6 290341 10712 437 69< 65 1133 182 28191 1928 627.2 92.9 314212 11593 310 49< 65 289 47 7829 536 < 250.0 375488 13853 168 26< 65 259 42 6684 457 < 250.0 374617 13821 280 44< 65 157 25 4411 302 365.2 54.1 389796 14381 281 44< 65 253 41 7293 499 < 250.0 391692 14451 249 39< 65 91 15 883 60 < 250.0 383271 14140 239 38< 65 45 7 1088 74 < 250.0 400373 14771 168 27< 65 51 8 < 1000 < 250.0 398447 14700 196 31< 65 160 26 1789 122 < 250.0 426016 15718 287 45< 65 32 5 < 1000 < 250.0 398089 14687 222 35< 65 49 8 1207 83 < 250.0 400967 14793 249 39
11572 2577 4717 760 25286 1730 1142.8 169.2 153141 5650 1012 1591654 368 5524 890 68069 4656 23571.5 3489.6 75323 2779 2581 4072204 491 10498 1691 50512 3455 20485.9 3032.8 50614 1867 4676 7373001 668 3862 622 45600 3119 7723.7 1143.4 150456 5551 1336 2112868 639 7294 1175 33688 2304 5848.2 865.8 93483 3449 3505 5523216 716 4180 673 47194 3228 2243.0 332.1 164072 6053 1083 1714475 996 1663 268 4706 322 2511.4 371.8 94007 3468 1068 168
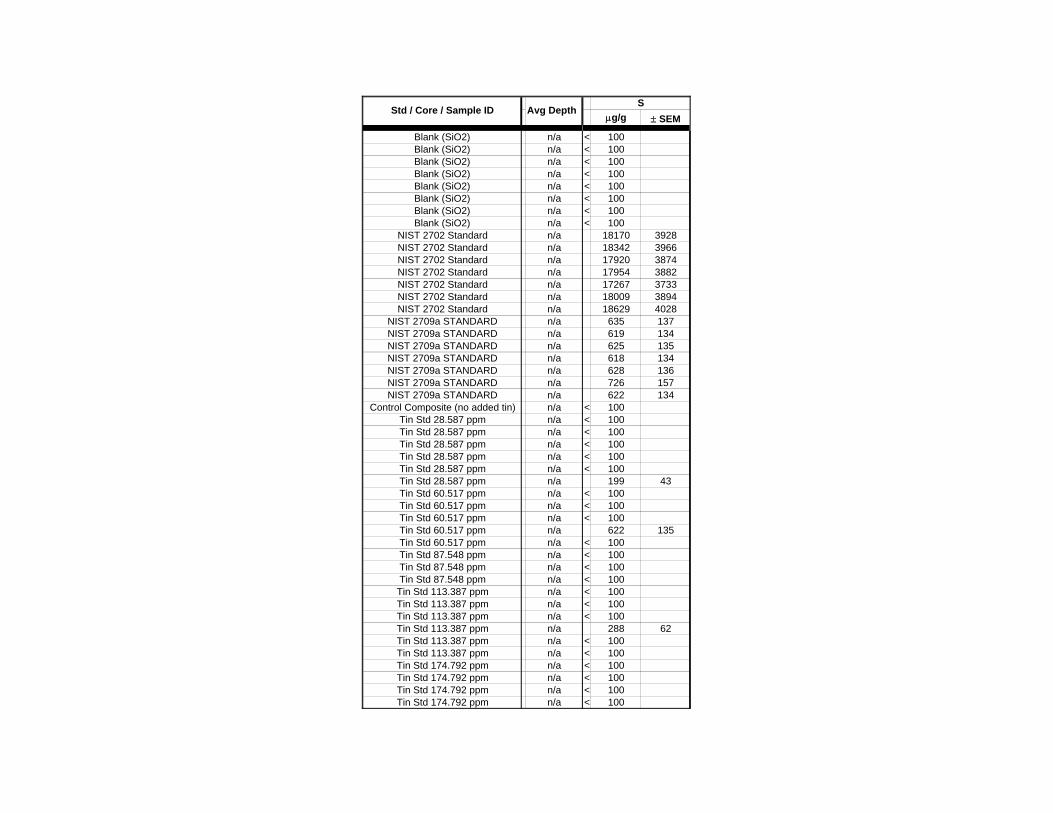
Blank (SiO2) n/aBlank (SiO2) n/aBlank (SiO2) n/aBlank (SiO2) n/aBlank (SiO2) n/aBlank (SiO2) n/aBlank (SiO2) n/aBlank (SiO2) n/a
NIST 2702 Standard n/aNIST 2702 Standard n/aNIST 2702 Standard n/aNIST 2702 Standard n/aNIST 2702 Standard n/aNIST 2702 Standard n/aNIST 2702 Standard n/a
NIST 2709a STANDARD n/aNIST 2709a STANDARD n/aNIST 2709a STANDARD n/aNIST 2709a STANDARD n/aNIST 2709a STANDARD n/aNIST 2709a STANDARD n/aNIST 2709a STANDARD n/a
Control Composite (no added tin) n/aTin Std 28.587 ppm n/aTin Std 28.587 ppm n/aTin Std 28.587 ppm n/aTin Std 28.587 ppm n/aTin Std 28.587 ppm n/aTin Std 28.587 ppm n/aTin Std 60.517 ppm n/aTin Std 60.517 ppm n/aTin Std 60.517 ppm n/aTin Std 60.517 ppm n/aTin Std 60.517 ppm n/aTin Std 87.548 ppm n/aTin Std 87.548 ppm n/aTin Std 87.548 ppm n/aTin Std 113.387 ppm n/aTin Std 113.387 ppm n/aTin Std 113.387 ppm n/aTin Std 113.387 ppm n/aTin Std 113.387 ppm n/aTin Std 113.387 ppm n/aTin Std 174.792 ppm n/aTin Std 174.792 ppm n/aTin Std 174.792 ppm n/aTin Std 174.792 ppm n/a
Std / Core / Sample ID Avg Depthg/g SEM
< 100< 100< 100< 100< 100< 100< 100< 100
18170 392818342 396617920 387417954 388217267 373318009 389418629 4028635 137619 134625 135618 134628 136726 157622 134
< 100< 100< 100< 100< 100< 100
199 43< 100< 100< 100
622 135< 100< 100< 100< 100< 100< 100< 100
288 62< 100< 100< 100< 100< 100< 100
S

Std / Core / Sample ID Avg Depth
Tin Std 234.069 ppm n/aTin Std 234.069 ppm n/aTin Std 234.069 ppm n/aTin Std 234.069 ppm n/aTin Std 234.069 ppm n/a
Control 0-0.5 in. 0.25Control 0.5-1 in. 0.75Control 1-1.5 in. 1.25
Control 1.5-2.5 in. 2.00Control 2.5-3.5 in. 3.00
Site 2, 0-0.5 in. 0.25Site 2, 0.5-1 in. 0.75Site 2, 1-1.5 in. 1.25
Site 2, 1.5-2.5 in. 2.00Site 2, 2.5-3.5 in. 3.00Site 2, 3.5-4.5 in. 4.00Site 3, 0-0.5 in. 0.25Site 3, 0.5-1 in. 0.75Site 3, 1-1.5 in. 1.25Site 5, 0-0.5 in. 0.25Site 5, 0.5-1 in. 0.75Site 5, 1-1.5 in. 1.25
Site 5, 1.5-2.5 in. 2.00Site 5, 2.5-3.5 in. 3.00Site 5, 3.5-4.5 in. 4.00TBP-0, Control n/aTBP-1, 0-1.5 in. 0.75TBP-1, 1.5-3 in. 2.25TBP-1, 3-4.5 in. 3.75TBP-2, 0-1.5 in. 0.75TBP-2, 1.5-3 in. 2.25TBP-2, 3-4.5 in. 3.75TBP-3, 0-1.5 in. 0.75TBP-3, 1.5-3 in. 2.25TBP-4, 0-1.5 in. 0.75TBP-4, 1.5-3 in. 2.25TBP-4, 3-4.5 in. 3.75TBP-5, 0-1.5 in. 0.75TBP-5, 1.5-3 in. 2.25TBP-6, 0-1.5 in. 0.75TBP-6, 1.5-3 in. 2.25TBP-6, 3-4.5 in. 3.75TBP-7, 0-1.5 in. 0.75TBP-7, 1.5-3 in. 2.25TBP-8, 0-1.5 in. 0.75TBP-8, 1.5-3 in. 2.25TBP-9, 0-1.5 in. 0.75
g/g SEM
S
< 100395 85
< 100< 100< 100
98 21< 100< 100
2797 6053822 826
< 100< 100< 100< 100< 100< 100< 100< 100< 100< 100< 100< 100< 100
538 116< 100< 100< 100< 100
113 25194 42
< 100186 40451 97478 103214 46
< 100< 100< 100< 100
212 46< 100< 100
125 27< 100
200 43< 100
201 43

Std / Core / Sample ID Avg Depth
TBP-9, 1.5-3 in. 2.25TBP-10, 0-1.5 in. 0.75TBP-10, 1.5-3 in. 2.25TBP-11, 0-1.5 in. 0.75TBP-11, 1.5-3 in. 2.25TBP-12, 0-1.5 in. 0.75TBP-12, 1.5-3 in. 2.25TBP-12, 1.5-3 in. 3.75TBP-13, 0-1.5 in. 0.75TBP-13, 1.5-3 in. 2.25
Site 8, fine, 0-0.5 in. 0.25Site 8, fine, 0.5-1 in. 0.75Site 8, fine, 1-1.5 in. 1.25
Site 8, fine, 1.5-2.5 in. 2.00Site 8, fine, 2.5-3.5 in. 3.00Site 8, fine, 3.5-4.5 in. 4.00Site 8, sandy, 0-0.5 in. 0.25Site 8, sandy, 0.5-1 in. 0.75Site 8, sandy, 1-1.5 in. 1.25
Site 8, sandy, 1.5-2.5 in. 2.00Site 8, sandy, 2.5-3.5 in. 3.00Site 8, sandy, 3.5-4.5 in. 4.00
Site 10, 0-1.5 in. 0.75Site 10, 1.5-3 in. 2.25Site 10, 3-4.5 in. 3.75
Site 9, mid, 0-0.5 in. 0.25Site 9, mid, 0.5-1 in. 0.75Site 9, mid, 1-1.5 in. 1.25
Site 9, mid, 1.5-2.5 in. 2.00Site 9, mid, 2.5-3.5 in. 3.00Site 9, mid, 3.5-4.5 in. 4.00Site 9, mid, 4.5-5.5 in. 5.00Site 9, edge, 0-0.5 in. 0.25Site 9, edge, 0.5-1 in. 0.75Site 9, edge, 1-1.5 in. 1.25
Site 9, edge, 1.5-2.5 in. 2.00Site 11, 0-0.5 in. 0.25Site 11, 0.5-1 in. 0.75Site 11, 1-1.5 in. 1.25
Site 11, 1.5-2.5 in. 2.00Site 11, 2.5-3 in. 2.75
Site 12, fine, 0-0.5 in. 0.25Site 12, 0.5-1 in. 0.75Site 12, 1-1.5 in. 1.25
Site 12, 1.5-2.5 in. 2.00Site 12, 2.5-3.5 in. 3.00
Site 12, sandy, 0-0.5 in. 0.25
g/g SEM
S
< 100< 100< 100< 100< 100< 100< 100< 100
319 69141 30644 139453 98460 99542 117395 86257 56
< 100< 100< 100< 100
268 58< 100< 100< 100< 100< 100< 100< 100< 100< 100< 100< 100< 100< 100< 100< 100
1269 2741389 300673 146177 38
< 100146 31142 31418 9095 20
< 100< 100

Std / Core / Sample ID Avg Depth
Site 12, sandy, 0.5-1 in. 0.75Site 12, sandy, 1-1.5 in. 1.25
Site 12, sandy, 1.5-2.5 in. 2.00Site 12, sandy, 2.5-3.5 in. 3.00Site 12, sandy, 3.5-4 in. 4.00Site 20 BP2D 0-0.5 in. 0.25Site 20 BP2D 0.5-1 in. 0.75Site 20 BP2D 1-1.5 in. 1.25
Site 20 BP2D 1.5-2.5 in. 2.00Site 20 BP2D 2.5-3.5 in. 3.00Site 20 BP2D 3.5-4.5 in. 4.00Site 20 BP2C 0-0.5 in. 0.25Site 20 BP2C 0.5-1 in. 0.75Site 20 BP2C 1-1.5 in. 1.25
Site 20 BP2C 1.5-2.5 in. 2.00Site 20 BP2C 2.5-3.5 in. 3.00Site 20 BP2B 0-0.5 in. 0.25Site 20 BP2B 0.5-1 in. 0.75Site 20 BP2B 1-1.5 in. 1.25
Site 20 BP2B 1.5-2.5 in. 2.00Site 20 BP2B 2.5-3.5 in. 3.00Site 20 BP2B 3.5-4.5 in. 4.00Site 20 BP2B 4.5-5.25 in. 5.00
Site 20 BP2A 0-0.5 in. 0.25Site 20 BP2A 0.5-1 in. 0.75Site 20 BP2A 1-1.5 in. 1.25
Site 20 BP2A 1.5-2.5 in. 2.00Site 20 BP2A 2.5-3.5 in. 3.00Site 20 BP2A 3.5-4.5 in. 4.00Site 20 BP2A 4.5-5.5 in. 5.00Site 20 BP2A 5.5-6.5 in. 6.00
Site 13, 0-0.5 in. 0.25Site 13, 0.5-1 in. 0.75Site 13, 1-1.5 in. 1.25
Site 13, 1.5-2.5 in. 2.00Site 13, 2.5-2.75 in. 2.63
Site 15 (BP3), 0-0.5 in. 0.25Site 15 (BP3), 0.5-1 in. 0.75Site 15 (BP3), 1-1.5 in. 1.25
Site 15 (BP3), 1.5-2.5 in. 2.00Site 15 (BP3), 2.5-3.5 in. 3.00Site 15 (BP3), 3.5-4.5 in. 4.00Site 15 (BP3), 4.5-5.5 in. 5.00
Site 16 (BP3 channel), 0-0.5 in 0.25Site 16 (BP3 channel), 0.5-1 in 0.75Site 16 (BP3 channel), 1-1.5 in 1.25Site 16 (BP3 channel) 1.5-2.5 i 2.00
g/g SEM
S
< 100< 100
434 94107 23
< 100985 213932 202980 212530 115
< 100< 100
1810 3911815 3921681 3631999 4321947 4211691 3661593 3441479 3201545 3341513 327989 214956 2071636 3541703 3681801 3891805 3901770 3831773 3831816 3932214 479
< 100< 100< 100< 100< 100
3917 8471296 280
< 100344 74142 31300 65
< 1001672 361
< 100< 100< 100

Std / Core / Sample ID Avg Depth
Site 16 (BP3 channel) 2.5-3.5 i 3.00Site 17 (BP4) 0-0.5 in. 0.25Site 17 (BP4) 0.5-1 in. 0.75Site 17 (BP4) 1-1.5 in. 1.25
Site 17 (BP4) 1.5-2.5 in. 2.00Site 17 (BP4) 2.5-3.5 in. 3.00Site 17 (BP4) 3.5-4.5 in. 4.00Site 17 (BP4) 4.5-5.5 in. 5.00
Site 19 (BP5 pond) 0-0.5 in. 0.25Site 19 (BP5 pond) 0.5-1 in. 0.75Site 19 (BP5 pond) 1-1.5 in. 1.25
Site 19 (BP5 pond) 1.5-2.5 in. 2.00Site 19 (BP5 pond) 2.5-3.5 in. 3.00Site 18 (BP5 channel) 0-0.5 in. 0.25Site 18 (BP5 channel) 0.5-1 in. 0.75Site 18 (BP5 channel) 1-1.5 in. 1.25Site 18 (BP5 channel) 1.5-2.5 i 2.00Site 18 (BP5 channel) 2.5-3.5 i 3.00Site 18 (BP5 channel) 3.5-4.5 i 4.00Site 18 (BP5 channel) 4.5-5.5 i 5.00Site 18 (BP5 channel) 5.5-6 in. 6.00
Site 14, 0-0.5 in. 0.25Site 14, 0.5-1 in. 0.75Site 14, 1-1.5 in. 1.25
Site 14, 1.5-2.5 in. 2.00Site 14, 2.5-3.5 in. 3.00Site 14, 3.5-3.75 in. 3.63
control biofilm n/asite 1 biofilm n/aSite 2 biofilm n/aSite 3 biofilm n/aSite 5 biofilm n/aSite 9 biofilm n/aSite 13 biofilm n/a
g/g SEM
S
< 1001531 3311167 2521036 2241355 2931014 219
< 100< 100
1161 2511511 327142 31
< 100797 1721099 238648 140648 140181 39
< 100< 100< 100< 100< 100< 100< 100< 100< 100< 100
4445 9613428 7413952 8542870 6213483 753942 2042513 543

ARC-2007-D2540-049-04 Tin Distribution and Fate in Tims Branch
64
APPENDIX D: Example Mass Balance Calculations