
Time series forecasting of COVID-19 transmission in Asia ...
18
Personal and Ubiquitous Computing https://doi.org/10.1007/s00779-020-01494-0 ORIGINAL ARTICLE Time series forecasting of COVID-19 transmission in Asia Pacific countries using deep neural networks Hafiz Tayyab Rauf 1 · M. Ikram Ullah Lali 2 · Muhammad Attique Khan 3 · Seifedine Kadry 4 · Hanan Alolaiyan 5 · Abdul Razaq 6 · Rizwana Irfan 7 Received: 27 June 2020 / Accepted: 18 November 2020 © Springer-Verlag London Ltd., part of Springer Nature 2021 Abstract The novel human coronavirus disease COVID-19 has become the fifth documented pandemic since the 1918 flu pandemic. COVID-19 was first reported in Wuhan, China, and subsequently spread worldwide. Almost all of the countries of the world are facing this natural challenge. We present forecasting models to estimate and predict COVID-19 outbreak in Asia Pacific countries, particularly Pakistan, Afghanistan, India, and Bangladesh. We have utilized the latest deep learning techniques such as Long Short Term Memory networks (LSTM), Recurrent Neural Network (RNN), and Gated Recurrent Units (GRU) to quantify the intensity of pandemic for the near future. We consider the time variable and data non-linearity when employing neural networks. Each model’s salient features have been evaluated to foresee the number of COVID-19 cases in the next 10 days. The forecasting performance of employed deep learning models shown up to July 01, 2020, is more than 90% accurate, which shows the reliability of the proposed study. We hope that the present comparative analysis will provide an accurate picture of pandemic spread to the government officials so that they can take appropriate mitigation measures. Keywords COVID-19 · Convolutional neural networks · LSTM · RNN · GRU 1 Introduction At the beginning of December 2019, the extremely intense syndrome coronavirus (COVID-19) detected in the Chinese Muhammad Attique Khan [email protected] Seifedine Kadry [email protected] 1 Department of Computer Science, University of Gujrat, Gujrat, Pakistan 2 Department of Computer Science, University of Education, Lahore 54770, Pakistan 3 Department of Computer Science, HITEC University Taxila, Taxila, Pakistan 4 Department of Mathematics and Computer Science, Faculty of Science, Beirut Arab University, Beirut, Lebanon 5 Department of Mathematics, King Saud University, Riyadh 11451, Saudi Arabia 6 Division of Science and Technology, Department of Mathe- matics, University of Education, Lahore 54000, Pakistan 7 Department of Mathematics and Computer Science, Faculty of Science, University of Jeddah, Jeddah, Saudi Arabia city Wuhan caused the episode of a new coronavirus ill- ness and China turned into the epicenter of this disease [28]. Fever, breathlessness, and dry cough are the known symp- toms of this transferable disease [26]. Meanwhile, due to human traveling, the malady has spread more than 206 na- tions or regions of the world, ultimately the USA and Europe have emerged as new focal points [6, 43]. The World Health Organization announced this disease as a pandemic disease on the 11th of March 2020 [50]. After World War II, the COVID-19 has been considered as the major crisis for the world’s economy and health [7]. On the 17th of May, the confirmed patients of COVID-19 were 4799266 whereas 316520 people lost their lives due to this pandemic [51]. These figures surpassed the records of two carnivorous epidemics (SARS-CoV and MERS-CoV). Since there is no medical treatment/vaccine of coronavirus, different nations have adopted different measures to control this epidemic. Strict lockdown, partial lockdown, closure of all educational institutes, and dismissal of all types of flights are the most common in all. On January 23, 2020, the Local administration of Wuhan imposed a strict lockdown, followed by many neighboring cities soon after [17]. They suspended all types of public transport and advised the citizens to stay at home.
Transcript of Time series forecasting of COVID-19 transmission in Asia ...

Personal and Ubiquitous Computinghttps://doi.org/10.1007/s00779-020-01494-0
ORIGINAL ARTICLE
Time series forecasting of COVID-19 transmission in Asia Pacificcountries using deep neural networks
Hafiz Tayyab Rauf1 ·M. Ikram Ullah Lali2 ·Muhammad Attique Khan3 · Seifedine Kadry4 ·Hanan Alolaiyan5 ·Abdul Razaq6 · Rizwana Irfan7
Received: 27 June 2020 / Accepted: 18 November 2020© Springer-Verlag London Ltd., part of Springer Nature 2021
AbstractThe novel human coronavirus disease COVID-19 has become the fifth documented pandemic since the 1918 flu pandemic.COVID-19 was first reported in Wuhan, China, and subsequently spread worldwide. Almost all of the countries of the worldare facing this natural challenge. We present forecasting models to estimate and predict COVID-19 outbreak in Asia Pacificcountries, particularly Pakistan, Afghanistan, India, and Bangladesh. We have utilized the latest deep learning techniquessuch as Long Short Term Memory networks (LSTM), Recurrent Neural Network (RNN), and Gated Recurrent Units (GRU)to quantify the intensity of pandemic for the near future. We consider the time variable and data non-linearity whenemploying neural networks. Each model’s salient features have been evaluated to foresee the number of COVID-19 cases inthe next 10 days. The forecasting performance of employed deep learning models shown up to July 01, 2020, is more than90% accurate, which shows the reliability of the proposed study. We hope that the present comparative analysis will providean accurate picture of pandemic spread to the government officials so that they can take appropriate mitigation measures.
Keywords COVID-19 · Convolutional neural networks · LSTM · RNN · GRU
1 Introduction
At the beginning of December 2019, the extremely intensesyndrome coronavirus (COVID-19) detected in the Chinese
� Muhammad Attique [email protected]
Seifedine [email protected]
1 Department of Computer Science, University of Gujrat,Gujrat, Pakistan
2 Department of Computer Science, University of Education,Lahore 54770, Pakistan
3 Department of Computer Science, HITEC University Taxila,Taxila, Pakistan
4 Department of Mathematics and Computer Science,Faculty of Science, Beirut Arab University, Beirut, Lebanon
5 Department of Mathematics, King Saud University,Riyadh 11451, Saudi Arabia
6 Division of Science and Technology, Department of Mathe-matics, University of Education, Lahore 54000, Pakistan
7 Department of Mathematics and Computer Science, Facultyof Science, University of Jeddah, Jeddah, Saudi Arabia
city Wuhan caused the episode of a new coronavirus ill-ness and China turned into the epicenter of this disease [28].Fever, breathlessness, and dry cough are the known symp-toms of this transferable disease [26]. Meanwhile, due tohuman traveling, the malady has spread more than 206 na-tions or regions of the world, ultimately the USA and Europehave emerged as new focal points [6, 43]. The World HealthOrganization announced this disease as a pandemic diseaseon the 11th of March 2020 [50].
After World War II, the COVID-19 has been consideredas the major crisis for the world’s economy and health [7].On the 17th of May, the confirmed patients of COVID-19were 4799266 whereas 316520 people lost their lives due tothis pandemic [51]. These figures surpassed the records oftwo carnivorous epidemics (SARS-CoV and MERS-CoV).Since there is no medical treatment/vaccine of coronavirus,different nations have adopted different measures to controlthis epidemic. Strict lockdown, partial lockdown, closureof all educational institutes, and dismissal of all types offlights are the most common in all. On January 23, 2020, theLocal administration of Wuhan imposed a strict lockdown,followed by many neighboring cities soon after [17]. Theysuspended all types of public transport and advised thecitizens to stay at home.
Pers Ubiquit Comput
Due to the unavailability of the proper cure for this mala-dy, keeping up social distancing is the best way to decreaseCOVID-19 transmission from one person to another 10.Ultimately the other countries also followed the Chinesemodel of lockdown curfews and quarantines. On March 9,2020, the Government of Italy forced a national quarantinedue to the exponential increase in COVID-19 patients.Furthermore, they confined the movement of citizens exceptfor medical emergency and supply of necessary goods andservices. The similar measures were taken by Argentina(March 19, 2020 [4]), Spain (March 14, 2020 [31]), the USA(various states from March 19, 2020 [12]), South Africa(March 26, 2020 [11]), the UK (March 23, 2020 [45]) andnumerous different countries.
After China, Iran became the epicenter of this disease inAsia. Consistently, several Pakistani citizens travel to Iranto perform religious activities. On February 23, 2020, as thenumber of Corona patients began to rise, Pakistan shuts itsborder with Iran [49], but hundreds of Pakistanis somehowmanaged to return, either by diverting through Afghanistanto Pakistan or by any other way. The first two casesof COVID-19, from Karachi and Islamabad each, wereconfirmed by the Government of Pakistan officials on 26February. Both cases have recent travel history to Iran.To forestall the infection spread to other people, theGovernment decided to isolate the visitors on their arrivalfrom Iran in Taftan, a town in Baluchistan near the Pak-Iranborder [19, 37].
Such a tempestuous situation of epidemic outbreaks rai-sed several general questions: will coronavirus persists untilthe discovery of its vaccine or it will automatically be abo-lished after a certain period? How much time does the med-ical scientist need to prepare its proper medicine/vaccine?How many people will be affected by this epidemic?What could be the death/recovery rate among the affectedpatients? Does it vary in different age groups and regions ofthe world? If Yes, then what could be the possible reasons?To what extent is the lockdown policy effective to reducethe spread? What are the side effects of lockdown and howlong is it affordable for different countries?
Usually, medical predictions are not precise while theirunreliability is underestimated [29, 30]. Since the number ofcases to be investigated can be estimated single-handedly,therefore the prediction of the future of pandemics and epi-demics is not an easy task [40]. Regardless of the inaccu-racies related to medical forecasting, still these are impor-tant by portraying a picture of the present circumstances tothe public so that a comprehensive preparation can be madefor the future challenges. The uncertain circumstances of theepidemic forced the scientists and data analysts to proposedCOVID-19 spreading models to predict its intensity shortly[1, 3, 18, 32, 33, 38, 52]. Similarly, some optimization
techniques [36] can also help to optimize such models andleads to more optimal results.
In recent weeks, numerous studies on COVID-19 havebeen reported, but they lack the specific measures such as:
– Most current studies are country-specific rather thancomparative research for some regions with particularalgorithms [8].
– They also lack the time variable when taking COVID-19 data into account. Many studies are based on linearknowledge and are not linear [48].
– Some studies have considered observational studiesmodels which can only be initialized based on hypo-theses [48].
– In this work, we have developed a forecasting modelof COVID-19 outbreak in Asia pacific countries par-ticularly Pakistan, Afghanistan, India, and Bangladeshemploying state of the art deep learning models such asLSTM, RNN, and GRU.
– We assessed the key features of each model to predictthe possible number of COVID-19 cases in the next 10days.
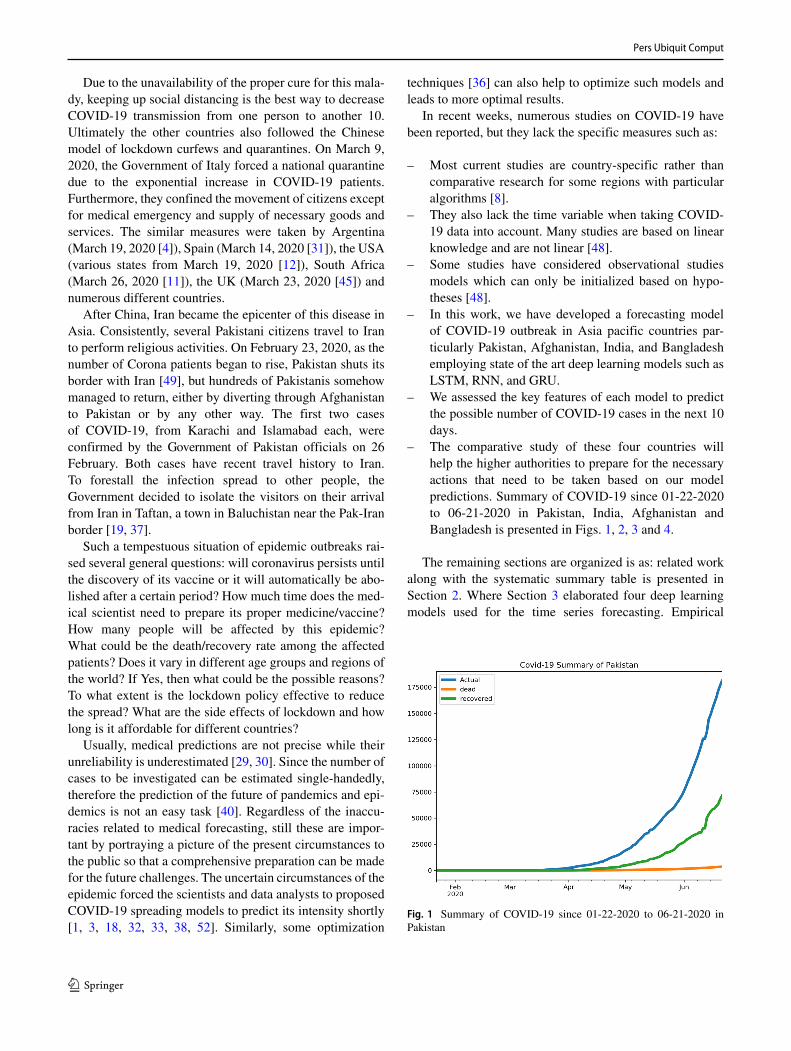
– The comparative study of these four countries willhelp the higher authorities to prepare for the necessaryactions that need to be taken based on our modelpredictions. Summary of COVID-19 since 01-22-2020to 06-21-2020 in Pakistan, India, Afghanistan andBangladesh is presented in Figs. 1, 2, 3 and 4.
The remaining sections are organized is as: related workalong with the systematic summary table is presented inSection 2. Where Section 3 elaborated four deep learningmodels used for the time series forecasting. Empirical
Fig. 1 Summary of COVID-19 since 01-22-2020 to 06-21-2020 inPakistan

Pers Ubiquit Comput
Fig. 2 Summary of COVID-19 since 01-22-2020 to 06-21-2020 inIndia
Fig. 3 Summary of COVID-19 since 01-22-2020 to 06-21-2020 inAfghanistan
Fig. 4 Summary of COVID-19 since 01-22-2020 to 06-21-2020 inBangladesh
results obtained after experiments and their analysis is donein Section 4. The study is concluded in Section 5.
2 Related work
The author employed a flower pollination algorithm andSalp Swarm Algorithm to forecast the number of COVID-19 patients in the next ten days. A. Remuzzi and G. Remuzziprovides a comprehensive analysis of COVID-19 presentand expected future situation in Italy [38]. Perc et al. [32]developed a basic iteration technique that only requiresthe daily values of affirmed cases of COVID-19 as input.The method considers anticipated recoveries and deathsand determines the maximum allowed daily growth ratesthat lead away from exponential increase toward stable anddeclining numbers. The estimates show that daily growthrates must be kept at least below 5% if we want to seeplateaus any time soon. In [52] a segmented Poisson modelis presented to examine the information available for theCOVID-19 outbreaks in the six Western countries Italy,Canada, Germany, the UK, France, and the USA. Somesimilar studies have been proposed in [23, 34, 46].
The temporal dynamics of the COVID-19 outbreak, from22-01-2020 to 15-03-2020, in China, Italy and France wereanalyzed by Fanelli and Piazza [18]. In [33] an efficientmodel for the prediction of COVID-19, in the time windowFeb 1, 2020, to March 11, 2020, is proposed. The authorsdivide the prediction time window in 4 rounds of ten dayseach. It is found that the second and third sets of forecaststhat ranges from 11/02/2020 to 01/03/2020 came very closeto the original cases. Cleo Anastassopoulou et al. [3] pre-sents Data-based analysis and prediction of the coronavirusdisease epidemic. They used publicly available epidemio-logical data for Hubei, China, from 11-01-2020 to 10-02-2020 and give assessments of the main epidemiologicalparameters. Another forecasting model of the COVID-19outbreak is presented in [1].
In the study [42], two kinds of datasets have been revea-led, i.e., huge information got from World Health Organi-zation/National databases and information from an onlinenetworking correspondence. Gauging of a pandemic shouldbe possible dependent on different boundaries, for example,the effect of natural components, the brooding period, theeffect of isolation, age, sex, and some more. These methodsand boundaries utilized for anticipating are broadly concen-trated in their work. Be that as it may, determining strategiesaccompany their arrangement of difficulties (specializedand conventional). Their investigation examines these diffi-culties and gives a lot of proposals to the individuals whoare right now battling the worldwide COVID-19 pandemic(Table 1).

Pers Ubiquit Comput
Table 1 Latest studies onCOVID-19 time series analysis Ref Dataset Methods Region Limitations
1 [21] Self-gathered Data mining (PNN+cf) China Detection of only
suspected cases
2 [20] CCDCP Composite China Focused on
Monte-Carlo (CMC) recommendation only
3 [5] WHO Logistic Hybrid Detection of only
inference countries death cases
4 [22] WHO Modified auto China + Hybrid Measuring impact
encoders (MAE) countries in qualitative way
5 [24] DATA S-013 Gompertz model + China Detection of only
Bertalanffy model death cases
6 [27] ICD Weibull equation Github Considered infection
and Hill equation rate only
7 [16] ICD Charlson Github Measure
Comorbidity risk rate
3Methods andmodels
3.1 Deep learning
Deep learning neural networks methods have emerged asa promising technique for automatically learning arbitrarycomplex mappings from inputs to outputs [35]. They sup-port multiple inputs and outputs. These techniques are ro-bust to noise, non-linear, multivariate inputs, and multi-stepforecast [2, 36, 53].
3.2 Recurrent neural network
The recurrent neural network (RNN) is a well-knownneural network in which the outcome of the precedingstep takes as input into the ongoing step [41, 53]. It isan extension of traditional neural networks. It is well-known that the inputs and outputs do not depend uponeach other in conventional neural networks, but in caseswhere the next word of a sentence has to be predicted,the previous words are essential and therefore the previouswords must be saved. This is how RNN came into being,which resolved this problem by using a hidden layer. Thehidden state is the leading aspect of RNN is the hiddenstate, in which some sequence data is stored. The presentand the recent past are the input sources of RNN networks,which together determine how they react to new data.RNN has a “memory” that stores all information aboutwhat has been computed [41, 44]. It employs the sameparameters for every input because it does the same jobfor all inputs or hidden layers to generate the results. Thisdecreases the complexity of parameters, unlike other neuralnetworks.
Let (x1, x2, x3, . . . , xT ) be the given sequence of inputsand ϕ is a non-linear mapping. Then,
[ht ={
ϕ (ht−1, xt ) , if t �= 00 if t = 0
. (1)
Conventionally, the update of the hidden state ht at timet can be implemented as;
ht = g (Wxt + Uht−1) (2)
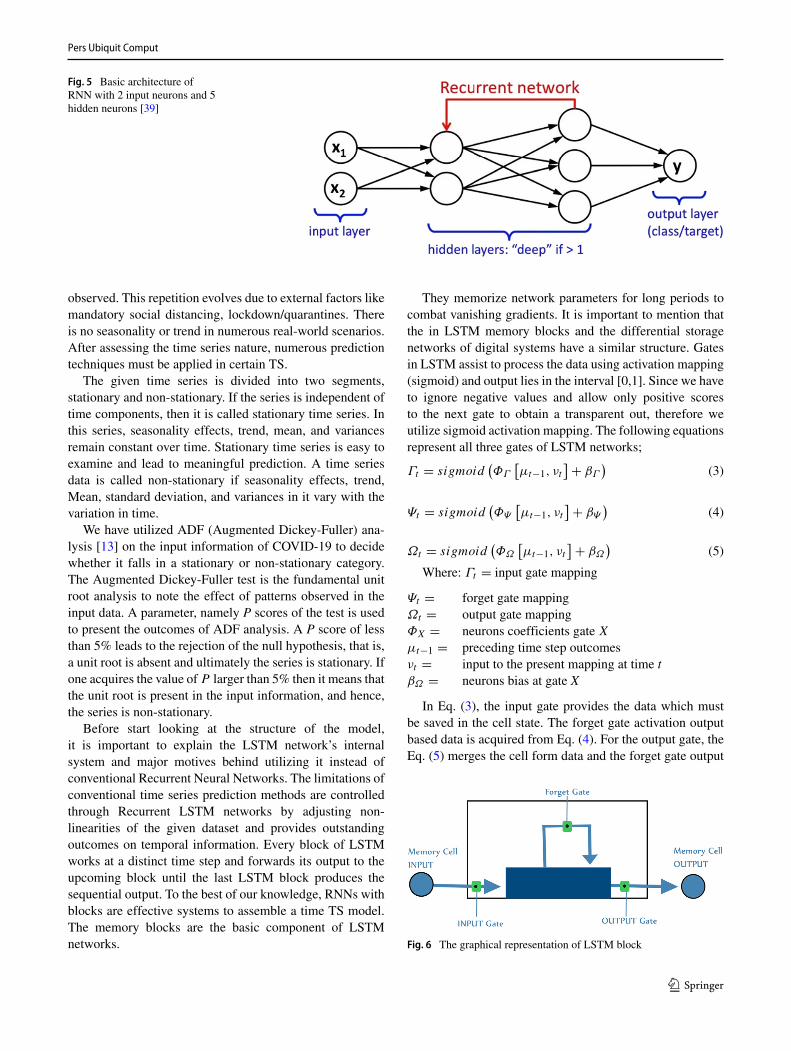
where g denotes smooth and bounded mapping just like ahyperbolic tangent map. RNN keeps track of all informationover time. It is also useful in time series forecasting becauseit remembers all previous inputs. The basic architectureof RNN with 2 input neurons and 5 hidden neurons ispresented in Fig. 5.
3.3 LSTM networks for time series modeling
Much of the real-world datasets are temporal in nature.Because of its typical features, there are various unresolvedissues with broad-spectrum applications. Time series (TS)data is the information gathered over regular time intervalssuch that every data point is evenly spaced over time. Timeseries analysis is most productive when utilized in tran-sient estimating. It is the method of predicting future pat-terns/trends of a certain event with temporal characteristics.To forecast the transmission of coronavirus, it can be pro-ductive if provided information has temporal componentsand it is different from conventional regression schemes. Atime series information may be divided into trend, error, andseasonality.
If a repetition in a specific pattern is found at regularintervals of time, then a trend in time series is said to be
Pers Ubiquit Comput
Fig. 5 Basic architecture ofRNN with 2 input neurons and 5hidden neurons [39]
observed. This repetition evolves due to external factors likemandatory social distancing, lockdown/quarantines. Thereis no seasonality or trend in numerous real-world scenarios.After assessing the time series nature, numerous predictiontechniques must be applied in certain TS.
The given time series is divided into two segments,stationary and non-stationary. If the series is independent oftime components, then it is called stationary time series. Inthis series, seasonality effects, trend, mean, and variancesremain constant over time. Stationary time series is easy toexamine and lead to meaningful prediction. A time seriesdata is called non-stationary if seasonality effects, trend,Mean, standard deviation, and variances in it vary with thevariation in time.
We have utilized ADF (Augmented Dickey-Fuller) ana-lysis [13] on the input information of COVID-19 to decidewhether it falls in a stationary or non-stationary category.The Augmented Dickey-Fuller test is the fundamental unitroot analysis to note the effect of patterns observed in theinput data. A parameter, namely P scores of the test is usedto present the outcomes of ADF analysis. A P score of lessthan 5% leads to the rejection of the null hypothesis, that is,a unit root is absent and ultimately the series is stationary. Ifone acquires the value of P larger than 5% then it means thatthe unit root is present in the input information, and hence,the series is non-stationary.
Before start looking at the structure of the model,it is important to explain the LSTM network’s internalsystem and major motives behind utilizing it instead ofconventional Recurrent Neural Networks. The limitations ofconventional time series prediction methods are controlledthrough Recurrent LSTM networks by adjusting non-linearities of the given dataset and provides outstandingoutcomes on temporal information. Every block of LSTMworks at a distinct time step and forwards its output to theupcoming block until the last LSTM block produces thesequential output. To the best of our knowledge, RNNs withblocks are effective systems to assemble a time TS model.The memory blocks are the basic component of LSTMnetworks.
They memorize network parameters for long periods tocombat vanishing gradients. It is important to mention thatthe in LSTM memory blocks and the differential storagenetworks of digital systems have a similar structure. Gatesin LSTM assist to process the data using activation mapping(sigmoid) and output lies in the interval [0,1]. Since we haveto ignore negative values and allow only positive scoresto the next gate to obtain a transparent out, therefore weutilize sigmoid activation mapping. The following equationsrepresent all three gates of LSTM networks;
Γt = sigmoid(ΦΓ
[μt−1, νt
] + βΓ
)(3)
Ψt = sigmoid(ΦΨ
[μt−1, νt
] + βΨ
)(4)
Ωt = sigmoid(ΦΩ
[μt−1, νt
] + βΩ
)(5)
Where: Γt = input gate mapping
Ψt = forget gate mappingΩt = output gate mappingΦX = neurons coefficients gate X
μt−1 = preceding time step outcomesνt = input to the present mapping at time tβΩ = neurons bias at gate X
In Eq. (3), the input gate provides the data which mustbe saved in the cell state. The forget gate activation outputbased data is acquired from Eq. (4). For the output gate, theEq. (5) merges the cell form data and the forget gate output
Fig. 6 The graphical representation of LSTM block

Pers Ubiquit Comput
Fig. 7 LSTM networkarchitecture
Fig. 8 Object process diagram of COVID-19 comparative analysis

Pers Ubiquit Comput
at the time step to generate the output. Figure 6 shows thegraphical representation of the LSTM block utilized in thiswork. The motivation for developing self-loops is to designa system that allows the sharing of weights or gradients fora long period. It is helpful to model deep networks wheregradient disappearance is an incessant problem. By modi-fying weights like self-looped gates, the time scale can beadjusted to identify the dynamically evolving parameters.With the techniques mentioned above, LSTMs achieveexcellent findings in [25]. Figure 7 shows the network archi-tecture utilized in this paper (Fig. 8).
3.4 Gated recurrent unit
Gated recurrent units (GRUs) is an upgraded version ofstandard RNN, introduced by Cho et al. in 2014 [14]. Itmakes each recurrent unit to adaptively capture dependen-cies across various time steps. The GRU, like LSTM, hasa forget gate to regulate the information flow however withfewer parameters as compared to LSTM since it does notpossess separate memory cells. The network architecture ofGRU is visualized in Fig. 9.
Let hj
t−1 and ht
j denote previous and candidate activa-
tions respectively, then activation hjt of the GRU at time t
can be calculated by the following formula:
hjt = z
jt h
t
j + hj
t−1
(1 − z
jt
)(6)
where zjt is an update gate that determines how much
the unit updates its content or activation. The followingequation is used to find the value of update gate z
jt
zjt = (Uzht−1 + Wzxi) σ (7)
The process of calculating the linear sum between thecurrent state and the recently calculated state is the same inboth GRU and LSTM units. However, GRU does not have
an appropriate system in place to control the extent to whichits condition is exposed, it rather discloses the entire stateeach time.
The candidate activation or Current Memory Gate ht
j canbe computed as;
ht
j = tanh(U
(rt
⊙ht−1
)+ Wxt
)j
(8)
Where rt denotes the reset gate and⊙
is Hadmardproduct. The reset gate rt can be calculated in a similar wayto h
t
j ; that is,
rt = σ (Wxt + Urht−1)j (9)
The working capability of GRU and LSTM in certainnatural language processing tasks, speech signal modeling,and polyphonic music modeling is found to be identical.However, the performance of GRUs is better on certainsmaller and less common data sets.
In [47] G. Weiss et al. have shown that the LSTM isstrictly stronger than the GRU because it can easily countindefinitely unlike GRU. Thus, the GRU does not learnsimple languages that can be read by the LSTM.
4 Results and discussion
The object process diagram of COVID-19 comparative ana-lysis for proposed frameworks is presented in Fig. 8. Thedataset is preprocessed to maintain the time variable at asingle column from the starting date of COVID-19 to thecurrent data used in the study. For merging several attribu-tes, we employed inner joins and other concatenation appro-aches used to pre-process the datasets [9, 10]. After that, thedata is passed to the deep learning models i.e RNN, LSTM,ANN, and GRU for training purposes. The evaluation is thenperformed before hyperparameters adjustment.
Fig. 9 The network architecture of GRU

Pers Ubiquit Comput
4.1 Dataset
The methods utilized in this research are dependent on thelive data guide and are entirely divergent from prior exami-nations. The outcome of our method time series forecastingwill assist the targeted countries to proceed further to elimi-nate the current COVID-19 pandemic. The data set used forthe training and testing of deep learning models are takenfrom the standard WHO website which is organized andpublicly available at [15]. We trained RNN, LSTM, andGRU with COVID-19 cases from 01-22-2020 until 06-21-2020. As mentioned earlier, we only consider Pakistan,India, Bangladesh, and Afghanistan for the comparativeanalysis. The proposed framework is enough dynamic innature as it updates the forecasting results each day fromeach country considered. It also considers all previous datafrom Jan 22, 2020, up to the current day to predict the next10 days number of COVID 19 cases.
4.2 Experimental setup
All experiment is performed on Haier Intel® Core™ i3-4010U CPU machine with the specifications as, 8 GBrandom access memory, 128 GB solid-state drive, and nographic card. Famous deep learning packages from pythoni.e Keras, Tensor flow, Numpy were used to implementLSTM, RNN, GRU, and ANN. The activation function forthe input layer was set to Relu with true return time seriessequences. Adam optimizer is used in the Last layer. Thevalidation length for the training process was fixed to 10and the batch size was 1 with Early-stopping epochs criteria.Moreover, the experiment for one model includes a total of100 epochs with 10 epoch per step.
4.3 Discussion
The comparative analysis of three different forecastingmodels has been carried out to predict the COVID-19 casescount in the next 10 days to help the Asia Pacific countriesto avoid this breakthrough by taking necessary actions in ad-vance. The model includes RNN, LSTM, and GRU compro-mises deep learning layers to dynamically extract thefeatures from previous knowledge and predict new patternssymmetrically. In the last couple of weeks, with more than108K COVID-19 cases, Pakistan has crossed the officialinclude in neighboring China, the nation earlier caught bythe COVID-19. Authoritatively anticipated figures proposepositive cases in Pakistan could arrive at 125K by June15. Prediction results of the next 10 days about possibleCOVID-19 cases obtained using RNN in Pakistan arepresented in Table 2.
To validate the forecasting predictions obtained usingthe proposed framework, actual cases of the previous 10
days have been taken with a confirmed number of COVID-19 patients. The minimum and a maximum difference ofactual versus predicted has been recorded to validate theperformance.
As compared to Pakistan, India got a bit high COVID-19 spread ratio. In the early stage, they were managed tocontrol it by applying sudden and strict curfew. However,as the long stretch of April began, the number of casesbegan multiplying rapidly and the early achievement beganto disentangle. Prediction results of the next 10 days aboutpossible COVID-19 cases obtained using RNN in Indiaare shown in Table 3. Patient in Afghanistan is progres-sively confronting an always serious danger: The arrival ofalmost 3M Afghan transient laborers since February fromPakistan and Iran, one of the infection’s worldwide focalpoints. The Afghan well-being service surveyed that theinfection has spread to 29 of 34 areas, first because of thesemass returns yet now naturally inside networks, as well. Pre-diction results of the next 10 days about possible COVID-19cases obtained using RNN in Afghanistan are listed inTable 4.
As compared to Afghanistan, the total confirmed casesof the coronavirus outbreak are higher in Bangladesh sincethe month of June. But lesser than the total confirm countin Pakistan and India. However, the corresponding ratioof spreading is high then the other small Asian regions.Prediction results of the next 10 days about possibleCOVID-19 cases obtained using RNN in Bangladesh areelaborated in Table 5. Similarly, Table 6 representing theforecasting results obtained from 22/6/2020 to 1/7/2020 inPakistan by using the GRU model. In addition, possibletotal confirms count in India, Afghanistan, and Bangladeshpredicted by GRU from 22/6/2020 to 1/7/2020 are shown inTables 7, 8 and 9.
Lastly, we employed LSTM to check the relation of fore-casting prediction with GRU and RNN in terms of betteraccuracy, minimum range, maximum range, and the corres-ponding intervals. The empirical results obtained usingLSTM with the next 10 COVID-19 cases prediction in Pak-istan are recorded in Table 10. Moreover, possible totalconfirmed counts in India, Afghanistan, and Bangladeshpredicted by LSTM from 22/6/2020 to 1/7/2020 are shownin Tables 11, 12 and 13. From Tables 2, 3, 4, 5, 6, 7, 8,9, 10, 11, 12, and 13, Actual shows the already confirmedcases from 12/06/2020 to 21/06/2020, predicted repre-senting the total number of confirmed cases predicted bythe corresponding model in a particular state. Where Minreveals the minimum number of predictive cases and Maxdisplays the maximum number of predictive COVID-19cases in a particular country from 12/06/2020 to 1/07/2020.
Graphical representation of the next 10 days COVID-19 cases prediction obtained using RNN in Pakistan areexhibited in Fig. 10 Where the visualization curves for
Pers Ubiquit Comput
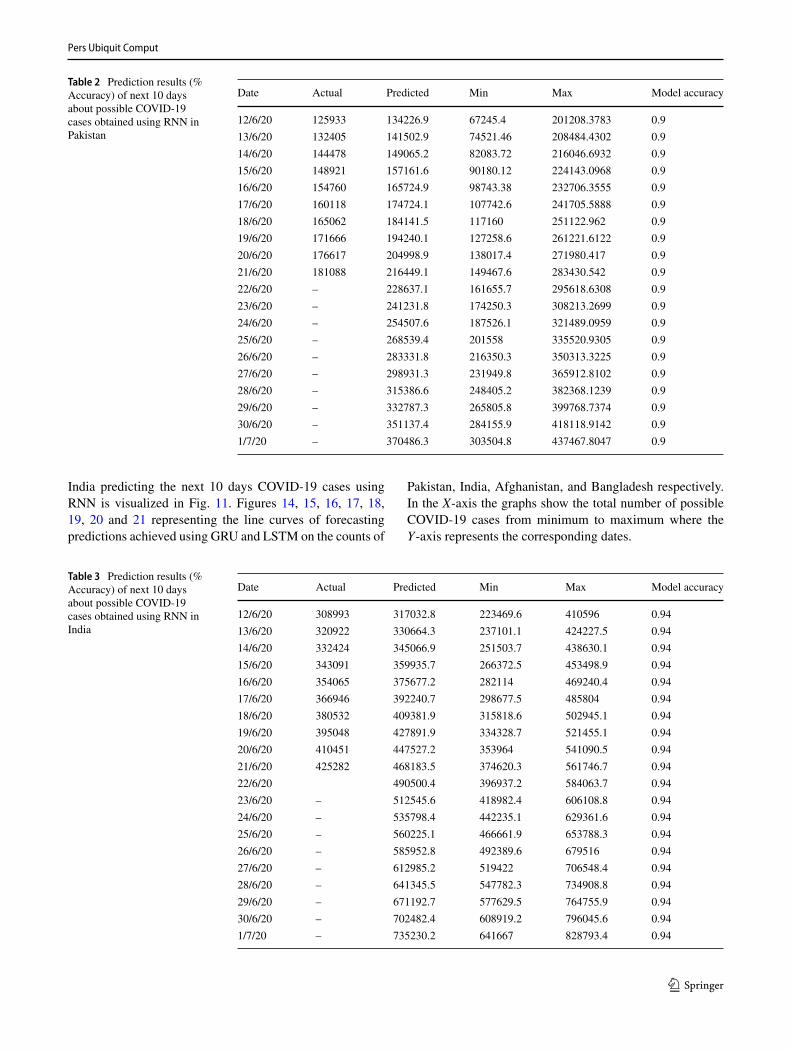
Table 2 Prediction results (%Accuracy) of next 10 daysabout possible COVID-19cases obtained using RNN inPakistan
Date Actual Predicted Min Max Model accuracy
12/6/20 125933 134226.9 67245.4 201208.3783 0.9
13/6/20 132405 141502.9 74521.46 208484.4302 0.9
14/6/20 144478 149065.2 82083.72 216046.6932 0.9
15/6/20 148921 157161.6 90180.12 224143.0968 0.9
16/6/20 154760 165724.9 98743.38 232706.3555 0.9
17/6/20 160118 174724.1 107742.6 241705.5888 0.9
18/6/20 165062 184141.5 117160 251122.962 0.9
19/6/20 171666 194240.1 127258.6 261221.6122 0.9
20/6/20 176617 204998.9 138017.4 271980.417 0.9
21/6/20 181088 216449.1 149467.6 283430.542 0.9
22/6/20 – 228637.1 161655.7 295618.6308 0.9
23/6/20 – 241231.8 174250.3 308213.2699 0.9
24/6/20 – 254507.6 187526.1 321489.0959 0.9
25/6/20 – 268539.4 201558 335520.9305 0.9
26/6/20 – 283331.8 216350.3 350313.3225 0.9
27/6/20 – 298931.3 231949.8 365912.8102 0.9
28/6/20 – 315386.6 248405.2 382368.1239 0.9
29/6/20 – 332787.3 265805.8 399768.7374 0.9
30/6/20 – 351137.4 284155.9 418118.9142 0.9
1/7/20 – 370486.3 303504.8 437467.8047 0.9
India predicting the next 10 days COVID-19 cases usingRNN is visualized in Fig. 11. Figures 14, 15, 16, 17, 18,19, 20 and 21 representing the line curves of forecastingpredictions achieved using GRU and LSTM on the counts of
Pakistan, India, Afghanistan, and Bangladesh respectively.In the X-axis the graphs show the total number of possibleCOVID-19 cases from minimum to maximum where theY-axis represents the corresponding dates.
Table 3 Prediction results (%Accuracy) of next 10 daysabout possible COVID-19cases obtained using RNN inIndia
Date Actual Predicted Min Max Model accuracy
12/6/20 308993 317032.8 223469.6 410596 0.94
13/6/20 320922 330664.3 237101.1 424227.5 0.94
14/6/20 332424 345066.9 251503.7 438630.1 0.94
15/6/20 343091 359935.7 266372.5 453498.9 0.94
16/6/20 354065 375677.2 282114 469240.4 0.94
17/6/20 366946 392240.7 298677.5 485804 0.94
18/6/20 380532 409381.9 315818.6 502945.1 0.94
19/6/20 395048 427891.9 334328.7 521455.1 0.94
20/6/20 410451 447527.2 353964 541090.5 0.94
21/6/20 425282 468183.5 374620.3 561746.7 0.94
22/6/20 490500.4 396937.2 584063.7 0.94
23/6/20 – 512545.6 418982.4 606108.8 0.94
24/6/20 – 535798.4 442235.1 629361.6 0.94
25/6/20 – 560225.1 466661.9 653788.3 0.94
26/6/20 – 585952.8 492389.6 679516 0.94
27/6/20 – 612985.2 519422 706548.4 0.94
28/6/20 – 641345.5 547782.3 734908.8 0.94
29/6/20 – 671192.7 577629.5 764755.9 0.94
30/6/20 – 702482.4 608919.2 796045.6 0.94
1/7/20 – 735230.2 641667 828793.4 0.94

Pers Ubiquit Comput
Table 4 Prediction results (%Accuracy) of next 10 daysabout possible COVID-19cases obtained using RNN inAfghanistan
Date Actual Predicted Min Max Model accuracy
12/6/20 23546 24981.77 10513.29 39450.25 0.87
13/6/20 24102 25955.72 11487.24 40424.2 0.87
14/6/20 24766 26969.66 12501.18 41438.14 0.87
15/6/20 25527 28076.02 13607.54 42544.5 0.87
16/6/20 26310 29215.89 14747.42 43684.37 0.87
17/6/20 26874 30386.37 15917.89 44854.85 0.87
18/6/20 27532 31596.84 17128.36 46065.32 0.87
19/6/20 27878 32910.18 18441.7 47378.66 0.87
20/6/20 28424 34315.72 19847.24 48784.2 0.87
21/6/20 28833 35853.4 21384.92 50321.88 0.87
22/6/20 – 37461.69 22993.21 51930.17 0.87
23/6/20 – 38973.29 24504.81 53441.77 0.87
24/6/20 – 40564.4 26095.92 55032.88 0.87
25/6/20 – 42236.78 27768.3 56705.26 0.87
26/6/20 – 43975.14 29506.66 58443.62 0.87
27/6/20 – 45782.14 31313.66 60250.62 0.87
28/6/20 – 47671.29 33202.81 62139.77 0.87
29/6/20 – 49648.07 35179.59 64116.55 0.87
30/6/20 – 51707.58 37239.1 66176.06 0.87
1/7/20 – 53848.19 39379.72 68316.67 0.87
We have used the real-time live uni-variate data set whichmeans the deep learning model only considering date andtime to predict the next 10 days cases. Furthermore, we
are monitoring the response from live data which is pro-duced by domain-specific expertise hence, no data businessexists.
Table 5 Prediction results (%Accuracy) of next 10 daysabout possible COVID-19cases obtained using RNN inBangladesh
Date Actual Predicted Min Max Model accuracy
12/6/20 81523 84733.74 61672.11 107795.4 0.94
13/6/20 84379 88212.18 65150.55 111273.8 0.94
14/6/20 87520 91878.88 68817.25 114940.5 0.94
15/6/20 90619 95731.17 72669.55 118792.8 0.94
16/6/20 94481 99730.28 76668.66 122791.9 0.94
17/6/20 98489 103949.4 80887.81 127011.1 0.94
18/6/20 102292 108450.4 85388.76 131512 0.94
19/6/20 105535 113094 90032.37 136155.6 0.94
20/6/20 108775 117859.3 94797.71 140921 0.94
21/6/20 112306 122805 99743.38 145866.6 0.94
22/6/20 – 128139.4 105077.8 151201 0.94
23/6/20 – 133080.8 110019.2 156142.5 0.94
24/6/20 – 138236.6 115175 161298.2 0.94
25/6/20 – 143582.3 120520.7 166644 0.94
26/6/20 – 149114.2 126052.6 172175.8 0.94
27/6/20 – 154838.7 131777 177900.3 0.94
28/6/20 – 160753.9 137692.3 183815.5 0.94
29/6/20 – 166811.9 143750.3 189873.5 0.94
30/6/20 – 173027.7 149966.1 196089.4 0.94
1/7/20 – 179418.8 156357.2 202480.5 0.94

Pers Ubiquit Comput
Table 6 Prediction results(% Accuracy) of next 10 daysabout possible COVID-19cases obtained using GRU inPakistan
Date Actual Predicted Min Max Model accuracy
12/6/20 125933 131041.2 77119.9 184962.4 0.93
13/6/20 132405 138180.1 84258.78 192101.3 0.93
14/6/20 144478 145584.1 91662.79 199505.3 0.93
15/6/20 148921 153412.8 99491.5 207334.1 0.93
16/6/20 154760 161671.8 107750.6 215593.1 0.93
17/6/20 160118 170412.1 116490.9 224333.4 0.93
18/6/20 165062 179714.2 125792.9 233635.4 0.93
19/6/20 171666 189699.5 135778.3 243620.8 0.93
20/6/20 176617 200325.4 146404.2 254246.7 0.93
21/6/20 181088 211648.9 157727.6 265570.2 0.93
22/6/20 – 223692.3 169771 277613.6 0.93
23/6/20 – 236739.3 182818 290660.5 0.93
24/6/20 – 250631.8 196710.6 304553.1 0.93
25/6/20 – 265466.8 211545.6 319388.1 0.93
26/6/20 – 281328.3 227407 335249.6 0.93
27/6/20 – 298306.1 244384.8 352227.4 0.93
28/6/20 – 316509.8 262588.5 370431.1 0.93
29/6/20 – 336041.5 282120.2 389962.8 0.93
30/6/20 – 357000.2 303079 410921.5 0.93
1/7/20 – 379516.4 325595.1 433437.7 0.93
4.4 Performance analysis
The empirical analysis has been done on all the experimentsperformed to show the achievement of employed models on
different datasets and to co-relate the insights extracted fromthe results. From Table 2, we obtained 90% accuracy withRNN to predict COVID-19 cases in Pakistan for the next10 days. We can see that on 12/6/20 there are 12599 actual
Table 7 Prediction results (%Accuracy) of next 10 daysabout possible COVID-19cases obtained using GRU inIndia
Date Actual Predicted Min Max Model accuracy
12/6/20 308993 332399.6 153263.3 511535.9 0.87
13/6/20 320922 346945.2 167809 526081.5 0.87
14/6/20 332424 363164.4 184028.1 542300.7 0.87
15/6/20 343091 379782.3 200646 558918.6 0.87
16/6/20 354065 397318.8 218182.5 576455.1 0.87
17/6/20 366946 415597.5 236461.2 594733.7 0.87
18/6/20 380532 435098.1 255961.8 614234.4 0.87
19/6/20 395048 456404.1 277267.8 635540.4 0.87
20/6/20 410451 478479 299342.7 657615.3 0.87
21/6/20 425282 502325.6 323189.3 681461.9 0.87
22/6/20 – 526626.5 347490.2 705762.8 0.87
23/6/20 – 549795 370658.8 728931.3 0.87
24/6/20 – 574109.9 394973.6 753246.2 0.87
25/6/20 – 599436.4 420300.2 778572.7 0.87
26/6/20 – 625846.6 446710.3 804982.9 0.87
27/6/20 – 653273.2 474137 832409.5 0.87
28/6/20 – 681790.3 502654 860926.5 0.87
29/6/20 – 711335.3 532199.1 890471.6 0.87
30/6/20 – 741825.9 562689.6 920962.2 0.87
1/7/20 – 773323.6 594187.3 952459.9 0.87
Pers Ubiquit Comput
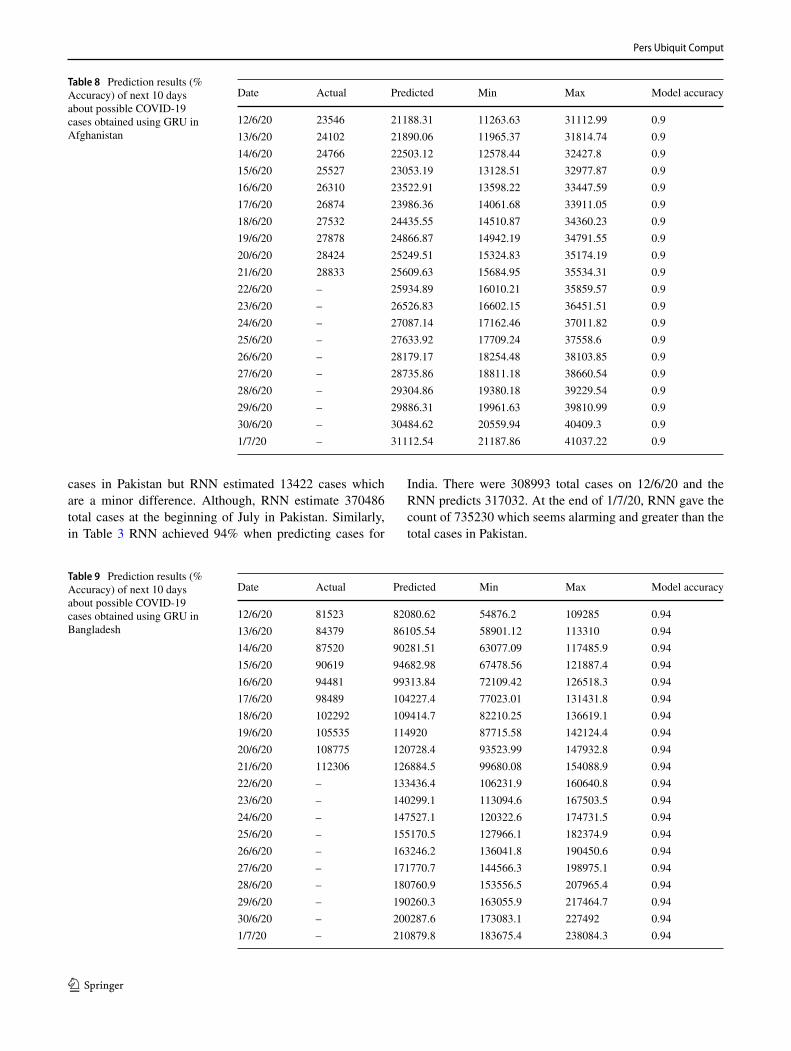
Table 8 Prediction results (%Accuracy) of next 10 daysabout possible COVID-19cases obtained using GRU inAfghanistan
Date Actual Predicted Min Max Model accuracy
12/6/20 23546 21188.31 11263.63 31112.99 0.9
13/6/20 24102 21890.06 11965.37 31814.74 0.9
14/6/20 24766 22503.12 12578.44 32427.8 0.9
15/6/20 25527 23053.19 13128.51 32977.87 0.9
16/6/20 26310 23522.91 13598.22 33447.59 0.9
17/6/20 26874 23986.36 14061.68 33911.05 0.9
18/6/20 27532 24435.55 14510.87 34360.23 0.9
19/6/20 27878 24866.87 14942.19 34791.55 0.9
20/6/20 28424 25249.51 15324.83 35174.19 0.9
21/6/20 28833 25609.63 15684.95 35534.31 0.9
22/6/20 – 25934.89 16010.21 35859.57 0.9
23/6/20 – 26526.83 16602.15 36451.51 0.9
24/6/20 – 27087.14 17162.46 37011.82 0.9
25/6/20 – 27633.92 17709.24 37558.6 0.9
26/6/20 – 28179.17 18254.48 38103.85 0.9
27/6/20 – 28735.86 18811.18 38660.54 0.9
28/6/20 – 29304.86 19380.18 39229.54 0.9
29/6/20 – 29886.31 19961.63 39810.99 0.9
30/6/20 – 30484.62 20559.94 40409.3 0.9
1/7/20 – 31112.54 21187.86 41037.22 0.9
cases in Pakistan but RNN estimated 13422 cases whichare a minor difference. Although, RNN estimate 370486total cases at the beginning of July in Pakistan. Similarly,in Table 3 RNN achieved 94% when predicting cases for
India. There were 308993 total cases on 12/6/20 and theRNN predicts 317032. At the end of 1/7/20, RNN gave thecount of 735230 which seems alarming and greater than thetotal cases in Pakistan.
Table 9 Prediction results (%Accuracy) of next 10 daysabout possible COVID-19cases obtained using GRU inBangladesh
Date Actual Predicted Min Max Model accuracy
12/6/20 81523 82080.62 54876.2 109285 0.94
13/6/20 84379 86105.54 58901.12 113310 0.94
14/6/20 87520 90281.51 63077.09 117485.9 0.94
15/6/20 90619 94682.98 67478.56 121887.4 0.94
16/6/20 94481 99313.84 72109.42 126518.3 0.94
17/6/20 98489 104227.4 77023.01 131431.8 0.94
18/6/20 102292 109414.7 82210.25 136619.1 0.94
19/6/20 105535 114920 87715.58 142124.4 0.94
20/6/20 108775 120728.4 93523.99 147932.8 0.94
21/6/20 112306 126884.5 99680.08 154088.9 0.94
22/6/20 – 133436.4 106231.9 160640.8 0.94
23/6/20 – 140299.1 113094.6 167503.5 0.94
24/6/20 – 147527.1 120322.6 174731.5 0.94
25/6/20 – 155170.5 127966.1 182374.9 0.94
26/6/20 – 163246.2 136041.8 190450.6 0.94
27/6/20 – 171770.7 144566.3 198975.1 0.94
28/6/20 – 180760.9 153556.5 207965.4 0.94
29/6/20 – 190260.3 163055.9 217464.7 0.94
30/6/20 – 200287.6 173083.1 227492 0.94
1/7/20 – 210879.8 183675.4 238084.3 0.94

Pers Ubiquit Comput
Table 10 Prediction results (%Accuracy) of next 10 daysabout possible COVID-19cases obtained using LSTM inPakistan
Date Actual Predicted Min Max Model accuracy
12/6/20 125933 126551.1 80093.88 173008.4 0.95
13/6/20 132405 133051.9 86594.6 179509.1 0.95
14/6/20 144478 139895.2 93437.96 186352.5 0.95
15/6/20 148921 147356 100898.7 193813.3 0.95
16/6/20 154760 155496.2 109038.9 201953.4 0.95
17/6/20 160118 164387.7 117930.5 210845 0.95
18/6/20 165062 174276.9 127819.7 220734.2 0.95
19/6/20 171666 185305.9 138848.6 231763.1 0.95
20/6/20 176617 197666.2 151209 244123.5 0.95
21/6/20 181088 211557.6 165100.3 258014.9 0.95
22/6/20 – 227421.5 180964.3 273878.8 0.95
23/6/20 – 247040.5 200583.2 293497.8 0.95
24/6/20 – 270386.4 223929.1 316843.7 0.95
25/6/20 – 298734.5 252277.2 345191.8 0.95
26/6/20 – 333906.7 287449.4 380363.9 0.95
27/6/20 – 378636.2 332178.9 425093.5 0.95
28/6/20 – 437217.5 390760.2 483674.8 0.95
29/6/20 – 516609.6 470152.3 563066.9 0.95
30/6/20 – 629117.2 582660 675574.5 0.95
1/7/20 – 797175.6 750718.3 843632.9 0.95
As compared to Pakistan and India, Afghanistan gotlow accuracy of 87% with RNN (referred to Table 4). On12/6/20 the actual score was 23546 with the prediction of atotal 24981 however, in the end, it leads to the 53848 which
is still better than other Asia Pacific countries (Fig. 12).Likewise, in the case of Bangladesh, RNN shows 94%accuracy in Table 5 with 81523 actual cases and 84773predicted cases at the beginning (Fig. 13). RNN inferred
Table 11 Prediction results (%Accuracy) of next 10 daysabout possible COVID-19cases obtained using LSTM inIndia
Date Actual Predicted Min Max Model accuracy
12/6/20 308993 318334.9 197827.6 438842.2 0.92
13/6/20 320922 332589.2 212081.9 453096.5 0.92
14/6/20 332424 347646.9 227139.6 468154.1 0.92
15/6/20 343091 363579.2 243071.9 484086.4 0.92
16/6/20 354065 380415.1 259907.8 500922.4 0.92
17/6/20 366946 398203.8 277696.5 518711.1 0.92
18/6/20 380532 417062.3 296555 537569.5 0.92
19/6/20 395048 437344.8 316837.5 557852.1 0.92
20/6/20 410451 459148 338640.7 579655.3 0.92
21/6/20 425282 482722.8 362215.5 603230.1 0.92
22/6/20 – 508295.9 387788.6 628803.1 0.92
23/6/20 – 535545.1 415037.8 656052.4 0.92
24/6/20 – 565201 444693.8 685708.3 0.92
25/6/20 – 597633.3 477126 718140.6 0.92
26/6/20 – 633260.4 512753.1 753767.7 0.92
27/6/20 – 672634.2 552127 793141.5 0.92
28/6/20 – 716452.1 595944.9 836959.4 0.92
29/6/20 – 765584.7 645077.4 886092 0.92
30/6/20 – 821098 700590.7 941605.3 0.92
1/7/20 – 884364.1 763856.9 1004871 0.92
Pers Ubiquit Comput
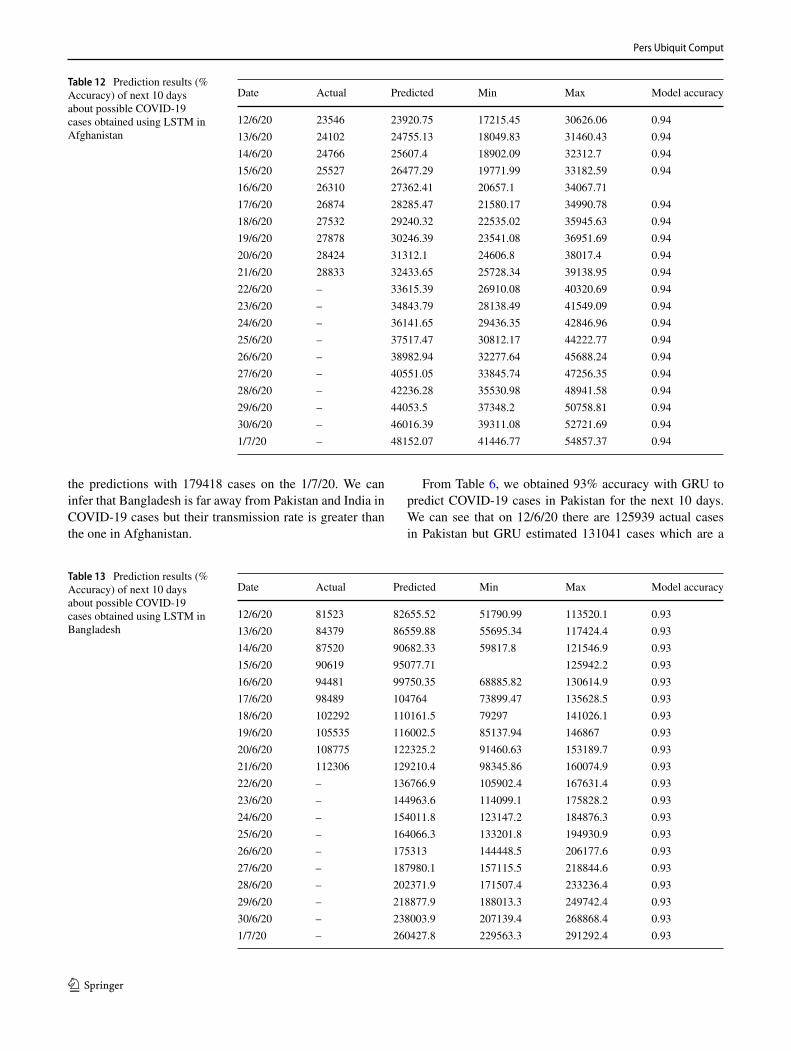
Table 12 Prediction results (%Accuracy) of next 10 daysabout possible COVID-19cases obtained using LSTM inAfghanistan
Date Actual Predicted Min Max Model accuracy
12/6/20 23546 23920.75 17215.45 30626.06 0.94
13/6/20 24102 24755.13 18049.83 31460.43 0.94
14/6/20 24766 25607.4 18902.09 32312.7 0.94
15/6/20 25527 26477.29 19771.99 33182.59 0.94
16/6/20 26310 27362.41 20657.1 34067.71
17/6/20 26874 28285.47 21580.17 34990.78 0.94
18/6/20 27532 29240.32 22535.02 35945.63 0.94
19/6/20 27878 30246.39 23541.08 36951.69 0.94
20/6/20 28424 31312.1 24606.8 38017.4 0.94
21/6/20 28833 32433.65 25728.34 39138.95 0.94
22/6/20 – 33615.39 26910.08 40320.69 0.94
23/6/20 – 34843.79 28138.49 41549.09 0.94
24/6/20 – 36141.65 29436.35 42846.96 0.94
25/6/20 – 37517.47 30812.17 44222.77 0.94
26/6/20 – 38982.94 32277.64 45688.24 0.94
27/6/20 – 40551.05 33845.74 47256.35 0.94
28/6/20 – 42236.28 35530.98 48941.58 0.94
29/6/20 – 44053.5 37348.2 50758.81 0.94
30/6/20 – 46016.39 39311.08 52721.69 0.94
1/7/20 – 48152.07 41446.77 54857.37 0.94
the predictions with 179418 cases on the 1/7/20. We caninfer that Bangladesh is far away from Pakistan and India inCOVID-19 cases but their transmission rate is greater thanthe one in Afghanistan.
From Table 6, we obtained 93% accuracy with GRU topredict COVID-19 cases in Pakistan for the next 10 days.We can see that on 12/6/20 there are 125939 actual casesin Pakistan but GRU estimated 131041 cases which are a
Table 13 Prediction results (%Accuracy) of next 10 daysabout possible COVID-19cases obtained using LSTM inBangladesh
Date Actual Predicted Min Max Model accuracy
12/6/20 81523 82655.52 51790.99 113520.1 0.93
13/6/20 84379 86559.88 55695.34 117424.4 0.93
14/6/20 87520 90682.33 59817.8 121546.9 0.93
15/6/20 90619 95077.71 125942.2 0.93
16/6/20 94481 99750.35 68885.82 130614.9 0.93
17/6/20 98489 104764 73899.47 135628.5 0.93
18/6/20 102292 110161.5 79297 141026.1 0.93
19/6/20 105535 116002.5 85137.94 146867 0.93
20/6/20 108775 122325.2 91460.63 153189.7 0.93
21/6/20 112306 129210.4 98345.86 160074.9 0.93
22/6/20 – 136766.9 105902.4 167631.4 0.93
23/6/20 – 144963.6 114099.1 175828.2 0.93
24/6/20 – 154011.8 123147.2 184876.3 0.93
25/6/20 – 164066.3 133201.8 194930.9 0.93
26/6/20 – 175313 144448.5 206177.6 0.93
27/6/20 – 187980.1 157115.5 218844.6 0.93
28/6/20 – 202371.9 171507.4 233236.4 0.93
29/6/20 – 218877.9 188013.3 249742.4 0.93
30/6/20 – 238003.9 207139.4 268868.4 0.93
1/7/20 – 260427.8 229563.3 291292.4 0.93

Pers Ubiquit Comput
Fig. 10 Graphical representation of next 10 days COVID-19 casesprediction obtained using RNN in Pakistan
Fig. 11 Graphical representation of next 10 days COVID-19 casesprediction obtained using RNN in India
Fig. 12 Graphical representation of next 10 days COVID-19 casesprediction obtained using RNN in Afghanistan
Fig. 13 Graphical representation of next 10 days COVID-19 casesprediction obtained using RNN in Bangladesh
secondary diversity. Although, GRU evaluated 379516 totalcases at the beginning of July in Pakistan. Furthermore,in Table 7 GRU scored 87% when predicting cases forIndia. There were 308993 total cases on 12/6/20 and theGRU predicts 332399. At the end on 1/7/20 GRU deliveredthe count of 773323 which appears distressing and greaterthan total cases in Pakistan. Afghanistan got accuracy of90% with GRU (referred to Table 8). On 12/6/20 the actualscore was 23546 with the prediction of a total 21188.31however in the end it leads to the 31112.54. Besides, inthe case of Bangladesh, GRU shows 94% accuracy inTable 9 with 81523 actual cases and 82080 predicted casesat the commencement. GRU inferred the predictions with210879.8 cases on the 1/7/20.
From Table 10, we reached 95% accuracy with LSTM topredict COVID-19 cases in Pakistan for the next 10 days.We can see that on 12/6/20 there are 12599 actual casesin Pakistan but LSTM predicted 126551.1 cases. It is the
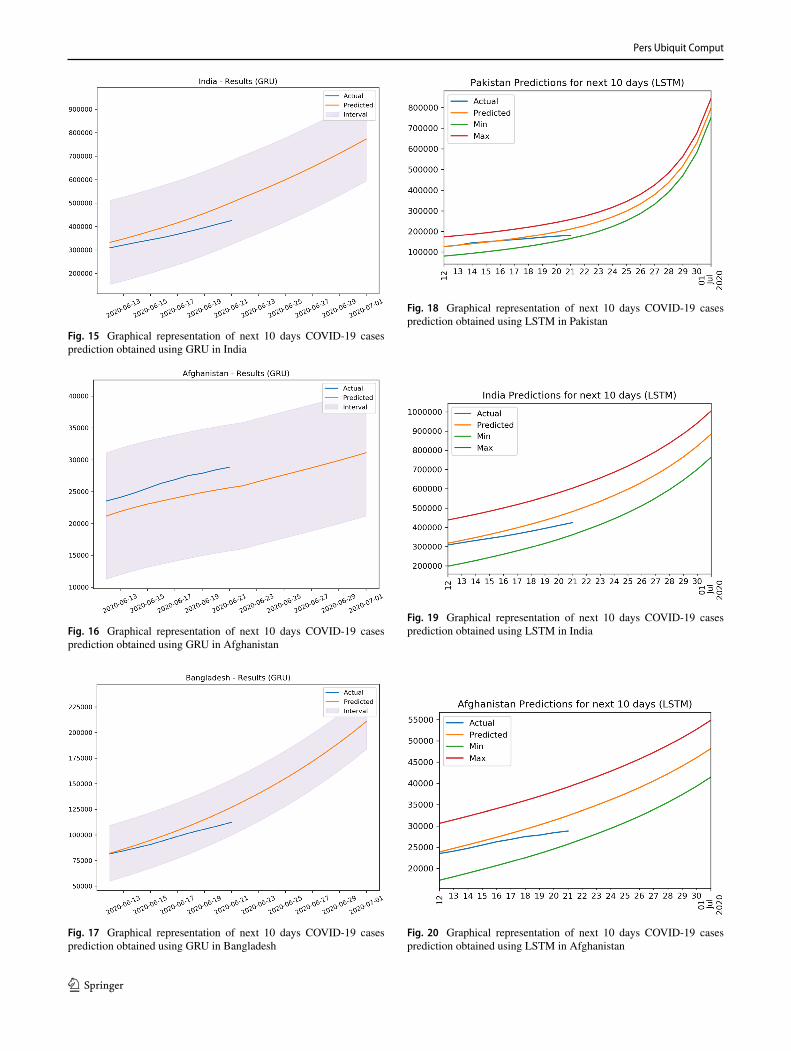
Fig. 14 Graphical representation of next 10 days COVID-19 casesprediction obtained using GRU in Pakistan
Pers Ubiquit Comput
Fig. 15 Graphical representation of next 10 days COVID-19 casesprediction obtained using GRU in India
Fig. 16 Graphical representation of next 10 days COVID-19 casesprediction obtained using GRU in Afghanistan
Fig. 17 Graphical representation of next 10 days COVID-19 casesprediction obtained using GRU in Bangladesh
Fig. 18 Graphical representation of next 10 days COVID-19 casesprediction obtained using LSTM in Pakistan
Fig. 19 Graphical representation of next 10 days COVID-19 casesprediction obtained using LSTM in India
Fig. 20 Graphical representation of next 10 days COVID-19 casesprediction obtained using LSTM in Afghanistan

Pers Ubiquit Comput
Fig. 21 Graphical representation of next 10 days COVID-19 casesprediction obtained using LSTM in Bangladesh
best accuracy so far we achieved with any other modeland other countries. Nevertheless, LSTM rated 797175total cases at the beginning of July in Pakistan. Thus, inTable 11 LSTM achieved 92% when predicting cases forIndia. There were 308993 total cases on 12/6/20 and theLSTM predicts 318334.9. At the end of 1/7/20 LSTMproffered the count of 884364. Table 11 and 12 shows theaccuracy of 94% and 93% using LSTM for Afghanistanand Bangladesh respectively. After analyzing the trendcurves of total count in Asia pacific areas (referred to asFigs. 14, 15, 16, 17, 18, 19, 20 and 21) we can concludethe order of COVID-10 prediction in terms of total casesfrom higher to lower as India > Pakistan > Bangladesh> Afghanistan.
5 Conclusion
Approximately all of the world’s countries face COVID-19 as their natural threat. Better predictive models needto be in place to predict danger in advance. The presentstudy deals with the prediction of the COVID-19 epidemicin Pakistan, Afghanistan, India, and Bangladesh. We usedthe most recent deep learning algorithms such as LSTM,RNN, and GRU to predict the number of cases of COVID-19 pandemic for the next 10 days. The data set usedfor the implementation of deep learning techniques isobtained from the official WHO website. The outcomesof our models are very encouraging as one can seethe results until July 01, 2020, having a precision rategreater than 90%, which indicates the authenticity of theproposed model. We are closely monitoring the spread ofthe pandemic in the Gulf and some European countriesand planning to conduct an extensive study in our futureresearch.
Compliance with ethical standards
Conflict of interest The authors declare that they have no conflict ofinterest.
Ethical approval This article does not contain any studies with humanparticipants or animals performed by any of the authors.
Informed consent Informed consent was obtained from all individualparticipants included in the study.
References
1. Al-Qaness MA, Ewees AA, Fan H, Abd El Aziz M (2020)Optimization method for forecasting confirmed cases of covid-19in China. J Clin Med 9(3):674
2. Almalaq A, Edwards G (2017) A review of deep learning methodsapplied on load forecasting. In: 2017 16th IEEE internationalconference on machine learning and applications (ICMLA), IEEE,pp 511–516
3. Anastassopoulou C, Russo L, Tsakris A, Siettos C (2020)Data-based analysis, modelling and forecasting of the covid-19outbreak. PloS One 15(3):e0230405
4. Argentina orders ‘exceptional’ lockdown in bid to contain virus.bloomberg.com. 20 March 2020. retrieved 20 March 2020. (2020)
5. Batista M (2020) Estimation of the final size of the second phase ofthe coronavirus covid 19 epidemic by the logistic model. medrxiv
6. Bbc news (2020) https://www.bbc.com/news/world-europe-51876784. Accessed 21 June 2020
7. Bbc news (2020) https://www.bbc.com/news/world-52114829.Accessed 21 June 2020
8. Benvenuto D, Giovanetti M, Vassallo L, Angeletti S, Ciccozzi M(2020) Application of the ARIMA model on the COVID-2019 epi-demic dataset. Data in Brief 29:105340. https://doi.org/10.1016/j.dib.2020.105340
9. Bhati BS, Rai CS (2019) Analysis of support vector machine-based intrusion detection techniques. Arab J Sci Eng 45(4):2371–2383. https://doi.org/10.1007/s13369-019-03970-z
10. Bhati BS, Rai C, Balamurugan B, Al-Turjman F (2020) An intru-sion detection scheme based on the ensemble of discriminant clas-sifiers. Comput Electr Eng 86:106742. https://doi.org/10.1016/j.compeleceng.2020.106742
11. Burke J (2020) South Africa to go into 21-day lockdown onthursday night. The Guardian. Retrieved 24 March 2020
12. Calfas J, Stancati M, Yap C-W (2020) California orders lockdownfor state’s 40 million residents. Wall Str J
13. Cheung YW, Lai KS (1995) Lag order and critical values of theaugmented dickey–fuller test. J Bus Econ Stat 13(3):277–280
14. Cho K, Van Merrienboer B, Gulcehre C, Bahdanau D, BougaresF, Schwenk H, Bengio Y (2014) Learning phrase representationsusing rnn encoder-decoder for statistical machine translation.arXiv:14061078
15. Covid-19 (2018) https://raw.githubusercontent.com/CSSEGISandData/COVID-19/master/csse covid 19 data/csse covid 19 time series/time series covid19 confirmed global.csv. Accessed 21 June 2020
16. DeCaprio D, Gartner J, Burgess T, Kothari S, Sayed S (2020)Building a covid-19 vulnerability index. arXiv:200307347
17. Du Z, Wang L, Cauchemez S, Xu X, Wang X, Cowling BJ,Meyers LA (2020) Risk of 2019 novel coronavirus importationsthroughout China prior to the Wuhan quarantine. medrxiv
18. Fanelli D, Piazza F (2020) Analysis and forecast of covid-19spreading in China, Italy and France. Chaos, Solitons Fractals134:109761

Pers Ubiquit Comput
19. Fong SJ, Dey N, Chaki J (2020) Ai-enabled technologies thatfight the coronavirus outbreak. In: Artificial intelligence forcoronavirus outbreak. Springer, pp 23–45
20. Fong SJ, Li G, Dey N, Crespo RG, Herrera-Viedma E (2020)Composite monte carlo decision making under high uncertaintyof novel coronavirus epidemic using hybridized deep learning andfuzzy rule induction. Appl Soft Comput: 106282
21. Fong SJ, Li G, Dey N, Crespo RG, Herrera-Viedma E (2020)Finding an accurate early forecasting model from small dataset: acase of 2019-ncov novel coronavirus outbreak. arXiv:200310776
22. Hu Z, Ge Q, Li S, Jin L, Xiong M (2020) Evaluating the effect ofpublic health intervention on the global-wide spread trajectory ofcovid-19. medrxiv
23. Hussain AA, Bouachir O, Al-Turjman F, Aloqaily M (2020) Aitechniques for covid-19. IEEE Access
24. Jia L, Li K, Jiang Y, Guo X, et al. (2020) Prediction and analysisof coronavirus disease 2019. arXiv:200305447
25. Karim F, Majumdar S, Darabi H (2019) Insights into lstm fullyconvolutional networks for time series classification. IEEE Access7:67718–67725
26. Kelvin AA, Halperin S (2020) Covid-19 in children: the link in thetransmission chain. Lancet Infect Dis
27. Kumar J, Hembram K (2020) Epidemiological study of novelcoronavirus (covid-19). arXiv:200311376
28. Lu H, Stratton CW, Tang YW (2020) Outbreak of pneumonia ofunknown etiology in Wuhan, China: the mystery and the miracle.J Med Virol 92(4):401–402
29. Makridakis S, Wakefield A, Kirkham R, et al. (2019) Predictingmedical risks and appreciating uncertainty. Foresight: TheInternational Journal of Applied Forecasting 1(52):28–35
30. Meraj T, Hassan A, Zahoor S, Rauf HT, Lali M, Ali L, BukhariSAC (2019) Lungs nodule detection using semantic segmentationand classification with optimal features. Preprints
31. Pedro sanchez anuncia el estado de alarma para frenar elcoronavirus 24 horas antes de aprobarlo. elmundo (in Spanish). 13March 2020. retrieved 20 March 2020. (2020)
32. Perc M, Gorisek Miksic N, Slavinec M, Stozer A (2020)Forecasting covid-19. Frontiers in Physics 8:127
33. Petropoulos F, Makridakis S (2020) Forecasting the novelcoronavirus covid-19. PloS one 15(3):e0231236
34. Rahman MA (2020) Data-driven dynamic clustering frameworkfor mitigating the adverse economic impact of covid-19 lockdownpractices. Sustainable Cities and Society: 102372
35. Rauf HT, Lali MIU, Zahoor S, Shah SZH, Rehman AU, BukhariSAC (2019) Visual features based automated identification offish species using deep convolutional neural networks. ComputElectron Agric 167:105075
36. Rauf HT, Malik S, Shoaib U, Irfan MN, Lali MI (2020) Adaptiveinertia weight bat algorithm with sugeno-function fuzzy search.Appl Soft Comput 90:106159
37. Raza S, Rasheed MA, Rashid MK (2020) Transmission potentialand severity of covid-19 in pakistan. Preprints
38. Remuzzi A, Remuzzi G (2020) Covid-19 and Italy: what next?The Lancet
39. Rnn (2020) https://deepai.org/machine-learning-glossary-and-terms/recurrent-neural-network. Accessed 21 June 2020
40. Roda WC, Varughese MB, Han D, Li MY (2020) Why is itdifficult to accurately predict the covid-19 epidemic? InfectiousDisease Modelling
41. Sherstinsky A (2020) Fundamentals of recurrent neural network(rnn) and long short-term memory (lstm) network. Physica D:Nonlinear Phenomena 404:132306
42. Shinde GR, Kalamkar AB, Mahalle PN, Dey N, Chaki J,Hassanien AE (2020) Forecasting models for coronavirus disease(covid-19): a survey of the state-of-the-art. SN Computer Science1(4):1–15
43. Sky news (2020) https://news.sky.com/story/coronavirus-how-the-us-is-becoming-the-new-epicentre-of-the-covid-19-pandemic-11964550, Accessed 21 June 2020
44. Smyl S (2020) A hybrid method of exponential smoothing andrecurrent neural networks for time series forecasting. Int J Forecast36(1):75–85
45. UK (2020) Government imposes 3-week national lockdown,enforced by police, to contain coronavirus. NBC news. Retrieved23 March 2020
46. Waheed A, Goyal M, Gupta D, Khanna A, Al-Turjman F, PinheiroPR (2020) Covidgan: data augmentation using auxiliary classifiergan for improved covid-19 detection. IEEE Access 8:91916–91923
47. Weiss G, Goldberg Y, Yahav E (2018) On the practical compu-tational power of finite precision rnns for language recognition.arXiv:180504908
48. Wieczorek M, Siłka J, Wozniak M (2020) Neural networkpowered COVID-19 spread forecasting model, vol 140
49. Wintour P (2020) Turkey and Pakistan close borders with Iran overcoronavirus deaths. The Guardian
50. Who director- general’s opening remarks at the media briefing oncovid-19-11 March 2020. World health organization. 11 March2020. retrieved 11 March 2020. https://covid19.who.int/?gclid=EAIaIQobChMIx-mkpZ2T6gIVRJ3VCh3ZVQeYEAAYASABEgLVg D BwE. Accessed 21 June 2020
51. Worldometers (2020) https://www.worldometers.info/coronavirus/worldwide-graphs/. Accessed 21 June 2020
52. Zhang X, Ma R, Wang L (2020) Predicting turning point, durationand attack rate of covid-19 outbreaks in major western countries.Chaos, Solitons Fractals: 109829
53. Zhao R, Yan R, Chen Z, Mao K, Wang P, Gao RX (2019) Deeplearning and its applications to machine health monitoring. MechSyst Signal Process 115:213–237
Publisher’s note Springer Nature remains neutral with regard tojurisdictional claims in published maps and institutional affiliations.


