
Time-Resolved Autoantibody Profiling Facilitates ... · Time-Resolved Autoantibody Profiling...
12
Time-Resolved Autoantibody Profiling Facilitates Stratification of Preclinical Type 1 Diabetes in Children David Endesfelder, 1 Wolfgang zu Castell, 1,2 Ezio Bonifacio, 3,4 Marian Rewers, 5 William A. Hagopian, 6 Jin‐Xiong She, 7 Åke Lernmark, 8 Jorma Toppari, 9,10 Kendra Vehik, 11 Alistair J.K. Williams, 12 Liping Yu, 5 Beena Akolkar, 13 Jeffrey P. Krischer, 11 Anette-G. Ziegler, 4,14,15,16 and Peter Achenbach, 4,14,15,16 for the TEDDY Study Group* Diabetes 2019;68:119–130 | https://doi.org/10.2337/db18-0594 Progression to clinical type 1 diabetes varies among chil- dren who develop b-cell autoantibodies. Differences in auto- antibody patterns could relate to disease progression and etiology. Here we modeled complex longitudinal auto- antibody profiles by using a novel wavelet-based algo- rithm. We identified clusters of similar profiles associated with various types of progression among 600 children from The Environmental Determinants of Diabetes in the Young (TEDDY) birth cohort study; these children developed per- sistent insulin autoantibodies (IAA), GAD autoantibodies (GADA), insulinoma-associated antigen 2 autoantibodies (IA-2A), or a combination of these, and they were followed up prospectively at 3- to 6-month intervals (median fol- low-up 6.5 years). Children who developed multiple auto- antibody types (n = 370) were clustered, and progression from seroconversion to clinical diabetes within 5 years ranged between clusters from 6% (95% CI 0, 17.4) to 84% (59.2, 93.6). Children who seroconverted early in life (median age <2 years) and developed IAA and IA-2A that were stable-positive on follow-up had the highest risk of diabetes, and this risk was unaffected by GADA status. Clusters of children who lacked stable-positive GADA responses contained more boys and lower frequen- cies of the HLA-DR3 allele. Our novel algorithm allows refined grouping of b-cell autoantibody–positive children who distinctly progressed to clinical type 1 diabetes, and it provides new opportunities in searching for etiological factors and elucidating complex disease mechanisms. Clinical type 1 diabetes is commonly preceded by the development of autoantibodies against pancreatic b-cell antigens, such as insulin autoantibodies (IAA), GAD auto- antibodies (GADA), insulinoma-associated antigen-2 auto- antibodies (IA-2A), and zinc transporter 8 autoantibodies (ZnT8A) (1). In particular, children who develop two or more of these autoantibody types almost inevitably prog- ress to clinically symptomatic diabetes (2). These findings have led to a new staging of type 1 diabetes that classifies 1 Scientific Computing Research Unit, Helmholtz Zentrum München, Munich, Germany 2 Department of Mathematics, Technische Universität München, Munich, Germany 3 Center for Regenerative Therapies, Dresden, and Paul Langerhans Institute Dresden, Technische Universität Dresden, Dresden, Germany 4 German Center for Diabetes Research (DZD), Neuherberg, Germany 5 Barbara Davis Center for Childhood Diabetes, University of Colorado, Aurora, CO 6 Pacific Northwest Research Institute, Seattle, WA 7 Center for Biotechnology and Genomic Medicine, Medical College of Georgia, Augusta University, Augusta, GA 8 Department of Clinical Sciences, Lund University Clinical Research Center, Skåne University Hospital, Malmo, Sweden 9 Department of Pediatrics, Turku University Hospital, Turku, Finland 10 Institute of Biomedicine, Research Centre for Integrative Physiology and Phar- macology, University of Turku, Turku, Finland 11 Health Informatics Institute, Morsani College of Medicine, University of South Florida, Tampa, FL 12 Diabetes and Metabolism, Translational Health Sciences, Southmead Hospital, University of Bristol, Bristol, U.K. 13 National Institute of Diabetes and Digestive and Kidney Diseases, Bethesda, MD 14 Institute of Diabetes Research, Helmholtz Zentrum München, German Research Center for Environmental Health, Munich-Neuherberg, Germany 15 Forschergruppe Diabetes, Technische Universität München at Klinikum rechts der Isar, Munich, Germany 16 Forschergruppe Diabetes e.V. at Helmholtz Zentrum München, German Re- search Center for Environmental Health, Munich-Neuherberg, Germany Corresponding author: Peter Achenbach, peter.achenbach@helmholtz-muenchen .de, or Wolfgang zu Castell, [email protected] Received 3 June 2018 and accepted 3 October 2018 This article contains Supplementary Data online at http://diabetes .diabetesjournals.org/lookup/suppl/doi:10.2337/db18-0594/-/DC1. *A complete list of the members of the TEDDY Study Group can be found in the Supplementary Data online. © 2018 by the American Diabetes Association. Readers may use this article as long as the work is properly cited, the use is educational and not for profit, and the work is not altered. More information is available at http://www.diabetesjournals .org/content/license. Diabetes Volume 68, January 2019 119 IMMUNOLOGY AND TRANSPLANTATION
Transcript of Time-Resolved Autoantibody Profiling Facilitates ... · Time-Resolved Autoantibody Profiling...

Time-Resolved Autoantibody Profiling FacilitatesStratification of Preclinical Type 1 Diabetes in ChildrenDavid Endesfelder,1 Wolfgang zu Castell,1,2 Ezio Bonifacio,3,4 Marian Rewers,5 William A. Hagopian,6
Jin‐Xiong She,7 Åke Lernmark,8 Jorma Toppari,9,10 Kendra Vehik,11 Alistair J.K. Williams,12 Liping Yu,5
Beena Akolkar,13 Jeffrey P. Krischer,11 Anette-G. Ziegler,4,14,15,16 and Peter Achenbach,4,14,15,16
for the TEDDY Study Group*
Diabetes 2019;68:119–130 | https://doi.org/10.2337/db18-0594
Progression to clinical type 1 diabetes varies among chil-drenwhodevelopb-cell autoantibodies.Differences inauto-antibody patterns could relate to disease progression andetiology. Here we modeled complex longitudinal auto-antibody profiles by using a novel wavelet-based algo-rithm. We identified clusters of similar profiles associatedwith various types of progression among 600 children fromThe Environmental Determinants of Diabetes in the Young(TEDDY) birth cohort study; these children developed per-sistent insulin autoantibodies (IAA), GAD autoantibodies(GADA), insulinoma-associated antigen 2 autoantibodies(IA-2A), or a combination of these, and they were followedup prospectively at 3- to 6-month intervals (median fol-low-up 6.5 years). Children who developed multiple auto-antibody types (n = 370) were clustered, and progressionfrom seroconversion to clinical diabetes within 5 yearsranged between clusters from 6% (95%CI 0, 17.4) to 84%(59.2, 93.6). Children who seroconverted early in life(median age <2 years) and developed IAA and IA-2Athat were stable-positive on follow-up had the highest
risk of diabetes, and this risk was unaffected by GADAstatus. Clusters of children who lacked stable-positiveGADA responses contained more boys and lower frequen-cies of the HLA-DR3 allele. Our novel algorithm allowsrefined grouping of b-cell autoantibody–positive childrenwho distinctly progressed to clinical type 1 diabetes, andit provides new opportunities in searching for etiologicalfactors and elucidating complex disease mechanisms.
Clinical type 1 diabetes is commonly preceded by thedevelopment of autoantibodies against pancreatic b-cellantigens, such as insulin autoantibodies (IAA), GAD auto-antibodies (GADA), insulinoma-associated antigen-2 auto-antibodies (IA-2A), and zinc transporter 8 autoantibodies(ZnT8A) (1). In particular, children who develop two ormore of these autoantibody types almost inevitably prog-ress to clinically symptomatic diabetes (2). These findingshave led to a new staging of type 1 diabetes that classifies
1Scientific Computing Research Unit, Helmholtz Zentrum München, Munich,Germany2Department of Mathematics, Technische Universität München, Munich, Germany3Center for Regenerative Therapies, Dresden, and Paul Langerhans InstituteDresden, Technische Universität Dresden, Dresden, Germany4German Center for Diabetes Research (DZD), Neuherberg, Germany5Barbara Davis Center for Childhood Diabetes, University of Colorado, Aurora, CO6Pacific Northwest Research Institute, Seattle, WA7Center for Biotechnology and Genomic Medicine, Medical College of Georgia,Augusta University, Augusta, GA8Department of Clinical Sciences, Lund University Clinical Research Center, SkåneUniversity Hospital, Malmo, Sweden9Department of Pediatrics, Turku University Hospital, Turku, Finland10Institute of Biomedicine, Research Centre for Integrative Physiology and Phar-macology, University of Turku, Turku, Finland11Health Informatics Institute, Morsani College of Medicine, University of SouthFlorida, Tampa, FL12Diabetes and Metabolism, Translational Health Sciences, Southmead Hospital,University of Bristol, Bristol, U.K.13National Institute of Diabetes and Digestive and Kidney Diseases, Bethesda, MD
14Institute of Diabetes Research, Helmholtz Zentrum München, German ResearchCenter for Environmental Health, Munich-Neuherberg, Germany15Forschergruppe Diabetes, Technische Universität München at Klinikum rechtsder Isar, Munich, Germany16Forschergruppe Diabetes e.V. at Helmholtz Zentrum München, German Re-search Center for Environmental Health, Munich-Neuherberg, Germany
Corresponding author: Peter Achenbach, [email protected], or Wolfgang zu Castell, [email protected]
Received 3 June 2018 and accepted 3 October 2018
This article contains Supplementary Data online at http://diabetes.diabetesjournals.org/lookup/suppl/doi:10.2337/db18-0594/-/DC1.
*A complete list of the members of the TEDDY Study Group can be found in theSupplementary Data online.
© 2018 by the American Diabetes Association. Readers may use this article aslong as the work is properly cited, the use is educational and not for profit, and thework is not altered. More information is available at http://www.diabetesjournals.org/content/license.
Diabetes Volume 68, January 2019 119
IMMUNOLOGY
AND
TRANSPLANTATIO
N
the presence of advanced b-cell autoimmunity (multipleautoantibody types) but no symptoms of diabetes as anearly stage of disease, that is, presymptomatic type 1 di-abetes (3,4). However, the duration of progression frompresymptomatic to clinical type 1 diabetes varies amongchildren who are positive for multiple autoantibodytypes (2). Autoantibody characteristics stratify diabetesrisk; these characteristics include age at seroconversion(2,5–7), antibody number (8–10), titer (6,7,9–12), affinity(13,14), antigen specificity (9,15–17), and epitope binding(9,14,18,19). Nevertheless, the relation between variouslongitudinal autoantibody profiles and the rate of pro-gression to diabetes are rarely studied. The EnvironmentalDeterminants of Diabetes in the Young (TEDDY) studyrecently reported that among children positive for multi-ple autoantibody types, those who reverted from GADA-positive to GADA-negative status at follow-up had greaterrisk of diabetes than those with persistent autoantibodies(20). Likewise, clustering children on the basis of similar-ities between sequential autoantibody patterns in theGerman BABYDIAB cohort revealed delayed progressionto type 1 diabetes in children positive for multiple auto-antibody types and who became IAA-negative at follow-up(21). To our knowledge, however, no study to date hasanalyzed longitudinal profiles of multiple autoantibodieswith due consideration of the timing of changes in thequalitative status of the various autoantibodies.
TEDDY study provides unique opportunities for ana-lyzing longitudinal autoantibody profiles on the basis ofa whole time series of autoantibody sequences that areavailable because type 1 diabetes–associated autoantibod-ies were frequently sampled and measured, starting inearly infancy (22). This could refine stratification of pro-gression to clinical diabetes on the basis of similarities inthe timing of changes in autoantibody responses. How-ever, the high complexity and multivariate nature ofthe longitudinal autoantibody data remain challengingobstacles to analysis. To address this issue, we developeda mathematical algorithm based on Haar wavelet decom-position that enables children to be clustered according tosimilarities in their longitudinal autoantibody profiles. Incontrast to most published approaches (2,5–10,12,20), ourproposed method does not require a priori definition ofrelevant autoantibody patterns or seroconversion ages, butintrinsically groups children by taking longitudinal char-acteristics into account.
RESEARCH DESIGN AND METHODS
Study Population and SamplesTEDDY study is a prospective cohort study with theprimary goal of identifying environmental causes oftype 1 diabetes. It includes six clinical research centers:three in the U.S. (Colorado, Georgia/Florida, Washington)and three in Europe (Finland, Germany, Sweden). Detailsof the study design and methods have been publishedpreviously (22). TEDDY study enrolled 8,676 children who
are genetically at risk for developing type 1 diabetes onthe basis of their HLA genotype (23). Enrolled childrenaremonitored prospectively from age 3months to age 4 years,with study visits every 3 months until age 4 and thereafterevery 3 or 6 months, depending on autoantibody posi-tivity, until age 15 years. Children who are persistentlypositive for any autoantibody are monitored every 3months until the age of 15 years or the onset of type1 diabetes. If remission of all autoantibodies occurs forfour consecutive visits or a period of 1 year, an interval of6 months becomes effective. Autoantibody-negative chil-dren are monitored every 6 months. The study was ap-proved by local institutional review or ethics boards andmonitored by an external evaluation committee formed bythe National Institutes of Health. All participants providedwritten informed consent before participating in the ge-netic screening and in the prospective follow-up.
As of 31 December 2014, 618 children had developedconfirmed persistent b-cell autoantibodies (IAA, GADA,IA-2A, or multiple types; 242 children were positive fora single autoantibody type and 376 for multiple autoan-tibody types) during a median follow-up of 6.5 years(interquartile range 5.2–8.0 years); 172 of those had de-veloped diabetes. To avoid bias due to short follow-upprofiles, all children with fewer than five longitudinalsamples were excluded from the analysis (n = 18). Thusthis analysis included 600 children (230 positive for a sin-gle autoantibody type and 370 for multiple autoantibodytypes), 165 of whom developed diabetes. We analyzed thequalitative status of IAA, GADA, and IA-2A over time using37,047 measurements from these children from birth.
b-Cell AutoantibodiesIAA, GADA, and IA-2A were measured in two laboratoriesby using radiobinding assays, as previously described (22).In the U.S., all sera were assayed at the Barbara DavisCenter for Childhood Diabetes at the University ofColorado, Denver; in Europe, all sera were assayed at theUniversity of Bristol, Bristol, U.K. Both laboratoriesreported high sensitivity, specificity, and concordance(24). All samples positive for b-cell autoantibodies and5% of negative samples were retested at the other refer-ence laboratory, and if the results were concordant, theresults were deemed confirmed. Persistent b-cell autoim-munity was defined as the presence of an autoantibody attwo or more consecutive visits 3 months apart and con-firmed by two TEDDY laboratories. Age at seroconversionwas defined as the age of the child on the initial dateof seroconversion to persistent b-cell autoimmunity, aspreviously described (25). A child was considered to bepositive for multiple autoantibody types if at least twoautoantibodies—IAA, GADA, IA-2A, or a combination—were positive in two consecutive samples, or if at leasttwo of these autoantibody types were positive in thelast available sample before the development of type 1 di-abetes. An autoantibody response was defined as tran-siently positive if at least two consecutive samples were
120 Modeling of Longitudinal Autoantibody Profiles Diabetes Volume 68, January 2019

autoantibody-positive followed by at least two consecutiveautoantibody-negative samples or an autoantibody-negativelast available sample. An autoantibody response was definedas stable-positive if it was not transiently positive. Anautoantibody profile was defined as the qualitative statusof IAA, GADA, IA-2A (i.e., positive or negative as defined bya cutoff) at a single time point, building a three-dimensionalbinary vector. A longitudinal autoantibody profile wasdefined as the temporal sequence of all of a child’s singleautoantibody profiles. Type 1 diabetes was definedaccording to American Diabetes Association criteriafor diagnosis (3).
Statistical AnalysisBased on binary longitudinal autoantibody profiles of IAA,GADA, and IA-2A (i.e., temporal sequences of the positiveor negative autoantibody status of all children), we de-veloped a mathematical algorithm using Haar wavelets(26) to quantify the similarity between longitudinal auto-antibody profiles. Hierarchical clustering was subsequentlyperformed to group children on the basis of similarities.Imputation of data was required whenever samples weremissing from a sequence of autoantibody measurements.A missing sample was assigned as autoantibody-positive ifthe samples immediately preceding and immediately afterthe missing sample were positive for the particular auto-antibody. In all other cases, missing samples were assignedas autoantibody-negative.
Follow-up time, and accordingly, the number of avail-able samples and autoantibody measurements, varied consid-erably among children. We observed a bimodal distribution offollow-up time (Supplementary Fig. 1): 82 children (69 positivefor multiple and 13 for single autoantibody types) werefollowed up for up to 42months, and 518 children (301 pos-itive for multiple and 217 for single autoantibody types)were followed up for more than 42 and up to 122 months.Because only shared follow-up periods could be used forpairwise comparisons of children, short periods shared bychildren with considerably different durations of follow-updid not contain sufficient information to achieve reasonableclustering results on the basis of wavelet coefficients alone,as children with qualitatively different longitudinal auto-antibody profiles could be clustered together. Therefore, wefirst grouped children with long (more than 42 months) orshort (up to 42 months) follow-up periods separately andlater integrated the children with short follow-up into theclusters of children with long follow-up by using a combi-nation of similar autoantibody patterns and similar timingof autoantibody development.
First, we applied a Haar wavelet decomposition to auto-antibody sequences of children with more than 42 monthsof follow-up; this was done separately for IAA, GADA, andIA-2A. The resulting wavelet coefficients of the three auto-antibodies were then combined into a single vector, whichwas used to estimate Euclidean distances of wavelet coef-ficients between pairs of children. Hierarchical clusteringwith complete linkage was performed on the resulting
distances; this was done separately for multiple autoanti-body–positive and single autoantibody–positive children.Second, children with shorter follow-up (up to 42 months)were assigned to clusters of children with longer follow-upby using a combination of distances that were based onwavelet coefficients and a recently described algorithm formeasuring similarity between sequential autoantibody pat-terns (21). Both distance measures were calculated betweena child with shorter follow-up and all children with longerfollow-up. Next, a child with shorter follow-up was assigned toa cluster of children with longer follow-up by calculatinga Student t statistic comparing distances of children in eachrespective cluster to distances of the remaining children. TheStudent t statistic of both distance measures was summed up,and each child with short follow-up was assigned to the clusterwith long follow-up with the maximum of this sum. Thecombination of distances from wavelet coefficients and fromsequential autoantibody patterns ensured that children withshort follow-up times were assigned to clusters of childrenwith both similar timing of autoantibody appearance andsimilar longitudinal autoantibody profiles.
We used Kaplan-Meier survival analysis with the log-rank test to compare between clusters the progression fromautoantibody seroconversion to type 1 diabetes. We used asthe event time the time from the age at seroconversion tothe age at diagnosis of diabetes or the age at last contact (forchildren without diabetes). Analysis considered censoringthose children who were lost to follow-up. The 5-yeardiabetes-free survival is presented for clusters comprising10 ormore children.We used the Fisher exact test to comparefrequencies between groups. All statistical analyses wereperformed using R version 3.2.2.
RESULTS
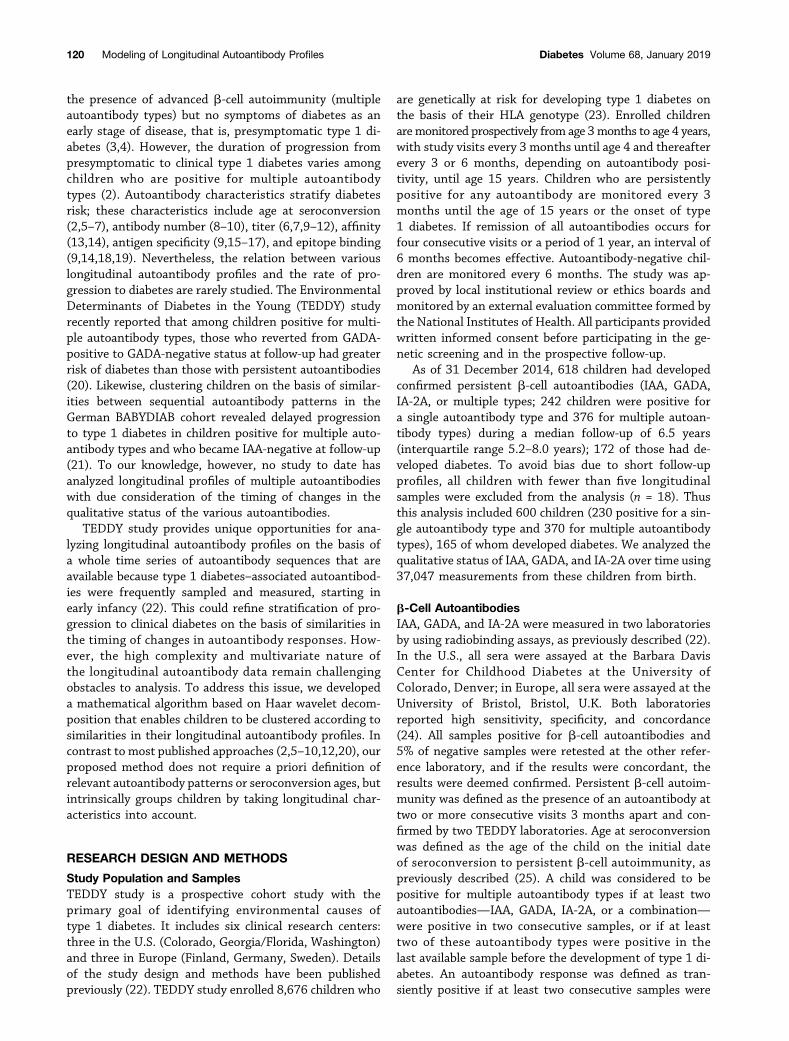
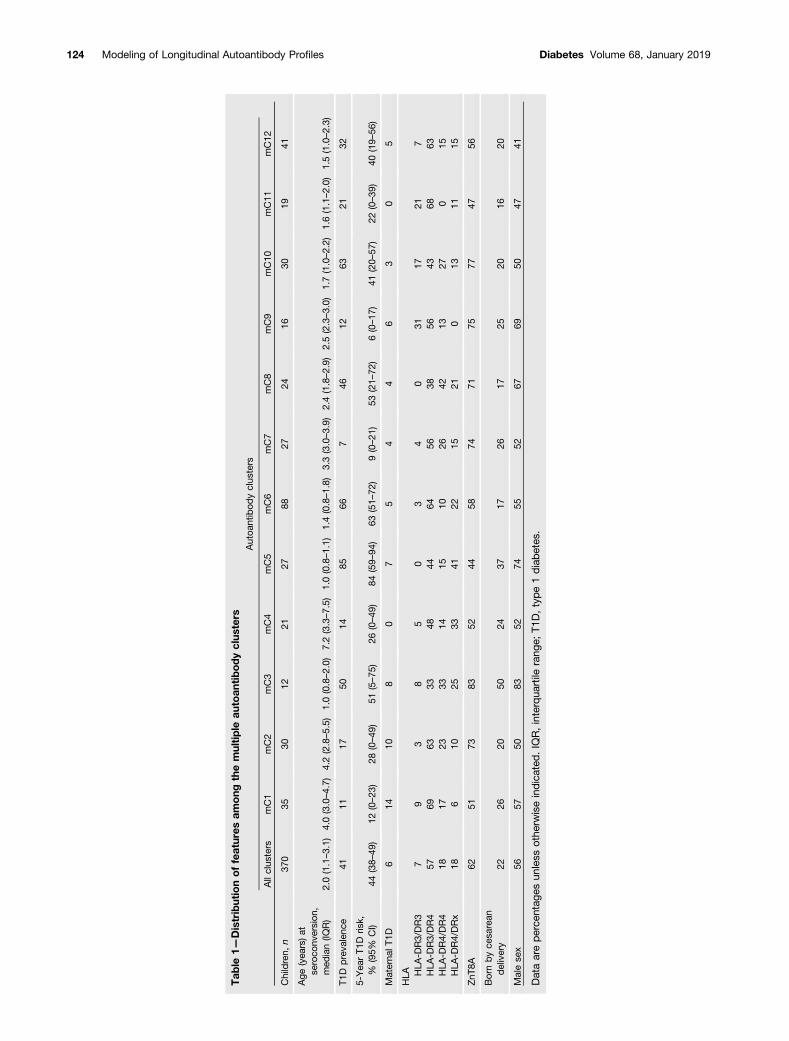
Clustering of Multiple Autoantibody–Positive ChildrenWe hypothesized that clustering multiple autoantibody–positive children on the basis of their consecutive profilesof IAA, GADA, and IA-2A could provide refined stratifica-tion with respect to progression to clinical type 1 diabetesand disease etiopathogenesis. Children who developedmultiple b-cell autoantibody types (n = 370) were clusteredon the basis of wavelet coefficients. We used the resultingdendrogram (Fig. 1) to define 12 multiple autoantibodyclusters (mC1–mC12), each comprising 12–88 childrenwho differed with respect to their age at autoantibodyappearance and their autoantibody profile at follow-up(Fig. 2). Characteristics of the children in these clusters aresummarized in Table 1. The clusters differed considerablywith respect to the percentage of children who progressedfrom seroconversion to clinical diabetes within 5 years,ranging from 6% (95% CI 0, 17.4; cluster mC9) to 84%(59.2, 93.6; mC5) (Table 1). In particular, those clusterswith the shortest distances from each other in the dendro-gram (e.g., mC7 and mC8) (Fig. 2) had markedly differentrisks of diabetes, indicating that the approach could dis-tinguish children with different progression on the basisof relatively small differences in their longitudinal
diabetes.diabetesjournals.org Endesfelder and Associates 121
autoantibody profiles. Next we explored whether theclusters could stratify progression in children with com-mon characteristics such as similar age at seroconversionand similar autoantibody patterns.
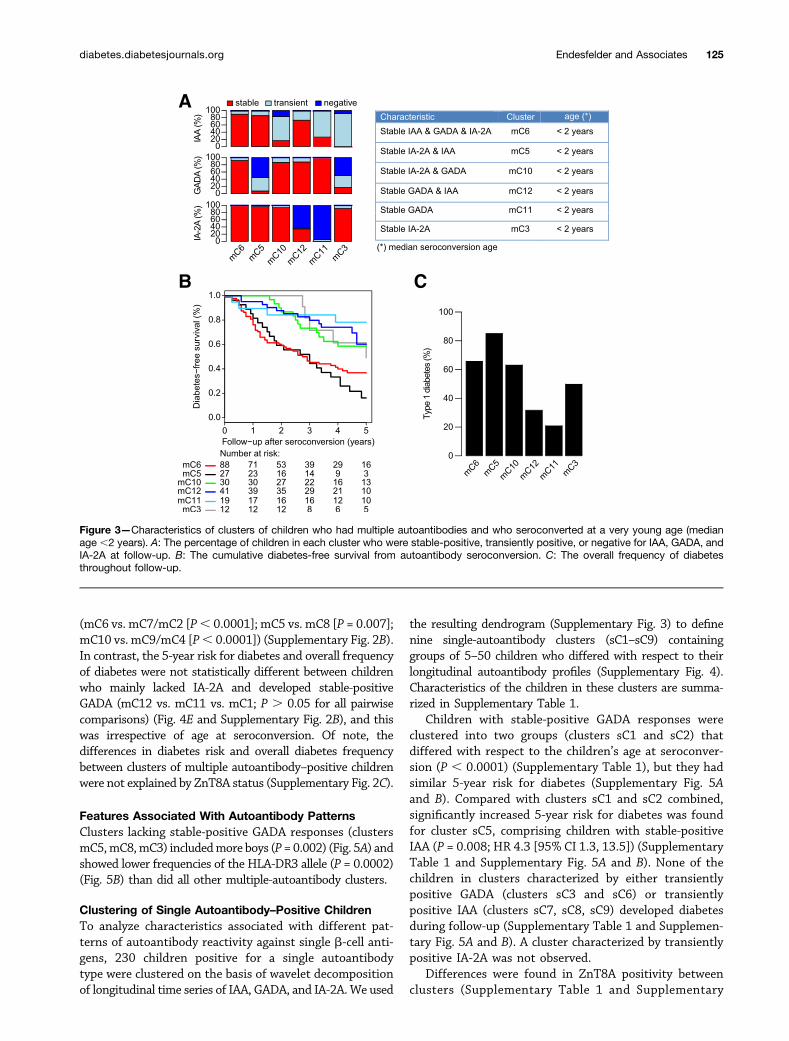
Children Who Seroconverted at a Very Young AgeFirst, we compared clusters of children with a similaryoung age at seroconversion but variable longitudinal au-toantibody profiles with respect to differences in theirprogression to clinical type 1 diabetes. We therefore selectedall clusters with children who were a median age,2 years at
seroconversion. This resulted in six clusters (Fig. 3A) char-acterized by the development of either three stable-positiveautoantibodies (cluster mC6), two stable-positive autoanti-bodies and a transiently positive or negative third autoan-tibody (clusters mC5, mC10, mC12), or stable-positiveGADA (cluster mC11) or stable-positive IA-2A (clustermC3) and a transiently positive or negative second, oreven third, autoantibody. Regardless of GADA status, chil-dren with the combination of stable-positive IAA and IA-2A(mC6 and mC5) had similar 5-year risks for diabetes: theirrisk was significantly higher than the risks in all remaining
Figure 1—Hierarchical clustering results for longitudinal autoantibody profiles of 370 children who developedmultiple b-cell autoantibodies.The dendrogram is divided into 12 multiple autoantibody clusters (mC1–mC12). Each column within a cluster represents the follow-up timefrom birth (age) for one child. The qualitative status of IAA, GADA, and IA-2A is indicated by color (red = antibody-positive; blue = antibody-negative) with respect to the child’s age when antibodies were measured.
122 Modeling of Longitudinal Autoantibody Profiles Diabetes Volume 68, January 2019
clusters of children with a very young age at seroconversion(P, 0.0001; hazard ratio [HR] 2.8 [95% CI 1.9, 4.2]) (Fig.3B and Table 1). In contrast, the 5-year risks for diabeteswere not significantly different between clusters of childrenwith the combination of stable-positive GADA and IA-2A(mC10) or stable-positive IAA and GADA (mC12) and thosewith only stable-positive GADA (mC11) or IA-2A (mC3)(Fig. 3B and Table 1). However, the overall frequency ofdiabetes throughout follow-up was higher in clusters ofchildren with stable-positive IA-2A (mC10 [63%] and mC3[50%]) than in those without stable-positive IA-2A (mC12[32%] and mC11 [21%]; P = 0.002) (Fig. 3C).
Children With Similar Autoantibody PatternsSecond, we compared clusters of children with similarautoantibody patterns but variable age at seroconversionwith respect to differences in their progression to clinicaltype 1 diabetes. We therefore grouped clusters on the basisof autoantibody patterns over time and then comparedclusters within the groups according to the median age atseroconversion:,2, 2–4, or.4 years. This resulted in fourgroups of three clusters each (Fig. 4A and SupplementaryFig. 2A). Clusters were characterized by the developmentof either stable-positive IAA, GADA, and IA-2A (clusters
mC6, mC7, and mC2); stable-positive IA-2A and IAA(clusters mC5 and mC8) or only stable-positive IA-2A(clusters mC3); stable-positive IA-2A and GADA (clustersmC10, mC9, mC4); or stable-positive GADA and IAA(cluster mC12) or only stable-positive GADA (clustersmC11 and mC1). Within each cluster group, youngerage at seroconversion was generally associated with in-creased 5-year risk for diabetes (Fig. 4B–E), with theexception of children in cluster mC3, who seroconvertedat a median age,2 years, developed stable-positive IA-2A,but lost IAA reactivity during follow-up (Figs. 2 and 4A)and presented with relatively delayed progression to clin-ical diabetes (Fig. 4C). The most significant effects ofyounger age at seroconversion on diabetes risk wereobserved among children who developed three stable-positive autoantibody types (mC6 vs. mC7/mC2; P ,0.0001; HR 5.4 [95% CI 2.5, 11.9]) (Fig. 4B), those de-veloping stable-positive IA-2A and IAA (mC5 vs. mC8; P =0.02; HR 2.3 [1.1, 4.9]) (Fig. 4C), and those developingstable-positive IA-2A and GADA (mC10 vs. mC9/mC4; P =0.045; HR 3.9 [1.0, 9.3]) (Fig. 4D). Clusters of children withseroconversion at a median age ,2 years also showeda higher overall frequency of diabetes than did those withsimilar autoantibody patterns but older age at seroconversion
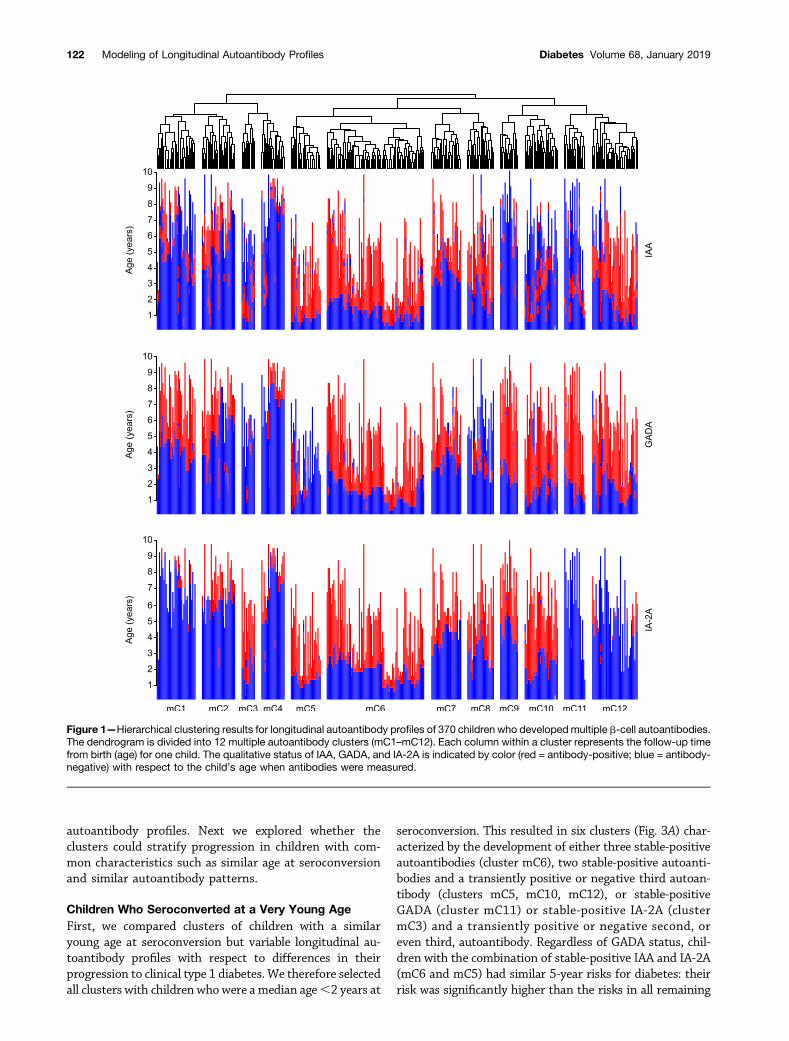
Figure 2—Aggregated longitudinal profiles of IAA, GADA, and IA-2A for children in themultiple-autoantibody clusters (mC1–mC12). For eachcluster, the percentages of children who had the respective autoantibodies are indicated by color (white: 0% positive; red: 100% positive)with respect to age. The blue line indicates the age until which.50% of children in the cluster were followed up, and the green lines indicatethe age until which .25% of children in the cluster were followed up. Autoantibody profiles are plotted until only two children in the clusterremained in follow-up.
diabetes.diabetesjournals.org Endesfelder and Associates 123
Tab
le1—
Distributionoffeatures
among
themultiple
autoan
tibodyclus
ters
Autoa
ntibod
yclus
ters
Allclus
ters
mC1
mC2
mC3
mC4
mC5
mC6
mC7
mC8
mC9
mC10
mC11
mC12
Children,
n37
035
3012
2127
8827
2416
3019
41
Age
(yea
rs)at
seroco
nversion
,med
ian(IQ
R)
2.0(1.1–3.1)
4.0(3.0–4.7)
4.2(2.8–5.5)
1.0(0.8–2.0)
7.2(3.3–7.5)
1.0(0.8–1.1)
1.4(0.8–1.8)
3.3(3.0–3.9)
2.4(1.8–2.9)
2.5(2.3–3.0)
1.7(1.0–2.2)
1.6(1.1–2.0)
1.5(1.0–2.3)
T1D
preva
lenc
e41
1117
5014
8566
746
1263
2132
5-Yea
rT1
Dris
k,%
(95%
CI)
44(38–
49)
12(0–23
)28
(0–49
)51
(5–75
)26
(0–49
)84
(59–
94)
63(51–
72)
9(0–21
)53
(21–
72)
6(0–17
)41
(20–
57)
22(0–39
)40
(19–
56)
Materna
lT1D
614
108
07
54
46
30
5
HLA HLA
-DR3/DR3
79
38
50
34
031
1721
7HLA
-DR3/DR4
5769
6333
4844
6456
3856
4368
63HLA
-DR4/DR4
1817
2333
1415
1026
4213
270
15HLA
-DR4/DRx
186
1025
3341
2215
210
1311
15
ZnT
8A62
5173
8352
4458
7471
7577
4756
Bornbyce
sarean
delivery
2226
2050
2437
1726
1725
2016
20
Malese
x56
5750
8352
7455
5267
6950
4741
Dataareperce
ntag
esun
less
othe
rwiseindica
ted.IQR,interqua
rtile
rang
e;T1
D,type1diabetes
.
124 Modeling of Longitudinal Autoantibody Profiles Diabetes Volume 68, January 2019
(mC6 vs. mC7/mC2 [P, 0.0001]; mC5 vs. mC8 [P = 0.007];mC10 vs. mC9/mC4 [P, 0.0001]) (Supplementary Fig. 2B).In contrast, the 5-year risk for diabetes and overall frequencyof diabetes were not statistically different between childrenwho mainly lacked IA-2A and developed stable-positiveGADA (mC12 vs. mC11 vs. mC1; P . 0.05 for all pairwisecomparisons) (Fig. 4E and Supplementary Fig. 2B), and thiswas irrespective of age at seroconversion. Of note, thedifferences in diabetes risk and overall diabetes frequencybetween clusters of multiple autoantibody–positive childrenwere not explained by ZnT8A status (Supplementary Fig. 2C).
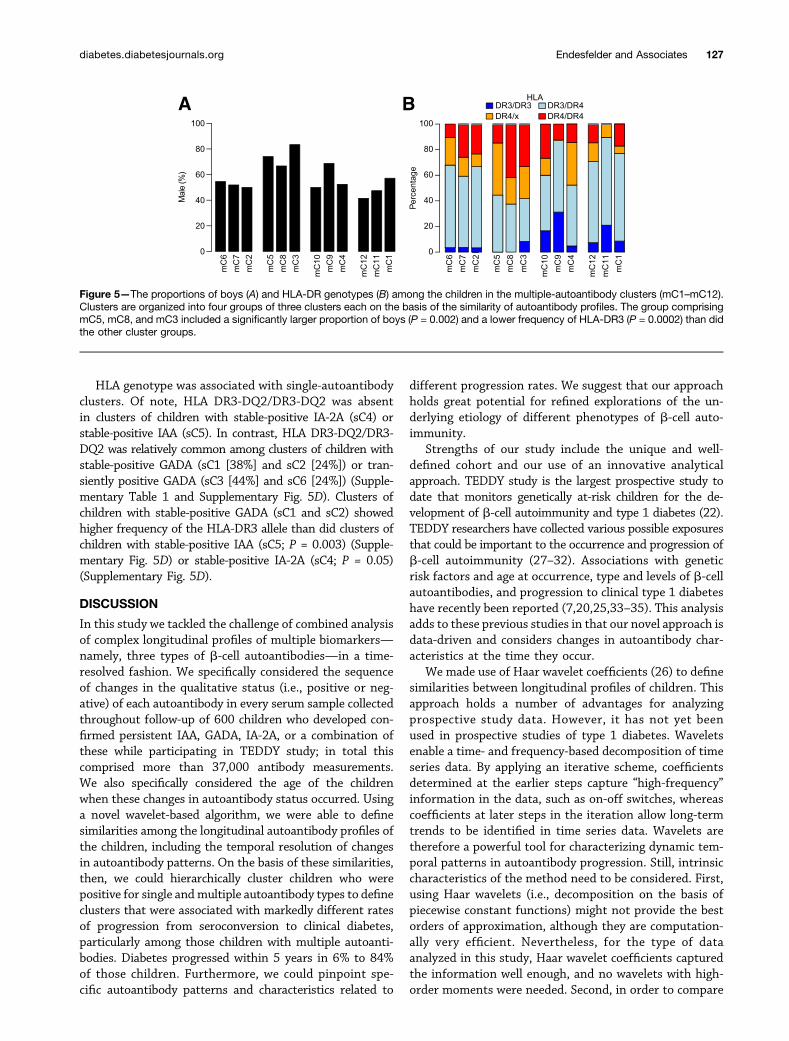
Features Associated With Autoantibody PatternsClusters lacking stable-positive GADA responses (clustersmC5,mC8,mC3) includedmore boys (P = 0.002) (Fig. 5A) andshowed lower frequencies of the HLA-DR3 allele (P = 0.0002)(Fig. 5B) than did all other multiple-autoantibody clusters.
Clustering of Single Autoantibody–Positive ChildrenTo analyze characteristics associated with different pat-terns of autoantibody reactivity against single b-cell anti-gens, 230 children positive for a single autoantibodytype were clustered on the basis of wavelet decompositionof longitudinal time series of IAA, GADA, and IA-2A.We used
the resulting dendrogram (Supplementary Fig. 3) to definenine single-autoantibody clusters (sC1–sC9) containinggroups of 5–50 children who differed with respect to theirlongitudinal autoantibody profiles (Supplementary Fig. 4).Characteristics of the children in these clusters are summa-rized in Supplementary Table 1.
Children with stable-positive GADA responses wereclustered into two groups (clusters sC1 and sC2) thatdiffered with respect to the children’s age at seroconver-sion (P , 0.0001) (Supplementary Table 1), but they hadsimilar 5-year risk for diabetes (Supplementary Fig. 5Aand B). Compared with clusters sC1 and sC2 combined,significantly increased 5-year risk for diabetes was foundfor cluster sC5, comprising children with stable-positiveIAA (P = 0.008; HR 4.3 [95% CI 1.3, 13.5]) (SupplementaryTable 1 and Supplementary Fig. 5A and B). None of thechildren in clusters characterized by either transientlypositive GADA (clusters sC3 and sC6) or transientlypositive IAA (clusters sC7, sC8, sC9) developed diabetesduring follow-up (Supplementary Table 1 and Supplemen-tary Fig. 5A and B). A cluster characterized by transientlypositive IA-2A was not observed.
Differences were found in ZnT8A positivity betweenclusters (Supplementary Table 1 and Supplementary
Figure 3—Characteristics of clusters of children who had multiple autoantibodies and who seroconverted at a very young age (medianage ,2 years). A: The percentage of children in each cluster who were stable-positive, transiently positive, or negative for IAA, GADA, andIA-2A at follow-up. B: The cumulative diabetes-free survival from autoantibody seroconversion. C: The overall frequency of diabetesthroughout follow-up.
diabetes.diabetesjournals.org Endesfelder and Associates 125
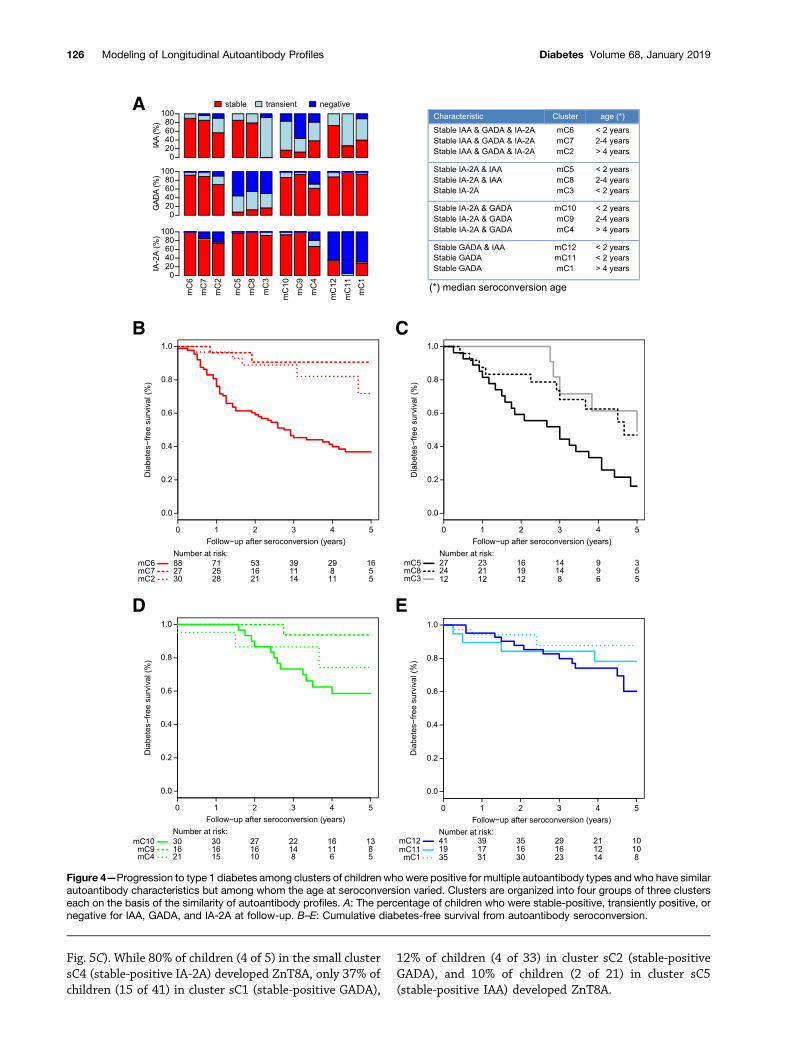
Fig. 5C). While 80% of children (4 of 5) in the small clustersC4 (stable-positive IA-2A) developed ZnT8A, only 37% ofchildren (15 of 41) in cluster sC1 (stable-positive GADA),
12% of children (4 of 33) in cluster sC2 (stable-positiveGADA), and 10% of children (2 of 21) in cluster sC5(stable-positive IAA) developed ZnT8A.
A
B C
D E
Figure 4—Progression to type 1 diabetes among clusters of children who were positive for multiple autoantibody types and who have similarautoantibody characteristics but among whom the age at seroconversion varied. Clusters are organized into four groups of three clusterseach on the basis of the similarity of autoantibody profiles. A: The percentage of children who were stable-positive, transiently positive, ornegative for IAA, GADA, and IA-2A at follow-up. B–E: Cumulative diabetes-free survival from autoantibody seroconversion.
126 Modeling of Longitudinal Autoantibody Profiles Diabetes Volume 68, January 2019
HLA genotype was associated with single-autoantibodyclusters. Of note, HLA DR3-DQ2/DR3-DQ2 was absentin clusters of children with stable-positive IA-2A (sC4) orstable-positive IAA (sC5). In contrast, HLA DR3-DQ2/DR3-DQ2 was relatively common among clusters of children withstable-positive GADA (sC1 [38%] and sC2 [24%]) or tran-siently positive GADA (sC3 [44%] and sC6 [24%]) (Supple-mentary Table 1 and Supplementary Fig. 5D). Clusters ofchildren with stable-positive GADA (sC1 and sC2) showedhigher frequency of the HLA-DR3 allele than did clusters ofchildren with stable-positive IAA (sC5; P = 0.003) (Supple-mentary Fig. 5D) or stable-positive IA-2A (sC4; P = 0.05)(Supplementary Fig. 5D).
DISCUSSION
In this study we tackled the challenge of combined analysisof complex longitudinal profiles of multiple biomarkers—namely, three types of b-cell autoantibodies—in a time-resolved fashion. We specifically considered the sequenceof changes in the qualitative status (i.e., positive or neg-ative) of each autoantibody in every serum sample collectedthroughout follow-up of 600 children who developed con-firmed persistent IAA, GADA, IA-2A, or a combination ofthese while participating in TEDDY study; in total thiscomprised more than 37,000 antibody measurements.We also specifically considered the age of the childrenwhen these changes in autoantibody status occurred. Usinga novel wavelet-based algorithm, we were able to definesimilarities among the longitudinal autoantibody profiles ofthe children, including the temporal resolution of changesin autoantibody patterns. On the basis of these similarities,then, we could hierarchically cluster children who werepositive for single andmultiple autoantibody types to defineclusters that were associated with markedly different ratesof progression from seroconversion to clinical diabetes,particularly among those children with multiple autoanti-bodies. Diabetes progressed within 5 years in 6% to 84%of those children. Furthermore, we could pinpoint spe-cific autoantibody patterns and characteristics related to
different progression rates. We suggest that our approachholds great potential for refined explorations of the un-derlying etiology of different phenotypes of b-cell auto-immunity.
Strengths of our study include the unique and well-defined cohort and our use of an innovative analyticalapproach. TEDDY study is the largest prospective study todate that monitors genetically at-risk children for the de-velopment of b-cell autoimmunity and type 1 diabetes (22).TEDDY researchers have collected various possible exposuresthat could be important to the occurrence and progression ofb-cell autoimmunity (27–32). Associations with geneticrisk factors and age at occurrence, type and levels of b-cellautoantibodies, and progression to clinical type 1 diabeteshave recently been reported (7,20,25,33–35). This analysisadds to these previous studies in that our novel approach isdata-driven and considers changes in autoantibody char-acteristics at the time they occur.
We made use of Haar wavelet coefficients (26) to definesimilarities between longitudinal profiles of children. Thisapproach holds a number of advantages for analyzingprospective study data. However, it has not yet beenused in prospective studies of type 1 diabetes. Waveletsenable a time- and frequency-based decomposition of timeseries data. By applying an iterative scheme, coefficientsdetermined at the earlier steps capture “high-frequency”information in the data, such as on-off switches, whereascoefficients at later steps in the iteration allow long-termtrends to be identified in time series data. Wavelets aretherefore a powerful tool for characterizing dynamic tem-poral patterns in autoantibody progression. Still, intrinsiccharacteristics of the method need to be considered. First,using Haar wavelets (i.e., decomposition on the basis ofpiecewise constant functions) might not provide the bestorders of approximation, although they are computation-ally very efficient. Nevertheless, for the type of dataanalyzed in this study, Haar wavelet coefficients capturedthe information well enough, and no wavelets with high-order moments were needed. Second, in order to compare
A B
Figure 5—The proportions of boys (A) and HLA-DR genotypes (B) among the children in the multiple-autoantibody clusters (mC1–mC12).Clusters are organized into four groups of three clusters each on the basis of the similarity of autoantibody profiles. The group comprisingmC5, mC8, and mC3 included a significantly larger proportion of boys (P = 0.002) and a lower frequency of HLA-DR3 (P = 0.0002) than didthe other cluster groups.
diabetes.diabetesjournals.org Endesfelder and Associates 127
the children’s longitudinal autoantibody profiles, we had tocut down the time series of various lengths down to thelength of the shorter series. Thus, in particular whencomparing a very short time series with a longer one,comparison on the basis of wavelets ignores a substantialpart of the information provided by the longer series. Wecompensated for this deficiency in our analysis by com-bining wavelet decomposition with another qualitativealgorithm provided previously (21). Third, the methodalso requires that time series be sampled at equal intervals.Although this is the case in TEDDY study, other decom-positions would have to be applied for scattered data.
We focused our analysis on the group of children whotested positive for multiple b-cell autoantibodies. Consid-erable differences exist between children at this presymp-tomatic stage of type 1 diabetes with respect to the timeuntil clinical onset of the disease (2,7,36). A well-knownrisk factor for fast progression to clinical diabetes amongautoantibody-positive individuals is young age at serocon-version (5–7,34). It is therefore remarkable that we could1) distinguish different rates of progression among clus-ters of children who were positive for multiple autoanti-body types (n = 217), all of whom seroconverted at veryyoung age; and 2) link differences in progression to definedlongitudinal autoantibody profiles. The highest risks werefound in 115 children who developed both stable-positiveIAA and stable-positive IA-2A responses early in life (clus-ters mC6 and mC5). It is interesting that the presence(mC6) or absence (mC5) of stable-positive GADA responsesdid not influence the high risk in those children. On thecontrary, risk was significantly lower for 102 children whoseroconverted early and developed multiple autoantibodiesbut not stable-positive IAA and stable-positive IA-2A. This isin line with our previous observation in the BABYDIABcohort that losing IAA reactivity is associated with delayedprogression to type 1 diabetes in multiple autoantibody–positive children (21). Among clusters of children withsimilar autoantibody patterns, younger age at seroconver-sion was associated with faster progression to diabetes. Anexception to this rule were children who developed stable-positive GADA but lacked IA-2A responses; they progressedrelatively slowly regardless of age at seroconversion.
Of note, to develop an autoantibody response to GADthat was stable-positive over time, and therefore waspresumably relevant for the individual immune phenotypeand disease pathogenesis, the majority of such childrenseemed to require HLA-DR3. Associations have beenreported between HLA-DR and b-cell autoantibody spec-ificity (13,14,25,37–39). In particular, TEDDY study re-cently demonstrated that the presence of HLA-DR4 orHLA-DR3 strongly influenced the appearance of either IAAor GADA, respectively, as the first autoantibody in children(25,35). Our current data suggest an influence of HLAgenotype on the longitudinal autoantibody profile. Like-wise, male sex has been associated with IAA only as thefirst autoantibody in children (35). We observed herea predominance of boys among those children with
longitudinal autoantibody profiles lacking stable-positiveGADA responses, which requires further attention.
As a limitation of our study, longitudinal ZnT8A profilescould not be included in the current clustering analysesbecause of an incomplete time series of ZnT8A measure-ments, which otherwise would have considerably reducedour sample size. However, we considered the overall ZnT8Astatus of each child in our analysis. As expected, thisrevealed that some children in our single-autoantibodyclusters in fact had developed ZnT8A as a second positiveb-cell autoantibody. The strongest effect was found in thesmall cluster sC4, characterized by stable-positive IA-2A; inthis cluster, four of five children (all male and carrying HLA-DR4) were ZnT8A-positive, and two have progressed toclinical diabetes. This illustrates that certain low-frequencyimmune patterns could be highly relevant to the disease.With respect to longitudinal GADA patterns, our study ofchildren could underestimate the effect of these patterns ondiabetes risk, given that GADA is associated with onset oftype 1 diabetes at an older age (40). Another limitation isthat the study population was highly selected for HLA-conferred risk of type 1 diabetes (23). Validation is thereforenecessary in a study population that is not preselected and incohorts of individuals who seroconverted to b-cell auto-antibodies at an older age in order to ensure the widerapplicability of our observations.
Altogether, our data support the notion that gene-environment interactions influence the individual patternof b-cell autoantibodies (i.e., the pattern of main targetautoantigens), the timing of their appearance, dynamicchanges over time and progression to diabetes. It ispossible that certain disease-promoting factors or condi-tions could act on genetically predisposed individuals onlywithin certain age ranges. Identifying such etiologicalfactors could potentially pave the way for new preventivetherapies, and we believe that our analytical approachcould prove useful in that search.
In conclusion, our novel wavelet-based clustering algo-rithm allows refined grouping of children who are positivefor multiple b-cell autoantibody types. This data-drivenapproach can identify groups of children with distinctprogression to clinical type 1 diabetes and provides newopportunities for elucidating complex disease mechanisms.
Acknowledgments. The authors especially acknowledge all familiesparticipating in the TEDDY Study.Funding. The TEDDY study is funded by the National Institute of Diabetesand Digestive and Kidney Diseases (U01-DK-63829, U01-DK-63861, U01-DK-63821,U01-DK-63865, U01-DK-63863, U01-DK-63836, U01-DK-63790, UC4-DK-63829,UC4-DK63861, UC4-DK-63821, UC4-DK-63865, UC4-DK-63863, UC4-DK-63836,UC4-DK-95300, UC4-DK-100238, UC4-DK-106955, UC4-DK-112243, UC4-DK-117483, and contract no. HHSN267200700014C), National Institute of Allergyand Infectious Diseases, Eunice Kennedy Shriver National Institute of Child Healthand Human Development, National Institute of Environmental Health Sciences, JDRF,Centers for Disease Control and Prevention, and National Institutes of Health ClinicalCenter. This work was supported in part by the National Institutes of Health/NationalCenter for Advancing Translational Sciences Clinical and Translational Science
128 Modeling of Longitudinal Autoantibody Profiles Diabetes Volume 68, January 2019
Awards to the University of Florida (UL1-TR-000064) and the University of Colorado(UL1-TR-001082). The funders had no impact on the design, implementation,analysis, and interpretation of the data.Duality of Interest. No potential conflicts of interest relevant to this articlewere reported.Author Contributions. D.E. performed the analysis. D.E. and W.z.C.developed the algorithm. D.E., W.z.C., E.B., M.R., W.A.H., J.-X.S., Å.L., J.T., K.V.,A.J.K.W., L.Y., B.A., J.P.K., A.-G.Z., and P.A. attest to meeting the InternationalCommittee of Medical Journal Editors uniform requirements for authorship bymaking substantial contributions to conceiving and designing this paper; acquir-ing, analyzing, and interpreting the data; drafting or revising the article forintellectual content; and giving final approval of the published version. D.E.,W.z.C., and P.A. interpreted the findings and wrote the manuscript. W.z.C. andP.A. proposed the analysis. E.B., M.R., W.A.H., J.-X.S., Å.L., J.T., K.V., A.J.K.W.,L.Y., B.A., J.P.K., and A.-G.Z. acquired, analyzed, or interpreted data andreviewed and edited the manuscript for intellectual content. M.R., W.A.H., J.-X.S.,Å.L., J.T., B.A., J.P.K., and A.-G.Z. designed TEDDY Study. W.z.C. and P.A.are the guarantors of this work and, as such, had full access to all the data in thestudy and take responsibility for the integrity of the data and the accuracy ofthe data analysis.
References1. Regnell SE, Lernmark Å. Early prediction of autoimmune (type 1) diabetes.Diabetologia 2017;60:1370–13812. Ziegler AG, Rewers M, Simell O, et al. Seroconversion to multiple isletautoantibodies and risk of progression to diabetes in children. JAMA 2013;309:2473–24793. American Diabetes Association. 2. Classification and diagnosis of diabetes:Standards of Medical Care in Diabetes—2018. Diabetes Care 2018;41(Suppl. 1):S13–S274. Insel RA, Dunne JL, Atkinson MA, et al. Staging presymptomatic type 1diabetes: a scientific statement of JDRF, the Endocrine Society, and the AmericanDiabetes Association. Diabetes Care 2015;38:1964–19745. Hummel M, Bonifacio E, Schmid S, Walter M, Knopff A, Ziegler AG. Briefcommunication: early appearance of islet autoantibodies predicts childhoodtype 1 diabetes in offspring of diabetic parents. Ann Intern Med 2004;140:882–8866. Parikka V, Näntö-Salonen K, Saarinen M, et al. Early seroconversion andrapidly increasing autoantibody concentrations predict prepubertal mani-festation of type 1 diabetes in children at genetic risk. Diabetologia 2012;55:1926–19367. Steck AK, Vehik K, Bonifacio E, et al.; TEDDY Study Group. Predictors ofprogression from the appearance of islet autoantibodies to early childhood di-abetes: The Environmental Determinants of Diabetes in the Young (TEDDY). Di-abetes Care 2015;38:808–8138. Bingley PJ, Christie MR, Bonifacio E, et al. Combined analysis of auto-antibodies improves prediction of IDDM in islet cell antibody-positive relatives.Diabetes 1994;43:1304–13109. Achenbach P, Warncke K, Reiter J, et al. Stratification of type 1 diabetesrisk on the basis of islet autoantibody characteristics. Diabetes 2004;53:384–39210. Orban T, Sosenko JM, Cuthbertson D, et al.; Diabetes Prevention Trial-Type1 Study Group. Pancreatic islet autoantibodies as predictors of type 1 diabetes inthe Diabetes Prevention Trial-Type 1. Diabetes Care 2009;32:2269–227411. Bonifacio E, Bingley PJ, Shattock M, et al. Quantification of islet-cellantibodies and prediction of insulin-dependent diabetes. Lancet 1990;335:147–14912. Sosenko JM, Skyler JS, Palmer JP, et al.; Type 1 Diabetes TrialNet StudyGroup; Diabetes Prevention Trial-Type 1 Study Group. The prediction of type1 diabetes by multiple autoantibody levels and their incorporation into an auto-antibody risk score in relatives of type 1 diabetic patients. Diabetes Care 2013;36:2615–2620
13. Achenbach P, Koczwara K, Knopff A, Naserke H, Ziegler AG, Bonifacio E.Mature high-affinity immune responses to (pro)insulin anticipate the autoimmunecascade that leads to type 1 diabetes. J Clin Invest 2004;114:589–59714. Mayr A, Schlosser M, Grober N, et al. GAD autoantibody affinity and epitopespecificity identify distinct immunization profiles in children at risk for type 1diabetes. Diabetes 2007;56:1527–153315. Decochez K, De Leeuw IH, Keymeulen B, et al.; Belgian Diabetes Registry.IA-2 autoantibodies predict impending type I diabetes in siblings of patients.Diabetologia 2002;45:1658–166616. Achenbach P, Bonifacio E, Williams AJ, Ziegler AG, Gale EA, Bingley PJ;ENDIT Group. Autoantibodies to IA-2beta improve diabetes risk assessment inhigh-risk relatives. Diabetologia 2008;51:488–49217. De Grijse J, Asanghanwa M, Nouthe B, et al.; Belgian Diabetes Registry.Predictive power of screening for antibodies against insulinoma-associatedpro-tein 2 beta (IA-2beta) and zinc transporter-8 to select first-degreerelatives of type 1 diabetic patients with risk of rapid progression to clinicalonset of the disease: implications for prevention trials. Diabetologia 2010;53:517–52418. Hawa MI, Fava D, Medici F, et al. Antibodies to IA-2 and GAD65 in type 1 andtype 2 diabetes: isotype restriction and polyclonality. Diabetes Care 2000;23:228–23319. Williams AJ, Lampasona V, Wyatt R, et al. Reactivity to N-terminally truncatedGAD65(96-585) identifies GAD autoantibodies that are more closely associatedwith diabetes progression in relatives of patients with type 1 diabetes. Diabetes2015;64:3247–325220. Vehik K, Lynch KF, Schatz DA, et al.; TEDDY Study Group. Reversion of b-cellautoimmunity changes risk of type 1 diabetes: TEDDY study. Diabetes Care 2016;39:1535–154221. Endesfelder D, Hagen M, Winkler C, et al. A novel approach for the analysisof longitudinal profiles reveals delayed progression to type 1 diabetes ina subgroup of multiple-islet-autoantibody-positive children. Diabetologia 2016;59:2172–218022. TEDDY Study Group. The Environmental Determinants of Diabetes in theYoung (TEDDY) study: study design. Pediatr Diabetes 2007;8:286–29823. Hagopian WA, Erlich H, Lernmark A, et al.; TEDDY Study Group. The En-vironmental Determinants of Diabetes in the Young (TEDDY): genetic criteria andinternational diabetes risk screening of 421 000 infants. Pediatr Diabetes 2011;12:733–74324. Bonifacio E, Yu L, Williams AK, et al. Harmonization of glutamic acid de-carboxylase and islet antigen-2 autoantibody assays for national institute of di-abetes and digestive and kidney diseases consortia. J Clin Endocrinol Metab 2010;95:3360–336725. Krischer JP, Lynch KF, Schatz DA, et al.; TEDDY Study Group. The 6 yearincidence of diabetes-associated autoantibodies in genetically at-risk children:the TEDDY study. Diabetologia 2015;58:980–98726. Haar A. Zur Theorie der orthogonalen Funktionensysteme. Math Ann 1910;69:331–37127. Uusitalo U, Lee HS, Andrén Aronsson C, et al.; TEDDY Study Group. Early infantdiet and islet autoimmunity in the TEDDY study. Diabetes Care 2018;41:522–53028. Lynch KF, Lee HS, Törn C, et al.; TEDDY Study Group. Gestational respiratoryinfections interacting with offspring HLA and CTLA-4 modifies incident b-cellautoantibodies. J Autoimmun 2018;86:93–10329. Norris JM, Lee HS, Frederiksen B, et al.; TEDDY Study Group. Plasma25-hydroxyvitamin D concentration and risk of islet autoimmunity. Diabetes2018;67:146–15430. Lönnrot M, Lynch KF, Elding Larsson H, et al.; TEDDY Study Group. Re-spiratory infections are temporally associated with initiation of type 1 diabetesautoimmunity: the TEDDY study. Diabetologia 2017;60:1931–194031. Hummel S, Beyerlein A, Tamura R, et al.; TEDDY Study Group. First infantformula type and risk of islet autoimmunity in The Environmental Determi-nants of Diabetes in the Young (TEDDY) study. Diabetes Care 2017;40:398–404
diabetes.diabetesjournals.org Endesfelder and Associates 129
32. Uusitalo U, Liu X, Yang J, et al.; TEDDY Study Group. Association of earlyexposure of probiotics and islet autoimmunity in the TEDDY study. JAMA Pediatr2016;170:20–2833. Sharma A, Liu X, Hadley D, et al.; TEDDY Study Group. Identification ofnon-HLA genes associated with development of islet autoimmunity andtype 1 diabetes in the prospective TEDDY cohort. J Autoimmun 2018;89:90–10034. Krischer JP, Liu X, Lernmark Å, et al.; TEDDY Study Group. The influence oftype 1 diabetes genetic susceptibility regions, age, sex, and family history on theprogression frommultiple autoantibodies to type 1 diabetes: a TEDDY study report.Diabetes 2017;66:3122–312935. Krischer JP, Lynch KF, Lernmark Å, et al.; TEDDY Study Group. Geneticand environmental interactions modify the risk of diabetes-related autoim-munity by 6 years of age: the TEDDY study. Diabetes Care 2017;40:1194–1202
36. Achenbach P, Hummel M, Thümer L, Boerschmann H, Höfelmann D, ZieglerAG. Characteristics of rapid vs slow progression to type 1 diabetes in multiple isletautoantibody-positive children. Diabetologia 2013;56:1615–162237. Graham J, Hagopian WA, Kockum I, et al.; Diabetes Incidence in SwedenStudy Group; Swedish Childhood Diabetes Study Group. Genetic effects on age-dependent onset and islet cell autoantibody markers in type 1 diabetes. Diabetes2002;51:1346–135538. Vermeulen I, Weets I, Asanghanwa M, et al.; Belgian Diabetes Registry.Contribution of antibodies against IA-2b and zinc transporter 8 to classification ofdiabetes diagnosed under 40 years of age. Diabetes Care 2011;34:1760–176539. Ilonen J, Hammais A, Laine AP, et al. Patterns of b-cell autoantibody ap-pearance and genetic associations during the first years of life. Diabetes 2013;62:3636–364040. Bingley PJ. Clinical applications of diabetes antibody testing. J Clin Endo-crinol Metab 2010;95:25–33
130 Modeling of Longitudinal Autoantibody Profiles Diabetes Volume 68, January 2019


