TIME Magazine “Bitter Pill: Why Medical Bills are Killing US” By Steven Brill March 4, 2013 p....
40
TIME Magazine “Bitter Pill: Why Medical Bills are Killing US” By Steven Brill March 4, 2013 p. 16-55 Slides by Randall P Ellis Economics Department Boston University (Drawing upon ppt slides of Calvin Luscombe)
-
Upload
kathryn-benson -
Category
Documents
-
view
218 -
download
1
Transcript of TIME Magazine “Bitter Pill: Why Medical Bills are Killing US” By Steven Brill March 4, 2013 p....

TIME Magazine“Bitter Pill: Why Medical Bills are Killing US”
By Steven BrillMarch 4, 2013 p. 16-55
Slides by Randall P EllisEconomics Department
Boston University(Drawing upon ppt slides of Calvin Luscombe)

Case Studies
• Sean Recchi: 42, small business, private insurance, but coverage limit of $2000/day for IP care– Cancer: Billed $83,900 OOP in advance.
• Janis S: 64, unemployed, uninsured. – Heart Burn: Billed $21,000 OOP.
• Emilia Glibert: 60ish, school bus driver, no insurance. – Slip and fall, One day treatment: Billed $9,400 OOP.
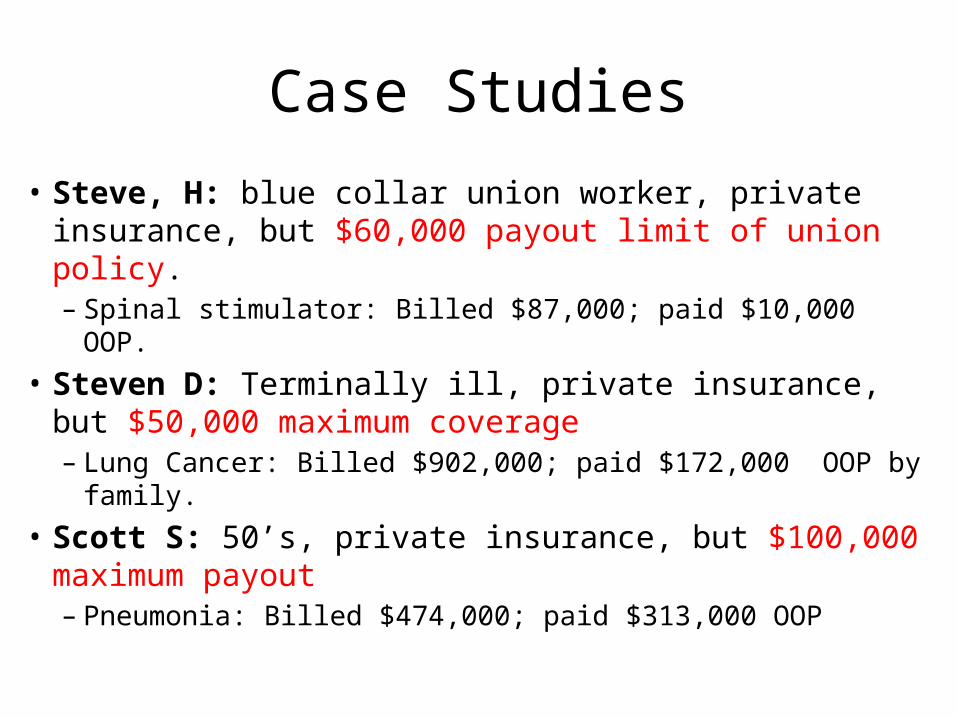
Case Studies
• Steve, H: blue collar union worker, private insurance, but $60,000 payout limit of union policy. – Spinal stimulator: Billed $87,000; paid $10,000 OOP.
• Steven D: Terminally ill, private insurance, but $50,000 maximum coverage – Lung Cancer: Billed $902,000; paid $172,000 OOP by
family.• Scott S: 50’s, private insurance, but $100,000
maximum payout– Pneumonia: Billed $474,000; paid $313,000 OOP
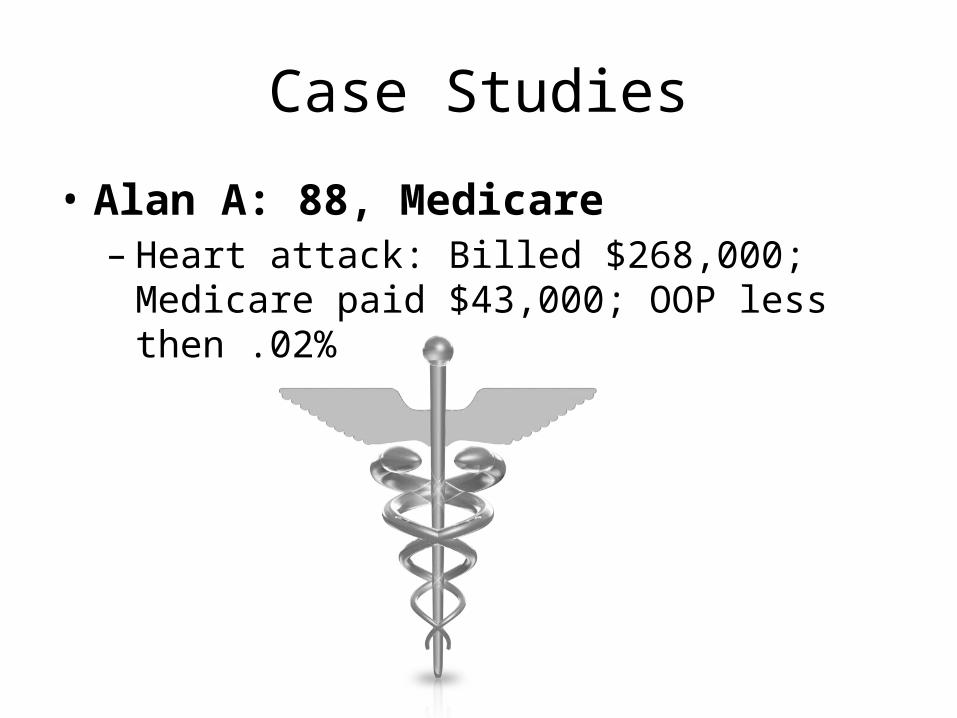
Case Studies
• Alan A: 88, Medicare– Heart attack: Billed $268,000; Medicare paid
$43,000; OOP less then .02%

The Chargemaster
• Hospital Price guide– Not based on cost– Not used for Medicare reimbursements
• Used as starting price in payment negotiations– Assuming agent aware they are bargaining.
• Used to help justify charitable donations• Zero transparency (HIPPA Shield)– Every hospital has its own, unique Chargemaster
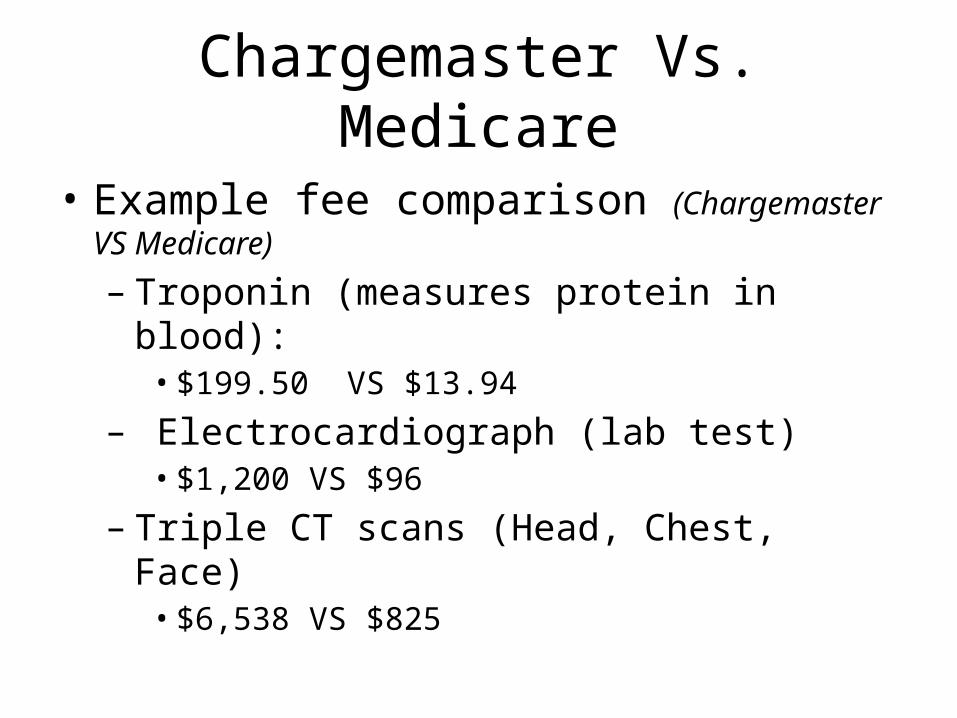
Chargemaster Vs. Medicare
• Example fee comparison (Chargemaster VS Medicare)
– Troponin (measures protein in blood): • $199.50 VS $13.94
– Electrocardiograph (lab test)• $1,200 VS $96
– Triple CT scans (Head, Chest, Face)• $6,538 VS $825

Pay No Attention To The Chargemaster ”These are not the droids you’re looking for.” - Star Wars
• Representatives avoid explanations about the Chargemaster.
• Justification of high rates include:– Almost no one pays them– At least then everyone receives the same bill– We use these rates to charge rich foreigners and
subsidize treating the poor– They are a starting point for negations not a final
offer

Exorbitant fees may have resulted from hospitals gaming the Medicare DRG outlier
formula• Hospitals in US are paid primarily a lump sum
Diagnosis Related Group (DRG) payment for each admission. Receive 80 percent of any excess of costs above a high threshold ( e.g., when more than $25,000 over the DRG payment)
• Hospital “costs” determined by taking their submitted charges, and multiplying them by the LAGGED hospital Cost to Charge ratio.
• It is profitable to keep increasing submitted charges to stay ahead of the CCRt-1.
Too Big To Regulate
• Large employers • Positive local reputation• Threat of reducing services to poor
Medical-billing advocates
• Negotiate for reductions in charges• Seton hospital accepts a 82% average discount
on its charges• Appear to bring huge value to their clients• New to me
Cash Crop: Durable Medical Goods
• Medtronic: Profit margin 75% vs. Apple 40%• Congress protected profit• Payments to physicians– Stock options– Royalty agreements– Consulting agreements – Research grants and fellowships
• Sunshine laws?

Better Safe Than Sorry: Malpractice
• Technological advance: high cost but not necessarily high benefit.
• Hospital CEO says: “We can’t be sued for doing too much.”
• Practical Proposal: Safe Harbor
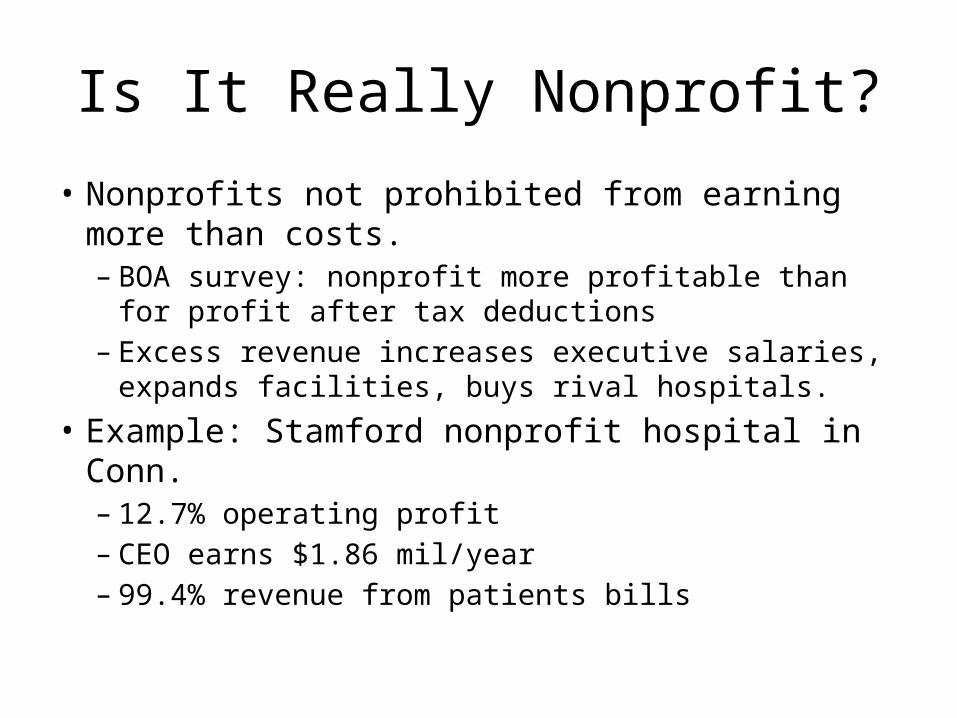
Is It Really Nonprofit?
• Nonprofits not prohibited from earning more than costs.– BOA survey: nonprofit more profitable than for profit
after tax deductions– Excess revenue increases executive salaries, expands
facilities, buys rival hospitals.• Example: Stamford nonprofit hospital in Conn.– 12.7% operating profit– CEO earns $1.86 mil/year – 99.4% revenue from patients bills
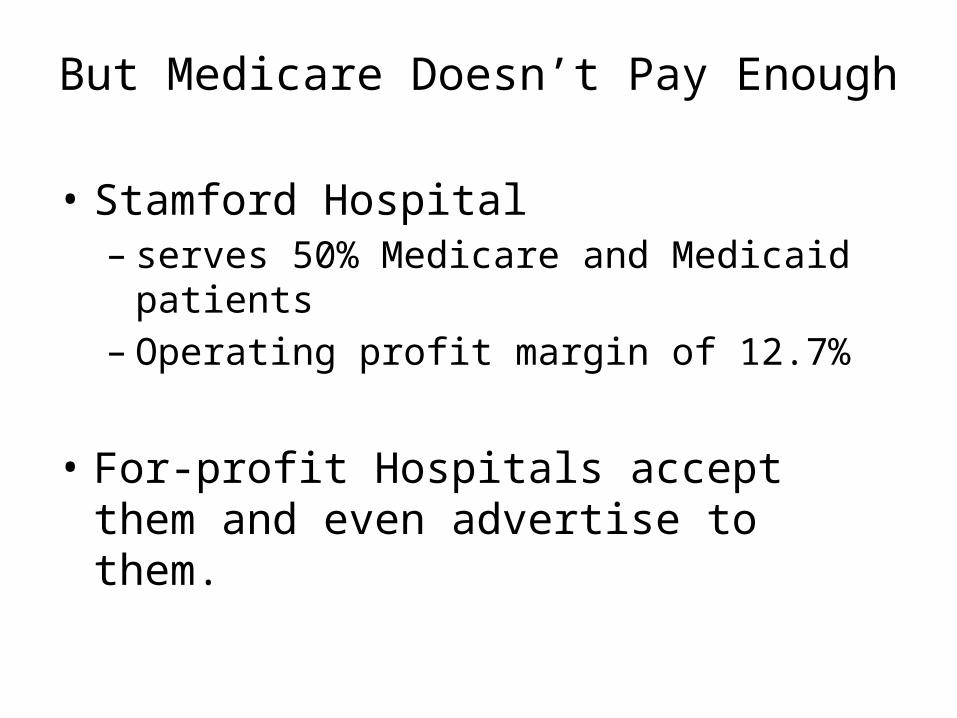
But Medicare Doesn’t Pay Enough
• Stamford Hospital– serves 50% Medicare and Medicaid patients– Operating profit margin of 12.7%
• For-profit Hospitals accept them and even advertise to them.
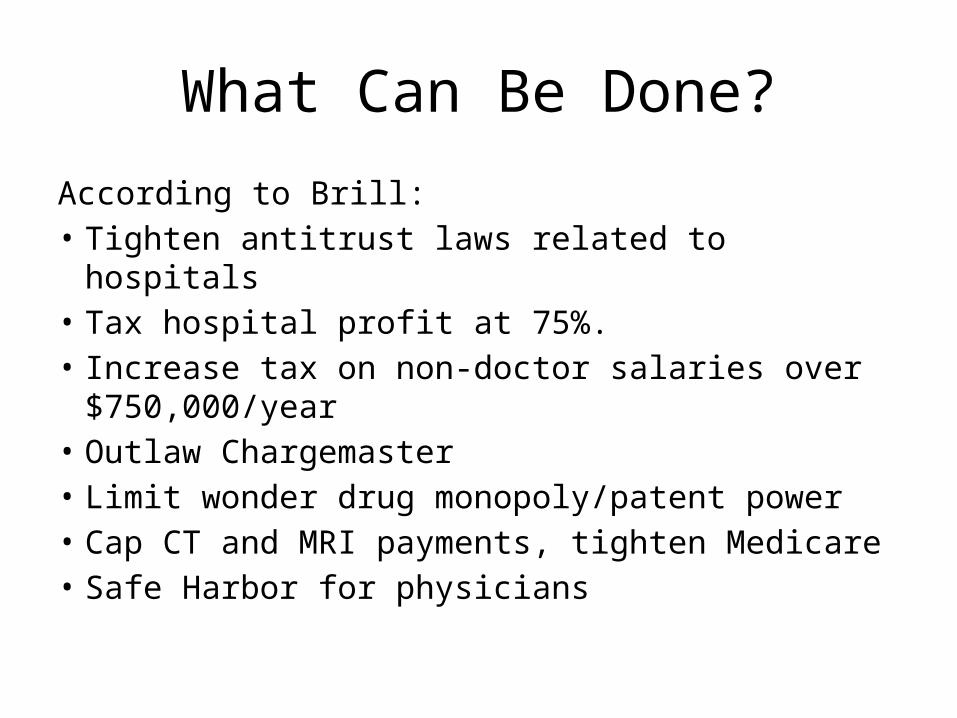
What Can Be Done?
According to Brill:• Tighten antitrust laws related to hospitals• Tax hospital profit at 75%. • Increase tax on non-doctor salaries over
$750,000/year• Outlaw Chargemaster• Limit wonder drug monopoly/patent power • Cap CT and MRI payments, tighten Medicare• Safe Harbor for physicians
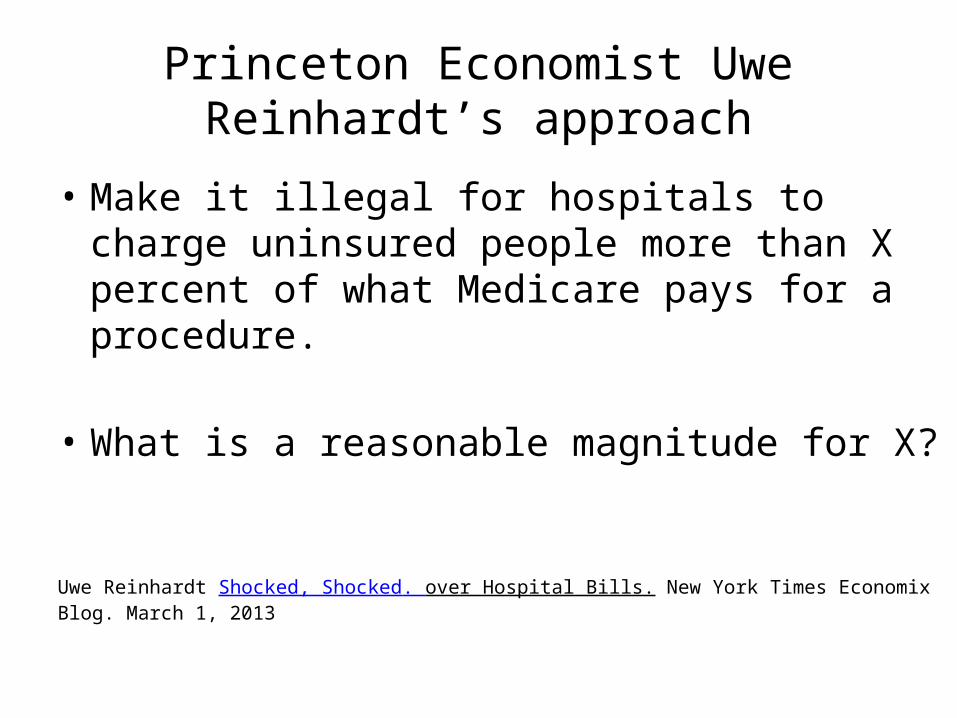
Princeton Economist Uwe Reinhardt’s approach
• Make it illegal for hospitals to charge uninsured people more than X percent of what Medicare pays for a procedure.
• What is a reasonable magnitude for X?
Uwe Reinhardt Shocked, Shocked. over Hospital Bills. New York Times Economix Blog. March 1, 2013

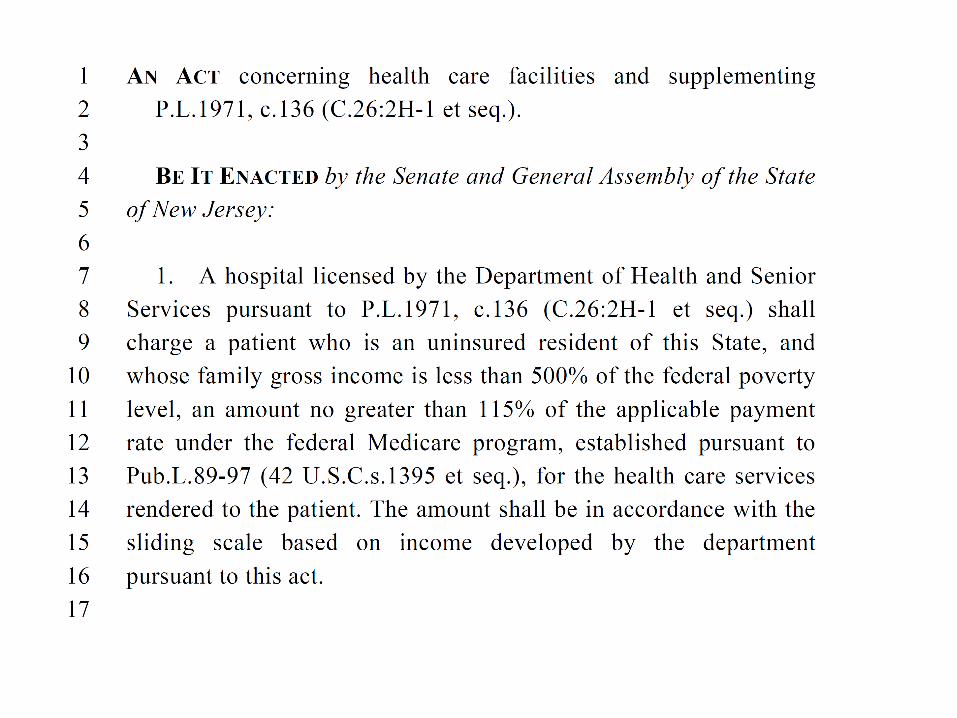
Uwe Reinhardt’s approach
• Professor Reinhardt served on a state commission that helped guide the state of New Jersey to enact such legislation in 2008.
• Former Gov. Jon Corzine of New Jersey worked with the state Legislature to enact Assembly Bill No. 2609.
• The bill limits what New Jersey hospitals can charge uninsured New Jersey residents with gross incomes up to 500 percent of the federal poverty level: no more than 115 percent of the applicable payment under the federal Medicare program.

Other problems with US
• All of the prices featured in the Brill article are for people paying prices not negotiated by their health plan. Few people do indeed pay such high prices.
• But there are other problems with fees being simply too high. – Fees unreasonably high when there is market power– Providers often able to upcode the number and
intensity of services they provide.

When considering antitrust for price setting and monopolization, what is the relevant
market?• Consider the proposed acquisition of three
practices with TEN primary care physicians (PCPs). Will this unduly increase a provider networks market power?
• Market is Massachusetts, all physicians: • 29,000 physicians in Massachusetts• 1203 MDs in Essex County• 493 PCPs in Essex County• 36 PCPs in the three towns where they are locating?
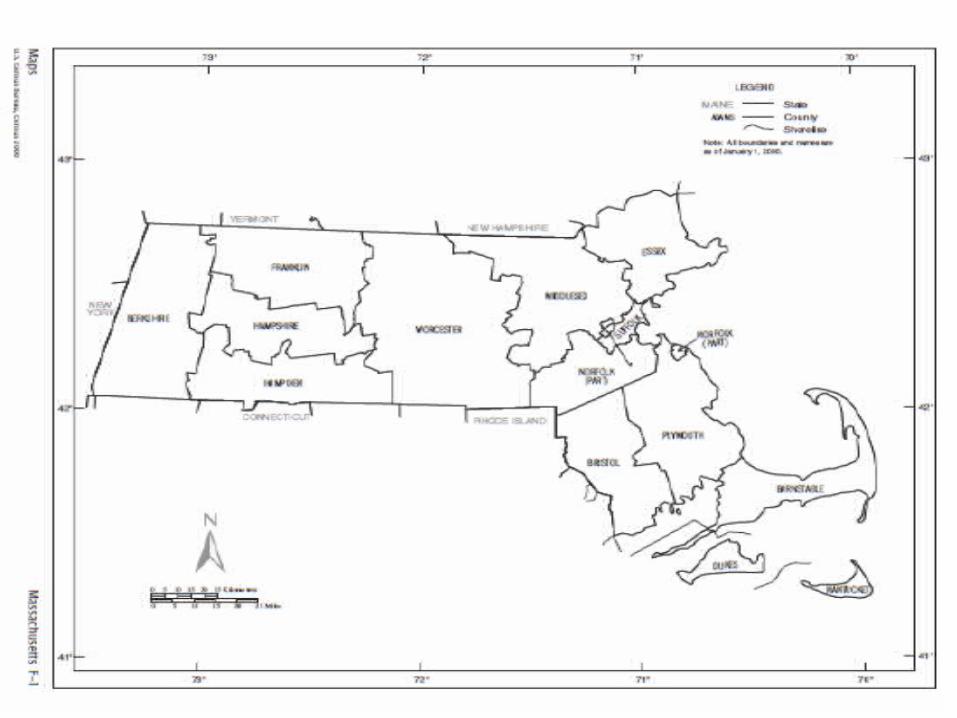

Map of North Shore cities and towns
Source: http://www.sec.state.ma.us/cis/cispdf/ma_city_town.pdf
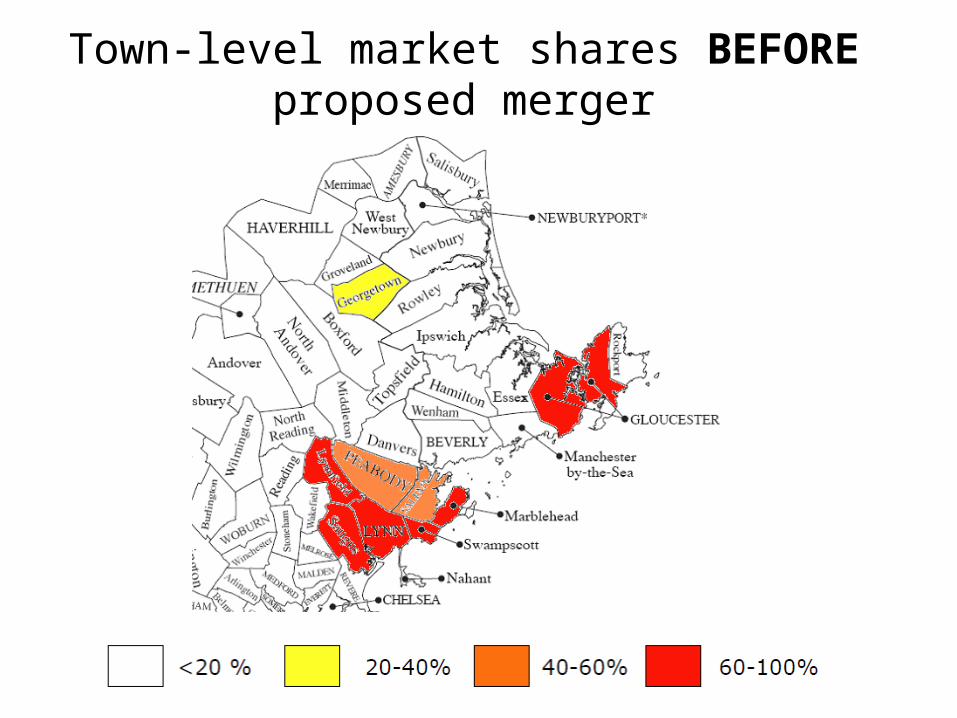
Town-level market shares BEFORE proposed merger
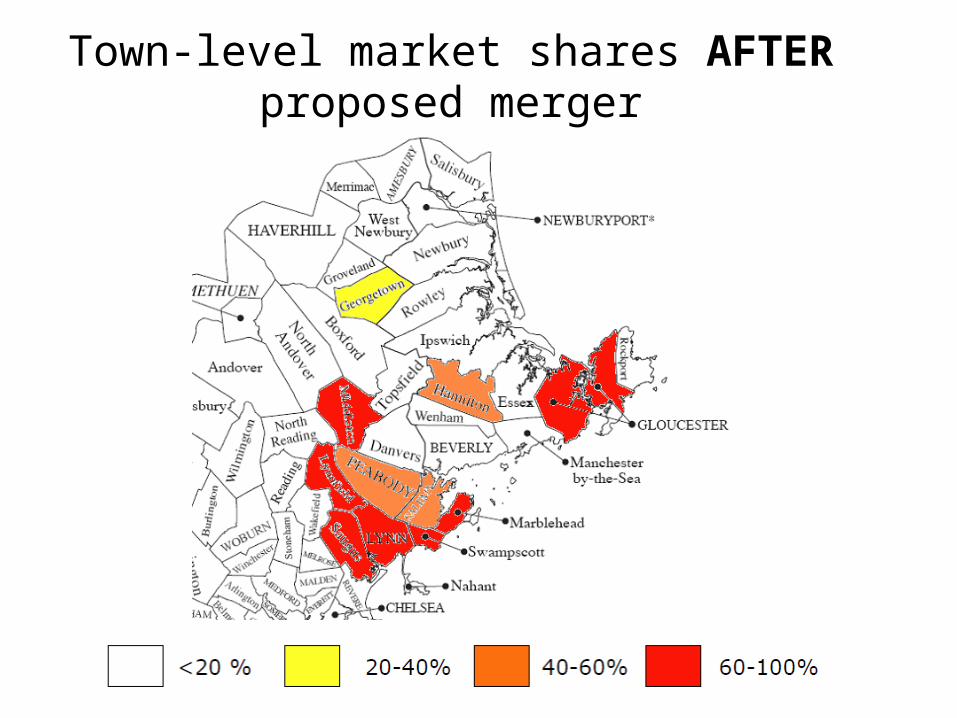
Town-level market shares AFTER proposed merger

Massachusetts faces a crisis?!?
Table 1.1 Physician Specialties Categorized as Critical or Severe in 2011 Massachusetts Medical Society Survey
Specialty Dermatology Severe Family Medicine Severe General Surgery Severe Internal Medicine Critical Neurosurgery Severe Orthopedics Severe Psychiatry Critical Urology Critical
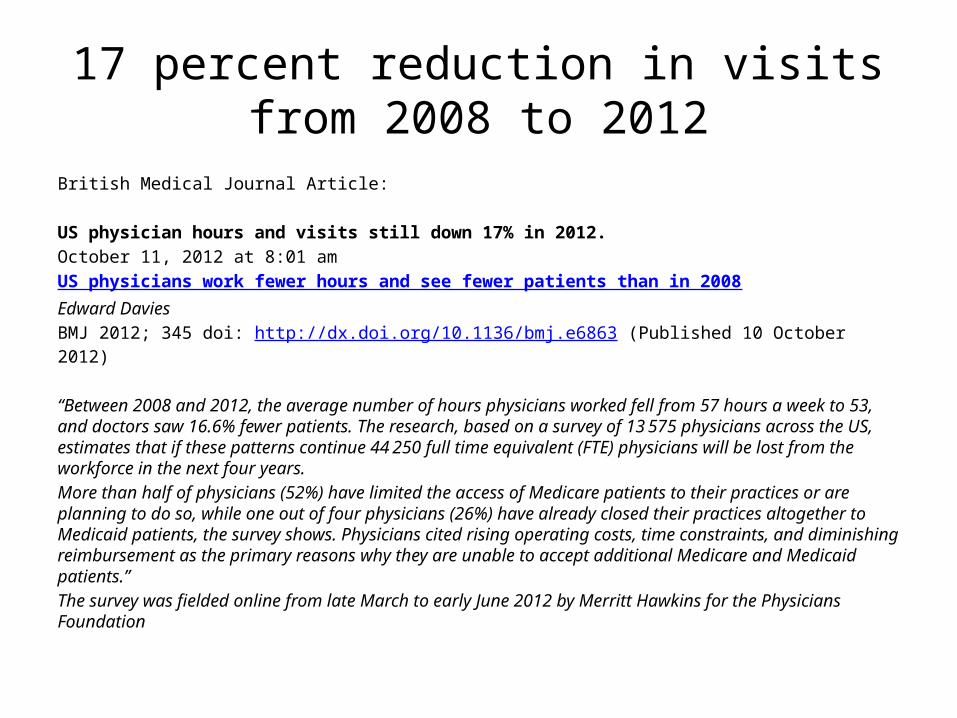
17 percent reduction in visits from 2008 to 2012
British Medical Journal Article:
US physician hours and visits still down 17% in 2012.October 11, 2012 at 8:01 amUS physicians work fewer hours and see fewer patients than in 2008Edward DaviesBMJ 2012; 345 doi: http://dx.doi.org/10.1136/bmj.e6863 (Published 10 October 2012) “Between 2008 and 2012, the average number of hours physicians worked fell from 57 hours a week to 53, and doctors saw 16.6% fewer patients. The research, based on a survey of 13 575 physicians across the US, estimates that if these patterns continue 44 250 full time equivalent (FTE) physicians will be lost from the workforce in the next four years. More than half of physicians (52%) have limited the access of Medicare patients to their practices or are planning to do so, while one out of four physicians (26%) have already closed their practices altogether to Medicaid patients, the survey shows. Physicians cited rising operating costs, time constraints, and diminishing reimbursement as the primary reasons why they are unable to accept additional Medicare and Medicaid patients.”The survey was fielded online from late March to early June 2012 by Merritt Hawkins for the Physicians Foundation
1 2 3 4 5 6 7 8 9 10 11 12 1 2 3 4 5 6 7 8 9 10 11 12 1 2 3 4 5 6 7 8 9 10 11 12 1 2 3 4 5 6 7 8 9 10 11 122007 2008 2009 2010
0
50
100
150
200
250
300
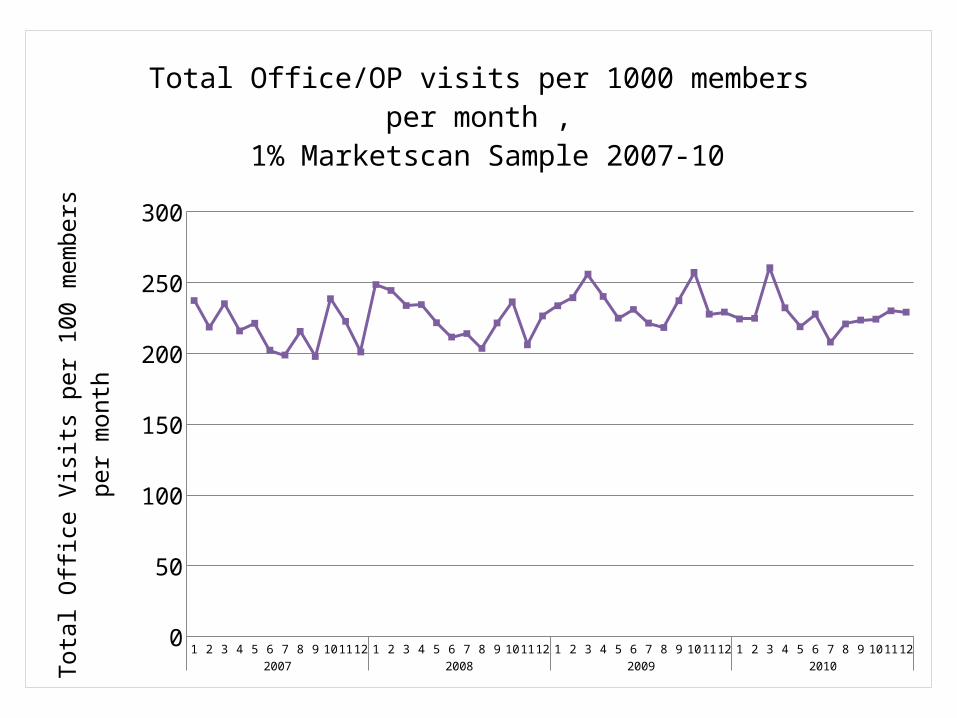
Total Office/OP visits per 1000 members per month , 1% Marketscan Sample 2007-10
Tota
l Offi
ce V
isits
per
100
mem
bers
per
mon
th
0
50
100
150
200
250
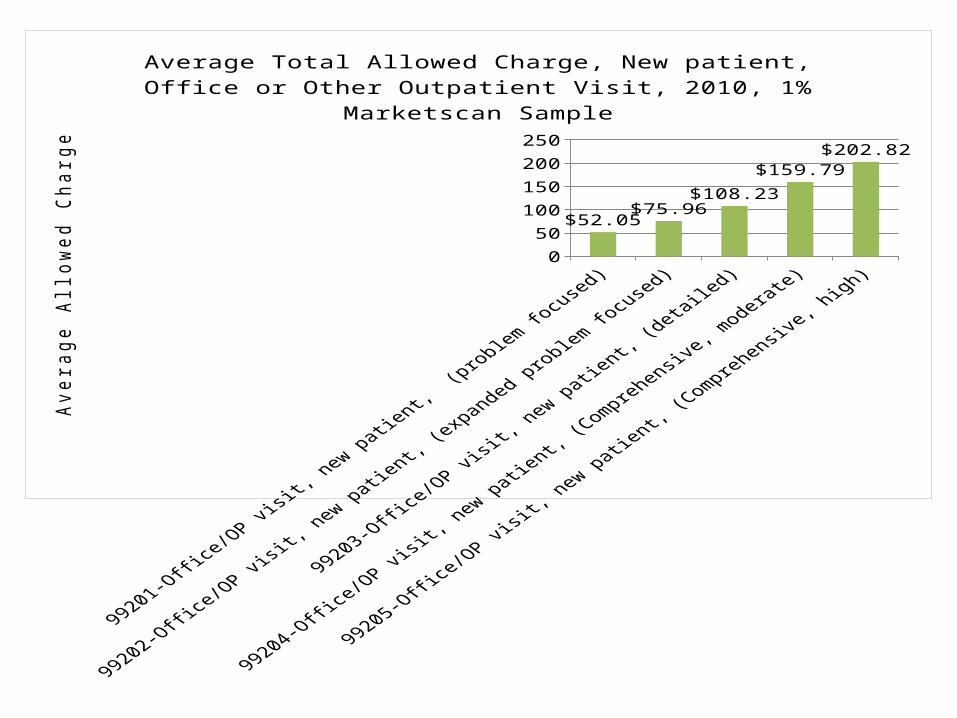
$52.05$75.96
$108.23
$159.79$202.82
Average Total Allowed Charge, New patient, Office or Other Outpa-tient Visit, 2010, 1% Marketscan Sample
Aver
age
Allo
wed
Cha
rge

0
50
100
150
200
250
$32.52 $46.80$71.88
$105.11$145.19
Average Total Allowed Charge, Established patient, Office or Other Outpatient Visit, 2010, 1% Marketscan SampleA
vera
ge A
llow
ed C
harg
e
2007 2008 2009 20100%
10%
20%
30%
40%
50%
60%
70%
80%
90%
100%
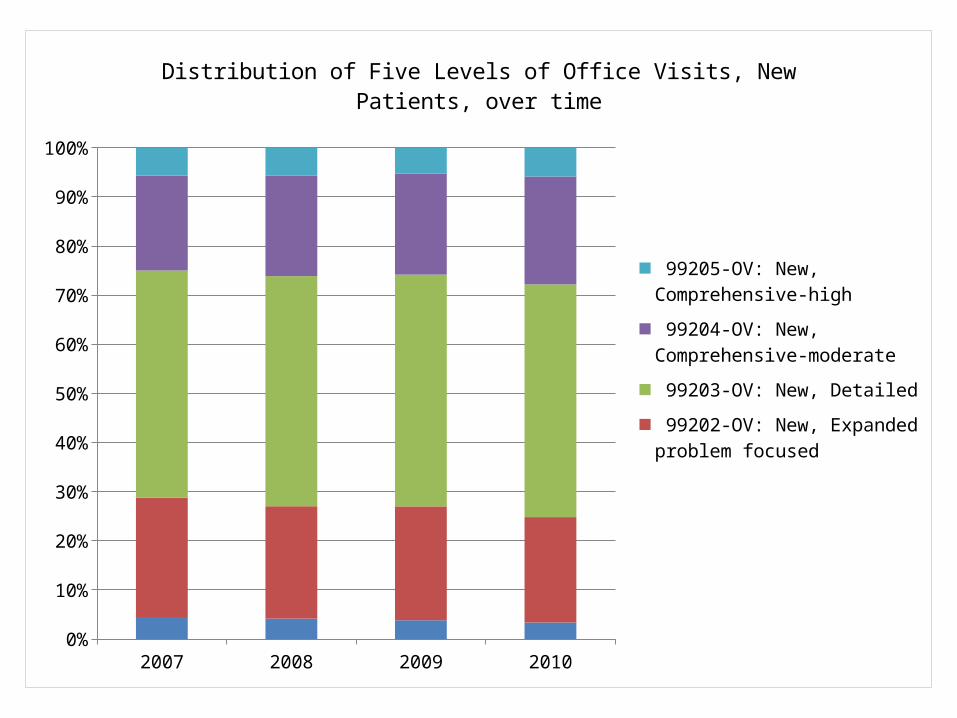
Distribution of Five Levels of Office Visits, New Patients, over time
99205-OV: New, Comprehensive-high
99204-OV: New, Comprehensive-moderate
99203-OV: New, Detailed
99202-OV: New, Expanded prob-lem focused
99201-OV: New, Problem focused
1 2 3 4 5 6 7 8 9 1011121314151617181920212223242526272829303132333435363738394041424344454647480.7
0.8
0.9
1.0
1.1
1.2
1.3
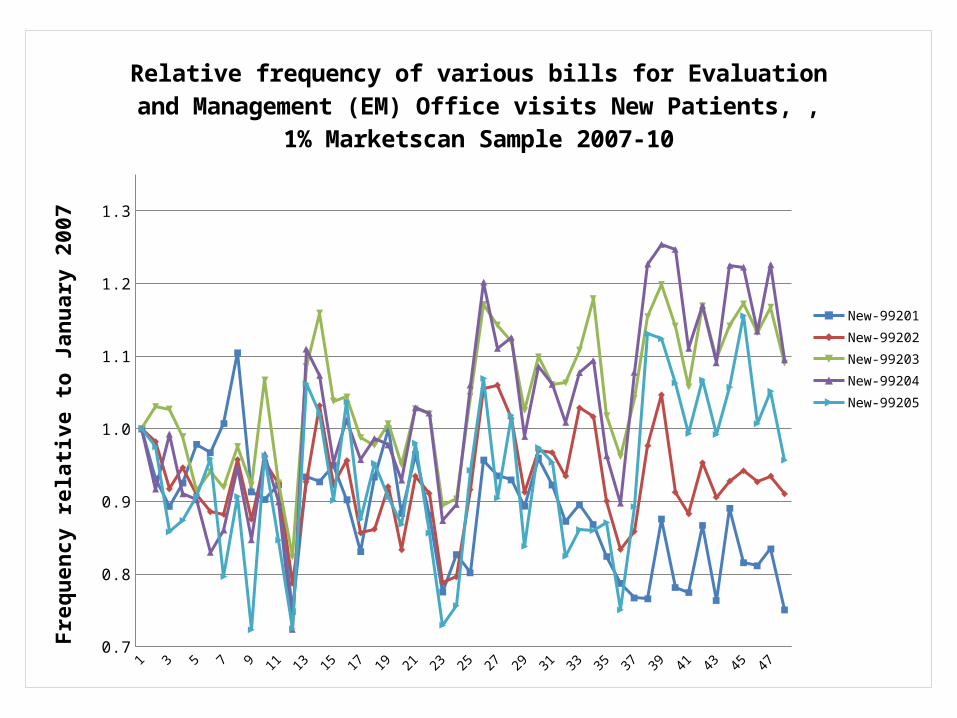
Relative frequency of various bills for Evaluation and Management (EM) Office visits New Patients, , 1% Marketscan Sample 2007-10
New-99201New-99202New-99203New-99204New-99205
Freq
uenc
y re
lativ
e to
Janu
ary
2007

1 2 3 4 5 6 7 8 9 1011121314151617181920212223242526272829303132333435363738394041424344454647480.7
0.8
0.9
1.0
1.1
1.2
1.3
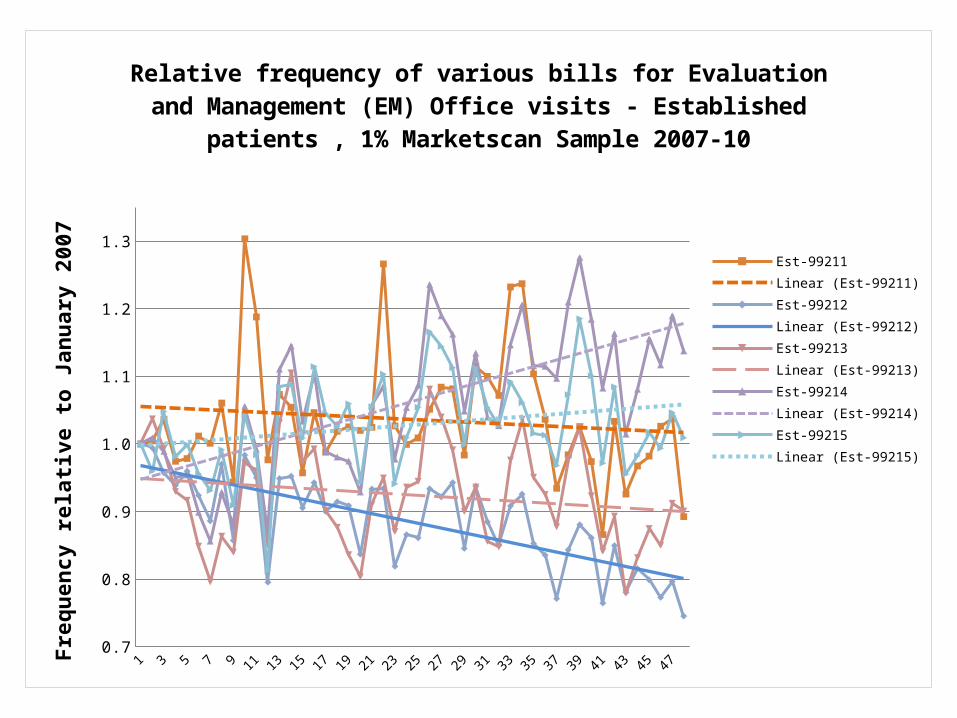
Relative frequency of various bills for Evaluation and Management (EM) Office visits - Established patients , 1% Marketscan Sample 2007-10
Est-99211Est-99212Est-99213Est-99214Est-99215
Freq
uenc
y re
lativ
e to
Janu
ary
2007
1 3 5 7 9 11 13 15 17 19 21 23 25 27 29 31 33 35 37 39 41 43 45 470.7
0.8
0.9
1.0
1.1
1.2
1.3
Relative frequency of various bills for Evaluation and Management (EM) Office visits - Established patients , 1% Marketscan Sample 2007-10
Est-99211Linear (Est-99211)Est-99212Linear (Est-99212)Est-99213Linear (Est-99213)Est-99214Linear (Est-99214)Est-99215Linear (Est-99215)
Freq
uenc
y re
lativ
e to
Janu
ary
2007

1 2 3 4 5 6 7 8 9 10 11 12 13 14 15 16 17 18 19 20 21 22 23 24 25 26 27 28 29 30 31 32 33 34 35 36 37 38 39 40 41 42 43 44 45 46 47 480.7
0.8
0.9
1.0
1.1
1.2
1.3
Relative frequency of various bills for Evaluation and Management (EM) Office visits - Established patients , 1% Marketscan Sample 2007-10Fr
eque
ncy
rela
tive
to Ja
nuar
y 20
07
1 3 5 7 9 11 13 15 17 19 21 23 25 27 29 31 33 35 37 39 41 43 45 470.7
0.8
0.9
1.0
1.1
1.2
1.3
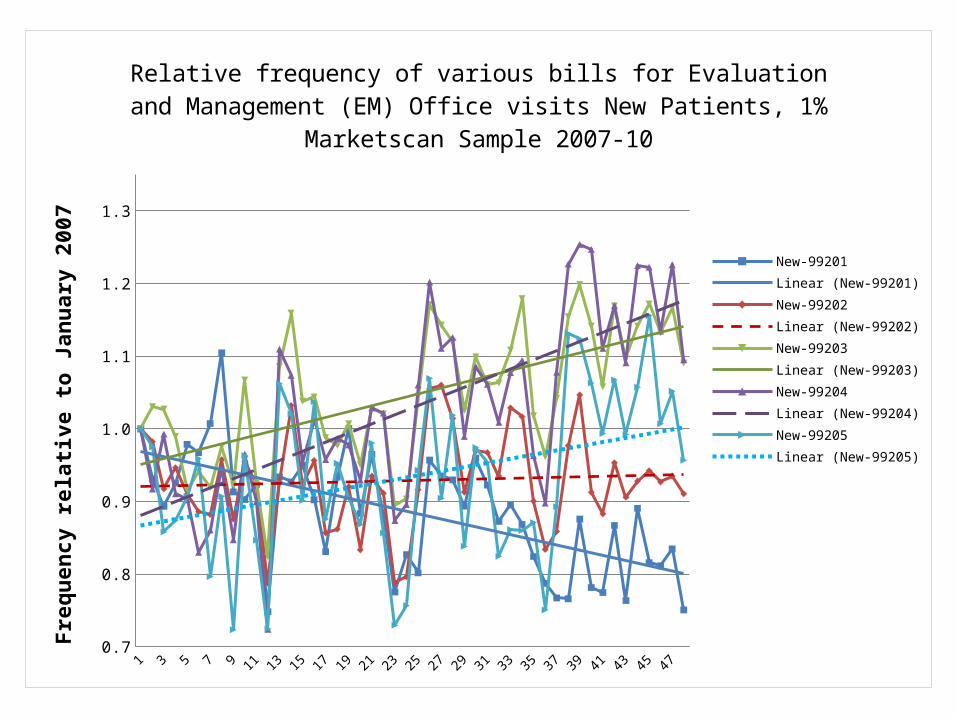
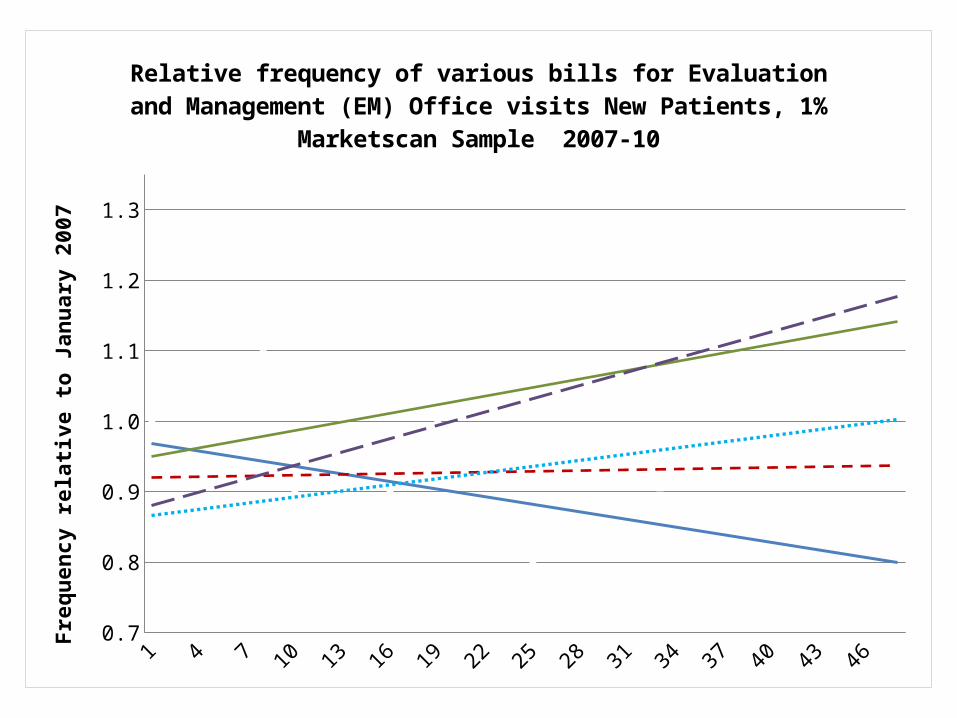
Relative frequency of various bills for Evaluation and Management (EM) Office visits New Patients, 1% Marketscan Sample 2007-10
New-99201Linear (New-99201)New-99202Linear (New-99202)New-99203Linear (New-99203)New-99204Linear (New-99204)New-99205Linear (New-99205)
Freq
uenc
y re
lativ
e to
Janu
ary
2007
1 3 5 7 9 11 13 15 17 19 21 23 25 27 29 31 33 35 37 39 41 43 45 470.7
0.8
0.9
1.0
1.1
1.2
1.3
Relative frequency of various bills for Evaluation and Management (EM) Office visits New Patients, 1% Marketscan Sample 2007-10
Freq
uenc
y re
lativ
e to
Janu
ary
2007

1 2 3 4 5 6 7 8 9 10 11 12 13 14 15 16 17 18 19 20 21 22 23 24 25 26 27 28 29 30 31 32 33 34 35 36 37 38 39 40 41 42 43 44 45 46 47 480.900
0.950
1.000
1.050
1.100
1.150
1.200
1.250
Mean Evaluation and Management Fee, 2007-2010, 1% Marketscan Sample
Time trend (months)
Mea
n E&
M fe
e re
lativ
e to
Janu
ary
2007
1 3 5 7 9 11 13 15 17 19 21 23 25 27 29 31 33 35 37 39 41 43 45 470.7
0.8
0.9
1.0
1.1
1.2
1.3
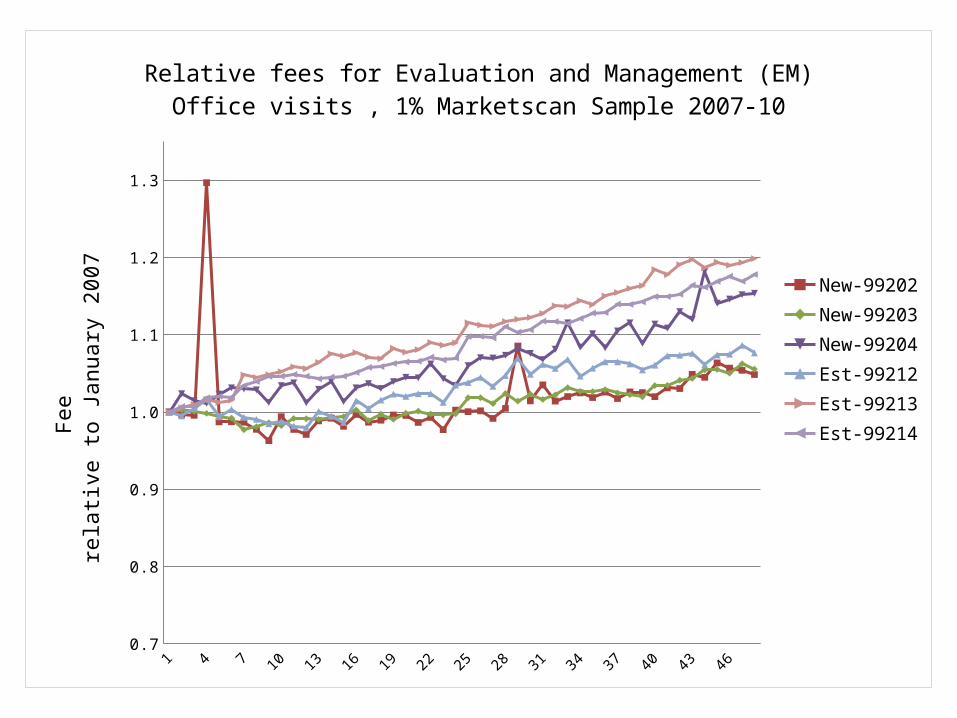
Relative fees for Evaluation and Management (EM) Office visits , 1% Marketscan Sample 2007-10
New-99202New-99203New-99204Est-99212Est-99213Est-99214Fe
e re
lativ
e to
Janu
ary
2007