
TIME-INVARIANT, DATABASED MODELING AND CONTROL OF BATCH ... · PDF fileof equipment called a...
248
TIME-INVARIANT, DATABASED MODELING AND CONTROL OF BATCH PROCESSES
-
Upload
duongthien -
Category
Documents
-
view
220 -
download
2
Transcript of TIME-INVARIANT, DATABASED MODELING AND CONTROL OF BATCH ... · PDF fileof equipment called a...

TIME-INVARIANT, DATABASED MODELING AND CONTROL OF BATCHPROCESSES

TIME-INVARIANT, DATABASED MODELING AND CONTROL OF BATCHPROCESSES
By BRANDON CORBETT, B.Eng.
A Thesis
Submitted to the Department of Chemical Engineering
and the School of Graduate Studies
of McMaster University
in Partial Fulfillment of the Requirements
for the Degree of
Doctor of Philosophy
McMaster University c© Copyright by Brandon Corbett, September 2016
i

Doctor of Philosophy(September 2016) McMaster University
(Chemical Engineering ) Hamilton, ON, Canada
TITLE: Time-invariant, Databased Modeling and Control ofBatch Processes
AUTHOR: Brandon Corbett, B.Eng.
SUPERVISOR: Professor P. Mhaskar
NUMBER OF PAGES: xv, 232
ii

Lay Abstract
High-end chemical products, ranging from pharmaceuticals to specialty plastics, are
key to improving quality of life. For these products, production quality is more
important than quantity. To produce high quality products, industries use a piece
of equipment called a batch reactor. These reactors are favorable over alternatives
because if any single batch fails to meet a quality specification, it can be easily dis-
carded. However, given the high-value nature of these products, even a small number
of discarded batches is costly.
This motivates the current work which addresses the complex topic of batch quality
control. This task is achieved in two steps: first methods are developed to model
prior reactor behavior. These models can be applied to predict how the reactor
will behave under future operating policies. Next, these models are used to make
informed decisions that drive the reaction to the desired end product, eliminating
off-spec batches.
iii

Abstract
Batch reactors are often used to produce high quality products because any batch that
does not meet quality specifications can be easily discarded. However, for high-value
products, even a few wasted batches constitute substantial economic loss. Fortunately,
databases of historical data that can be exploited to improve operation are often
readily available. Motivated by these considerations, this thesis addresses the problem
of direct, data-based quality control for batch processes. Specifically, two novel data-
driven modeling and control strategies are proposed.
The first approach addresses the quality modeling problem in two steps. To begin,
a partial least squares (PLS) model is developed to relate complete batch trajectories
to resulting batch qualities. Next, the so called missing-data problem, encountered
when using PLS models partway through a batch, is addressed using a data-driven,
multiple-model dynamic modeling approach relating candidate input trajectories to
future output behavior. The resulting overall model provides a causal link between
inputs and quality and is used in a model predictive control scheme for direct quality
control. Simulation results for two different polymerization reactors are presented
that demonstrate the efficacy of the approach.
The second strategy presented in this thesis is a state-space motivated, time-
invariant quality modeling and control approach. In this work, subspace identification
methods are adapted for use with transient batch data allowing state-space dynamic
models to be identified from historical data. Next, the identified states are related
iv

through an additional model to batch quality. The result is a causal, time-independent
model that relates inputs to product quality. This model is applied in a shrinking
horizon model predictive control scheme. Significantly, inclusion of batch duration
as a control decision variable is permitted because of the time-invariant model. Sim-
ulation results for a polymerization reactor demonstrate the superior capability and
performance of the proposed approach.
v

Dedication
This thesis is dedicated to Deb, Jeff, and Scott. They believed in me when others didnot, supported me in ways others would not, and inspired me in ways others couldnot. This thesis is as much a reflection of their hard work and perseverance as it is ofmine.
vi

Acknowledgments
I would like to begin by thanking my supervisor, Dr. Mhaskar. His technical knowl-
edge and willingness to repeat explanations (sometimes three or four times) informed
every decision I made in this work. However, his greatest contribution was his en-
couragement. After six years of working together, I left every one of our meetings
confident in my ability and determined to work harder. His undying optimism and
infinite patience undoubtedly made this work possible. For this, the opportunities he
gave me, and so much more, I will never be able to thank him enough.
I would also like to thank the other members of my committee, Dr. Adams and Dr.
Kiruba, for their valuable recommendations and support. I would like to especially
thank Dr. Adams for going well above and beyond the expectations of a committee
member. He made himself available on numerous occasions, despite his impossibly
busy schedule, to help me make difficult decisions about my work and my future. On
a different note, he may well be the most determined sweeper I know, which is saying
something!
Thanks to Siam Aumi, who acted as an advisor to me in my early work. By his
own example, he set an impossibly high standard. While we were collaborating, he
taught me by holding me to those same high standards. As he moved on, I remained
inspired by his example.
Thanks as well to all my colleagues and collaborators in the MACC. This incred-
ibly talented group of people were always there with words of support, advice, and
vii

encouragement.
Throughout this work, there have been countless friends and family members who
have supported me. Whether by understanding when I couldn’t honor commitments,
or through words of encouragement, all of these people made the work a little bit
easier.
Finally, and perhaps most importantly, thank you to my ever supportive wife
Holly. In the good times she was there to celebrate with me, in the low times she was
a rock solid support. I could not have completed this thesis without her.
viii

Contents
1 Introduction 1
2 Data-driven model predictive quality control of batch processes 102.1 Introduction . . . . . . . . . . . . . . . . . . . . . . . . . . . . . . . . 132.2 Preliminaries . . . . . . . . . . . . . . . . . . . . . . . . . . . . . . . 19
2.2.1 Process Description . . . . . . . . . . . . . . . . . . . . . . . . 202.2.2 Inferential Quality Model . . . . . . . . . . . . . . . . . . . . 212.2.3 Partial Least Squares (PLS) Regression . . . . . . . . . . . . . 242.2.4 Multi-model Data-driven Modeling for Batch Systems . . . . . 26
2.3 Model Predictive Quality Control . . . . . . . . . . . . . . . . . . . . 302.4 Simulation Results . . . . . . . . . . . . . . . . . . . . . . . . . . . . 34
2.4.1 Process Overview and Control Objective . . . . . . . . . . . . 342.4.2 Inferential Quality and Process Variable Models . . . . . . . . 372.4.3 Closed-loop Simulation Results . . . . . . . . . . . . . . . . . 41
2.5 Conclusions . . . . . . . . . . . . . . . . . . . . . . . . . . . . . . . . 43Bibliography . . . . . . . . . . . . . . . . . . . . . . . . . . . . . . . . . . 44
3 Model Predictive Quality Control of Polymethyl Methacrylate Poly-merization Process 473.1 Introduction . . . . . . . . . . . . . . . . . . . . . . . . . . . . . . . . 503.2 Process Overview and Control Objective . . . . . . . . . . . . . . . . 53
3.2.1 Process Description . . . . . . . . . . . . . . . . . . . . . . . . 533.2.2 Control objectives . . . . . . . . . . . . . . . . . . . . . . . . . 543.2.3 Data-base . . . . . . . . . . . . . . . . . . . . . . . . . . . . . 55
3.3 Dynamic Model Development . . . . . . . . . . . . . . . . . . . . . . 563.4 Quality Model Development . . . . . . . . . . . . . . . . . . . . . . . 613.5 Model Predictive Quality Control . . . . . . . . . . . . . . . . . . . . 63
3.5.1 MPQC formulation . . . . . . . . . . . . . . . . . . . . . . . . 633.5.2 Data-driven model-based quality control results . . . . . . . . 66
3.6 Conclusions . . . . . . . . . . . . . . . . . . . . . . . . . . . . . . . . 67Bibliography . . . . . . . . . . . . . . . . . . . . . . . . . . . . . . . . . . 703.7 Appendix A: First-principles PMMA Model From Literature . . . . . 73
ix

4 Subspace Identification for Data-driven Modeling and Quality Con-trol of Batch Processes 774.1 Introduction . . . . . . . . . . . . . . . . . . . . . . . . . . . . . . . . 804.2 Preliminaries . . . . . . . . . . . . . . . . . . . . . . . . . . . . . . . 87
4.2.1 Class of Processes . . . . . . . . . . . . . . . . . . . . . . . . . 884.2.2 Latent Variable Methods . . . . . . . . . . . . . . . . . . . . . 894.2.3 LVMPC . . . . . . . . . . . . . . . . . . . . . . . . . . . . . . 914.2.4 Subspace Identification . . . . . . . . . . . . . . . . . . . . . . 93
4.3 Motivating Example: Polymethyl Methacrylate Process . . . . . . . . 954.4 Latent Variable Control Analysis . . . . . . . . . . . . . . . . . . . . 1014.5 Subspace Quality Model Predictive Control
(SQMPC) . . . . . . . . . . . . . . . . . . . . . . . . . . . . . . . . . 1054.5.1 Subspace Identification of Batch Dynamics . . . . . . . . . . . 1064.5.2 PCR Quality Model . . . . . . . . . . . . . . . . . . . . . . . 1134.5.3 SQMPC - Formulation . . . . . . . . . . . . . . . . . . . . . . 116
4.6 Application to the PMMA process example . . . . . . . . . . . . . . . 1224.6.1 Database Generation . . . . . . . . . . . . . . . . . . . . . . . 1224.6.2 Dynamic model fitting . . . . . . . . . . . . . . . . . . . . . . 1254.6.3 Quality model fitting . . . . . . . . . . . . . . . . . . . . . . . 1294.6.4 Closed loop results . . . . . . . . . . . . . . . . . . . . . . . . 133
4.7 Conclusions . . . . . . . . . . . . . . . . . . . . . . . . . . . . . . . . 146Bibliography . . . . . . . . . . . . . . . . . . . . . . . . . . . . . . . . . . 1474.8 Appendix A: Identified PMMA Models . . . . . . . . . . . . . . . . . 152
4.8.1 Dynamic Model (Subspace Identification) . . . . . . . . . . . . 1524.8.2 Quality Model . . . . . . . . . . . . . . . . . . . . . . . . . . . 152
4.9 Appendix B: Tuning Parameters for Benchmark Control . . . . . . . 1544.9.1 PI . . . . . . . . . . . . . . . . . . . . . . . . . . . . . . . . . 1544.9.2 LVMPC . . . . . . . . . . . . . . . . . . . . . . . . . . . . . . 154
5 Data-driven Modeling and Quality Control of Variable-duration BatchProcesses with Discrete Inputs 1555.1 Introduction . . . . . . . . . . . . . . . . . . . . . . . . . . . . . . . . 1585.2 Preliminaries . . . . . . . . . . . . . . . . . . . . . . . . . . . . . . . 162
5.2.1 Class of processes . . . . . . . . . . . . . . . . . . . . . . . . . 1625.2.2 Subspace identification . . . . . . . . . . . . . . . . . . . . . . 165
5.3 Proposed Model Structure . . . . . . . . . . . . . . . . . . . . . . . . 1685.3.1 Observer . . . . . . . . . . . . . . . . . . . . . . . . . . . . . . 169
5.4 Model Identification . . . . . . . . . . . . . . . . . . . . . . . . . . . 1715.4.1 Dynamic model using subspace identification . . . . . . . . . . 1725.4.2 Identification of discrete input model . . . . . . . . . . . . . . 1775.4.3 Identification of initial state model . . . . . . . . . . . . . . . 1815.4.4 Identification of quality model . . . . . . . . . . . . . . . . . . 182
x

5.5 VD-SQMPC . . . . . . . . . . . . . . . . . . . . . . . . . . . . . . . . 1835.5.1 Inner MPC: fixed batch duration . . . . . . . . . . . . . . . . 1845.5.2 Outer MPC: selecting duration . . . . . . . . . . . . . . . . . 1885.5.3 Batch Termination . . . . . . . . . . . . . . . . . . . . . . . . 1915.5.4 Additional features and implementation . . . . . . . . . . . . 193
5.6 Simulation study . . . . . . . . . . . . . . . . . . . . . . . . . . . . . 1995.6.1 Overview of PMMA process . . . . . . . . . . . . . . . . . . . 1995.6.2 Existing PI Control . . . . . . . . . . . . . . . . . . . . . . . . 2015.6.3 Training data generation . . . . . . . . . . . . . . . . . . . . . 2035.6.4 Model training and validation . . . . . . . . . . . . . . . . . . 2055.6.5 Tuning . . . . . . . . . . . . . . . . . . . . . . . . . . . . . . . 2135.6.6 Closed loop results . . . . . . . . . . . . . . . . . . . . . . . . 2155.6.7 Case Two: Set-Point Change . . . . . . . . . . . . . . . . . . 221
5.7 Conclusions . . . . . . . . . . . . . . . . . . . . . . . . . . . . . . . . 223Bibliography . . . . . . . . . . . . . . . . . . . . . . . . . . . . . . . . . . 224
6 Conclusions and Future Research Directions 2276.1 Conclusion . . . . . . . . . . . . . . . . . . . . . . . . . . . . . . . . . 2286.2 Future Research . . . . . . . . . . . . . . . . . . . . . . . . . . . . . . 230
6.2.1 Incorporating Additional, Infrequent Measurements . . . . . . 2316.2.2 Better Framework for Adaptive Models . . . . . . . . . . . . . 232
xi

List of Figures
2.1 Process variable trajectories, X . . . . . . . . . . . . . . . . . . . . . 222.2 Quality data, Q . . . . . . . . . . . . . . . . . . . . . . . . . . . . . . 222.3 Initial conditions, Z0 . . . . . . . . . . . . . . . . . . . . . . . . . . . 222.4 Rearrangement of the batch data in Figure 2.3 to form the regressor
matrix for identifying the quality model in Equation 2.2 . . . . . . . . 232.5 Schematic of how the multi-model approach is used with the inferential
quality model to predict the future (unknown) output trajectories . . 322.6 References trajectories . . . . . . . . . . . . . . . . . . . . . . . . . . 372.7 Representative input trajectories for the identification (ident.) batches
along with the nominal (nom.) input trajectories . . . . . . . . . . . 372.8 Trajectories used during database generation . . . . . . . . . . . . . . 372.9 Comparison of the predicted quality by the inferential PLS based data-
driven model with the nonlinear (first-principles simulation) model . . 392.10 Comparison of the predicted (measurable process) variables by the
data-driven model with the nonlinear model for a random validationbatch . . . . . . . . . . . . . . . . . . . . . . . . . . . . . . . . . . . . 40
2.11 Comparison of the final qualities obtained from trajectory tracking andcorresponding quality-based MPC design for 21 new initial conditions. 42
2.12 Inputs prescribed by the predictive and trajectory tracking controllersfor one of the batches in the closed-loop simulations . . . . . . . . . . 42
3.1 Output Trajectories Predicted By The Multi-Model Dynamic Model(Dashed Lines) Compared To Actual Measured Output Trajectories(Solid Lines) . . . . . . . . . . . . . . . . . . . . . . . . . . . . . . . . 60
3.2 Comparison of qualities predicted using the inferential quality model(using a completed batch trajectory) and the resulting actual quality(where x, Mn, and Mw are conversion, number and weight averagemolecular weight respectively x, Mn, and Mw are the predicted valuesof those same variables) . . . . . . . . . . . . . . . . . . . . . . . . . 60
3.3 Relative error in the molecular weight distribution qualities comparedbetween the proposed model predictive quality control scheme and tra-jectory tracking PI controller . . . . . . . . . . . . . . . . . . . . . . . 68
xii

3.4 Input moves and resulting reactor temperature compared for a typicalbatch under MPQC and PI control . . . . . . . . . . . . . . . . . . . 69
3.5 SPE and T 2 for a typical batch (solid line), SPE and T 2 constraint(dashed line) . . . . . . . . . . . . . . . . . . . . . . . . . . . . . . . 70
4.1 Jacket temperature trajectory for a characteristic closed loop batchunder PI (dotted line), LVMPC (dot-dashed line), and the proposedSQMPC (solid line) . . . . . . . . . . . . . . . . . . . . . . . . . . . . 98
4.2 Measured outputs from a characteristic closed loop batch under PI(dotted line), LVMPC (dot-dashed line), and the proposed SQMPC(solid line) . . . . . . . . . . . . . . . . . . . . . . . . . . . . . . . . . 99
4.3 Histograms of case 1 qualities resulting from 186 batches operated un-der SQMPC, LVMPC, and PI control. . . . . . . . . . . . . . . . . . 100
4.4 Selected representative examples of the three input policies used in thetraining batches: nominal input plus PRBS (dotted line), PI with set-point trajectory shifted by PRBS (dot-dashed line), and traditional PItrajectory tracking (solid line). . . . . . . . . . . . . . . . . . . . . . . 125
4.5 Validation of the dynamic model by comparison of output trajectoryprediction for a validation batch: output corresponding to subspacestates estimated by updating the luenberger observer (solid line), out-puts predicted by the dynamic model from the converged state estimate(dot-dashed line), actual output (dotted line). . . . . . . . . . . . . . 128
4.6 Quality model predictions for 70 validation batches using terminalstate-estimates obtained by updating a Luenberger observer with out-put measurements from the duration of the batch . . . . . . . . . . . 132
4.7 Quality model predictions for the same 70 validation batches as thebase case but using only temperature measurement demonstrating therobustness of the approach to sparse measurements . . . . . . . . . . 134
4.8 Scatter plot comparing the PI qualities (circles), SQMPC qualities forcase 1 (squares) and SQMPC qualiteis for case 2 (triangles) where theset-point for case 1 is the nominal quality (x) and the set-point for case2 is an outiler from historical operation (star) . . . . . . . . . . . . . 144
4.9 Histograms of case 2 qualities resulting from 186 batches operated un-der SQMPC, LVMPC, and PI control. . . . . . . . . . . . . . . . . . 145
5.1 Flow diagram of timing of the proposed MPC scheme . . . . . . . . . 1945.2 Time line of implementation features that improve the ability of the
proposed controller to obtain desired quality . . . . . . . . . . . . . . 1985.3 Representative PI trajectory tracking response. Nominal set-point
(dotted line), set-point aligned on density (dashed line), response (solidline) . . . . . . . . . . . . . . . . . . . . . . . . . . . . . . . . . . . . 202
5.4 7 identification input signals (3 PRBS (solid line) and 4 shifted nominal(dash dotted line)) added to the training database . . . . . . . . . . . 204
xiii

5.5 Validation of dynamic and mid batch addition model for predictionbeginning after updating the observer for 50 minutes of outputs. Dot-dashed line is the true output values, solid line is the prediction. . . . 209
5.6 Rows 1 and 2 - Overall validation of the combined models for predic-tions starting 50 minutes and 180 minutes after the beginning of thebatch. Row 3 - Validation of the quality model for ’true’ terminal state.(Note: points on the diagonal represent perfect predictions) . . . . . . 212
5.7 Comparison of 20 random tunings for the proposed controller applied to10 representative batches. Plotted points are mean absolute percentageerrors (MAPE) for all three qualities and all 10 batches. Error barsshow the maximum and minimum observed absolute percentage errorsover the 10 batches and 3 qualities. Similarly, the dot-dashed line showsthe MAPE for the same batches under PI control and the dashed lineshows the maximum absolute percentage error for PI. . . . . . . . . . 214
5.8 Histograms of relative errors in qualities resulting from PI trajectorytracking and the proposed VD-SQMPC control schemes for the basecase . . . . . . . . . . . . . . . . . . . . . . . . . . . . . . . . . . . . 217
5.9 Scatter plot matrix showing quality set-points for both case studiesand resulting qualities achieved by PI and VD-SQMPC. Note that allthree data sets contain the same initial conditions and quality resultsare achieved purely through continuous and discrete inputs . . . . . . 218
5.10 Representative input trajectories for the base case. . . . . . . . . . . 2195.11 Histogram of monomer added in the base case. . . . . . . . . . . . . . 2205.12 Histograms of batch durations for the base case and the new quality
set-point . . . . . . . . . . . . . . . . . . . . . . . . . . . . . . . . . . 2215.13 Histograms of the qualities resulting from the proposed controller with
a new quality set-point. (The dashed line is the set-point from the basecase.) . . . . . . . . . . . . . . . . . . . . . . . . . . . . . . . . . . . 222
xiv

List of Tables
4.1 Initial batch conditions for PMMA reaction . . . . . . . . . . . . . . 974.2 Summary of training database composition . . . . . . . . . . . . . . . 1234.3 Relative error in controlled qualities for characteristic batch plotted in
figures 4.1 and 4.2 . . . . . . . . . . . . . . . . . . . . . . . . . . . . . 140
5.1 Initial conditions for PMMA simulations . . . . . . . . . . . . . . . . 2005.2 Tuning for benchmark PI trajectory tracking controller . . . . . . . . 2015.3 Composition of batch database for model identification . . . . . . . . 2035.4 Initial state model . . . . . . . . . . . . . . . . . . . . . . . . . . . . 2105.5 Controller tuning used for the closed loop studies. Note that all penal-
ties are rescaled so that presented represent relative weight in the ob-jective function (based on magnitude of variables they penalize) . . . 215
5.6 Mean absolute percentage error (MAPE) in qualities resulting from PIand the proposed VD-SQMPC control schemes . . . . . . . . . . . . . 218
xv

Chapter 1
Introduction
1

Ph.D. Thesis - Brandon Corbett McMaster University - Chemical Engineering
From a broad, historical perspective, chemical engineering is a discipline concerned
with adaptation of chemical procedures, developed at a small scale, to large-scale,
industrial production. Traditionally, focusing on scale-up meant moving batch-wise
lab-scale techniques to higher capacity continuous flow systems. However, a more
recent trend in chemical industries has been a focus on high-value specialty chemical
products. This broad class of products, ranging from pharmaceuticals to high-end
polymers, share the common trait that value is derived from producing relatively low
volumes of high-quality, on-spec product.
The paramount importance of quality in specialty chemical products necessitates
a reconsideration of traditional chemical engineering approaches. Specifically, high-
volume continuous flow systems are not necessary in these low-volume processes.
Furthermore, continuous flow systems introduce problems isolating off-spec product.
In some cases, off-spec product can be mitigated by downstream blending, however
for high end products blending solutions may not be acceptable. As an alternative,
specialty chemical products are produced in industrial batch reactors where off-spec
batches can be easily isolated. However, given the high-value nature of specialty prod-
ucts, substantial economic gains can be achieved by reducing or eliminating off-spec
batches. To that end, this work concerns development of direct batch quality control
methods by adapting well-studied continuous flow modeling and control techniques.
This introductory chapter provides a birds-eye-view motivation for batch control
and a general overview of the contributions made by this work. The purpose of
2

Ph.D. Thesis - Brandon Corbett McMaster University - Chemical Engineering
this chapter is to serve as a road-map for the contributions herein. With that in
mind, and in an effort to avoid repetition, detailed literature reviews of existing batch
control solutions are relegated to the introductory remarks of each chapter (as they
are relevant to the contributions in those chapters).
A wide variety of batch configurations are used in different industries. In the
course of studies herein, examples as small as a few milliliters, in the case of a protein
PEGylation process, and as large as tens of tons, in the case of a stainless-steel
reactor, were observed. However, all batch processes are characterized by a few key
steps: first, the reactor is initialized with a charge of initial ingredients according to
a specified recipe. Next, a transient (often transforming) process is carried out over a
finite duration of time. Finally, the contents of the reactor are discharged, the reactor
is cleaned, and the process is repeated for a new batch. The transient operation
of these processes is in contrast to continuous flow processes that operate around a
steady-state condition. It this key difference, namely the lack of a steady-state and
the fact that the objective is not necessarily to reach a steady-state, that necessitates
the study of batch control.
Traditionally in process control, the objective is to stabilize operations around a
steady-state operating condition. For batch processes, the lack of a steady-state neces-
sitates a new objective. Fundamentally, this control objective is to reach the desired
product-quality at the end of the batch. However, in practice, this objective of direct
quality control is fraught with a number of difficulties. These include lack of online
3

Ph.D. Thesis - Brandon Corbett McMaster University - Chemical Engineering
quality measurement, limited process inputs, poor process knowledge, and dynamic
issues arising from the large range of operating conditions exposed by these transient
processes. To overcome some of these difficulties, previous batch control approaches
settled for simplified control objectives such as tracking measurable variables. These
simplified approaches are discussed, as they are relevant, in the introduction section
of each following chapter to motivate the contributions therein. However, to address
direct quality control, these difficulties must be understood more explicitly.
A key challenge in batch control is that process inputs are often limited. In this
work, we consider inputs to be anything that can influence the evolution of the pro-
cess. In the context of discretely sampled (digital) control, these inputs can be broadly
categorized into continuous and discrete inputs. In this context, we define continuous
inputs as independently manipulated variables that influence the process evolution
through dynamics. A common continuous input is a heating/cooling jacket that con-
tinuously adds or removes heat from the reaction media. Conversely, discrete inputs
are are independently manipulated variables that occur at one or more instances
through out the batch and cause a discontinuity in process state. An example of this
second type of input is an ingredient addition made some time during the batch.
In general, product quality variables are not available online. These variables,
such as molecular weight distributions for polymerization reactors, are often difficult
to measure because of the often complex chemical nature of specialty chemicals. In
most cases, these measurements become available only after off-line analysis. Online
4

Ph.D. Thesis - Brandon Corbett McMaster University - Chemical Engineering
measurements are typically limited to easily measurable variables such as tempera-
tures, pressures, and volumes. As a result, direct quality control can only be achieved
by inferring the relationship between these measurable variables and the correspond-
ing product quality.
Another source of difficulty for direct quality control of batch processes is that
there is often a lack of first principles knowledge about these processes. Given the
complex nature of specialty chemicals, the reaction mechanisms used to make them
are often poorly understood. Even in cases where decent first-principles knowledge
of reactions is available, carrying out the designed experiments necessary to uniquely
identify parameters for a reliable first-principles model is usually prohibitively expen-
sive. This is especially true considering the wide range of operating conditions over
which such a model would need to be valid to be applied for a transient batch reactor.
Previous contributions to solve the challenges discussed above focused on the use of
latent variable approaches. These contributions used statistical, time-indexed models
to describe variance in process measurements and provide input movement policies.
Further discussion of these latent variable approaches is presented in the subsequent
chapters of this thesis. (Particularly see Chapter 4 which devotes an entire section to a
detailed analysis of one latent variable modeling and control approach.) While these
methods have been proven successful through a number of industrial applications,
their time dependence limits their performance in some key situations.
The challenges for direct quality control discussed above motivate the key objec-
5

Ph.D. Thesis - Brandon Corbett McMaster University - Chemical Engineering
tives of the work presented in this thesis. This objective can be phrased concisely as
follow: to develop data-driven modeling and control methods capable of using avail-
able online measurements and inputs to reject disturbances and drive batch processes
to a desired quality set-point. This thesis presents two novel approaches to address
this objective. These two approaches are developed and discussed over the next four
chapters, each of which contains a journal paper published on the subject. The re-
mainder of this introduction provides a brief overview of each of these chapters and
discusses their novel contributions.
The first manuscript included in this work, in chapter 2, addresses a fundamental
problem with state-of-the-art latent variable approaches. These approaches use pro-
jection to latent spaces (PLS) models to relate process measurements to batch quality.
To do this, measurements from the entire duration of a batch are concatenated into a
single vector and subsequently multiplied by appropriate time-varying coefficients to
achieve quality predictions. Apply these PLS models in a batch control framework re-
quires quality predictions to be made before measurements from the end of the batch
become available. In this contribution, the problem is addressed by using a previously
developed multiple-model dynamic modeling approach to make predictions of the fu-
ture process measurements based on the candidate input trajectory. This method
provides a causal way to relate candidate input trajectories to output measurements
and, through the inferential PLS model, quality variables. The approach is particu-
larly impactful early in batches when alternative missing-data methods are likely to
6

Ph.D. Thesis - Brandon Corbett McMaster University - Chemical Engineering
be inaccurate or fail completely.
Chapter 3 extends the results from the preceding chapter by applying the methods
discussed in that work to a polymethyl methacrylate (PMMA) polymerization reactor.
Note that the PMMA simulation model adapted in this paper provided a good test
bed for all of the subsequent contributions in this thesis. In addition to validating
the approach with a second simulation example, this work adds two contributions:
first, the work demonstrates the ability of the approach to efficiently use limited
available inputs. Second, the work demonstrates how the model validity constraints
can be applied to the control problem to improve controller performance by preventing
extrapolation. Furthermore, the work demonstrates a rudimentary model adaptation
method by which model validity constraints can be loosened with each closed-loop
batch.
In Chapter 4 a completely novel approach to batch quality control is presented.
The motivation for this approach came from analyzing batch processes from a dy-
namic, state-space based perspective. Fundamental to this perspective is the idea that
there is an underlying process state that completely captures the instantaneous condi-
tion of the process. Driven by this understanding, a time-invariant, state-space based
batch modeling methodology was pursued. The solution was achieved by adapting
subspace identification methods, developed for systems operated around steady-state
operating points, for use with transient batch processes. This work, demonstrates
that these subspace methods can be used to identify time-invariant state-space mod-
7

Ph.D. Thesis - Brandon Corbett McMaster University - Chemical Engineering
els from batch input and output data. Furthermore, it is demonstrated that quality
can be predicted from the resulting identified states. One of the most powerful re-
sults afforded by the time-independence of this approach is the ability to use training
batches of varying duration without the need for alignment. In addition to mod-
eling contributions, this work also proposed a novel direct quality control method.
Specifically, the models identified in this work were applied in a receding horizon
MPC scheme. Closed loop simulation results for the PMMA process demonstrate the
efficacy of the approach for online quality control.
The final chapter of contributions, Chapter 5, extends results from the preced-
ing chapter. This paper provides two substantial new contributions to the work
that expand its industrial applicability. The first major contribution is to provide
a framework, in both the modeling and control steps, for handling discrete inputs.
Appropriately handling these discrete influences, which are common industrially, rep-
resents one of the greatest challenges in batch control. To demonstrate this capability,
the nominal batch recipe for the PMMA process is modified to include an addition
of monomer half-way through the batch duration. The proposed controller is able to
adjust the amount of monomer added for improved quality control.
In addition to handling discrete (instantaneous) inputs, the second major con-
tribution in Chapter 5 is inclusion of batch duration as a decision variable in the
control scheme. Fundamentally, batch duration has an important impact on product
quality. However, it is difficult to appropriately account for batch duration in con-
8

Ph.D. Thesis - Brandon Corbett McMaster University - Chemical Engineering
trol approaches using time-varying quality models. As such, the proposed method is
one of the first literature contributions to consider batch duration as a decision vari-
able in data-driven batch control. Simulation results for the PMMA process clearly
demonstrate the powerful impact of allowing variable duration on improving quality
control.
The last chapter of this thesis draws a few brief conclusions from the contributions
of this work and proposes a few areas for further research. Many of the suggestions
in this chapter draw on planned collaborative postdoctoral work with the preeminent
batch control company, ProSensus.
9

Chapter 2
Data-driven model predictivequality control of batch processes
10

Ph.D. Thesis - Brandon Corbett McMaster University - Chemical Engineering
Manuscript Overview
This chapter presets a novel method for dealing with the so-called missing data prob-
lem that arises when using PLS models for batch quality control. This missing data
problem stems from the need for complete batch measurement trajectories to make
quality predictions. The key idea in the work is to make predictions of these mea-
surement trajectories using a previously developed, data-based, multi-model dynamic
modeling approach.
This work was completed in collaboration with another Ph.D. student, Siam Aumi
(now Dr. Aumi). In his studies, Dr. Aumi developed the multi-model dynamic
modeling methods used in this work. As such, my principal contribution to this
paper was in implementation of the quality modeling and the overall closed loop
quality control. (Specific details of the quality aspect are discussed in sections: 2.2.2,
2.2.3, 2.3, 2.4.2, and 2.4.3.) The paper is included in this thesis to showcase my
work on the quality control aspect of the problem. It also provides background and
motivation for subsequent manuscripts of which I was the principal investigator.
11

Ph.D. Thesis - Brandon Corbett McMaster University - Chemical Engineering
Data-driven Model Predictive Quality Control ofBatch Processes
Siam Aumi, Brandon Corbett, Tracy Clarke-Pringle, and PrashantMhaskar
Originally published: August, 2013, in AIChE Journal ; DOI: 10.1002/aic.14063
Abstract
This work considers the problem of driving a batch process to a specified product
quality using data-driven model predictive control (MPC). To address the problem of
unavailability of online quality measurements, an inferential quality model, which
relates the process conditions over the entire batch duration to the final quality,
is required. The accuracy of this type of quality model, however, is sensitive to
the prediction of the future batch behavior until batch termination. In this work,
we handle this “missing data” problem by integrating a previously developed data-
driven modeling methodology, which combines multiple local linear models with an
appropriate weighting function to describe nonlinearities, with the inferential model in
a MPC framework. The key feature of this approach is that the causality and nonlinear
relationships between the future inputs and outputs are accounted for in predicting
the final quality and computing the manipulated input trajectory. The efficacy of
the proposed predictive control design is illustrated via closed-loop simulations of a
nylon-6,6 batch polymerization process with limited measurements.
12

Ph.D. Thesis - Brandon Corbett McMaster University - Chemical Engineering
2.1 Introduction
Batch processes constitute a class of processes that play an important role in the
production and processing of a wide range of value-added products (i.e., chemical,
pharmaceuticals, bio-chemicals, etc.). They are finite duration processes with unique
characteristics, such as the absence of steady-state operating points and nonlinear
and time-varying dynamics over a wide range of operating conditions, that preclude
the direct application of control strategies designed for continuous systems. Unlike
continuous systems, which are characterized by control at an steady-state operating
point, the primary control objective in batch processes is to reach a specified prod-
uct quality by batch termination. The economic benefits from batch processing are
realized from the consistent production of on-spec product. Direct control to the
specified quality, however, is impractical in most cases because quality measurements
are unavailable online and only made offline after batch completion.
In the past, batch-to-batch operation policy consisted of charging the reactor with
a recipe and then implementing predetermined input trajectories. These trajectories
were either optimized offline, determined through data-mining, or historically yielded
on-spec product. This type of open-loop operation policy, however, negatively im-
pacted the reproducibility of quality since it was susceptible to disturbances encoun-
tered during the process and in the initial conditions (i.e., raw material impurities).
Motivated by the increased demands of consistent production of high quality prod-
ucts, numerous batch-to-batch (offline) and within-batch (online) control strategies
13

Ph.D. Thesis - Brandon Corbett McMaster University - Chemical Engineering
were adopted.
The idea behind batch-to-batch control is to refine the batch recipe and operat-
ing trajectories for the upcoming batch using past data in an attempt to bring the
new batch’s quality closer to the specified value [1]. Batch-to-batch control strategies
range from updating the model parameters and then re-computing the batch input
trajectories (and/or batch recipe) to directly updating the process variable trajecto-
ries using an optimization-based algorithm[2] or the iterative learning control (ILC)
framework[3, 4]. The former drives the process towards a specified optimum batch-
wise while the latter exploits the repetitive nature of batch systems by using the error
in the final quality from the last batch to update the process variable trajectories
and/or initial conditions.
Batch-to-batch control represents an entirely offline strategy and lacks any real-
time feedback mechanism for rejecting disturbances encountered during batch evolu-
tion, motivating the use of real-time, within-batch control approaches. The within-
batch quality control problem has been investigated extensively in the literature with
many studies assuming availability of a detailed, first-principles process model[5, 6].
However, in instances where the development and maintenance of an accurate first-
principles model may not be possible, control designs need to rely on empirical or
data-driven modeling. Data-driven modeling methods are particularly well-suited for
batch systems because they can exploit existing batch databases and also provide an
opportunity to update the model following the completion of each batch. Note that
14

Ph.D. Thesis - Brandon Corbett McMaster University - Chemical Engineering
because continuous processes are operated around steady-states and narrower oper-
ating ranges, there is little useful information for identifying data-based models from
typical operation. Instead, the process must be excited in some fashion to collect
meaningful identification data. In contrast, due to the inherent process nonlinear-
ity and moving setpoint, databases of batch processes are comprised of trajectories
of online measurements of the key process variables from previous batches and con-
tain important information about the process states, allowing a reliable model to be
identified.
Within-batch control approaches can be broadly divided into trajectory tracking
and inferential quality control approaches. Trajectory tracking is utilized where there
is expected to be very little variance in the initial conditions for the batch, and hence
reference trajectories for the measurable process variables (such as temperatures and
pressures) can be tracked to reliably meet the specified quality. Tracking is achieved
using classical control designs [7] or advanced control designs, such as differential
geometric[8, 9] or predictive[10, 11, 12, 13, 14, 15, 16, 17] controllers, which are ca-
pable of compensating for the effects of nonlinearity and tracking set-points over a
wide operating range. While trajectory tracking controllers can reject disturbances
online, even with perfect tracking, there is no guarantee that the desired quality will
be met if there is significant variation in the initial conditions from batch to batch.
This is because disturbances encountered during the new batch could alter the re-
lationship between the product quality and the trajectories of the process variables.
15

Ph.D. Thesis - Brandon Corbett McMaster University - Chemical Engineering
Thus, implementing the same reference trajectories batch-to-batch is not guaranteed
to consistently produce on-spec product.
Inferential quality control refers to the control approach aimed at controlling qual-
ity directly, and is most commonly achieved through multivariate statistical process
control (SPC) approaches, particularly those utilizing latent variable tools, such as
principal component analysis (PCA) or partial least squares (PLS) regression [18].
For batch processes, the model development for the majority of SPC applications be-
gins with the so-called “batch-wise” unfolding of multiway batch data [19, 20]. The
unfolded data are regressed (commonly via PLS regression) onto a matrix of final
quality measurements to obtain an inferential PLS quality model[21] that is usable
for predicting the final quality prior to batch completion. For batches with multi-
ple phases or stages with distinct dynamics, multiple phase-specific (and transition)
models can also be constructed[22, 23]. During the batch evolution, the final quality
can be predicted (at every sampling instant or predetermined decision points) and if
the prediction exceeds the control limits, appropriate remedial action can be taken to
correct the batch. The nature of the corrective action may be heuristics or knowledge
based or more systematic wherein the quality model is inverted (one way or another)
to directly compute the future input trajectories that recover the batch. The latter ap-
proach has been classified as a mid-course correction (MCC) control strategy[24, 25].
Since it requires model inversion, the effectiveness of a MCC approach is particularly
dependent on the underlying quality model and in general, demands richer training
16

Ph.D. Thesis - Brandon Corbett McMaster University - Chemical Engineering
data that spans a wider operating range and exhibits more input variation compared
to modeling for SPC[26].
An important issue that arises in SPC and MCC approaches is that future online
measurements that are required to predict the quality are incomplete. More specif-
ically, the data arrangement in the model building process calls for the entire batch
trajectory to predict the quality of the batch. However, during a batch, measurements
are only available up to the current sampling instant, and the future data are required
to predict the final quality. In the literature, this has so far been treated as a ‘missing
data’ problem, with the choice of the data completion technique playing a key role in
the overall performance of the control design. Prediction error in the future data are
propagated to the quality prediction error, and both of these errors add uncertainty to
any control action computed using the model. This problem is particularly prevalent
during the early stages of the batch when most of the information is unknown. In
fact, with poor prediction of the future batch behavior, inputs determined from using
the model can drive the batch to a point from where good quality product cannot
be produced. This characteristic is typical of methods that lack a causal relationship
between the inputs and the process trajectory, and in turn, the quality, which leads
to the treatment of the future trajectory as a ‘missing data’ problem[24].
A variety of ad-hoc approaches exist to handle this ‘missing data’ problem. Many
methods utilize missing data algorithms available for latent variable methods. These
missing data algorithms work on the assumption that the correlation structure be-
17

Ph.D. Thesis - Brandon Corbett McMaster University - Chemical Engineering
tween the collected measurements and future measurements for the new batch is the
same as in the training data. Another approach has been to build a finite set of quality
models at predetermined decision points (possibly at every sampling instant), and in
building each model, rather than using the entire batch trajectory, data only up to the
decision point is used [27, 26]. This idea of an evolving model has also been modified
for improving the quality prediction in multi-stage batches through consideration of
critical-to-quality time periods at specific phases of the batch [28, 29]. One issue with
these multi-model based approaches, however, is that quality models developed at
early time points may be highly inaccurate since they will not capture the effects of
large periods of the batch duration towards the batch quality. While these missing
data approaches are useful for predicting the quality and monitoring applications,
when the inferential model is used in a control design, the need to consider the non-
linear casual relationship between the future input-output behavior is obvious. The
quality control problem, therefore stands to gain from the use of a causal, nonlinear
model that does not treat the future trajectory as a missing data problem and in-
stead recognizes it as the problem of choosing the remaining input trajectory, which
determines the rest of the measured variables trajectory and in turn the final quality.
Motivated by the above considerations, in this work we develop a within-batch
quality control strategy for batch processes that unites a single PLS inferential quality
model with a previously developed nonlinear, data-driven modeling approach. By
properly representing the future behavior using a dynamic model, control inputs can
18

Ph.D. Thesis - Brandon Corbett McMaster University - Chemical Engineering
be chosen that result in improved quality control. The rest of this manuscript is
organized as follows: first, we describe the class of processes being considered and
review the key concepts, namely the different modeling approaches used in the control
design. Next, we present the details of a predictive controller that is designed to drive
a batch process to a desired specified product quality by batch termination. The
efficacy of the control design is then demonstrated via simulations of a nylon-6,6
batch polymerization system. Finally, we summarize our results.
2.2 Preliminaries
In this section, we first describe the class of batch processes considered. Next, we
discuss how an inferential quality model can be identified from existing batch data
through multiway analysis. This is followed by an overview of partial least squares
(PLS) regression, a latent variable technique used to compute the inferential quality
model parameters. Finally, we review a previously developed data-based modeling
approach[30, 31] that serves as the basis for predicting the future state trajectory (for
a candidate input profile) when using the inferential quality model for quality control.
19

Ph.D. Thesis - Brandon Corbett McMaster University - Chemical Engineering
2.2.1 Process Description
We consider batch processes subject to input constraints and limited measurements
described by:
x = f(x,u)
y = g(x,u) + v
q = h(x,u)
t ∈ [t0, tf ],u(·) ∈ U ,x(t0) = x0
(2.1)
Note that the above model is used only to illustrate the class of processes that the
proposed modeling approach is expected to work, and the proposed approach does
not require a model of the form of Eq. 2.1 to be available. The times, t = t0 and
t = tf , are the initial and termination times, respectively. The vectors, x ∈ Rn,
y ∈ Rp, and q ∈ Rq denote the state variables, measurable process variables, and
quality variables, respectively. Measurements of y are assumed to be available at
every sampling instant whereas the elements of q are only measured once following
batch completion. The vector v ∈ Rp represents zero-mean, normally distributed
measurement noise. The vector u ∈ Rm consists of constrained manipulated inputs,
taking values in a nonempty, convex set, U , {u | umin ≤ u ≤ umax} ⊂ Rm
where umin and umax define the minimum and maximum (respectively) allowable
input values.
20

Ph.D. Thesis - Brandon Corbett McMaster University - Chemical Engineering
2.2.2 Inferential Quality Model
To understand how to build a quality model that can be used during batch evolution to
predict the quality at batch termination, we first describe the nature of data available
in a batch database. Consider a typical batch run in which j = 1, 2, . . . , J = m + p
variables are measured at k = 1, 2, . . . , K sampling instants. For b = 1, 2, . . . B
batches, this data can be organized into a three-dimensional array, X (B × J ×K),
as shown in Figure 2.1.
Each vertical slice in this array, which has dimensions B×J , represents the values
of all the measurable variables for all batches at a common sampling instant. In
addition to X, measurements of q = 1, 2, . . . Q quality variables taken post-batch
can be summarized in a B × Q quality matrix, Q, as shown in Figure 2.2. Finally,
information about the initial conditions for each batch is also typically available (i.e.,
feed-stock properties, measured raw material properties and compositions, charges of
each ingredient, etc.), and this can be summarized in a B×M matrix, Z0, (see Figure
2.3) where M is the number of known variables related to the initial conditions.
To identify an inferential quality model that can be used to predict the batch
quality, the three-dimensional array, X, is first transformed into a two-dimensional
B × JK matrix by unfolding it “batch-wise” such that each of its vertical slices is
arranged side-by-side [19, 20] (note that the dynamic model that we use to predict the
batch process dynamics[30] does not require this kind of unfolding). Next, the initial
conditions matrix, Z0, is concatenated to the unfolded matrix, forming a regressor
21

Ph.D. Thesis - Brandon Corbett McMaster University - Chemical Engineering
1 M. . .
Initial measurements
1
B
...
Bat
ches
Figure 2.1: Process variable trajectories, X
1 Q. . .
Quality measurements
1
B
...B
atch
es
Figure 2.2: Quality data, Q
matrix,
[Z0 X
], as shown below in Figure 2.4.
The matrix in Figure 2.4 can be regressed onto the quality data matrix (Figure 2.2)
using linear regression, yielding a model that relates the initial and process conditions
to the quality characteristics as shown below:
Q =
[Z0 X
]Λ (2.2)
1 M. . .
Initial measurements
1
B
...
Bat
ches
Figure 2.3: Initial conditions, Z0
22

Ph.D. Thesis - Brandon Corbett McMaster University - Chemical Engineering
Time 1 · · · Time K
1 M. . .
Initial measurements1 JK. . .
Online measurements
1
B
...B
atch
es
Figure 2.4: Rearrangement of the batch data in Figure 2.3 to form the regressormatrix for identifying the quality model in Equation 2.2
where Q is the predicted quality and Λ is a (M + JK) × Q matrix of the quality
model coefficients. Due to the high dimensionality/multivariate nature of the regres-
sor matrix and the likely presence of correlations among its variables, a latent variable
regression technique, such as partial least squares (PLS) regression or principal com-
ponent regression (PCR), is necessary for appropriately estimating Λ.
Remark 1 An assumption made during the batch-wise unfolding scheme is that all
batches are of equal length and the trajectories are synchronized (a requirement relaxed
in recent results[30], albeit for the purpose of dynamic modeling, not quality models).
In practice, this assumption may not hold for raw batch data. Consequently, several
methods have been proposed for addressing unequal batch lengths and to synchronize
trajectories. The most common method involves choosing a monotonic indicator vari-
able common to all batches, such as conversion, and re-sampling the variables with
respect to this variable instead of time[32]. Additional methods for aligning batch
trajectories include dynamic time-warping [33] and curve registration [34].
23

Ph.D. Thesis - Brandon Corbett McMaster University - Chemical Engineering
2.2.3 Partial Least Squares (PLS) Regression
When variables in the regressor matrix are (auto/cross) correlated, the use of ordi-
nary least squares (OLS) regression leads to parameter estimates with large variances
(due to covariance of the regressor matrix being ill-conditioned). Correlations can re-
sult from data being collected under closed-loop conditions [35] and/or from lagging
the variables. One way to handle the numerical issues arising from correlations is
through partial least squares (PLS) regression. Geometrically, in PLS regression, the
variables in the regressor and response matrices,
[Z0 X
]and Q, are projected onto
corresponding orthogonal subspaces of A-pairs of latent variables. Each pair of latent
variables accounts for a certain percentage of the variance in the original matrices.
Mathematically, PLS regression consists of decomposing
[Z0 X
]and Q as the sum
of the outer products of a score and loading vector:
[Z0 X
]=
A∑a=1
tap′a + E (2.3)
Q =A∑a=1
dar′a + F (2.4)
where ta and da are the input and output scores representing the projections of the
variables in
[Z0 X
]and Q on the subspaces, pa and ra define the orientation of the
corresponding subspaces, and E and F denote residual matrices. Because it is desired
to obtain a useful relationship between the original data matrices, the two matrices
24

Ph.D. Thesis - Brandon Corbett McMaster University - Chemical Engineering
are linked by an inner relation between their scores of the form:
da = bata + ea ∀a ∈ [1, A] (2.5)
where ba are the coefficients of the inner relationship and ea are the residuals. In
PLS algorithms, such as Nonlinear Iterative Partial Least Squares (NIPALS)[18], the
subspace orientation and scores for both matrices are determined simultaneously to
maximize the correlation between
[Z0 X
]and Q and therefore obtain the optimal
fit for the inner relationship. The final result from PLS regression is a linear model
between
[Z0 X
]and Q where the coefficients are functions of the scores and loadings
from the matrix decompositions.
Remark 2 In the PLS model, trajectories of the process variables over the entire
batch duration and initial conditions are projected onto a latent variable subspace,
and the values of the latent variables in this space are related to the scores of the
final quality through the inner relationship. The projection essentially represents an
estimation of the batch states at the end of the batch while the inner relationship is a
“measurement” function relating the states at batch termination to the final quality.
For a new batch, at sampling instant k, process variable trajectories are only available
only up to k. More specifically, the process outputs are available up to sampling instant
k and the inputs are available up to k − 1. As a result, the vector required to make
the state estimation at batch termination is incomplete. There are ways to eliminate
25

Ph.D. Thesis - Brandon Corbett McMaster University - Chemical Engineering
this problem in monitoring applications (e.g., by using multiple models [26], lookup-
tables [36], or a different unfolding scheme [19]); however, when using the model for
control, the prediction of the future behavior for a given input is a necessity. Rather
than eliminating the need for future data, we recognize the causal nature of the inputs
in determining the future trajectory and in turn the quality.
Remark 3 In conventional PLS modeling, a common pre-processing step is to nor-
malize the regressor and response matrices to zero mean and unit variance. Scaling to
unit variance gives each variable equal importance during model identification; how-
ever, in many batch systems, there are specific periods during the batch that are known
(ie operator knowledge) to play a more critical role in determining the final quality
than others. A simple way to account for these quality-critical periods within the PLS
regression framework is to multiply the appropriate columns in the regressor matrix by
weighting factors that make them more influential during the computation of the model
parameters (and therefore during quality prediction). More formalized approaches for
considering time-specific effects are also available[27, 28].
2.2.4 Multi-model Data-driven Modeling for Batch Systems
In this section, we review a multi-model, data-driven modeling approach that is used
for predicting the future output behavior when using the inferential quality model
[30, 31]. Mathematically, the model for the process outputs takes the form of a
26

Ph.D. Thesis - Brandon Corbett McMaster University - Chemical Engineering
weighted combination of L linear dynamic models as shown below in Equation 2.7.
y(k) =L∑`=1
w`(k)β`x(k) (2.6)
=L∑`=1
w`(k)β`
[y′(k − 1) · · · y′(k − ny) · · · u′(k − 1) · · · u′(k − nu)
]′(2.7)
where w`(k) is model `’s weight at sampling instant, k, β` defines the `-th local model,
and x(k) is a vector of lagged inputs and outputs. The scalars, ny and nu, denote the
number of lags in the outputs and inputs (respectively). For notational simplicity, we
have assumed the same number of lags, ny and nu, for each output and input variable
(respectively) and the same lag structure for all L models. These assumptions can be
readily relaxed.
Using the following definitions,
β ,
[β1 · · · β` · · · βL
]h(k) ,
[w1(k)x′(k) · · · w`(k)x′(k) · · · wL(k)x′(k)
]′
Equation 2.7 can be re-written in the vector form:
y(k) = βh(k) (2.8)
The model identification procedure consists of an initial clustering step followed
27

Ph.D. Thesis - Brandon Corbett McMaster University - Chemical Engineering
by solving a linear regression problem. In the first step, for a given lag structure, a
matrix, X, corresponding to x(k), is generated by sorting the plant data sample-wise
(not time or critical variable wise, as is done in existing batch modeling approaches)
and then, x (or its equivalent latent variable space[30]) is clustered into L clusters
using an appropriate clustering technique. Thus, observations of lagged inputs and
outputs are clustered together, and, to illustrate our results, in this work we use
fuzzy c-means clustering. In fuzzy c-means clustering, points that are mathematically
“similar” according to the Euclidean 2-norm are clustered into overlapping spherical
clusters with corresponding center points [37]. Each cluster represents a region in the
X space where an associated model has the highest degree of validity, and in this way,
the cluster’s center point represents the linearization point of its associated model.
Using the results of the clustering step (the cluster center points), the weights, w`(·),
for the training data can be computed prior to the model coefficients (to be discussed
shortly). Consequently, the h(k) vector in Equation 2.8 is completely specified for the
training data. Thus, a regressor matrix corresponding to h(k) can be constructed,
and the local linear models, β, are computable using linear regression.
Intuitively, from Equation 2.1, the model weights, w`(·), should depend on the
current values of the states and inputs since they define the system dynamics through
f(·). In other words, the local models should be weighted according to the current
process conditions. In the absence of state measurements, the vector of lagged outputs
and inputs, x(k), can be used to infer the current process conditions, and each model’s
28

Ph.D. Thesis - Brandon Corbett McMaster University - Chemical Engineering
weight can be assigned based on the proximity of the operating conditions to its
center point. For instance, denoting model `’s center point as c`, its weight should be
inversely proportional to the squared distance between x(k) and c`:
w`(k) ∝ ‖x(k)− c`‖−2
Normalizing this expression over all clusters yields the following normalized weighting
function:
w`(k) =‖x(k)− c`‖−2∑Li=1 ‖x(k)− ci‖−2
The number of clusters is an important parameter in this approach. Well-defined
criteria (based on the cluster geometry) to iteratively refine the number of clusters are
available[38]. Additionally, to evaluate the goodness of the final fuzzy partitions, many
validation measures have also been proposed with the most popular being the Xie-Beni
index [39], which is a ratio of the total within-cluster variance to the separation of the
cluster centers (and therefore should be minimal for the best partition). In this work,
we picked the number of clusters (iteratively) based on how well an independent
validation data set was predicted. Thus, there was a balancing of the number of
clusters and prediction error.
29

Ph.D. Thesis - Brandon Corbett McMaster University - Chemical Engineering
2.3 Model Predictive Quality Control
In this section, the data-driven modeling approach reviewed in the previous subsection
is used in conjunction with an inferential quality model in a MPC design. The quality
model captures the (time-cumulative) effects of the entire batch trajectory on the final
quality while the multiple linear models for the measurable process variables take the
causality and nonlinear relationship between the inputs and outputs into account. The
benefit from this approach is the ability to account for the direct connection between
the control action and the quality, something that is both expected and desired.
Given a batch database, consider the case where the quality and process variable
models have been identified. The following MPC optimization problem is solved to
compute the control action with the objective of achieving a desired product quality,
qdes.
minu(k)∈U
(q − qdes)′Ψ (q − qdes) +
K∑i=k
∆u′(i)Φ∆u(i) (2.9)
s.t.: y(k) = y(t) (2.10)
y(k) =L∑`=1
w`(k)β`x(k) (2.11)
x′future =
[u′(k) y′(k + 1) u′(k + 1) · · · u′(K − 1) y′(K)
]′(2.12)
q =
[xpast xfuture
]Λ (2.13)
In this optimization problem, the objective function consists of a term for minimizing
30

Ph.D. Thesis - Brandon Corbett McMaster University - Chemical Engineering
the discrepancy between the target product quality and the predicted quality, q, and
a move suppression factor. Each term’s relative importance is traded-off using the
positive-definite weighting matrices, Ψ and Φ. Equation 2.10 is the MPC initial-
ization at the current plant conditions and Equation 2.11 represents the prediction
of the future process variables using the data-driven model (given the current input
trajectory in the optimizer). The predicted process outputs and optimizer inputs are
stored appropriately in the row vector, xfuture, through Equation 2.12. This vector is
concatenated with a vector of previous plant outputs and implemented inputs, xpast.
Note that the vector, xpast, is known prior to solving the MPC optimization prob-
lem; specifically, x′past =
[z′(0) y′(0) u′(0) · · · y′(k)
]′where z′(0) denotes all
the information known prior to starting the batch (i.e., the initial conditions). The
concatenated vector,
[xpast xfuture
], is used to predict the quality through Equation
2.13.
The way the multi-model approach is integrated with the inferential quality model
is illustrated in Figure 2.5. At sampling instance k, the vector required to predict the
quality is incomplete; the inputs and outputs beyond k are unknown. However, when
the model is embedded in the MPC optimization problem (wherein the prediction
horizon extends to the end of the batch), a candidate input trajectory exists in the
optimizer that can be used to predict the future outputs up to batch termination. In
our work, we use the multi-model approach to predict these future outputs. For a
candidate input trajectory, the final product quality can be thus predicted, allowing
31

Ph.D. Thesis - Brandon Corbett McMaster University - Chemical Engineering
q = z′(0) y′(0) u′(0) · · · y′(k) u′(k) y′(k + 1) u′(k + 1) · · · u′(K − 1) y′(K)
Known information at k
Unknown information at k:y(k + 1) · · · y(K) predicted using the multi-
model approach given u(k) · · · u(K − 1)
ΛVector required to predict the quality
Figure 2.5: Schematic of how the multi-model approach is used with the inferentialquality model to predict the future (unknown) output trajectories
direct control to a desired quality.
Remark 4 A distinguishing feature of this MPC design includes the use of a causal
(and effectively nonlinear) model for predicting the future observations expected if a
particular candidate input trajectory is implemented. The majority of control designs
that have utilized a multivariate, PLS-based inferential quality model instead treat this
as a missing data problem. Based on the data collected up to the current sampling
instant, these algorithms essentially invert the linear, PLS model such that the future
behavior maintains the same correlation structure as previous batches. This leads to
an inherent mismatch in the sense that the predicted future behavior is based on past
data (that typically uses existing, PI controllers) which in turn is used to compute
the current control action via a different control algorithm than in the data set. In
contrast, the proposed approach recognizes that the problem is not that of missing data,
because the future trajectories depend on state and input trajectories up to the current
point as well as future input moves. The only ’missing’ part therefore is the part that
needs to be computed by the controller - the set of future control moves. By utilizing an
appropriate model (which captures the process nonlinearity) that links the future inputs
32

Ph.D. Thesis - Brandon Corbett McMaster University - Chemical Engineering
to the future process outputs and in turn to the quality, the controller then computes
the set of input moves that would yield the desired quality. The problem of unequal
batch lengths can also be readily handled by the proposed quality prediction approach by
virtue of using a dedicated (nonlinear) model for predicting the future batch behavior.
In particular, all the batch data can be used to build the dynamic model, while the
quality model can be built using a common time from the end of batch for all batches
(i.e., using the batch time of the shortest batch, if not significantly shorter than the
other batches).
Remark 5 Other control designs have tried to eliminate the missing data problem
completely through evolving quality models (at each sampling instant or a selected
number of pre-determined decision points), which utilize measurements only up to a
given time. These models are designed to forecast the final quality without the future
batch trajectories and inherently rely on the assumption that the same control action
is implemented for the rest of the batch. Therefore, while such methods may be good
to ‘predict’ the quality under an existing controller, they are not well suited for use in
a control design aimed at computing the control action to yield the desired quality.
Remark 6 The prediction horizon for the MPC optimization problem above must
extend to the end of the batch; thus, the prediction horizon, P = K − k, shrinks at
every sampling instant. During the early stages of the batch when k is low, the MPC
optimization problem may be too computationally demanding for real-time implemen-
tation. Under such circumstances, the optimization problem can be used to update the
33

Ph.D. Thesis - Brandon Corbett McMaster University - Chemical Engineering
reference trajectories for local controllers rather than directly computing the inputs.
Specifically, while the optimization problem is being solved, trajectory tracking con-
trollers can be used to track the nominal reference trajectories, and upon completion
of the optimization problem, the trajectories of the measurable output variables from
the solution can be specified as the updated nominal reference trajectories in the local
trajectory tracking controllers.
2.4 Simulation Results
In this section, we demonstrate the efficacy of the proposed MPC design through
closed-loop simulations of a nylon-6,6 batch polymerization process. First, we give an
overview of the process and state the control objective. Next, we develop data-driven
models for the measurable process variables and product quality from a database gen-
erated using a rigorous first principles model (also used as a test bed for implementa-
tion of the control design). Finally, using these models, we implement the proposed
MPC design and compare its performance against trajectory tracking control.
2.4.1 Process Overview and Control Objective
For this work, we focus on nylon-6,6 production by the amidation of adipic acid and
hexamethylenediamine (HMD) in a batch reactor. The reactor is initially charged with
molten adipic acid and HMD (from an evaporator) in approximately stoichiometric
(1:1) proportions. The polymerization reaction (a polyamidation) is summarized as
34

Ph.D. Thesis - Brandon Corbett McMaster University - Chemical Engineering
follows: Carboxylic end groups (C) on adipic acid or the polymer chain react (re-
versibly) with amine end groups (A) on HMD or the polymer chain, producing a
polymer chain link (L) and a water molecule (W):
Polyamidation: C + A� L + W (2.14)
This polymerization is typically carried out in an autoclave reactor equipped with a
steam jacket for providing the heat needed for vaporization (and reaction) and a valve
for venting vaporized water. The polymerization occurs in three phases: (1) initial
heating phase, (2) boiling phase, and (3) finishing phase. During the initial heating
phase, the vent valve is closed to prevent the loss of volatile HMD and heat is supplied
through the steam jacket, driving the polymerization reaction. After a certain extent
of reaction, the valve is opened, initiating the boiling phase. During this phase, excess
water is removed, which is important for achieving high molecular weight of the final
polymer. After venting water for an appropriate amount of time, the vent is closed,
and the finishing phase begins during which the final quality characteristics of the
polymer are developed.
For our studies, we utilized a mathematical model of this process[40] that takes
the general form shown in Equation 2.1. The reaction model, modeling assumptions,
equations, and parameter values[40] are omitted here for brevity. The state vector is
comprised of the molar amounts of each functional group and evaporated HMD, and
the reaction medium mass and temperature. The states were assumed to be measured
35

Ph.D. Thesis - Brandon Corbett McMaster University - Chemical Engineering
only once at the initial time, but note that many of the states were trivially zero due
to the absence of any reaction. The manipulated inputs were taken to be the steam
jacket pressure, Pj (psi), and vent rate, v (g/h): u =
[Pj v
]′, and the constraints
were defined as follows: umin =
[700 0
]′and umax =
[1.8× 10³ 2.5× 10⁶
]′. All
batches were assumed to be 3 hours, eliminating the requirement for any trajectory
synchronization, with a sampling period of 1 minute.
The measurable process variables were taken to be the reaction mixture temper-
ature, T (K), volume, V (L), and the viscosity, η (cP): y =
[T V η
]′. Note that
in practice, while the viscosity may not be directly measurable at the sampling pe-
riod of 1 minute, stirrer torque measurements are typically available in real time at
every sampling instant. The stirrer torque is strongly correlated with the solution
viscosity with a more viscous polymer resulting in higher torque (for a fixed RPM
stirrer motor). Thus, the torque measurements provide important infomration about
the viscosity evolution.
The product quality of nylon-6,6 polymer is defined by the number average molecu-
lar weight, MW, and the residual amide concentration, RNH2 (mol/g): q =
[MW RNH2
]′.
Both qualities are related to the state variables through highly nonlinear relationships[40].
The control objective considered in this work was to achieve end-point qualties of
qdes =
[5569 136
]′.
36

Ph.D. Thesis - Brandon Corbett McMaster University - Chemical Engineering
Figure 2.6:0 1 2 3
450
500
Time (h)
Tre
f(K
)(
)
1.2
1.4
1.6
1.8
Vre
f·1
03(L
)(
)
Figure 2.7:0 1 2 3
0.8
1
1.2
1.4
1.6
Time (h)
Pj
·103
(psi
)
Nom.Ident.
0 1 2 30
0.5
1
Time (h)
v·1
06(g
/h)
Nom.Ident.
Figure 2.8: Trajectories used during database generation
2.4.2 Inferential Quality and Process Variable Models
To develop data-driven models for the quality and process variables, an artificial batch
database of the form in Figure 2.3 was first generated. To this end, the determin-
istic model was simulated 80 times from different initial conditions (30 batches were
reserved as the validation data set). In generating the database, a set of reference
T and V profiles presented in Figure 2.6 were tracked using Pj and v (respectively)
via two tightly tuned PI controllers. In addition to these closed-loop trajectories,
the database was supplemented with 4 open-loop identification batches. For these
batches, low amplitude, pseudo-random-binary-sequence (PRBS) signals were added
on top of the nominal input trajectories. In Figure 2.7, the input trajectories for one
of these identification batches are shown together with the nominal trajectories (that
correspond to the T and V trajectories in Figure 2.6).
37

Ph.D. Thesis - Brandon Corbett McMaster University - Chemical Engineering
The final database consisted of measurements of the states at the initial time, T ,
V , and η at every sampling instant, and the qualities at batch termination. Prior to
developing the models, the η measurements were replaced by ln (η), in recognition of
the fact that viscosity typically satisfies a power law correlation. Using this database,
an inferential quality model was developed using PLS regression. As discussed in
Remark 3, quality-critical periods during the batch can be given more weight prior
to computing the model parameters. For the nylon-6,6 process, the initial conditions
and process behavior during the boiling and finishing phases are more influential to
the final quality compared to the heating phase; consequently, columns corresponding
to these conditions in the unfolded regressor matrix (see Figure 2.4) were given 6, 2,
and 4 times more weight than the heating phase (respectively).
The motivation behind placing the lowest weight on the heating phase was be-
cause it corresponded to a limited extent of the polymerization compared to the other
phases. The weights for the other phases and initial conditions were found iteratively
and chosen to minimize the root mean squared error (RMSE) in the predicted quali-
ties of the validation batches. Thus, these weights were essentially tuning parameters
in the model. High weights were placed on the initial conditions to compensate for
the fact that they constituted a very small portion of the regressor matrix compared
to the other phases. In Figure 2.9, the qualities predicted by the PLS model for the
30 validation batches are displayed along with the database qualities. The number
of principal components in the PLS model, 24, was selected to minimize the RMSE
38

Ph.D. Thesis - Brandon Corbett McMaster University - Chemical Engineering
1 5 10 15 20 25 30
0.5
1
Validation Batch Number #
MW
·104
NonlinearData-driven
1 5 10 15 20 25 30
100
200
300
Validation Batch Number #
RN
H2
(mol
/g)
NonlinearData-driven
Figure 2.9: Comparison of the predicted quality by the inferential PLS based data-driven model with the nonlinear (first-principles simulation) model
in the predicted qualities of the validation batches. From the discussion in Remark
2, this meant 24 latent variables were required to estimate the states at batch ter-
mination. Note that the total number of columns in the regressor matrix was over
900; thus, 24 latent variables still represent a significant reduction in the dimension-
ality of the process. Additionally, the training data contained 4 identification batches
that expanded the range of typical operating conditions, calling for additional latent
variables. Overall, the inferential quality model predicted the final qualities with
relatively good accuracy.
Next, multiple local linear models of the form described in Section 2.2.4 were
developed for T , V , and ln (η) since these variables must be predicted (for a given input
trajectory) as part of the quality prediction. To cluster the database and compute the
resulting local linear models, the following parameters were required to be specified:
the lag structure (ny and nu) and the number of clusters, L. The model identification
procedure was as follows. For a given lag structure (which sets the dimensions of X),
39

Ph.D. Thesis - Brandon Corbett McMaster University - Chemical Engineering
0 1 2 3
450
500
Time (h)
T(K
)
NonlinearData-driven
0 1 2 3
1.2
1.4
1.6
1.8
Time (h)
V·1
03(L
)
NonlinearData-driven
0 1 2 3
0
5
Time (h)
ln(η
)
NonlinearData-driven
Figure 2.10: Comparison of the predicted (measurable process) variables by the data-driven model with the nonlinear model for a random validation batch
the X matrix was constructed, decomposed using PCA, and clustered for a range of
clusters, L = {1, 2, . . . , 20}. For each cluster choice and a lag structure, a PLS model
was identified. This was repeated for all possible lag structures with a lag range of
0−2 for each variable. The goodness of each fit (and the number of latent variables to
retain in the PLS regression) was judged using its RMSE in predicting the validation
batches. The number of input and output lags were found to be 1 (i.e. ny = nu = 1)
and the number of clusters, L, was 7. One explanation for requiring only one lag
is the assumption of the same lag structure for all the local models (note that this
assumption can be readily relaxed if needed). With this assumption, using all first
order models minimized the possibility of over-fitting, and in this case, yielded the
lowest RMSE values. In Figure 2.10, we compare the output of the nonlinear model
with the model output from the data-driven model for a set of initial conditions
in the validation data set. Overall, the multi-model approach captured the major
nonlinearities and provided relatively reliable predictions.
40

Ph.D. Thesis - Brandon Corbett McMaster University - Chemical Engineering
2.4.3 Closed-loop Simulation Results
Using the models developed in the previous section, in this section, we present the re-
sults from implementing the predictive controller and compare its control performance
against trajectory tracking via PI controllers. For these simulations, we considered 21
new initial conditions that were not in the training or validation data sets. The refer-
ence trajectories for the PI based trajectory tracking simulations were those presented
earlier in Figure 2.6, and the loop-pairings and tunings were kept consistent with the
database generation procedure. In solving the MPC optimization problem, the ini-
tial guess for the input trajectories was set to the nominal trajectories at t = 0 and
the tail of the solution at the previous sampling instant for all subsequent sampling
instants. The computation time (as reported by the Matlab functions, tic and toc)
for the predictive controller at t = 0 was 1.5 seconds on an Intel Quad Core machine
using GAMS with IPOPT as the optimization software. The computation times for all
successive sampling times were lower due in part to the shrinking horizon nature of
the optimization problem.
In Figure 2.11, the final qualities yielded from trajectory tracking are compared
with those from the proposed MPC design. On average, there was a significant im-
provement in meeting the specified quality. With trajectory tracking, the standard
deviations from the target quality were 3392 and 69.69 mol/g for MW and RNH2
respectively. These values were reduced to 1240 and 40.71 mol/g by the predictive
controller.
41

Ph.D. Thesis - Brandon Corbett McMaster University - Chemical Engineering
0.4 0.6 0.8 1 1.2 1.40
50
100
150
200
250
MW · 104
RN
H2
(mol
/g)
Trajectory trackingQuality-based MPCDesired quality
Figure 2.11: Comparison of the final qualities obtained from trajectory tracking andcorresponding quality-based MPC design for 21 new initial conditions.
0 1 2 30.8
1
1.2
1.4
1.6
Time (h)
Pj
·103
(psi
)
Trajectory trackingQuality-based MPC
0 1 2 30
0.5
1
Time (h)
v·1
06(g
/h)Trajectory trackingQuality-based MPC
Figure 2.12: Inputs prescribed by the predictive and trajectory tracking controllersfor one of the batches in the closed-loop simulations
Input trajectories (from both controllers) for one of the batches are shown in
Figure 2.12. For these inputs, trajectory tracking yielded qualities of 6434 and 110
mol/g for MW and RNH2 (respectively) while MPC yielded qualities of 5559 and 131
mol/g. Recall that the desired values for the final MW and RNH2 were 5569 and 136
mol/g. Comparing the input trajectories in Figure 2.12, we observe that the MPC
prescribed inputs followed the same general trends as with trajectory tracking but
with sufficient refinements to significantly improve upon the quality.
42

Ph.D. Thesis - Brandon Corbett McMaster University - Chemical Engineering
2.5 Conclusions
In this work, we proposed a predictive control design for batch systems designed to
drive the batch to a specified quality by batch termination. The MPC design utilized
two types of models: a linear, PLS model which relates the process conditions over the
entire batch duration to the final product quality and weighted local linear models
that, for a candidate input trajectory, predict the future process conditions up to
batch termination. Accounting for the causality and nonlinear relationships between
the future input and process measurements trajectory through the multiple local
linear models led to more effective control action. The proposed control design was
demonstrated via simulations of a highly nonlinear nylon-6,6 batch polymerization
system, and it significantly improved on the final quality variance over that obtained
using trajectory tracking control.
43

Ph.D. Thesis - Brandon Corbett McMaster University - Chemical Engineering
Bibliography
[1] Clarke-Pringle TL, MacGregor JF. Optimization of Molecular-Weight Distribu-tion Using Batch-to-Batch Adjustments. Ind & Eng Chem Res. 1998;37(9):3660–3669.
[2] Dong D, McAvoy TJ, Zafiriou E. Batch-to-Batch Optimization Using NeuralNetwork Models. Ind & Eng Chem Res. 1996;35(7):2269–2276.
[3] Flores-Cerrillo J, MacGregor JF. Iterative Learning Control for Final BatchProduct Quality Using Partial Least Squares Models. Ind & Eng Chem Res.2005;44(24):9146–9155.
[4] Lee JH, Lee KS, Kim WC. Model-based iterative learning control with aquadratic criterion for time-varying linear systems. Automatica. 2000;36(5):641– 657.
[5] Soroush M, Kravaris C. Multivariable nonlinear control of a continuous polymer-ization reactor: An experimental study. AIChE J. 1993;39(12):1920–1937.
[6] Soroush M, Kravaris C. Optimal-design and operation of batch reactors. 1. The-oretical framework. Ind & Eng Chem Res. 1993;32:866–881.
[7] Cruickshank SM, Daugulis AJ, McLellan PJ. Dynamic modeling and optimalfed-batch feeding strategies for a two-phase partitioning bioreactor. Biotech andBioeng. 2000;67:224–233.
[8] Clarke-Pringle T, MacGregor JF. Nonlinear adaptive temperature control ofmulti-product, semi-batch polymerization reactors. Comp & Chem Eng. 1997;21(12):1395–1409.
[9] Kravaris C, Soroush M. Synthesis of multivariable nonlinear controllers by in-put/output linearization. AIChE J. 1990;36(2):249–264.
[10] Peterson T, Hernandez E, Arkun Y, Schork F. Nonlinear DMC algorithm andits application to a semibatch polymerization reactor. Chem Eng Sci. 1992;47(4):737–753.
[11] Shi D, El-Farra NH, Li M, Mhaskar P, Christofides PD. Predictive control ofparticle size distribution in particulate processes. Chem Eng Sci. 2006;61(1):268–281.
[12] Shi D, Mhaskar P, El-Farra N, Christofides P. Predictive control of crystal sizedistribution in protein crystallization. Nanotechnol. 2005;16(7):562–574.
44

Ph.D. Thesis - Brandon Corbett McMaster University - Chemical Engineering
[13] Golshan M, MacGregor JF, Bruwer MJ, Mhaskar P. Latent Variable ModelPredictive Control (LV-MPC) for trajectory tracking in batch processes. J ofProcess Control. 2010;20(4):538 – 550.
[14] Golshan M, MacGregor JF, Bruwer MJ, Mhaskar P. Latent Variable MPC fortrajectory tracking in batch processes: Role of the Model Structure. In: Proc. ofthe American Control Conference. 2009; pp. 4779–4784.
[15] Aumi S, Mhaskar P. Safe-steering of Batch Processes. AIChE J. 2009;55:2861–2872.
[16] Aumi S, Mhaskar P. Robust model predictive control and fault-handling of batchprocesses. AIChE J. 2010;57:1796–1808.
[17] Mhaskar P, Aumi S. Transition from Batch to Continuous Operation in Bio-Reactors: A Model Predictive Control Approach and Application. Can J ChemEng. 2007;45:416–423.
[18] Geladi P, Kowalski B. Partial Least-Squares Regression: A Tutorial. Anal ChimActa. 1986;185:1–17.
[19] Wold S, Geladi P, Esbensen K, Ahman J. Multi-way principal components-andPLS-analysis. J of Chemometrics. 1987;1(1):41–56.
[20] Nomikos P, MacGregor JF. Monitoring batch processes using multiway principalcomponent analysis. AIChE J. 1994;40(8):1361–1375.
[21] Flores-Cerrillo J, MacGregor JF. Within-Batch and Batch-to-Batch Inferential-Adaptive Control of Semibatch Reactors: A Partial Least Squares Approach. Ind& Eng Chem Res. 2003;42(14):3334–3345.
[22] Undey C, Cinar A. Statistical Monitoring of Multistage, Multiphase Batch Pro-cesses. IEEE Control Syst Mag. 2002;22(5):1361–1375.
[23] Ng YS, Srinivasan R. An adjoined multi-model approach for monitoring batchand transient operations. Comp & Chem Eng. 2009;33(4):887–902.
[24] Flores-Cerrillo J, MacGregor JF. Control of Particle Size Distributions in Emul-sion Semibatch Polymerization Using Mid-Course Correction Policies. Ind & EngChem Res. 2002;41(7):1805–1814.
[25] Yabuki Y, MacGregor JF. Product Quality Control in Semibatch Reactors UsingMidcourse Correction Policies. Ind & Eng Chem Res. 1997;36(4):1268–1275.
[26] Wang D, Srinivasan R. Multi-model based real-time final product quality controlstrategy for batch processes. Comp & Chem Eng. 2009;33(5):992–1003.
45

Ph.D. Thesis - Brandon Corbett McMaster University - Chemical Engineering
[27] Gunther JC, Conner JS, Seborg DE. Process monitoring and quality variableprediction utilizing PLS in industrial fed-batch cell culture. J Process Control.2009;19(5):914–921.
[28] Lu N, Gao F. Stage-Based Process Analysis and Quality Prediction for BatchProcesses. Ind & Eng Chem Res. 2005;44(10):3547–3555.
[29] Zhao C, Wang F, Mao Z, Lu N, Jia M. Quality prediction based on phase-specificaverage trajectory for batch processes. AIChE J. 2008;54(3):693–705.
[30] Aumi S, Mhaskar P. Integrating Data-Based Modelling and Nonlinear ControlTools for Batch Process Control. AIChE J. 2012;58:2105–2119.
[31] Aumi S, Corbett B, Mhaskar P, Clarke-Pringle T. Data-based Modelling andControl of Nylon-6,6 Batch Polymerization. IEEE Trans Control Sys Technol.2011;(in press).
[32] Kourti T, Lee J, Macgregor JF. Experiences with industrial applications ofprojection methods for multivariate statistical process control. Comp & ChemEng. 1996;20:745–750.
[33] Kassidas A, MacGregor JF, Taylor PA. Synchronization of batch trajectoriesusing dynamic time warping. AIChE J. 1998;44(4):864–875.
[34] Undey C, Williams BA, Cinar A. Monitoring of batch pharmaceutical fermenta-tions: Data synchronization, landmark alignment, and real-time monitoring. In:Proc. of the IFAC World Congress on Automatic Control, vol. 15. Barcelona, ES.2002; .
[35] Huang B, Ding XS, Qin SJ. Closed-loop subspace identification: an orthogonalprojection approach. J Process Control. 2005;15(1):53–66.
[36] Patel S, Yelchuru R, Ryaliand S, Gudi RD. Discriminatory Learning based Per-formance Monitoring of Batch Processes. In: Proc. of the American ControlConf. 2011; pp. 2552–2557.
[37] Bezdek J. A Convergence Theorem for the Fuzzy ISODATA Clustering Algo-rithms. IEEE Trans Pattern Anal Mach Intell. 1980;2(1):1–8.
[38] Frigui H, Krishnapuram R. Clustering by competitive agglomeration. PatternRecognit. 1997;30(7):1109–1119.
[39] Xie XL, Beni G. A Validity Measure for Fuzzy Clustering. IEEE Trans PatternAnal Mach Intell. 1991;13:841–847.
[40] Russell SA, Robertson DG, Lee JH, Ogunnaike BA. Control of product qualityfor batch nylon-6,6 autoclaves. Chem Eng Sci. 1998;53(21):3685–3702.
46

Chapter 3
Model Predictive Quality Controlof Polymethyl MethacrylatePolymerization Process
47

Ph.D. Thesis - Brandon Corbett McMaster University - Chemical Engineering
Manuscript Overview
The previous chapter addressed a novel approach to the so called missing-data problem
when using PLS models for batch-quality control. In this chapter, these previous
results are extended. Specifically, the methods from the previous chapter are applied
to a different simulation example with substantially more limited inputs. Furthermore,
new measures are introduced to improve controller performance by enforcing model
validity in control decisions. Finally, a basic adaptation method is proposed to expand
the model validity region with each completed closed-loop batch.
This work was carried out with the assistance of a summer research intern, Brian
Macdonald. Brian’s role in this work was to supervise simulations and help tune
controllers.
48

Ph.D. Thesis - Brandon Corbett McMaster University - Chemical Engineering
Model Predictive Quality Control of PolymethylMethacrylate
Brandon Corbett, Brian Macdonald, and Prashant Mhaskar
Originally published: March, 2015, in IEEE Transactions on Control Systems Tech-nology ; DOI: 10.1109/TCST.2014.2334472
Abstract
This work considers the problem of quality control for the production of Polymethyl
methacrylate (PMMA) to achieve prescribed number and weight average molecular
weights. To this end, with a detailed first principles model used to simulate the pro-
cess, a dynamic multiple-model based approach is estimated from past batch data.
Subsequently, the multiple-model is integrated with a quality model to enable pre-
dicting the end quality based on initial conditions and candidate control input (jacket
temperature) moves. A data-driven model predictive controller is then designed to
achieve the desired product quality while satisfying input constraint, a lower bound
on the conversion, as well as additional constraints that enforce the validity of data-
driven models for the range of chosen input moves. Simulation results demonstrate the
superior performance (10.3% and 7.4% relative error in number average and weight
average molecular weight compared to 20.4% and 19.0%) of the controller over tradi-
tional trajectory tracking approaches.
49

Ph.D. Thesis - Brandon Corbett McMaster University - Chemical Engineering
3.1 Introduction
Polymethyl methacrylate (PMMA) is a staple of the polymer industry. Originally
marketed as PlexiglassTM , PMMA now has applications in many products ranging
from its traditional application as a glass substitute to medical implants. The desirable
properties of PMMA are strongly dependent on the molecular weight distribution,
often characterized by the number and weight average molecular weight. The primary
control objective, therefore, is to reach a specified weight average and number average
molecular weight, resulting in high quality product, motivating their production in a
batch fashion. Polymerization of PMMA in this fashion is representative of a class
of polymerization reactions that is common in industry (batch production when high
quality products are required).
Batch PMMA production has typical batch characteristics including finite dura-
tion, nonlinear dynamics over a wide operating range, and the absence of steady-state
operating points. The absence of a nominal steady-state operating point precludes the
direct application of controllers designed for continuous processes. Furthermore, the
molecular weight distribution (or the number and weight average molecular weight)
are typically not measured online during the batch process, but only made offline after
batch completion, making the direct control of the quality variables infeasible.
Existing batch control approaches can be broadly divided into trajectory tracking
and inferential quality control approaches[4]. In trajectory tracking PMMA quality
control, the approach is to first identify using a first principles model [13, 21, 22,
50

Ph.D. Thesis - Brandon Corbett McMaster University - Chemical Engineering
23, 18, 19, 25, 5], past data, or determine using off-line optimization, trajectories for
the temperature that result in the desired quality at the end of the batch, and then
track these trajectories using traditional PI control or MPC [20, 24, 28]. However,
even with perfect tracking, disturbances encountered during the new batch effec-
tively alter the relationship between the product quality and the temperature profile.
Thus, implementing the same reference trajectories batch-to-batch is not guaranteed
to consistently produce on-spec product. The availability of extensive past batch
data however, motivates the use of data-driven model to better capture the nonlinear
dynamics of the system and to readily ‘update’ the model with newly available data.
Data-driven inferential quality control is often achieved through multivariate sta-
tistical process control (SPC) approaches, particularly those utilizing latent variable
tools, such as principal component analysis (PCA) or partial least squares (PLS) re-
gression [10]. For batch processes, the model development for the majority of SPC
applications begins with the so-called “batch-wise” unfolding of multiway batch data
[26, 15]. The unfolded batch data are regressed onto a matrix of final quality mea-
surements to obtain a model that is usable for predicting the final quality prior to
batch completion [12, 8, 11, 27].
An important issue that arises in data-driven inferential quality control approaches
is that future online measurements are required to predict the quality. More specif-
ically, the data arrangement in the model building process calls for the entire batch
trajectory to predict the final quality. However, during a progressing batch, measure-
51

Ph.D. Thesis - Brandon Corbett McMaster University - Chemical Engineering
ments are only available up to the current sampling instant. This issues is treated as
the so-called missing data problem, wherein an attempt is made to ‘fill in’ the missing
data in some appropriate fashion.
A variety of ad-hoc approaches exist to handle the missing data problem. Many
methods utilize missing data algorithms available for latent variable methods (see
[14]). These missing data algorithms work on the assumption that the correlation
structure between the collected measurements and future measurements for the new
batch is the same as in the training data, which in turn necessitates the use of the
same controller in the current batch as was used in the past batches. However, in
practice this is not the case, as the sole objective of the inferential quality based
controller is to replace the earlier control design in the hope of achieve better quality
control. In this sense, the problem is not really one of missing data but rather one
of dynamic modeling. To understand this, consider a batch process say halfway into
the batch. The rest of the process variable ‘measurement’ or evolution depends on
the future control inputs and the past process variable trajectory- therefore what is
needed is a dynamic model relating a candidate input trajectory to the future process
variable trajectory, which in turn can be used to predict the end-point quality, and
therefore select the best input moves. A framework for data-driven quality model was
recently developed in [1] and illustrated on a nylon-6,6 batch polymerization system.
The results in [1], however, did not account for the additional information available
through the initial condition by virtue of all the states measurements being available,
52

Ph.D. Thesis - Brandon Corbett McMaster University - Chemical Engineering
nor did it constrain the control action to keep the process within the range of process
validity.
Motivated by the above considerations, in this work, we present a within-batch
molecular weight distribution modeling and control strategy for the PMMA process.
The approach unites a single PLS inferential model with a nonlinear, data-driven
dynamic modeling approach, while accounting for the variation in information during
the batch and also ensuring that the process stays within the range of model validity.
3.2 Process Overview and Control Objective
In this section, we first describe the process and a detailed first principles model that
will be used as a test-bed for the implementation, followed by the control objectives.
3.2.1 Process Description
This work considers the free radical polymerization of PMMA. The kinetic mechanism
for this reaction can be found in [16]. The process is carried out in a reactor with
a heating/cooling jacket. The deterministic model used in this work is adapted[6]
while making suitable alterations [7, 16]. In particular, the efficiency of the initiator
(which is dependent on viscosity) was calculated by expressions taken from [7]. The
effect increased viscosity has on decreased heat transfer ability between the jacket and
the reactor volume was modeled by an expression taken from [16]. Viscosity values
(which can be readily inferred from the torque measurements in the stirrer) were
53

Ph.D. Thesis - Brandon Corbett McMaster University - Chemical Engineering
assumed to be measured, and related to the process conditions by equations given in
[7]. Finally, the expression for the overall reaction rate used in the heat-balance was
modified from the form given in [6] which assumed a quasi steady-state assumption.
The overall reaction which was implemented is in accordance with the expression
given in [20].
The key states in the deterministic model are the three moments of the living and
dead polymer distributions. These six states can be related to end product quality.
In particular, they can be used to calculate (through expressions presented in the
appendix) the weight and number average molecular weight as well as the conver-
sion of monomer. The weight and number average molecular weight are particularly
important properties for end use.
3.2.2 Control objectives
For the PMMA process, the objective is to reach some target qualities. The key
variables that affect the final quality for the PMMA process are the initial ingredient
recipe and the jacket temperature trajectory. In this work we focus primarily on
the problem of determining the jacket temperature trajectory that in turn affects
the reactor temperature trajectory to yield the desired weight and number average
molecular weight at the end of the batch.
54

Ph.D. Thesis - Brandon Corbett McMaster University - Chemical Engineering
3.2.3 Data-base
The proposed dynamic model building approach relies on the availability of past data
to build the dynamic (and quality) models. We use the model described above to
build this data of past batches. Each batch was started from a new initial condition
to reflect normal variation in feed stock. In the past databases, a proportional-integral
(PI) controller was used to track a nominal reactor temperature profile. This profile
was based on a temperature trajectory presented in [16] (figure 9). The PI controller
was tightly tuned to minimize the integral of absolute error (IAE). Furthermore,
measurements recorded in the database were corrupted with random noise to replicate
sensor error.
The database consisted of initial conditions (states), measurements at each sam-
pling instance, manipulated variable moves, and quality measurements at the com-
pletion of the batch. The initial conditions were defined by monomer and initiator
concentration as well as initial temperature. The measurable outputs were taken to be
temperature, density, and viscosity. The recorded qualities were monomer conversion,
number average molecular weight and weight average molecular weight.
In addition to the batches tracking the nominal profile, five identification batches
were generated. The purpose of these batches was to enrich the database for later
model fitting. Of these batches, two were operated at temperatures shifted up and
down from the nominal operating temperatures by ±1◦C. The remaining three were
operated with pseudo-random binary sequencing signals added on top of the nomi-
55

Ph.D. Thesis - Brandon Corbett McMaster University - Chemical Engineering
nal temperature trajectory (average switching time of six sampling instances with a
variance of ±0.5◦C).
Remark 7 Note that the baseline for comparison could very well have been another
data-based/first principles based approach for trajectory tracking. The focus in the
present manuscript is not to compare PI control with advanced controllers but instead
a trajectory tracking controller with a dedicated ‘quality’ controller. As can be seen, the
PI is able to track the trajectories reasonably well, so any improvement in closed-loop
performance (for quality control) is expected to be attributed to determining (online)
improved control moves that better reach the target quality.
Remark 8 Note also that while we have available a first principles model that cap-
tures well the inherent process dynamics, the model is not easily amenable for online
optimization (and control calculation) because of the nonlinearity of the differential
and algebraic equations governing the dynamics. The model does serve well, however,
as a ‘replica’ of the process and to test the performance of the proposed modeling and
control method.
3.3 Dynamic Model Development
In this section, we apply a multi-model, data-driven modeling approach to predict the
future output behavior (temperature, ln η, and ρ, and subsequently the final quality
[2]) for a candidate manipulated input trajectory. Mathematically, the model for the
56

Ph.D. Thesis - Brandon Corbett McMaster University - Chemical Engineering
process outputs takes the form of a weighted combination of L linear discrete time
input-output models as shown below in Eq. 3.1.
y(k + 1) =L∑`=1
w`(k)β`y(k) (3.1)
where y(k) = [T (k) ln (η(k)) ρmix(k) Tj(k)] ∈ R4 is a vector of process measure-
ments at time k. w`(k) is model `’s weight at sampling instant, k, and β` is a 4x4
matrix and defines the `-th local model. Using the following definitions,
β ,
[β1 · · · β` · · · βL
]′(3.2)
h(k) , [w1(k)y(k) · · ·
· · · w`(k)y(k) · · · wL(k)y(k)]′(3.3)
Eq. 3.1 can be re-written in the form:
y(k + 1) = β′h(k) (3.4)
The model identification procedure consists of an initial clustering step (in essence
determining how many local linear models need to be used, albeit not using the mea-
surements directly, but first performing PCA to retain only independent measure-
ments) followed by solving a linear regression problem. In the first step, a matrix,
Y =
[T ln(η) ρmix Tj
]is generated by sorting the plant data sample-wise and
57

Ph.D. Thesis - Brandon Corbett McMaster University - Chemical Engineering
then, Y (or its equivalent latent variable space - see [2] for details) is clustered into
L clusters using fuzzy c-means clustering (note that y(k) in Eq. 3.3 represents the
kth row of Y). In fuzzy c-means clustering, points that are mathematically “similar”
according to the Euclidean 2-norm are clustered into overlapping spherical clusters
with corresponding center points [17, 3]. Each cluster represents a region in the Y
space where an associated model has the highest degree of validity, and in this way,
the cluster’s center point represents the linearization point of its associated model.
Using the results of the clustering step (the cluster center points), the weights, w`(·),
for the training data can be computed prior to the model coefficients (to be discussed
shortly). Consequently, the h(k) vector in Eq. 3.4 is completely specified for the
training data. Thus, a regressor matrix corresponding to h(k) can be constructed,
and the local linear models, β, are computable using linear regression.
Intuitively, the model weights, w`(·), should depend on the current values of the
states and inputs. In other words, the local models should be weighted according
to the current process conditions. Because full state measurement is not available
for the PMMA system, the vector of outputs and inputs, Y (k), can be used to infer
the current process conditions, and each model’s weight can be assigned based on
the proximity of the operating conditions to its center point. For instance, denoting
model `’s center point as c`, its weight should be inversely proportional to the squared
58

Ph.D. Thesis - Brandon Corbett McMaster University - Chemical Engineering
distance between Y (k) and c`:
w`(k) ∝ ‖y(k)− c`‖−2
Normalizing this expression over all clusters yields the following normalized weighting
function:
w`(k) =‖y(k)− c`‖−2∑Li=1 ‖y(k)− ci‖−2
Note that the choice of the number of clusters is made using cross-validation to
keep the number of clusters that enable a good fit and prediction while avoiding over-
fitting. To do this, the second part of the training data set with 15 batches was used
and the optimal number of clusters was found by evaluating several possibilities. In
particular, models were fit for each combination of 1 to 8 clusters and 4 to 25 principal
components. Models were evaluated in terms of the root mean squared error (RMSE)
of prediction of the batch trajectories. It was found that the best number of clusters
for this system was 6 clusters. For this number of clusters, the optimal number of
principal components was found to be 25. Using these modeling parameters, the root
mean squared error was found to be 0.22, 0.415, and 3.06 in predictions of temperature,
ln η, and ρ respectively. Figure 3.1 shows predicted trajectories for a new batch, and
shows the utility of the model for feedback control (note that the predicted trajectory
is entirely ‘open-loop’, i.e., shares only the initial condition with the actual data).
59

Ph.D. Thesis - Brandon Corbett McMaster University - Chemical Engineering
0 1 2 3 4330
335
340
Time [h]
T[K
]
0 1 2 3 4
−8
−6
−4
Time [h]ln(η)
0 1 2 3 4900
920
940
960
Time [h]
ρ[kg/m
3]
Figure 3.1: Output Trajectories Predicted By The Multi-Model Dynamic Model(Dashed Lines) Compared To Actual Measured Output Trajectories (Solid Lines)
0.7 0.8 0.9
0.7
0.8
0.9
x
x
1 1.5 2 2.5
·105
1
1.5
2
2.5·105
Mn
Mn
1 1.5 2 2.5
·105
1
1.5
2
2.5·105
Mw
Mw
Figure 3.2: Comparison of qualities predicted using the inferential quality model(using a completed batch trajectory) and the resulting actual quality (where x, Mn,and Mw are conversion, number and weight average molecular weight respectively x,Mn, and Mw are the predicted values of those same variables)
60

Ph.D. Thesis - Brandon Corbett McMaster University - Chemical Engineering
3.4 Quality Model Development
In this section the development of a model to predict end point quality from batch
trajectories is described. First, the model fitting procedure is described followed by
the validation results. To obtain an inferential quality model for the PMMA process,
the initial conditions and online measurements from each batch in the training data
were regressed onto the final qualities. To this end, a regressor matrix, X, was formed
such that each row of X contained the initial measurements and complete trajecto-
ries for a given batch. This was accomplished by first unfolding the measurement
trajectories in a batch-wise fashion. To understand this unfolding, first consider a
three dimensional matrix of online measurements split into two parts with dimen-
sions B × J ×K where B denotes batch index (B = 30 for the first part to be used
to compute model parameters, B = 15 for the second part to be used to pick the
best number of principle components), J denotes measurement index (J = 4), and K
denotes sampling time (K = 241). In this unfolding scheme, each row of the regres-
sor matrix contains the complete trajectories for a single batch. Thus the unfolded
process measurements would form a two dimensional B × JK matrix. To form the
final regressor matrix, initial measurements were added to the unfolded process mea-
surements. In the case with I initial measurements (I = 3), the final matrix would
have dimensions B × (JK + I) (ie 30 × 967)[9]. The regressand matrix, Y contains
the quality measurements from each of the batches in the regressor matrix. In the
case with Q final product qualities (for the PMMA system Q = 3), this would form
61

Ph.D. Thesis - Brandon Corbett McMaster University - Chemical Engineering
a B ×Q matrix.
Remark 9 Note that in the case with full state measurement, the end qualities could
be calculated directly from the final state measurements in the batch. This is a result
of the fact that by definition, the state of the batch describes all properties of the batch.
However, continuous full state measurement is rare in batch systems. The inherent
assumption made by the approach followed here (and in a sense in all inferential
quality approaches) is that the final state of the system can be estimated from the
complete output trajectory of the batch, which in turn can be used to estimate the
quality.
Having formed the regressand and the regressor matrix, regression can be carried
out to calculate model coefficients. Note that the columns of the regressor matrix
described previously will inherently have a high degree of correlation. This is a result
of the fact that the regressor contains measurements of the same variable taken one
sampling instant apart. This correlation results in a near singular matrix and will
cause ordinary least squares regression to fail. To address this issue, partial least
squares (PLS) regression is applied. Mathematical details of PLS and the NIPALS
algorithm used to identify PLS models can be found in [10].
Remark 10 The key model parameter in PLS is the number of principal components
used. In this work, the number of principal components was determined using a val-
idation data set. To do this, a model was fit for each possible number of principal
62

Ph.D. Thesis - Brandon Corbett McMaster University - Chemical Engineering
components (limited by the dimension of training data set). Then, each model was
used to predict a separate validation data set. The number of principal components
selected was the one that provided the smallest root mean squared error in predicting
the validation data.
Figure 3.2 demonstrates the performance of the quality model for the PMMA sys-
tem. The predictions shown in this figure are made from completed batch trajectories
of new batches operated under PI trajectory tracking control. Note that the model
provides reasonable prediction of both number average and weight average molecular
weight, and is therefore amenable for the purpose of feedback control.
3.5 Model Predictive Quality Control
In this section, the data-driven modeling approach reviewed in Section 3.3 is used in
conjunction with the inferential quality model described in Section 3.4 in a quality
based MPC design.
3.5.1 MPQC formulation
Note that the quality model captures the (time-cumulative) effects of the entire batch
trajectory on the final quality while the multiple linear models for the measurable
process variables take the causality and nonlinear relationship between the inputs
and outputs into account. The benefit from this approach is a more causal prediction
of the final quality, which, in turn, leads to more effective control action.
63

Ph.D. Thesis - Brandon Corbett McMaster University - Chemical Engineering
Having identified the dynamic and quality model, the desired quality qdes is
achieved by solving the following optimization problem to determine the entire jacket
temperature trajectory from the current time to the end of the batch (resulting in a
shrinking horizon MPC implementation):
minu(k)∈U
(q − qdes)′Ψ (q − qdes) +
K∑i=k
∆Tj′(i)Φ∆Tj(i) (3.5)
s.t.: y(k) = y(t) (3.6)
y(k + 1) =L∑`=1
w`(k)β`y(k) (3.7)
x′future = [u′(k) y′(k + 1) u′(k + 1) · · ·
y′(k + 2) u′(k + 2) · · ·y′(K)]′(3.8)
SPE < SPElim (3.9)
T 2 < T 2lim (3.10)
q =
[xpast xfuture
]Λ (3.11)
where Ψ and Φ are positive-definite weighting matrices imposing penalties on end
point quality deviation and rate of change of control moves. In this work, Ψ was
an identity matrix and Φ was a diagonal matrix with diagonal elements equal to
1.0×10⁻⁶. Equation 3.6 is the MPC initialization at the current plant conditions and
Eq. 3.7 represents the prediction of the future process variables using the data-driven
64

Ph.D. Thesis - Brandon Corbett McMaster University - Chemical Engineering
model (given the current input trajectory in the optimizer). The predicted process
outputs and optimizer inputs are stored appropriately in the xfuture vector through
Eq. 3.8. This vector is concatenated with a vector of previous plant outputs and im-
plemented inputs, xpast. Note that the vector, xpast, is known prior to solving the MPC
optimization problem; specifically, x′past = [z′(0) y′(0) u′(0) y′(1) u′(1) · · · y′(k)]
where z′(0) denotes all the information known prior to starting the batch (i.e., the
initial conditions). The concatenated vector,
[xpast xfuture
], is used to predict the
quality through Eq. 3.11. Note that the prediction horizon for the MPC must extend
to the end of the batch; thus, the prediction horizon, P = K − k, shrinks at every
sampling instant.
In addition to process constraints, Eq. 3.9 and Eq. 3.10 enforce model validity for
the quality model, by enforcing constraints on the squared prediction error (SPE)
and T 2, Enforcing these constraints ensures that the model is applied for trajectories
that make the process operate in regions ‘dynamically similar’ and also having the
same ‘relationship’ between process trajectories and end-point quality variables as
that found in the training data. In geometric terms, SPE can be thought of as the
distance off the latent variable model plane while T 2 can be thought of as the distance
along the plane from the origin of the latent variable space.
65

Ph.D. Thesis - Brandon Corbett McMaster University - Chemical Engineering
3.5.2 Data-driven model-based quality control results
The model predictive control scheme was implemented for the PMMA system, and
results summarized for twenty batches simulated from new initial conditions. The set
point for the quality based control was a weight average molecular weight of 85,000
and a number average molecular weight of 150,000. The penalty on the control moves
was set to 1 × 10⁻⁶. The T squared and SPE limits were calculated from the 95%
and 99.99% confidence intervals respectively. The nonlinear quadratic program solver
CONOPT was used to solve the optimization problem at each sampling instant. At the
first sampling instance of each batch, the optimizer was initialized with the nominal
input trajectory. At each subsequent sampling instance, the tail of the previous
solution was used.
Note that the use of the multiple local model has significant computational advan-
tages compared to using a nonlinear first principles model for optimization, making
the approach feasible for online implementation. In particular, the median time for
the first control move calculation was 74 seconds on a dual core Intel processor (note
that the average time was 93 seconds but is skewed by a few outliers). The average
calculation times for each subsequent sampling instances was 8.71 seconds which is
well below the 60 second sampling time.
The closed loop simulation results were evaluated both in absolute terms and
also by comparison to the PI trajectory tracking performance. Figure 3.3 shows
the relative error for both the PI trajectory tracking and the proposed MPQC. The
66

Ph.D. Thesis - Brandon Corbett McMaster University - Chemical Engineering
average relative errors for the MPQC were 10.3% and 7.4% for number average and
weight average molecular weight respectively. This is compared to 20.4% and 19.0%
for the PI trajectory tracking. In 20 out of 21 cases, the MPQC produces a product
closer to spec then the trajectory tracking scheme for both number and weight average
molecular weight. Figure 3.4 shows a representative MPQC input trajectory. The
MPQC input trajectories were generally similar to the nominal input and the PI
trajectory but deviate slightly (and sufficiently, at critical times) to provide improved
quality.
Remark 11 Note that both T 2 and SPE (shown in Figure 3.5) are moved to their
limits by the optimizer. While this behavior is undesirable from a model validity per-
spective, it is expected. This is because in order to improve the quality from that pro-
duced by PI control, the optimizer must implement a different input output correlation
than was observed in the training data. Fortunately, because of the batch-to-batch up-
dating, each batch that is operated this way makes the models more robust and thus
more accurate for future deviations in input output correlation.
3.6 Conclusions
In this work, we considered the problem of data driven quality control for a PMMA
process. To do this, a dynamic multiple-model based approach was first built and
then integrated with an inferential quality model to yield an overall model for the
67

Ph.D. Thesis - Brandon Corbett McMaster University - Chemical Engineering
0 2 4 6 8 10 12 14 16 18 20 22
0
5
10
15
20
25
30
35
40
Index
Rel
ativ
eE
rrorM
n[%
]PI
MPQC
0 2 4 6 8 10 12 14 16 18 20 22
0
5
10
15
20
25
30
35
Index
Rel
ativ
eE
rrorM
w[%
]
PIMPQC
Figure 3.3: Relative error in the molecular weight distribution qualities comparedbetween the proposed model predictive quality control scheme and trajectory trackingPI controller
68

Ph.D. Thesis - Brandon Corbett McMaster University - Chemical Engineering
0 0.5 1 1.5 2 2.5 3 3.5 4
330
335
340
345
Time [h]
Jac
ket
Tem
per
ature
[K]
NominalPI
MPQC
0 0.5 1 1.5 2 2.5 3 3.5 4
335
340
345
Time [h]
Tem
per
ature
[K]
NominalPI
MPQC
Figure 3.4: Input moves and resulting reactor temperature compared for a typicalbatch under MPQC and PI control
69

Ph.D. Thesis - Brandon Corbett McMaster University - Chemical Engineering
0 1 2 3 4
33.54
4.5
Time [h]
SPE
0 1 2 3 4
62.34
62.36
62.38
62.4
Time [h]
T2
Figure 3.5: SPE and T 2 for a typical batch (solid line), SPE and T 2 constraint(dashed line)
system which was utilized in a model predictive controller. Simulation results demon-
strated the superior performance of the proposed modeling and control method over
traditional trajectory tracking approaches.
Bibliography
[1] S. Aumi, B. Corbett, T. Clarke-Pringle, and P. Mhaskar. Data-driven modelpredictive quality control of batch processes. AICHE J., 59(8):2852–2861, AUG2013.
[2] S. Aumi and Prashant M. Integrating data-based modeling and nonlinear controltools for batch process control. AICHE JOURNAL, 58(7):2105–2119, JUL 2012.
[3] J. Bezdek. A Convergence Theorem for the Fuzzy ISODATA Clustering Algo-rithms. IEEE Trans. Pattern Anal. Mach. Intell., 2(1):1–8, 1980.
[4] D. Bonvin, B. Srinivasan, and D. Hunkeler. Control and optimization of batchprocesses. Control Systems, IEEE, 26(6):34 –45, dec. 2006.
[5] J. P. Corriou and S. Rohani. A New Look at Optimal Control of a Batch Crys-tallizer. AIChE J., 54(12):3188–3206, 2008.
[6] E. E. Ekpo and I. M. Mujtaba. Evaluation of neural networks-based controllers inbatch polymerisation of methyl methacrylate. Neurocomputing, 71(7):1401–1412,2008.
70

Ph.D. Thesis - Brandon Corbett McMaster University - Chemical Engineering
[7] S. Fan, S. P. Gretton-Watson, J. H. G. Steinke, and E. Alpay. Polymerisation ofmethyl methacrylate in a pilot-scale tubular reactor: modelling and experimentalstudies. Chem. Eng. Sci., 58(12):2479–2490, 2003.
[8] J. Flores-Cerrillo and J. F. MacGregor. Within-batch and batch-to-batchinferential-adaptive control of semibatch reactors: A partial least squares ap-proach. Ind. Eng. Chem. Res., 42(14):3334–3345, 2003.
[9] J. Flores-Cerrillo and J. F. MacGregor. Control of batch product quality by tra-jectory manipulation using latent variable models. J. Process Control, 14(5):539– 553, 2004.
[10] P. Geladi and B.R. Kowalski. Partial least-squares regression: A tutorial. Anal.Chim. Acta, 185:1 – 17, 1986.
[11] P. Kesavan, J. H. Lee, V. Saucedo, and G. A. Krishnagopalan. Partial leastsquares (PLS) based monitoring and control of batch digesters. J. Process Con-trol, 10(2-3):229 – 236, 2000.
[12] T. Kourti, P. Nomikos, and J. F. MacGregor. Analysis, monitoring and faultdiagnosis of batch processes using multiblock and multiway PLS. J. ProcessControl, 5(4):277 – 284, 1995.
[13] D. J. Kozub and J. F. MacGregor. Feedback control of polymer quality in semi-batch copolymerization reactors. Chem. Eng. Sci., 47(4):929 – 942, 1992.
[14] P. R. C. Nelson, P. A. Taylor, and J. F. MacGregor. Missing data methods inPCA and PLS: Score calculations with incomplete observations. Chemom. Intell.Lab. Syst., 35(1):45 – 65, 1996.
[15] P. Nomikos and J. F. MacGregor. Monitoring batch processes using multiwayprincipal component analysis. AIChE J., 40(8):1361–1375, 1994.
[16] H. J. Rho, Y. J. Huh, and H. K. Rhee. Application of adaptive model-predictivecontrol to a batch MMA polymerization reactor. Chem. Eng. Sci., 53(21):3729–3739, 1998.
[17] G. A. F Seber. Multivariate Observations. John Wiley & Sons, New York, NY,USA, 1984.
[18] D. Shi, N.H. El-Farra, M. Li, P. Mhaskar, and P.D. Christofides. Predictivecontrol of particle size distribution in particulate processes. Chemical EngineeringScience, 61(1):268–281, 2006.
[19] D. Shi, P. Mhaskar, N.H. El-Farra, and P.D. Christofides. Predictive controlof crystal size distribution in protein crystallization. Nanotechnology, 16:S562,2005.
71

Ph.D. Thesis - Brandon Corbett McMaster University - Chemical Engineering
[20] M. Soroush and C. Kravaris. Nonlinear control of a batch polymerization reactor:an experimental study. AIChE journal, 38(9):1429–1448, 1992.
[21] M. Soroush and C. Kravaris. Multivariable nonlinear control of a continuouspolymerization reactor: An experimental study. AIChE J., 39(12):1920–1937,1993.
[22] M. Soroush and C. Kravaris. Optimal-design and operation of batch reactors. 1.Theoretical framework. Ind. Eng. Chem. Res., 32:866–881, 1993.
[23] B. Srinivasan and D. Bonvin. Real-time optimization of batch processes by track-ing the necessary conditions of optimality. Industrial & engineering chemistryresearch, 46(2):492–504, 2007.
[24] C. Welz, B. Srinivasan, and D. Bonvin. Measurement-based optimization of batchprocesses: Meeting terminal constraints on-line via trajectory following. Journalof Process Control, 18(3):375–382, 2008.
[25] C. Welz, B. Srinivasan, A. Marchetti, D. Bonvin, and N. L. Ricker. Evalua-tion of input parameterization for batch process optimization. AIChE journal,52(9):3155–3163, 2006.
[26] S. Wold, P. Geladi, K. Esbensen, and J. Ahman. Multi-way principalcomponents-and PLS-analysis. J. of Chemometrics, 1(1):41–56, 1987.
[27] Y. Yabuki, T. Nagasawa, and J. F. MacGregor. An industrial experience withproduct quality control in semi-batch processes. Comput. Chem. Eng., 24(2-7):585 – 590, 2000.
[28] G. P. Zhang and S. Rohani. On-line optimal control of a seeded batch coolingcrystallizer. Chem. Eng. Sci., 58:1887–1896, 2003.
72

Ph.D. Thesis - Brandon Corbett McMaster University - Chemical Engineering
3.7 Appendix A: First-principles PMMA Model
From Literature
Differential equations [6]:
dT
dt= −Hrxn
Rp
Cpρmix− UA (T − Tj)
1
CpV ρmix(3.12)
dξ0
dt= 2fkdCi − ktξ2
0 (3.13)
dξ1
dt
= 2fkdCi + kpCmξ0+
. . . (kfmCm + kfsCs) (ξ0 − ξ1)− ktξ0ξ1
(3.14)
dξ2
dt
= 2fkdCi + (2ξ1 + ξ0) kpCm+
. . . (kfmCm + kfsCs) (ξ0 − ξ2)− ktξ0ξ2
(3.15)
dµ0
dt= (kfmCm + kfsCs) ξ0 + (0.5kt) ξ
20 (3.16)
dµ1
dt= (kfmCm + kfsCs + ktξ0) ξ1 (3.17)
dµ2
dt= (kfmCm + kfsCs) ξ2 + ktξ0ξ2 + ktξ
21 (3.18)
dCidt
= −kdCi (3.19)
dCmdt
= − (kp + kfm)Cmξ0 (3.20)
(3.21)
73

Ph.D. Thesis - Brandon Corbett McMaster University - Chemical Engineering
Kinetic Parameters [6] (including gel and glass effect):
kp =kp0
1 + kp0ξ0Dkθp
kt =kt0
1 + kt0ξ0Dkθt
(3.22)
kp0 = 7× 10⁶ exp
(−2.6334× 10⁴
RgT
)(3.23)
kt0 = 1.79× 10⁹ exp
(−1.1704× 10⁴
RgT
)(3.24)
kθp = 3.0233× 10¹³ exp
(−1.1700× 10⁵
RgT
)(3.25)
kθt = 1.454× 10²⁰CI0 exp
(−1.4584× 10⁵
RgT
)(3.26)
kd = 1.58× 10¹⁵ exp
(−1.2874× 10⁵
RgT
)(3.27)
kfm = 4.661× 10⁹ exp
(−7.4479× 10⁴
RgT
)(3.28)
kfs = 1.49× 10⁹ exp
(−6.6197× 10⁴
RgT
)(3.29)
74

Ph.D. Thesis - Brandon Corbett McMaster University - Chemical Engineering
Additional Algebraic Equations [6]:
D = exp
(2.303 (1− φp)
D2
)(3.30)
D2 = 0.168− 8.21× 10⁻⁶(T − 387)2+
. . . 0.03(T − φp)(3.31)
φm =CmMWm
ρmφp =
µ1MWm
ρp(3.32)
f = f0 exp
(−C
(1
Vf− 1
Vfcr
))(3.33)
Vfcr = 0.1856− 2.965× 10⁻⁴(T − 273) (3.34)
Vf = 0.025 + 0.001(T − 167)φm+
. . . 0.00048 ((T − 387)φp + (T − 249)φs)(3.35)
Rp = kpCmξ0 (3.36)
ρmix = (µ1 + Cm)MWm + CsMWs + CiMWi (3.37)
Cp =µ1Cp,p + CmCp,m + CsCp,s
µ1 + Cm + Cs(3.38)
U = U0
(0.2 + 0.8 exp
(−5x5
))(3.39)
η = η0 (1 + ηsp) (3.40)
ηsp = cηint (1 + khηintc) (3.41)
c = µ1MWm/103 (3.42)
ηint = 6.75× 10⁻³ (Mw)0.72 (3.43)
Quality Variables:
Mn =µ1 + ξ1
µ0 + ξ0
MWm (3.44)
Mw =µ2 + ξ2
µ1 + ξ1
MWm (3.45)
x =µ1
Cm,0(3.46)
• In equations 3.17 and 3.19, f is used to denote the efficiency of the initiator(which is dependant on viscosity). We calculated this effect in equations 3.33to 3.35 which were taken from [7].
• As the reaction progresses, the increased viscosity causes a decrease in the heattransfer ability between the jacket and the reactor volume. This is modeled inequation 3.39 taken from [16].
75

Ph.D. Thesis - Brandon Corbett McMaster University - Chemical Engineering
• Viscosity values (which can be readily inferred from the torque measurements inthe stirrer) were assumed to be measured, and related to the process conditionsby equations 3.40 to 3.43 taken from [7].
• Equation 3.36 is different from [6] (where a quasi steady state assumption ismade only for this equation) and uses ξ0 [20] which is consistent with the use ofdynamic equations describing the evolution of the moments.
76

Chapter 4
Subspace Identification forData-driven Modeling and QualityControl of Batch Processes
77

Ph.D. Thesis - Brandon Corbett McMaster University - Chemical Engineering
Manuscript Overview
In the previous two chapters a novel approach for batch quality control using PLS
models was presented. The key contributions of these two manuscripts focused on
the so-called missing data problem in the latent variable modeling approach. While
the approach in these previous chapters provided a time-independent approach for
dynamic modeling, the quality model was still inherently a time-varying model. While
this kind of time-varying methodology works well for some systems, there are potential
gains to be made by moving to a strictly time-invariant model structure.
This chapter introduces a novel, completely time-invariant approach to batch mod-
eling and quality control. The approach is motivated by the observation that, given
the correct state-space description, the complete instantaneous condition of the batch
can be captured by the state. By describing the batch from this state-based perspec-
tive, we eliminate the need for time-varying descriptions. As will be shown in this
and the following chapters, removing time-dependence provides valuable flexibility in
both model building and quality control.
78

Ph.D. Thesis - Brandon Corbett McMaster University - Chemical Engineering
Subspace Identification for Data-driven Modelingand Quality Control of Batch Processes
Brandon Corbett and Prashant Mhaskar
Originally published: May, 2016, in AIChE Journal ; DOI: 10.1002/aic.15155
Abstract
In this work we present a novel, data-driven, quality modeling and control approach
for batch processes. Specifically, we adapt subspace identification methods for use
with batch data to identify a state-space model from available process measurements
and input moves. We demonstrate that the resulting LTI, dynamic, state-space model
is able to describe the transient behavior of finite duration batch processes. Next, we
relate the terminal quality to the terminal value of the identified states. Finally, we
apply the resulting model in a shrinking-horizon, model predictive control scheme
to directly control terminal product quality. The theoretical properties of the pro-
posed approach are studied and compared to state-of-the-art latent variable control
approaches. The efficacy of the proposed approach is demonstrated through a sim-
ulation study of a batch polymethyl methacrylate (PMMA) polymerization reactor.
Results for both disturbance rejection and set-point changes (that is, new quality
grades) are demonstrated.
79

Ph.D. Thesis - Brandon Corbett McMaster University - Chemical Engineering
4.1 Introduction
Batch processes represent a class of chemical processes characterized by a reaction
carried out over a finite duration. The use of batch processes is widespread in chemi-
cal industries including the pharmaceutical, biotech, specialty chemical, agricultural,
and microelectronics industries [1]. Amongst others, a few key advantages of batch
processes are that they are able to produces multiple related products using the same
equipment, handle variation in feed, and adjust to variations in product specs. Fur-
thermore, since the volume of each batch is relatively low and each batch is uncorre-
lated, batch processes are especially important in the production of low volume, high
value products. This is because after each batch, the product specifications can be
tested and, in the cases where specifications are unmet, the product can be discarded
without further loss of materials. This kind of policy is appropriate when reaching
the product specification is more economically valuable then obtaining high through-
put and product yield. In summary, batch processes play an important role in the
production of high value products where product quality is of paramount importance.
The objective for batch processes, therefore, is to reach the desired product quality
at the termination of the batch. This objective is often hindered by the effect of
feedstock variation and other disturbances on the evolution of the process. To address
these disturbances and to drive the process to the desired quality, continuous inputs
(such as heat addition and removal) are made to the process. The (control) policy by
which these inputs are selected has a profound impact on whether the desired quality
80

Ph.D. Thesis - Brandon Corbett McMaster University - Chemical Engineering
is obtained.
Many batch processes are operated under a simple open loop ‘control’ policy where
the same, time-indexed input-trajectory is applied for each batch [1]. This approach
is motivated by the assumption that by repeating historically successful actions, the
desired product quality will be obtained. Open loop policies are beneficial in that
they are easy to implement, do not require online measurement or process models,
and can be easily adapted from lab scale procedures. However, because there is no
feedback mechanism in this approach, it is incapable of rejecting disturbances that
effect the process.
In order to reject disturbances effecting the product quality, closed-loop approaches
must be applied. However, closed-loop quality control needs to overcome several chal-
lenges inherent to batch processes. First of all, variables of importance for product
quality are typically not measured online precluding their direct use in quality con-
trol. Often these variables are either too costly to measure in real-time or real-time
measurement is physically impossible. Instead, quality variables are measured in a
laboratory setting after the completion of the batch. Another complicating factor is
that, like most chemical processes, evolution of fundamental process states is gov-
erned by nonlinear dynamics. However, unlike the continuous systems, there is no
valid direct linearizion of these process dynamics because the process is transient.
These two factors limit the applicability of traditional control approaches such as
proportional-integral (PI) or dynamic matrix control (DMC). Instead, entirely new
81

Ph.D. Thesis - Brandon Corbett McMaster University - Chemical Engineering
control approaches are needed.
One common control approach for batch process is trajectory-tracking. In trajectory-
tracking control, a predefined set-point trajectory for a measurable process variable is
tracked. The underlying assumption for this approach is that if the process is tightly
controlled to follow the same trajectory as a historically successful batch, the desired
quality will be obtained. In its simplest form, trajectory tracking can be achieved
using a PI controller. To account for the nonlinear evolution of the process states,
techniques such as gain scheduling may be applied [2, 3]. While this approach provides
a simple, easily implemented solution, even with perfect tracking the desired quality
may not be obtained. This is because relationship between the controlled variable and
final quality may change significantly with changes in feedstock, and other variations.
Furthermore, this approach is inherently time-indexed which may become a problem
when the duration of batches is not consistent.
More advanced control approaches universally rely on the availability of some sort
of model for the process. In many studies, the existence of an accurate first principles
dynamic model of the process is assumed. Given such a model, approaches such as
linearizing control [2], and direct model predictive control [4, 5, 6, 7, 8, 9, 10, 11]
can be applied. However, a large part of the reason that batch processes are so
ubiquitous is that, compared to their continuous counter-parts, batch processes are
relatively simple to design and implement. This leads to a short time-to-market but
also has important implications in terms of process control. Because maintaining
82

Ph.D. Thesis - Brandon Corbett McMaster University - Chemical Engineering
low development cost is often of utmost importance, it is often impractical to carry
out the thorough identification experiments necessary to determine the parameters in
first principles models [12]. This motivates the use instead of simpler process models,
where the parameters can be determined using statistical techniques. In these control
approaches, models built from historical and limited identification data are used to
calculate control actions. Because of the central role of the models in these approaches,
the model building methodology is an integral part of the resulting control design.
Statistical batch control methods (and the related model identification) can be
broadly classified into two classes: batch-to-batch approaches and within batch ap-
proaches. In batch-to-batch approaches, the key assumption is that there are distur-
bances influencing the batch quality that are correlated from one batch to the next.
Therefore, these approaches build models to predict the quality of the next batch
from the qualities of the previous series of batches and their corresponding input
trajectories. Between batches, the input trajectory is updated to reject disturbances
observed in the preceding batches. A significant number of literature contributions
have been made addressing this approach [13, 14, 15, 16, 17, 18, 19, 20]. Most no-
tably related to the current work is a proposed batch-to-batch approach where the
dynamic evolution of the quality variables between batches was identified using sub-
space identification [20]. While batch-to-batch approaches are valuable if there is
correlation between the batches, it is not applicable when batches are independent
events. Furthermore, even if consecutive batches are correlated, batch-to-batch meth-
83

Ph.D. Thesis - Brandon Corbett McMaster University - Chemical Engineering
ods do not address the problem of rejecting disturbances that arise within individual
batches. This motivates the need for within batch control. Within batch approaches
utilize measurements taken during the batch in conjunction with a model to reject
disturbances as they arise throughout the batch. These approaches can be further
categorized as trajectory-tracking and quality control methods. As previously dis-
cussed, the premise of trajectory-tracking control is to regulate a process variable
to track a historically successful trajectory. Advanced trajectory-tracking control is
most commonly achieved by replacing traditional PI controllers with model based
control. Specifically, in these contributions, some form of dynamic model is used to
predict the evolution of the controlled variable for a candidate input trajectory. The
primary difference between these contributions lies in the models they employ. Of
particular relevance to this work are contributions in which empirical dynamic mod-
els are employed. In [21], local linear ARX models are identified and combined using
a weighting function to describe the nonlinear evolution of the process. In [22, 23],
neural networks are used to identify a dynamic model. One of the most commonly
studied approaches in literature is the application of latent variable methods and in
particular principal component analysis (PCA). In these approaches, the correlation
between subsequent measurements is employed to describe the evolution of the pro-
cess [24, 25, 26, 27]. As with more traditional trajectory-tracking approaches, the
drawback of all trajectory-tracking approaches is that the relationship between the
controlled variable and quality may change. The solution is to apply direct quality
84

Ph.D. Thesis - Brandon Corbett McMaster University - Chemical Engineering
control.
In general, direct quality control is achieved using model based control. Specifi-
cally, a model is developed that relates the past observations, current observations,
and the candidate input trajectory to quality. A variety of modeling methodologies
have been applied to identify such models. One approach has been to train artifi-
cial neural networks on batch data [28]. The most commonly used modeling method
however, is projection to latent structures (PLS) [29, 30, 31, 21, 32]. In these contri-
butions, trajectories of process measurements and inputs are related to quality in the
model building step. Then, to control a new batch, the model is applied to available
process measurements to determine an appropriate input. A key challenge in the
control step is that fewer measurements may be available then were used in model
fitting. Specifically, partway through the batch only process measurements from the
past and current sampling instant are available. A number of approaches have been
taken to solve this problem including use of missing-data algorithms [29] and indepen-
dently building dynamic models [31] to estimate the necessary values. Note that the
problem of estimating future process measurements is essentially a dynamic modeling
problem.
The primary contribution of the current work is the use of subspace identification
to model the dynamic evolution of the process and relate available process measure-
ments to quality. Subspace identification is a class of linear, time-invariant, dynamic
model identification techniques in which the first step is to identify a valid state tra-
85

Ph.D. Thesis - Brandon Corbett McMaster University - Chemical Engineering
jectory from training data before fitting model parameters. Early contributions in
this field established the broad success of these methods for identifying LTI models
of continuous processes [33, 34, 35, 36]. However, very little work has been carried
out on applying subspace identification to batch processes. In [37], CVA (a class of
subspace identification algorithms) is used to build a model for monitoring of batch
processes but the issue of control is not addressed. In [20] subspace identification is
use for batch-to-batch control. Neither of these contributions treat the use of subspace
identification for within batch control.
This paper presents a novel approach to within batch quality modeling and control
with the ability to handle variable batch durations. To this end, first a dynamic model
of the process is built by adapting existing subspace identification methods for batch
data. Next, a quality model is built to relate subspace states to product quality. These
two models are used in conjunction to make predictions for new batches. To make
control decisions, a model predictive control (MPC) scheme is designed which uses
the two models to proscribe appropriate input moves. The efficacy of this approach
is demonstrated by comparison to a state-of-the-art latent variable approach and tra-
ditional PI trajectory-tracking control. The paper is organized as follows: in the next
section we define the class of batch processes studied and review literature results on
which the proposed method is based. We also review a state-of-the-art latent variable
model predictive control scheme which we use as a benchmark in this work. Following
the preliminaries, we present the batch reaction of Polymethyl Methacrylate (PMMA)
86

Ph.D. Thesis - Brandon Corbett McMaster University - Chemical Engineering
as a motivating example process. Next, we present an analysis of latent variable mod-
eling approaches from a state-space perspective. In the following section, we present
the novel subspace quality model predictive control (SQMPC) design. The subse-
quent section provides application results in which the proposed SQMPC, LVMPC,
and traditional PI trajectory tracking are compared. Finally, we draw conclusions
and discuss areas for future work.
4.2 Preliminaries
In this section we review the fundamental principles and methodologies that lay the
groundwork for the novel elements of this work. To begin, in the first subsection we
define the class of system studied in this work. Next, we briefly review latent variable
methods which have traditionally played a large role in batch modeling and control.
In the final subsection we briefly review subspace identification, a dynamic modeling
approach which we heavily utilize in the proposed approach.
87

Ph.D. Thesis - Brandon Corbett McMaster University - Chemical Engineering
4.2.1 Class of Processes
In this work, we consider batch processes, described mathematically:
x = f (x,u) (4.1)
y = g (x,u) (4.2)
q = h (x,u) (4.3)
where x is the state variable, f , g, and h are nonlinear mappings that relate the
evolution of the process, output, and quality respectively to the state and input.
The outputs are denoted by y[k] where k indexes the sample. In general, output
variables are assumed to have minimal to zero delay in availability. Examples of
typical output variables include temperature and volume. We denote the input by
u (t). In this work we consider inputs with a zero order hold with the same frequency
as the sample frequency of the output. We represent this as u[k] corresponding to
the input implemented when measurement y[k] becomes available. Quality variables
are aspects of the final product that are important to the consumer of the product
(either for downstream processing or commercially). Quality variables may be difficult
to measure, involving long measurement delays and typically only become available
after the completion of the batch. In this work we denote quality measurements with
the vector q[T ] where T is the duration of the batch.
88

Ph.D. Thesis - Brandon Corbett McMaster University - Chemical Engineering
4.2.2 Latent Variable Methods
One popular approach to modeling and control of batch processes involves statisti-
cal techniques, or latent variable methods, for model building. Before we analyze
an existing approach, and integrate some of these concepts into a state space based
modeling and control approach, in this section we review some of the key concepts
behind these methods. The underpinning concept of latent variable methods is the
projection of data from a high dimension (measurement space) in which the indepen-
dence of variables is uncertain into a lower dimensional (latent space) with guaranteed
variable independence. In this subsection we present the fundamentals of the latent
variable methods: principal component analysis (PCA), principal component regres-
sion (PCR), and projection to latent structures (PLS).
PCA is, in some sense, the most basic latent variable method. PCA is concerned
only with the representation of a single measurement space (the X block) in a reduced
dimensional space. Mathematically this is represented in the following form:
X = TP′ (4.4)
where X is the measurement space with columns containing variables and rows ob-
servations. T is the latent space, referred to as the score matrix, with the same
interpretation as X. P defines the orientation of the latent variable space and is
referred to as the loading matrix.
89

Ph.D. Thesis - Brandon Corbett McMaster University - Chemical Engineering
PCR is an extension of PCA and ordinary least squares regression. The objective
of PCR is to regress dependent variables referred to as the y-block, Y, onto a set
of possibly-correlated, independent variables X. Ordinary least squares regression
fails in this case because X is column-rank deficient. PCR is accomplished by first
using PCA to project the X space variables into an uncorrelated latent (score) space.
Ordinary least squares (OLS) regression is then carried out; the columns of Y are
regressed onto the scores. It is worth noting that the resulting model is nevertheless
a linear model relating X and Y.
In contrast to PCR, when using PLS both the x and Y blocks are projected into
corresponding latent variable spaces. This is accomplished in practice by evaluating
a three component objective: maximizing the explained variance in the X space,
maximizing the explained variance in the Y space, and maximizing the correlation
between the two. Mathematically:
T = XW∗ (4.5)
Y = UC′ (4.6)
Where T and U are the score-spaces of the X and Y blocks, respectively. In appli-
cation, it is assumed that T = U which is valid because of the maximized correlation
between the two score spaces. The resulting PLS model takes the same form as an
OLS or PCR model; namely it is a linear model relating the X and Y blocks. We
next describe an existing approach that applies the idea behind PLS for the purpose
90

Ph.D. Thesis - Brandon Corbett McMaster University - Chemical Engineering
of batch process modeling and control.
4.2.3 LVMPC
In this subsection we will review the latent variable model predictive control (LVMPC)
[29]. This work addresses the problem of direct quality control by inverting a PLS
model to determine the input move, and has found widespread application and success.
We review the approach here to enable its subsequent analysis from a state space based
perspective, and also to serve as an excellent benchmark for our proposed approach
that utilizes an altogether different perspective to the quality control problem.
All modeling approaches inherently assume a certain model structure and then
determine the best fit values of the parameters. To do this the data must be arranged
appropriately for parameter estimation. The LVMPC proposed utilizes batch-wise
unfolding to build and implement the model (see, e.g., [29] and many subsequent
contributions). Batch-wise unfolding is accomplished by re-arranging the training
data such that each row of the X matrix contains the input and output trajectories
from a complete batch. This is represented as
X =
y(1)[1] u(1)[1] · · · y(1)[kf ] u(1)[kf ]
......
......
y(B)[1] u(B)[1] · · · y(B)[kf ] u(B)[kf ]
(4.7)
where y(b)[k] and u(b)[k] are vectors output measurements and inputs respectively
91

Ph.D. Thesis - Brandon Corbett McMaster University - Chemical Engineering
for batch b at sampling instant k. In the Y matrix, each row is comprised of the
corresponding quality measurements.
Y =
q(1)[kf ]
...
q(B)[kf ]
(4.8)
Model fitting is accomplished by applying PLS to the X and Y block (as described
in the previous subsection).
Remark 12 Batch-wise unfolding necessitates that each batch in the training data
has the same length so that complete columns of the X block can be populated. In
practice, it is common for batches to have varying duration. In many cases, this
is due to operating policies whereby the reaction is stopped when a condition is met
(ie. when a sample with high enough conversion is taken). One commonly adopted
solution in literature [38, 39, 40, 41, 42] is to “align” batches based on a measured,
monotonically-increasing variable. Under batch alignment, columns of the X block
correspond to equal values of the alignment variable rather than equal elapsed time.
Once a PLS model is identified, LVMPC can be used at decision points throughout
the batch to adjust the input trajectory and drive the process to the desired quality.
In the interest of brevity, only an outline of, and the most simple form of the LVMPC
calculation will be presented here. The method can be thought of in three steps.
First, the current score is calculated from the existing measurements and nominal
92

Ph.D. Thesis - Brandon Corbett McMaster University - Chemical Engineering
input trajectory. At each decision point, only a partial row of the X space can be
constructed because output measurements following the decision point are not yet
available. Therefore, the score is calculated using a missing-data algorithm. These
algorithms utilize the observed correlation in the X space to fill calculate the score
despite the unavailable values. In the next step, a quadratic program is evaluated to
determine a move in the score space. The move is calculated such that the resulting
score corresponds to a predicted quality close to the quality set-point. Finally, the
move in the score space is translated into an input move trajectory to be implemented
for the remainder of the batch. The inquiring reader is referred to [29] for details. We
next review an alternate modeling approach.
4.2.4 Subspace Identification
In this subsection we will give a brief overview of subspace identification. While we
refer the reader to literature for details (see [35, 34, 43, 33, 44]), we provide enough
nomenclature to describe the application of subspace identification in this work.
In these approaches, the model parameters are identified assuming a discrete linear
model of the form:
x[k + 1] = Ax[k] + Bu[k] (4.9)
y[k] = Cx[k] + Du[k] (4.10)
where x denotes the subspace states (note that the distinction between subspace
93

Ph.D. Thesis - Brandon Corbett McMaster University - Chemical Engineering
states denoted x and first principal states x will be discussed in detail later in the
paper). The objective of subspace identification is to identify the system matrices A,
B, C, and D utilizing the input and output data u and y. To do this, first a valid
state trajectory is identified by finding a common basis between lagged input and
output data. Once a state trajectory is obtained, the system matrices can be easily
determined (for example by OLS).
One important tool that is utilized in the determination of the state trajectories
are the Hankel matrices of input and output data. In this work, we will adopt the
standard notation of these matrices where Y1|i and U1|i represent Hankel matrices of
output and input data respectively. Under this notation, the subscripts denote the
range of sampling instances in the first column. For instance:
Y1|i =
y[1] y[2] · · · y[j]
......
...
y[i] y[i+ 1] · · · y[i+ j − 1]
(4.11)
Once the data has been arranged into Hankel matrices, a wide variety of subspace
identification methods can be used. Subspace identification methods can be broadly
categorized into deterministic, stochastic, and combined deterministic stochastic meth-
ods. The key difference between these methods is their handling of process noise (ie
noise in the states), resulting from the model structure that is assumed. In essence,
utilizing of combined deterministic stochastic methods (under assumptions of a spe-
94

Ph.D. Thesis - Brandon Corbett McMaster University - Chemical Engineering
cific structure of the data) also enables estimating the process and measurement noise
covariance matrices that can then be utilized within say a Kalman filter for improved
state estimation. Three of the most prominent combined deterministic stochastic
methods are numerical subspace state space system identification (N4SID), multivari-
able output error state space (MOESP), and canonical variate analysis (CVA) [36].
In [45], a unifying framework is presented for these three methods where the principal
difference is the selection of two weighting matrices which determine the orientation
of the resulting state-space. For simplicity of use, and for the purpose of illustration
of our proposed approach, in this work we will use the simple deterministic algorithm
presented by Moonen et. al. [35]. Note that the proposed approach can be readily
generalized to utilize the combined deterministic stochastic methods.
4.3 Motivating Example: Polymethyl Methacry-
late Process
In this section we introduce the Polymethyl Methacrylate Process(PMMA), an industrially-
relevant batch process, under traditional trajectory tracking control, to motivate the
proposed approach. PMMA is a staple of the polymer industry. Originally mar-
keted as Plexiglass, PMMA now has applications in many products ranging from its
traditional application as a glass substitute to medical implants. For high end appli-
cations, quality is a key factor. As with many products, when quality is of paramount
95

Ph.D. Thesis - Brandon Corbett McMaster University - Chemical Engineering
importance it is preferable to carry out the polymerization as a batch process.
The quality of a batch of PMMA can be characterized by the molecular weight
distribution of the polymer. Since measurement of the complete molecular weight dis-
tribution is often not practicable, it is common to summarize the key characteristics
of the distribution. The number and weight average molecular weights provide suffi-
cient information to classify the properties of the product. Therefore, the objective
for the batch production of PMMA is to reach the desired number and weight average
molecular weight at batch termination.
Batch, free-radical polymerization of PMMA is carried out in a jacketed reac-
tor with a continuous stirrer. The reactor is charged with methyl methacrylate
(monomer), AIBN (initiator), and toluene (solvent). The heat addition to the re-
actor is manipulated via the coolant/heating fluid flow rate. The nominal recipe for
a batch (in terms of concentration) is presented in table 4.1. In this work, we use
a first principles dynamic model of the PMMA process to generate historical and
identification data, and as a testbed to evaluate control designs. This model includes
nine states dictated by nonlinear algebraic and differential equations. These states
include six molecular weight distribution moments, concentration of monomer and
initiator, and reactor temperature. Throughout this study, we regarded the first prin-
ciples model as a black-box model. This first principles model is adapted from [46]
while making suitable adaptations [47, 48]. More discussion of these adaptations is
provided in [31].
96

Ph.D. Thesis - Brandon Corbett McMaster University - Chemical Engineering
Table 4.1: Initial batch conditions for PMMA reaction
Variable Value σ2 Units
Initiator Concentration 2.06×10⁻² 1.0×10⁻³ kg/m3
Monomer Concentration 4.57 0.5 kg/m3
Temperature 61 2.5 ◦C
As one example of a traditional control implementation, PI trajectory tracking of a
nominal temperature profile is used, where a tightly tuned controller rejects deviations
in the measured temperature from the nominal trajectory by manipulating the jacket
temperature. The key idea being that the nominal temperature trajectory, shown to
provide good quality in historical batches, should continue to provide good quality in
subsequent batches. Once the batch has begun, reaction is carried until the density
reaches a predefined level.
To reflect common variation in the feed, each of these initial conditions is in-
dependently drawn from a normal distribution centered around the nominal initial
condition. The standard deviations for these initial conditions is given in table 4.1.
In this work, we take the measured process variables to be temperature within the
reactor, volume of the reactants, and stirrer torque. From the volume measurement
we assume that the density can be determined. For the PMMA process, density is
a monotonically increasing variable which reflects, in some sense, the extent of the
reaction. Therefore, it provides a crude indication of when the target product has
been reached. By terminating the batch based on density rather than at a specific
batch duration, the resulting quality variation is reduced. An example of the resulting
97

Ph.D. Thesis - Brandon Corbett McMaster University - Chemical Engineering
0 0.2 0.4 0.6 0.8 1 1.2 1.4 1.6 1.8 2 2.2 2.4 2.6 2.8 3 3.2 3.4 3.6 3.8 4
334
335
336
337
338
339
340
341
342
Time (hr)
Jacket
Tem
perature
(K)
Figure 4.1: Jacket temperature trajectory for a characteristic closed loop batch underPI (dotted line), LVMPC (dot-dashed line), and the proposed SQMPC (solid line)
PI jacket and reactor temperature trajectories is shown in figures 4.1 and 4.2 respec-
tively. The bottom row of plots in figure 4.3 shows histograms of the resulting number
and weight average molecular weight as well as conversion in terms of percent error
from the desired values. While the temperature trajectory plot demonstrates that
the PI control is able to effectively track the desired temperature trajectory, clearly
the desired quality is not always achieved. This is due to the fact that the expected
(or past) relationship between a temperature profile and the final quality does not
continue to hold. Note that in the present process, viscosity can also be calculated
from the stirrer torque. Therefore, there exists a possibility to implement advanced
control approaches that utilize all the available measurements for improved quality
control.
98

Ph.D. Thesis - Brandon Corbett McMaster University - Chemical Engineering
0 1 2 3 4
335
340
Time (hr)
Tem
perature
(K)
0 1 2 3 4
−8
−6
−4
Time (hr)
Log
Viscosity
0 1 2 3 4
900
920
940
960
Time (hr)
Density
Figure 4.2: Measured outputs from a characteristic closed loop batch under PI (dottedline), LVMPC (dot-dashed line), and the proposed SQMPC (solid line)
99

Ph.D. Thesis - Brandon Corbett McMaster University - Chemical Engineering
−10 0 100
10
20
30
SQMPC
batches
(%)
MN
−10 0 100
10
20
30
MW
−10 0 100
10
20
30
Conversion
−10 0 100
10
20
30
LVMPC
batches
(%)
−10 0 100
10
20
30
−10 0 100
10
20
30
−10 0 100
10
20
30
rel. error (%)
PI
batches
(%)
−10 0 100
10
20
30
rel. error (%)−10 0 10
0
10
20
30
rel. error (%)
Figure 4.3: Histograms of case 1 qualities resulting from 186 batches operated underSQMPC, LVMPC, and PI control.
100

Ph.D. Thesis - Brandon Corbett McMaster University - Chemical Engineering
4.4 Latent Variable Control Analysis
In this section, we will conduct a brief analysis of latent variable methods. In partic-
ular, we focus our discussion on the model form of latent variable models when built
on batch-wise unfolded data to reconcile the inherent requirements of equal batch
duration in these approaches.
Latent variable methods have proven successful for data-based MPC of batch pro-
cesses [29, 27, 14, 49, 26, 25]. A key issue in these contributions is the arrangement
of batch data into matrices for latent variable analysis. In many of these contri-
butions, a latent variable model is built by unfolding batch data in the batch-wise
manner described in equations 4.7 and 4.8. Once identified the models are applied
in a controller to control a new batch. Note that at the decision points, partway
through the batch, only the past and current measurements are available. Therefore,
one important aspect of these methods is to use the identified model to predict the
future batch measurement trajectory. This prediction is accomplished using missing
data algorithms. In some sense, the missing data algorithms turn the latent variable
models into dynamic models of the process. A key to understanding the success of
LVMPC is to understand the structure and functioning of latent variable models used
in this fashion.
To begin we will examine the structure of latent variable models. Particularly,
consider applying the previously identified model to data from a new batch. To do
this, the data are arranged into a row, xnew of the same format as the rows of the X
101

Ph.D. Thesis - Brandon Corbett McMaster University - Chemical Engineering
training matrix. The first step in applying the model is to center and scale the row
in the same way as was done in the training data. This can be represented
xnew = (xnew − µx)�[
1σx1
· · · 1σxkf
](4.12)
where µx represents a vector of the column means of the training data and σxi rep-
resents the standard deviation of the ith column. Because of the unfolding policy
described by equation 4.7, this implies that µx contains the time-indexed average tra-
jectory of the inputs and outputs in the training data. Likewise, σxi represents the
time-indexed standard deviation of the inputs and outputs in the training data. After
centering and scaling, the score is calculated as
t = xneww∗ (4.13)
where w∗ is the coefficient matrix identified in the modeling step. To clarify structure
of this model, we can substitute the form from equation 4.7. Doing this we get
t =
[y[1] u[1] · · · y[kf ] u[kf ]
]w∗ − µxw∗ (4.14)
where w∗ is the result of taking the appropriate Hadamard product of the coefficients
and the standard deviation vector. Next we can partition the matrix w∗ into sub-
matrices based on the sampling instant of the output measurement or input they
102

Ph.D. Thesis - Brandon Corbett McMaster University - Chemical Engineering
multiply. Then equation 4.14 can be written as:
t =
kf∑k=1
([y[k] u[k]
]− µx[k]
)w∗[k] (4.15)
where µx[k] is the sub-vector of the mean input and output trajectories corresponding
to the kth sampling instant. This reformulation clearly demonstrates that latent
variable models built on batch-wise unfolded data yield time-dependent linear models
of the process.
Next we consider how this structure is utilized by missing data algorithms. There
are a large variety of missing data algorithms that have been discussed in literature
each with its own advantages [50, 51]. While each missing data algorithm is unique in
its methodology, the basic steps are similar between algorithms. Specifically, first a
score is calculated from the available data, then the missing trajectory is filled in with
values consistent with the calculated score. Regardless of the algorithm, both of these
steps involve using the relevant parts of the weighting matrix w∗. Therefore, these
missing data algorithms inherit the time-dependency of the latent variable model
structure. In this way, using a latent variable model and missing data algorithms to
make trajectory predictions is equivalent to using a linear time-dependent dynamic
model in which the dynamic model coefficients depend on sampling instant.
To illustrate the time-dependent indexed nature of latent variable methods when
used as dynamic models, we will demonstrate the use of the projection to model plane
(PMP) missing data algorithm for estimating the score using measurements available
103

Ph.D. Thesis - Brandon Corbett McMaster University - Chemical Engineering
midway through a batch. In many latent variable batch approaches, this score value
forms the basis for subsequent control decisions and output prediction. Consider that
output data are available up until the current sampling instant, kc, and the complete
input trajectory (past inputs and future candidate trajectory) is also available. Using
the PMP method, the estimated score, t can be obtained as:
t =(w∗′
knownw∗known
)−1
w∗′
known · · ·([y[1] u[1] · · · y[kc] u[kc] u[kc + 1] · · · u[kf ]
]− µx,known
)�[
1σx,known
](4.16)
where w∗′
known is a sub-matrix of the projection matrix, w∗′, formed by selecting only
columns corresponding to known information at instant kc. Similarly, µx,known and
σx,known are respectively the mean and standard deviation values corresponding to the
known information. Note that for all three of these matrices, their contents depends
on kc and therefore is time-dependent. Once t has been calculated, the predicted
output trajectory is given by:
[y[kc + 1] · · · y[kf ]
]= tP′unknown (4.17)
Where Punknown is a submatrix of the loadings matrix, P. Once again, the contents of
the submatrix P is time dependent. By substituting equation 4.16 into 4.17, the over-
all model is a time-varying linear combination of time-indexed past outputs, inputs,
104

Ph.D. Thesis - Brandon Corbett McMaster University - Chemical Engineering
and the candidate input trajectory.
The advantage of using time-dependent models for batch processes is that they
provide a way to account for nonlinear batch behavior. Batches that are initialized
consistently from the same initial conditions will follow the same state-trajectories. In
this case, a time dependent model is capable of capturing the dynamic behavior of the
process because at corresponding batch times, the process is at corresponding states
and therefore has corresponding dynamic behavior. However, for batches that are
initialized from a range of initial conditions, the state-trajectories do not correspond
for corresponding times. More importantly, the time indexing then necessitates the
training of the model from batches of equal length (or necessitates the search for an
alignment variable).
4.5 Subspace Quality Model Predictive Control
(SQMPC)
In this section we present a novel data-driven model predictive control scheme for
batch quality control. The model building approach combines subspace identification
to obtain a dynamic model and principal component regression (PCR) to relate pro-
cess states and product quality. Together, these two models provide a causal model
relating a candidate input trajectory to the resulting quality. The section is orga-
nized as follows: first, we will present an adaptation of subspace identification for
105

Ph.D. Thesis - Brandon Corbett McMaster University - Chemical Engineering
batch processes that allows its application for batch data. Next, we will discuss the
use of PCR to relate state and quality. Finally, we will demonstrate how the resulting
models can be incorporated in a model predictive control scheme to directly control
product quality.
4.5.1 Subspace Identification of Batch Dynamics
In this subsection we present an adaptation of subspace identification for batch pro-
cesses. Out of the wide variety of subspace algorithms, one commonality is the rear-
rangement of training data into Hankel matrices. In order to use subspace identifi-
cation for batch processes, the formation of the Hankel matrices from training data
has to be carefully considered. In order to understand the necessary modifications,
we first consider the form of training data for subspace identification of continuous
processes. To carry out subspace identification for a continuous process, the process is
first brought to the desired steady-state condition. Next, perturbations (for example
by PRBS) are made to the inputs over some duration of time. These inputs and
the corresponding outputs form a contiguous block of data. The appropriate Hankel
matrices for a given subspace identification algorithm can be readily formed from this
contiguous block of data in the manner presented in the preliminaries section.
In contrast to continuous processes, batch processes, by their very definition, do
not possess meaningful steady-state conditions around which to identify a model.
Instead, the objective is to develop a model for the transient dynamic behavior of the
106

Ph.D. Thesis - Brandon Corbett McMaster University - Chemical Engineering
process. To achieve this, the entire range of dynamic behavior for which a model is
desired must be present in the training data. This can be partially accomplished by
using data from the complete duration of a batch. However, owing to the variation
in initial conditions, it is unlikely that any single batch (even with experimental
augmentation) would cover the range of operating conditions necessary to build a
reliable, general model. This motivates the need to include multiple batches in the
training data. However, since each batch is independent of the batches before or after
it, this results in a database with multiple contiguous blocks of data rather than one
single contiguous block. One approach would be to build separate Hankel matrices
for each of these blocks and then modify the chosen subspace identification algorithm
to incorporate the multiple batches. In this work, however, we took the simpler
approach of modifying the form of the Hankel matrices themselves. This approach
has the benefit of maintaining generality so that any subspace identification algorithm
can be applied without further modification.
To incorporate multiple independent blocks of training data, corresponding to
multiple batches, we horizontally concatenate Hankel submatrices formed from each
block. Consider the notation y(b)[k] for the vector of output measurements where the
superscript, (b), denotes the database batch index and k denotes the sampling instant
(indexed from batch initiation). Then the Hankel submatrix for any batch b is formed
107

Ph.D. Thesis - Brandon Corbett McMaster University - Chemical Engineering
as:
Y(b)1|i =
y(b)[1] y(b)[2] · · · y(b)
[j(b)]
......
...
y(b)[i] y(b)[i+ 1] · · · y(b)[i+ j(b) − 1
]
(4.18)
Once the sub-matrices have been formed for each batch, they can be concatenated to
form the overall Hankel matrix as follows:
Y1|i =
[Y
(1)1|i Y
(2)1|i · · · Y
(B)1|i
](4.19)
where B is the number of batches in the training data. Hankel matrices of input
data can be formed in exactly the same fashion. The resulting matrices elegantly
handle the blocks of data corresponding to independent batches while maintaining
the properties required for subspace identification.
Remark 13 Notice that in equation 4.18 the final time index j is indexed itself by
b. This is an important and valuable distinction of the proposed method. The index j
corresponds to the final sampling instant at which there is sufficient past and future
data to fulfill the required lag structure. In this way the value of j reflects the length of
the batch. Because the Hankel matrices for each batch are concatenated horizontally,
only the number of rows in each submatrix need to match. In other words, the number
of columns can vary for each submatrix corresponding to each batch. Therefore, the
length of each batch in the training data can be different. This is markedly different
from time-dependent models that inherently need training batches of equal length (or
108

Ph.D. Thesis - Brandon Corbett McMaster University - Chemical Engineering
aligned to have equal length).
The proposed form of the Hankel matrices is permissible because it maintains the
row-space structure of the traditional form. Specifically, the row spaces of the Hankel
matrices Y1|i and Yi+1|2i still share a common basis related to the state of the system
at time i. Subspace algorithms determine viable states by exploiting this property of
the row space. If instead the Hankel matrix was constructed by first concatenating
the outputs from each batch, the discontinuity between batches would violate the
row space relationship in the corresponding columns in the Hankel matrix. Because
the proposed form of the Hankel matrices preserves the row-space relationship, any
desired subspace identification algorithm can be applied without modification.
Remark 14 It is well recognized that a common characteristic of industrial batch
processes is sparsity of available measurements. This sparsity does not hinder the
application of the subspace identification methods due to unobservability limitations
since by construction the LTI system that is identified is naturally observable. The key
implication of limited measurements is if they prohibit the identification of a system
structure with (the entire set of) states that impact the final product quality. That,
however, would be a fundamental limitation of the process instrumentation, and no
other approach would be able to capture the process quality from the available measure-
ments either. The construction of the quality model in the proposed approach readily
allows diagnosis of a problem with measurement sparsity and can be used to motivate
improved instrumentation. The response of the proposed method to sparse measure-
109
Ph.D. Thesis - Brandon Corbett McMaster University - Chemical Engineering
ments is demonstrated in the subsection on quality model fitting in the simulation
study later in this paper.
Remark 15 Many subspace identification methods make an assumption about the
stationarity (or quasi-stationarity) of the processes. These assumptions are impor-
tant when the identified model structure is a combined deterministic-stochastic model.
In these cases, stationarity has an important impact on the stochastic part of the iden-
tified model. While the current work could readily be extended to utilize a combined
deterministic-stochastic model, the current focus is on deterministic subspace identi-
fication methods for which stationarity is not a concern. Therefore, discussion of the
stationarity of the unfolded training data will be postponed to future work, and instead
the applicability of the proposed approach demonstrated through application.
The result of subspace identification is a single, linear, time-invariant model of the
form presented in equations 4.9 and 4.10. For clarity we will refer to the identified
dynamic model using the following nomenclature:
x[k + 1] = Ax[k] + Bu[k] (4.20)
y[k] = Cx[k] + Du[k] (4.21)
Where the subspace state is denoted as x to avoid confusion with x which represents
the first-principal states from the process equations 4.1 to 4.3.
To some readers, the linear form of equations 4.20 and 4.21 will seem incongruent
110

Ph.D. Thesis - Brandon Corbett McMaster University - Chemical Engineering
with the emphasis placed on the unavoidable, inherent nonlinearity of batch systems.
Indeed the nonlinear dynamics of batch processes when expressed in terms of mean-
ingful process variables (such as concentrations and temperature) is an important
consideration in batch processes. However, there is no meaningful time-invariant way
to linearize a nonlinear representation of the process. Consider that a first princi-
ples model of the form of equations 4.1 to 4.3 was available (note that the present
formulation does not require knowledge of this model), in terms of the original state
variables, x. Since the process is inherently transient, any selected center (state) of
linearization is departed quickly rendering the linearization around that point useless.
The key distinction of the proposed approach is that we are not linearizing an
existing nonlinear state-space model. Instead, we are identifying model parameters
for a LTI model that describes the evolution of the process outputs. This is fun-
damentally different from linearizing a nonlinear representation because the system
order is determined during the identification. One of the reasons that subspace meth-
ods have been met with such success is their ability to determine system order as a
first step of the identification. Specifically, the system order is determined based on
the order needed to adequately describe the dynamics observed in the data. It is a
well known result that any discrete series can be exactly represented in the frequency
domain in a finite number of frequency bands using a discrete Fourier transform. It
follows that a finite number of observations can be represented exactly by LTI with a
finite system order. Obviously, an exact fitting of the data would result in dramatic
111

Ph.D. Thesis - Brandon Corbett McMaster University - Chemical Engineering
over-fitting. Fortunately, LTI models identified by subspace methods fit states in an
order that maximizes the amount of variance explained by each new state. Therefore,
it is practicable to fit LTI models of a reasonable order that adequately predict the
evolution of the process over an appropriate region in state space.
Remark 16 Clearly, the system order is of particular importance for fitting an LTI
model to batch data. In subspace identification, the system order is often selected such
that the explained variance falls above a specified threshold. This threshold is a key
modeling parameter and is especially important given the potentially high-order models
needed to explain transient batch behavior. One robust threshold selection method is
to test the predictive ability of the resulting dynamic model on validation batches.
Doing this, the threshold should be set at the value which minimizes the prediction
error for the validation batches. The primary downside to this approach is the need
to set aside valuable training data to use instead for validation. One solution to
address this problem would be the use of cross-validation however, this approach was
not implemented in this work. Better methods for determining the explained variance
threshold will be the topic of future work.
The identified model provides a theoretically sound way to predict the evolution
of the process outputs (and the associated states) for a candidate input trajectory. In
order to be useful for quality control, a model between the subspace states and the
final quality must be determined. In the next subsection, we will present a method
for modeling this relationship.
112

Ph.D. Thesis - Brandon Corbett McMaster University - Chemical Engineering
4.5.2 PCR Quality Model
In the last subsection, we demonstrated that subspace identification can be used to
obtain a LTI dynamic models from batch data. In this subsection, we motivate and
present a modeling approach for relating subspace states, x, to batch quality. The
key idea in building this model can be described in two logical steps. First, since both
the subspace states, x, and the first principles states, x capture the instantaneous
condition of the process, there must be a direct relationship between x and x. Next,
since quality is known to depend on process state, as described by equation 4.3, there
must be a causal relationship between x and quality. In this subsection, we will
present a method for first obtaining state estimates (we utilize a Luenberger observer
for the purpose of illustration), then relating the terminal state of the batch to quality.
The first step in the proposed quality model methodology is to estimate the sub-
space states x at the end of each training batch. One of the intermediate results of
subspace identification is a vector of state estimates for the training data. However,
this vector does not contain states corresponding to the last sampling instant in each
batch because lagged future outputs are needed to obtain each state. Furthermore,
the state estimates obtained during subspace identification are based on a limited
number of lagged past and future outputs. To build an accurate quality model, we
require the best possible terminal state estimate, ˆx[kf ], obtainable from the complete
trajectories of measured inputs and outputs.
To obtain an estimate of the terminal subspace state for model building, ˆx[kf ],
113

Ph.D. Thesis - Brandon Corbett McMaster University - Chemical Engineering
a Luenberger observer is used. The observer can easily be designed based on the
identified model such that the state estimates converge after being updated with
measurements from the beginning of the batch. By updating the observer with outputs
from the duration of the batch, the best possible estimate of x[kf ] is obtained. By
repeating this procedure, terminal subspace state estimates for each training batch
are obtained. These estimate are then used in the next stage of building the quality
model.
Once estimates of the terminal subspace states are obtained, what remains is to
identify the correlation between these states and quality. In this work we use principal
component regression (PCR) for this task. As discussed in the preliminaries, PCR is a
method for regressing observations X onto dependent variables Y. In this application
the X and Y blocks take the following form:
X =
[ˆx(1)[k
(1)f
]· · · ˆx(B)
[k
(B)f
]]T(4.22)
Y =
[q(1) · · · q(B)
]T(4.23)
where kf is the final sampling instant. After completing PCR, the quality model takes
the linear form:
q = Qˆx[kf ] + cq (4.24)
where Q is a matrix of model coefficients and cq is a vector of constants. Using
this linear relationship, any terminal subspace state estimate can be used to predict
114

Ph.D. Thesis - Brandon Corbett McMaster University - Chemical Engineering
quality.
Remark 17 Note that in equation 4.22, kf is indexed by batch. This is to denote the
fact that there is no necessity for batches to share the same length (be aligned) using
this method. Any miss-match in batch length is elegantly and appropriately dealt with
by the Luenberger observer. This reflects our understanding that quality is determined
by state and therefore should not be dependent on time. Taken together, both the dy-
namic and quality modeling are independent of batch duration meaning that the overall
modeling approach is equally valid for training data with miss-matched batch length.
There is no need to address the alignment problem. This is particularly beneficial
because available historical operation data often contains batches of varying lengths,
and a monotonically behaving ‘alignment’ variable might not be readily available.
Remark 18 PCR is used to build the quality model to address correlation in the X
space, or equivalently states that appear correlated. In principal, all states identified
by subspace identification are independent. Therefore, one might think that there
is no correlation in the X space of this regression. However, while the states are all
uncorrelated, it might be possible that the existing batches evolve in a manner where by
the end of the batch some states may be correlated. In this case, using PCR improves
the performance of the identified model as opposed to models built using ordinary least
squares (OLS) regression. In the case where there is no correlation in the terminal
states, PCR will identify the same model as OLS so there is no loss of generality.
115

Ph.D. Thesis - Brandon Corbett McMaster University - Chemical Engineering
4.5.3 SQMPC - Formulation
In the previous two subsections we described procedures for identifying a dynamic
model and quality model from batch data. When combined, these two models provide
an overall, causal model of batch quality. In this subsection, we first demonstrate the
manner in which these models can be used to make quality predictions based on
available process measurements and a candidate input trajectory. Next, we present a
model predictive control (MPC) formulation that uses these models to directly control
batch quality.
For any point in time sufficiently after the initiation of a new batch, the problem
of predicting final quality for a candidate input trajectory is addressed as follows:
At batch initiation, the Luenberger observer from the quality model development is
initialized. As the batch progresses, the observer is updated with each new output
measurement. Convergence of the observer is indicated by the innovation term. Once
the innovation has fallen below a selected threshold, the state estimate is considered
converged and quality predictions can commence.
To make a quality prediction from the available models, first the terminal subspace
state for the batch must be determined. Naturally, the terminal state depend on both
the latest estimated state of the process and the future inputs, and can be computed
by using the identified dynamic model, written succinctly as:
ˆx[kf ] = Akf−k ˆx[k] +
[Akf−k−1B Akf−k−2B · · · B
]v[k] (4.25)
116

Ph.D. Thesis - Brandon Corbett McMaster University - Chemical Engineering
where k is the current sampling instant, kf is the final sampling instant in the batch,
and the vector v[k] contains the candidate input trajectory for the remaining batch
duration:
v[k] =
u[k]
u[k + 1]
...
u[kf − 1]
(4.26)
From this terminal state estimate we next use the quality model to predict the result-
ing quality. Specifically:
q = Qˆx[kf ] + cq (4.27)
Where Q and cq are the model coefficients from the quality model identification.
Direct quality control can be achieved by (in some sense) inverting the relationship
between candidate input trajectory and quality described by equations 4.25 and 4.27.
One way to carry out this inversion, which provides a number of practical benefits, is
to formulate the problem in a shrinking-horizon, model predictive control framework.
Mathematically, this approach takes the form of a quadratic programming problem
117

Ph.D. Thesis - Brandon Corbett McMaster University - Chemical Engineering
defined by:
minv[k]
(q− qd)T M (q− qd) + (∆v[k])T P (∆v[k]) (4.28)
s.t. q = Q
(Akf−k ˆx[k] +
[Akf−k−1B Akf−k−2B · · · B
]v[k]
)+ cq (4.29)
∆v[k] =
u[k]
u[k + 1]
...
u[kf − 1]
−
u[k − 1]
u[k]
...
u[kf − 2]
(4.30)
vmin[k] ≤ v[k] ≤ vmax[k] (4.31)
where qd is the desired quality (ie quality set-point). The first term of the objective
function penalizes deviations of the projected quality from the desired quality and the
second term penalizes large input moves. More specifically, M is a positive definite
(diagonal) matrix where each diagonal element sets the penalty for the corresponding
quality variable. P is also a positive definite (diagonal) matrix where diagonal ele-
ments set the penalty on input moves for the corresponding sampling instant. The
first constraint of the problem enforces the dynamic and quality model (arrived at by
substituting equation 4.25 into 4.27). The second constraint defines the input move-
ment and the third constraint applies hard bounds on the input trajectories based on
process constraints.
The application of the proposed MPC is carried out as follows: first, in the begin-
118

Ph.D. Thesis - Brandon Corbett McMaster University - Chemical Engineering
ning of the batch, the Luenberger observer is initialized with an arbitrary state value.
In the beginning of the batch, a nominal, open-loop input trajectory is applied. Since
input movements in the beginning of the batch have less impact on quality than those
at the end, applying an open loop input trajectory early on in the batch has little
impact on the ability to reach the desired quality. As each measurement becomes
available the Luenberger observer is updated. Once the innovation term of the Luen-
berger observer falls below a threshold, the state estimate is considered converged and
the model predictive control is switched on. At the first MPC sampling instant, the
optimization is initialized with the nominal input trajectory. The solution of the first
MPC calculation is a complete input trajectory for the remainder of the batch. At the
next sampling instant, the first input in the candidate trajectory is implemented and
the MPC is recomputed with the updated state estimate. This procedure is repeated
for the remainder of the batch.
Remark 19 One of the primary advantages of the proposed MPC is that the required
optimization is a convex, quadratic-programming problem. This class of problems can
be efficiently and quickly solved to a global optimal solution. This is in contrast to
many batch MPC approaches which require the solution of a non-linear programing
(NLP) problem at every sampling instant. NLP solvers can be slow to converge on a
solution and global optimality is generally not guaranteed.
Remark 20 The proposed MPC incorporates a feedback mechanism through its inclu-
sion of the latest state estimate. As the process progresses and the state estimate is up-
119

Ph.D. Thesis - Brandon Corbett McMaster University - Chemical Engineering
dated, if the state estimate does not follow the projected trajectory (due to plant-model
miss-match, noise, or disturbances), the candidate input trajectory will be updated to
respond to the latest measurements. Another nice feature of the MPC design is that as
the batch progresses, the model accuracy improves. The improvement is resultant of
the shortening prediction horizon. At the same time, as the prediction horizon shrinks,
larger input moves are necessary to obtain the desired quality. The naturally arising
combined effect of increasing model accuracy concurrent with increasingly aggressive
input moves yields a stabilizing effect on the resulting quality; as the predictions get
better, more aggressive but also more appropriate input moves are prescribed. The
improved model available toward the batch termination benefits the accuracy of the
final set of control moves that are implemented, which in turn significantly affect the
final quality. This can be understood by recognizing that there could be multiple paths
from the initial set of states to the final desired (in that they yield the desire quality)
states. The initial input moves influence which path is taken, and (as long as this
path does not lead to a set of states from where the final quality becomes unreachable),
the final set of control moves eventually determine the proximity to the target states.
Remark 21 In the literature on batch MPC it is common to limit MPC calculation
to a few predefined decision points [30, 29]. The motivation for these limited decision
times is to avoid unnecessary excitation of the process. While the proposed approach
could be easily adapted to implement decision points, we choose instead to carry out
control calculations at each sampling instant. There are two reasons for this decision.
120

Ph.D. Thesis - Brandon Corbett McMaster University - Chemical Engineering
First, it allows the incremental feedback from each new measurement to be immediately
acted upon for quick disturbance rejection. Second, since these decision points are
triggered by reaching a specified elapsed time from batch initiation, the use of decision
times inherently introduces a time dependence on the modeling and control approach.
Note that one of the key contribution of the present work is the design of a model based
on a state space perspective, and avoiding explicit time dependence. One elegant way
to incorporate some of the positive aspects of the decision time approach would be
to calculate a new input trajectory at every sampling instant (thus incorporating the
frequent feedback) but only update the input trajectory if a ‘large enough’ change in
the calculated input trajectory occurs.
Remark 22 In addition to hard constraints on the inputs, the projected state tra-
jectories calculated in each sampling instant of the proposed MPC allow for the im-
plementation of output constraints as well. Specifically, the output trajectory can be
calculated from the projected state trajectory through the identified C matrix. In a
traditional sense, the ability to add output constraints is important for safety critical
process variables (ie reactor temperature). However, applying output constraints is
also a viable way to prevent the controller from extrapolating too far from the process
operations in the training data.
121

Ph.D. Thesis - Brandon Corbett McMaster University - Chemical Engineering
4.6 Application to the PMMA process example
In this section we compare traditional PI trajectory tracking, a simple implementa-
tion of LVMPC, and the proposed SQMPC for quality control. To this end, each of
the aforementioned control approaches is implemented on a simulation of the PMMA
process previously described. The section is organized as follows: in the first subsec-
tion, we discuss the training database to be used in model identification. Next, we
use the training data to fit a state-space dynamic model using subspace identifica-
tion. Subsequently, a second model is identified relating the terminal states of the
system and the resulting quality. The following subsection presents the closed loop
results from the proposed approach and compares the results to those obtained using
a nominal implementation of LVMPC and PI trajectory tracking.
4.6.1 Database Generation
The first step in this simulation study was to generate a database of batch data for use
in model identification. This database is used in both the LVMPC approach and the
proposed SQMPC and is comprised of complete input and output trajectories as well
as the resulting quality measurements. The objective in the database development
was to mimic the data that would be available in an industrial setting. To this end,
a modest database of 17 historical and identification batches was developed (note
that the batches were not of equal duration). Each of these batches was initialized
from initial conditions with natural variations (as previously described). White noise
122

Ph.D. Thesis - Brandon Corbett McMaster University - Chemical Engineering
Table 4.2: Summary of training database composition
Input policy Number of batches
Historical batches (PI trajectory tracking) 9PRBS added to PI set-point trajectory 3PRBS added to nominal input trajectory 5
Total batches 17
signals of appropriate magnitude were added to all simulated output measurements
to simulate measurement noise. Table 4.2 summarizes the composition of the training
database for reference.
In order to simulate historical data, nine batches operated under PI trajectory
tracking control (as described previously) were included. In addition to historical
batches, eight identification batches were included in the training database. These
were batches with inputs designed to excite the system so that the causality between
inputs and outputs could be observed. Of the eight identification batches, three identi-
fication batches were generated by adding a pseudo-random, binary sequence (PRBS)
signal to the set-point trajectory of the PI controller. This method of introducing an
identification signal provides the benefit that, since the batch is still in closed loop,
the deviation from normal operations is small. This is beneficial for two reasons, first
the observed behavior is similar to what is expected for a normal batch. Second, the
resulting product may still be usable which minimizes the cost of the experiment.
The primary disadvantage of this type of identification batch is that the input is still
dependent on the output. For this reason, the remaining five identification batches
were operated in open loop. In these batches, the input was created by adding a
123

Ph.D. Thesis - Brandon Corbett McMaster University - Chemical Engineering
PRBS to the nominal process input. These batches provide the necessary indepen-
dence between inputs and outputs for subspace identification. However, they may be
costly because the open-loop operation may lead to off-spec product.
Remark 23 In the current work, we included open loop identification batches to sat-
isfy the subspace identification requirement for independence between input and output
measurements. This approach was chosen in order to simplify the model identifica-
tion task. However, a large body of literature exists addressing subspace identification
from closed loop data [52, 53, 44, 54], and can be readily used as part of the proposed
framework.
Remark 24 While white noise was added to simulated output measurements, we as-
sumed the availability of noise free quality measurement. Of course, in practice there
will always be some noise in this type of measurement. The motivations for this
assumption are twofold. First, measurement of quality is typically done off-line in
a laboratory. The analytical ability in such settings is significantly better than that
available from online sensors. Furthermore, repeated measurements can be made to
improve the quality measurement. Future work will address the situation where this
assumption is relaxed (necessitating a more stochastic approach to quality prediction
and control).
Figure 4.4 plots three selected input trajectories representative of the three input
policies used in the training database. All three input trajectories follow the same
124

Ph.D. Thesis - Brandon Corbett McMaster University - Chemical Engineering
0 0.2 0.4 0.6 0.8 1 1.2 1.4 1.6 1.8 2 2.2 2.4 2.6 2.8 3 3.2 3.4 3.6 3.8 4
334
335
336
337
338
339
340
341
Time (hr)
Jacket
Tem
perature
(K)
Figure 4.4: Selected representative examples of the three input policies used in thetraining batches: nominal input plus PRBS (dotted line), PI with set-point trajectoryshifted by PRBS (dot-dashed line), and traditional PI trajectory tracking (solid line).
general trend but each policy provides a different level of information pertaining to
the process dynamics. In the next subsection, we discuss building a dynamic model
from this training data using subspace identification.
4.6.2 Dynamic model fitting
The input and output trajectories from the training database described in the previous
subsection were used to identify a dynamic process model. To this end subspace
identification was applied as previously described. First the data was unfolded into
the appropriate Hankel matrices as in equation 4.19. As previously mentioned , one
of the key modeling decisions in subspace identification is the number of rows to use
125

Ph.D. Thesis - Brandon Corbett McMaster University - Chemical Engineering
in the Hankel matrices. In this simulation study, we experimented with the number of
Hankel rows to gage the effect on the resulting model. A range of values between 10
and 25 was tested. To evaluate the effect, the resulting models were used to predict the
dynamic evolution of a large set of validation batches. In general, we found that the
resulting models were insensitive to the number of Hankel rows. From a theoretical
perspective, this makes sense because adding “extra” Hankel rows does not increase
the rank of the Hankel matrix since the additional observations are dependent on
the prior observations. For the present applicaiton, 15 Hankel rows were utilized for
building our final model.
The other key model fitting parameter, as described in the previous section, was
the threshold for explained variance. Similarly to the choice of number of Hankel
rows, we experimented with different threshold values and used the validation data to
determine the best value. First of all, because of the order in which subspace states
are fit to the data, each subsequent state is more susceptible to noise. In this regard,
choosing to high a threshold, and correspondingly a high system order, results in
over fitting and a reduction in the predictive ability for validation data. In contrast,
selecting a low threshold results in meaningful dynamic behavior in the data being
unmodeled and also results in poorer predictions of the validation data. Note that a
parallel result to this logic is that too much noise in the outputs masks meaningful
trends in the data and prevents the identification of a model of appropriate order.
Thus a threshold resulting in nine states was selected. With the modeling parameters
126

Ph.D. Thesis - Brandon Corbett McMaster University - Chemical Engineering
defined, the dynamic model was identified and validated.
The identified dynamic model was validated by checking its predictive ability for
a set of validation batches. Recall that the relationship between the subspace states,
x, and the process states, x, is unknown. Furthermore, the process states are un-
measured. As a result, there is no point of comparison to validate the evolution
of the subspace states directly. Instead, the best practicable validation method is
comparison of output predictions. For a new validation batch however, the initial
subspace state and corresponding output predictions, are unknown. Therefore, the
following validation approach was taken: first, the Luenberger observer was updated
with process measurements from the beginning of the validation batch. At a sample
instant well after the convergence of the observer (as determined by the innovation),
the current state estimate was used as the initial condition to predict the state trajec-
tories corresponding to the input for the remainder of the batch. The resulting state
trajectories were then used to predict outputs by multiplication with the identified
C matrix. This predicted output trajectory was then compared with the measured
output trajectory to evaluate the fit of the dynamic model.
Figure 4.5 demonstrates the described validation procedure for a validation (ie
not in the training data) batch. In the beginning of the batch duration, the conver-
gence of the Luenberger observer is apparent. Visually, the outputs corresponding to
the state estimates converge after about half an hour of output measurements. To
guarantee convergence, we continue updating the observer until it has been updated
127

Ph.D. Thesis - Brandon Corbett McMaster University - Chemical Engineering
0 1 2 3 4 5
334
336
338
340
342
Time (hr)
Tem
perature
(K)
0 1 2 3 4 5
−8
−6
−4
Time (hr)
Log
Viscosity
0 1 2 3 4 5900
920
940
960
980
Time (hr)
Density
Figure 4.5: Validation of the dynamic model by comparison of output trajectoryprediction for a validation batch: output corresponding to subspace states estimatedby updating the luenberger observer (solid line), outputs predicted by the dynamicmodel from the converged state estimate (dot-dashed line), actual output (dottedline).
with two hours worth of measurements. Then, using the current state-estimate as an
initial condition, the dynamic model is used to predict the output trajectory from the
remaining input profile. Clearly, the predicted output trajectory closely follows the
true evolution of the process. This demonstrates that the dynamic model effectively
captures the dynamic behavior of the process.
Remark 25 To attenuate the effect of noise on the identified model, a first-order
128

Ph.D. Thesis - Brandon Corbett McMaster University - Chemical Engineering
filter was applied to the output measurements. The smoothing factor for this filter was
selected to be high enough to visually reduce noise while not introducing significantly
delayed response. This filter was also applied to output measurements before passing
them to the proposed SQMPC. To provide an unbiased comparison, the filter was
additionally applied to output measurements before they were used in the benchmark
LVMPC and PI control.
4.6.3 Quality model fitting
Having identified the dynamic model, next a quality model was identified as previously
described. Recall that the quality objective for the PMMA process is to reach the
desired weight and number average molecular weight. To this end, the quality model
should relate the subspace states from the dynamic model identified in the previous
subsection to these variables. In addition to the molecular weight distribution, another
important quality variable for PMMA polymerization is the overall conversion at the
end of the reaction. To reflect this, conversion was included as an additional quality
variable and was also related to the subspace states. The first step in building the
quality model was to design a Luenberger observer.
The performance of a Luenberger observer is parameterized by the location of the
observer poles. By placing the poles appropriately, the convergence properties of the
observed states can be designed. In this work we choose to place the observer pole
for each state on the real axis in the neighborhood of 0.66 (specifically, poles were
129

Ph.D. Thesis - Brandon Corbett McMaster University - Chemical Engineering
placed at uniformly distributed random locations between 0.66 and 0.67 because it is
not mathematically realizable to place all poles at exactly the same position) . This
value was chosen by observing the convergence of the outputs corresponding to state
estimates for validation data. Specifically, the value was selected so that the response
was stable (poles were within the unit circle) and converged quickly but remained
robust to noise.
Next, the Luenberger observer was used to determine the terminal subspace states.
As previously described, this was achieved by updating the observer with the output
measurements (temperature, density, and log viscosity) for each batch in the training
data over its entire duration. The final state estimate for each batch taken as that
batch’s terminal subspace state.
Having obtained terminal subspace states, regression was used to relate the state
estimates to the quality measurements in the training data. As noted in the pre-
vious subsection, the dynamic model we identified had nine states. These states in
conjunction with the dynamic model were demonstrated, by validation, to provide
a good description of the dynamic evolution of the outputs. However, as previously
mentioned, each subsequent state in the identified model is increasingly sensitive to
noise. When we examined evolution of the state estimates for the validation data,
we observed this effect to be particularly pronounced for the last five states of the
identified system. While we were able to verify that these states provided meaningful
contributions to modeling the dynamic process, we found that the last five states had
130

Ph.D. Thesis - Brandon Corbett McMaster University - Chemical Engineering
a significantly lesser importance in predicting quality. In fact, in some cases the high
level of noise in these states diminished predictive ability of the model. Therefore, we
decided to build our quality model only on the first four states of the process.
Remark 26 In general, we propose using PCR to relate subspace states and quality.
As noted earlier, the use of PCR is particularly important when the terminal subspace
states are correlated. In this study, however, the four states that we used to build our
quality model were not correlated. In this case, PCR is equivalent to using ordinary
least squares regression.
Figure 4.6 is three scatter plots showing the impeccable ability of the model in
predicting quality for 70 validation batches. Specifically, the x data for these plots is
the actual quality and the y data are the qualities predicted. Datum points falling
on the plotted 45 degree line represent accurate prediction. This result validates the
overall methodology of using subspace states to capture the process condition and
explain quality.
Remark 27 As previously mentioned, one common characteristic of batch processes
is sparsity of available process measurements. To demonstrate the response of the
proposed method to sparse measurements we repeated both model fitting steps but in-
stead of using the three process outputs from before, we only considered temperature
measurement. In doing this, the number of observable states identified in the subspace
identification step fell from 9 to 3. The quality model was built as before. Quality
131

Ph.D. Thesis - Brandon Corbett McMaster University - Chemical Engineering
0.65 0.7 0.75 0.8
0.65
0.7
0.75
0.8
Actual Conversion (%)
PredictedCon
version(%
)
0.8 0.9 1 1.1
·105
0.8
0.9
1
1.1
·105
Actual MN
PredictedM
N
1.4 1.5 1.6 1.7 1.8 1.9
·1051.4
1.5
1.6
1.7
1.8
1.9
·105
Actual MW
PredictedM
W
Figure 4.6: Quality model predictions for 70 validation batches using terminal state-estimates obtained by updating a Luenberger observer with output measurementsfrom the duration of the batch
132

Ph.D. Thesis - Brandon Corbett McMaster University - Chemical Engineering
predictions for the same 70 validation batches as the training data are shown in Fig-
ure 4.7. Note that, while the quality predictions are less accurate, the resulting model
still has a reasonable predictive ability. This demonstrates the capacity of the proposed
method to elegantly use the information identifiable from sparse measurements.
4.6.4 Closed loop results
In the previous two subsections we utilized the proposed modeling methodology to
fit a dynamic model and a quality model for the PMMA process. In this subsection,
we will present results obtained by applying the identified model in the proposed
SQMPC. First we will discuss implementation and tuning aspects of the approach.
Our discussion of the closed loop results will be presented in two parts. In the first
part we will demonstrate the “regulatory” ability of the control design: in other words,
its ability to reject disturbances and drive the process to the nominal condition from
the training data. In the second part, we will demonstrate the “set-point tracking”
ability of the control design. Specifically, we will demonstrate the ability of the
controller to drive the process to a quality set point that differs significantly from
that of the nominal batch. Note that in both of these cases we will use the same
tuning and implementation. The only difference from an implementation perspective
is the selection of the quality set-point.
Once the required models are identified, implementation and tuning of the pro-
posed SQMPC is straightforward. Because the models effectively capture and char-
133

Ph.D. Thesis - Brandon Corbett McMaster University - Chemical Engineering
0.65 0.7 0.75 0.8
0.65
0.7
0.75
0.8
Actual Conversion (%)
PredictedCon
version(%
)
0.8 0.9 1 1.1
·105
0.8
0.9
1
1.1
·105
Actual MN
PredictedM
N
1.4 1.5 1.6 1.7 1.8 1.9
·1051.4
1.5
1.6
1.7
1.8
1.9
·105
Actual MW
PredictedM
W
Figure 4.7: Quality model predictions for the same 70 validation batches as the basecase but using only temperature measurement demonstrating the robustness of theapproach to sparse measurements
134

Ph.D. Thesis - Brandon Corbett McMaster University - Chemical Engineering
acterize the behavior of the process, tuning the SQMPC is an intuitive procedure.
This is particularly true when compared to other batch control methods, such as gain
scheduling, where the tuning itself takes on the primary role in accounting for the
dynamic behavior of the batch. Recall from its definition that the proposed SQMPC
depends on two tuning matrices. These matrices, M and P both have intuitive mean-
ing in terms of the process. Specifically, M penalizes deviations of the predicted
quality from the set-point and P penalizes large input moves.
Remark 28 When the quality model is fit, the first step in the PCR modeling proce-
dure is to scale both the X and Y space to be centered with unit variance. We refer
to the centered and scaled values as being in the scale space. When implementing
SQMPC there are two options: either the predicted quality variables can be rescaled to
measurement space or the set-point can be correspondingly scaled to scale space. Both
options are mathematically equivalent in terms of the solution to the optimization
problem but leaving the quality predictions in scale space has the advantage that the
penalty matrix, M, has a more interpretable meaning. Specifically, because the quality
variables are scaled to have unit variance, each of the penalties, mi, directly represents
the relative importance of meeting that quality set-point. For instance, setting all of
the diagonals to the same value would apply equal weighting to every quality. Setting
mi = 2mj applies twice as much weight an meeting the ith quality as it does on meet-
ing the jth. For this reason, in this study we choose to keep the quality predictions in
the scale space.
135

Ph.D. Thesis - Brandon Corbett McMaster University - Chemical Engineering
In the PMMA process we have considered three qualities: number average molec-
ular weight, weight average molecular weight, and conversion. Correspondingly, the
M matrix is a three-by-three diagonal matrix with entries m1, m2, and m3. To tune
these values, we started with all three penalties equal to one then adjusted the values
based on our observation of the closed loop results for a small number of batches. Our
final tuning was m1 = 187, m2 = 58, and m3 = 9.2 where m1, m2, and m3 correspond
to the weights on number average molecular weight, weight average molecular weight,
and conversion respectively.
The other tuning parameter is the penalty on input moves, P. The individual
diagonal elements of P represent the penalty on input moves for each corresponding
sampling instant. Due to the shrinking horizon nature of the MPC, the dimension
of the P matrix is decremented at each sampling instant. From an implementation
perspective, this necessitates reforming matrix P at every sampling instant as a sub-
matrix of the P matrix from the beginning of the batch. Doing so allows for a penalty
profile to be placed on the input moves of the batch. For instance, higher penalties
could be placed on the beginning of the batch to keep input moves smaller during
that time. However, there is a strong argument to be made for instead using a single,
constant penalty for all sampling instances of the batch. This argument is based on
the desire to avoid introducing unnecessary time indexed elements to the control de-
sign. For this reason, we have chosen to use the same penalty, p1 = 3 for all sampling
instances. (Note that if the system had multiple inputs a constant input penalty
136

Ph.D. Thesis - Brandon Corbett McMaster University - Chemical Engineering
would instead be represented by repeating a vector pc along the diagonal of the P
matrix.)
In addition to the penalty on input moves, hard constraints were applied on the
input at plus and minus 15◦ C from the nominal jacket temperature trajectory. These
bounds simulate limitations on the process arising either from equipment constraints
or operator requirements. These bounds were rarely reached in the presented case
studies. However, further experiments designed to test the behavior of the system
under significantly tighter input constraints demonstrated that the proposed SQMPC
is able to propose input trajectories that respect the input constraints while providing
improved quality. These results are omitted from explicit presentation in the paper
for brevity.
Remark 29 While the training data sets used in the present work are of unequal
length, the closed-loop batches are picked to be of the same length. This is done be-
cause both LVMPC and the proposed SQMPC required knowledge of the batch duration
(which could very well be different for each batch) before the batch starts, so the input
trajectories for that duration can be computed. Thus for fairness of comparison, both
controllers are given the same batch length, and this value is kept the same for all
closed-loop batches. In general, the batch duration could also be a decision variable in
the proposed SQMPC framework. This possibility will be pursued in a future research
study.
137

Ph.D. Thesis - Brandon Corbett McMaster University - Chemical Engineering
Implementation of the SQMPC was carried out in MATLABTM1 using the built
in QP solver to calculate the input move at each sampling instant. The optimization
problem in this work is relatively efficient to solve and global optimality is guaranteed
(see Remark 19 for details). For instance, for the regulation application the solution
of the optimization problem was solved to the global optimal in an average time of
0.0132 seconds (on a 2.40 GHz, Intel, Quad-core, 32-bit machine). The maximum
solution time was 0.2207 seconds. Clearly, these values are far shorter than the 60
second sampling frequency meaning that the controller would be readily operable
online.
All of the closed loop results presented in this section were obtained by applying the
various control approaches to batches initialized from the same 186 initial conditions.
These initial conditions were drawn from the normal distributions used to generate
the training data as previously described. The same set of initial conditions were used
for each proposed method and over both case studies to enable unbiased performance
comparison. The number of batches, 186, was chosen to be sufficiently large to provide
statistically relevant results. The following two cases present these results.
Case 1: Regulatory Control
In the first case study, we consider the problem of rejecting disturbances in initial
conditions to obtain the quality set-point for each batch. Specifically, the set-point
1 c©2015 The MathWorks, Inc. MATLAB and Simulink are registered trademarks of The Math-Works, Inc. See www.mathworks.com/trademarks for a list of additional trademarks. Other productor brand names may be trademarks or registered trademarks of their respective holders.
138

Ph.D. Thesis - Brandon Corbett McMaster University - Chemical Engineering
in this case study is the quality from the nominal batch. The temperature trajectory
for the nominal batch is the set-point tracked by the existing control. Furthermore,
the initial condition for the nominal batch is the mean initial value for all subsequent
batches. Therefore, the existing control is most likely to be effective in reaching
this quality set-point. This choice of set-point is also a meaningful base case for
LVMPC and SQMPC. The base open-loop input and closed-loop set-point trajectory
in the training data for the LVMPC and SQMPC are taken from the nominal batch.
As a result, driving to the nominal quality is the case that is least likely to cause
extrapolation from the training data. For these reasons, this case can be thought of
similarly to the regulation problem in continuous processes where the objective is to
maintain operations at the original set-point in the face of disturbances.
Figure 4.1 shows the PI, LVMPC, and SQMPC input trajectories for a typical
batch. The corresponding output trajectories for this batch are plotted in figure 4.2.
The relative quality errors for the plotted batch are given in table 4.3. Some of the
notable characteristics of the outputs plotted in these figures are consistent with the
general behavior of each of these control methods. First of all, notice that the SQMPC
follows a smooth trend over the duration of the batch. This smoothness is partially
resultant of the input movement penalty. However, even in cases where the input
penalty was dramatically reduced, the input profile tends to remain smooth. Another
characteristic of note is that the SQMPC input follows the same general trend as
the PI throughout the beginning and middle of the batch up to around 2.4 hours.
139

Ph.D. Thesis - Brandon Corbett McMaster University - Chemical Engineering
Table 4.3: Relative error in controlled qualities for characteristic batch plotted infigures 4.1 and 4.2
Number Ave. Mol. Wt. Weight Ave. Mol. Wt. Conversion
SQMPC 0.13% 2.42% 7.90%LVMPC 4.04% 4.74% 4.99%PI 8.97% 8.41% 1.76%
At around 2.4 hours, the SQMPC significantly diverges from the trend of both the
LVMPC and PI inputs. This divergence occurs as quality predictions improve allowing
the SQMPC to take the appropriate corrective action to account for deviations from
the set-point.
Remark 30 SQMPC is able to obtain especially smooth inputs when compared to
other data driven control approaches. This is a direct result of the way the models
are identified. When identifying time indexed models (such as batchwise-unfolded PLS
models), coefficients are identified for each sampling instant from observations at that
sampling instant. Therefore, the number of observations available to identify each co-
efficient is equal to the number of training batches. This small number of observations
reduces the ability to average out the impact of noise on the coefficients. Furthermore,
the effect of the noise on coefficients is time dependent. When applied in closed loop,
the modeled time-dependent noise may be amplified resulting in a jittery input tra-
jectory. In contrast, in the proposed approach, the formation of the Hankel matrices
allows a much larger number of observations to be used in identifying each model coef-
ficient. As a result, noise from the training data can be effectively averaged out. More
importantly, these coefficients are constant at every sampling instant. Therefore, any
140

Ph.D. Thesis - Brandon Corbett McMaster University - Chemical Engineering
modeled noise effects the predictions consistently through time and does not induce a
jittery input trajectory.
Figure 4.3 is a table of histograms showing the distributions of each of the quality
variables for each of the control approaches under case 1. These results demonstrate
the clear gains in control of the molecular weight distribution under the proposed
SQMPC. Specifically, the distributions of both number and weight average molecu-
lar weight are narrowed when compared to the existing PI and LVMPC approaches.
Furthermore, the distributions are centered around the quality set-point. The distri-
bution of conversions suffers slightly under the proposed SQMPC but remains within
acceptable bounds of approximately plus and minus ten percent. The results of this
case study strongly support the efficacy of the proposed SQMPC for disturbance re-
jection. Note that we use only the simplest version of LVMPC for benchmarking
purposes; improved performance with the LVMPC could very well be possible. The
key recognition is the fact that comparable (and in this instance better) performance
is achievable using the proposed approach that does not require the existence of any
alignment variable as with the LVMPC.
Remark 31 While we were tuning the MPC, we found that there was an appar-
ent trade-off between obtaining the desired conversion and molecular weight distribu-
tion. Upon further investigation, we discovered that more than 99.9% of the variance
in the quality measurements from the training data can be explained by two dimen-
sions. While this result is not conclusive proof, it strongly suggests that conversion
141

Ph.D. Thesis - Brandon Corbett McMaster University - Chemical Engineering
and the molecular weight properties cannot be independently controlled. In design-
ing the SQMPC we made the decision to trade off conversion in favor of reaching
the desired molecular weight distribution. This is reflected in the tuning parameters
where conversion has a significantly lower weighting. The decision is justifiable from
an industrial perspective since the molecular weight distribution is the primary defin-
ing property of the product. This explains the reduced performance of the SQMPC in
regulating the conversion.
Case 2: Set-point Tracking
In the previous case, we demonstrated the ability of the proposed SQMPC to reject
disturbances and drive the process to the nominal quality set-point. In this case,
we consider the added complexity of driving the process to a quality set-point that
is markedly different from the qualities observed in the training data. This type of
problem is of particular relevance industrially for processes where there is a desire to
produce multiple grades of product. The set-point tracking ability demonstrated by
the results in this case study also provide evidence for the theoretical integrity of the
proposed method.
The only change from the previous case was the quality set-point of the controller.
All other aspects of both the LVMPC and the SQMPC – including the initial batch
conditions, tuning, models, and filtering – remained unchanged. The new set-point
was selected from an outlier in a large database of historical operations. The reason
for selecting an outlier, instead of inventing a quality set-point, was to ensure that
142

Ph.D. Thesis - Brandon Corbett McMaster University - Chemical Engineering
the new quality set-point was physically reachable. The selected quality set-point was
well outside the range of qualities observed in the training database.
Figure 4.8 is a scatter plot comparing closed-loop, SQMPC qualities for the first 15
batches in case 1 with those achieved by changing the set-point in case 2. For reference,
the corresponding qualities using the existing PI are also presented. Figure 4.9 shows
the resulting quality distributions under SQMPC, LVMPC, and PI control for case
2. Note that since the existing PI control does not directly control quality, there is
no change in the PI results from case 1 to case 2. As with case one, the distributions
clearly demonstrate the efficacy of the proposed method. Of the three control designs
(PI, LVMPC, and SQMPC), SQMPC is the only one with a distribution centered
around the new quality set-point. In fact, none of the LVMPC batches reach the
desired weight average molecular weight. Furthermore, while PI and LVMPC produce
broad distributions, those of SQMPC are only slightly broader then in case 1. It is
also noteworthy that, for this case, SQMPC also produces a conversion distribution
that is broad but centered around the set-point.
Remark 32 The superior set-point tracking ability of the SQMPC results directly
from the fact that the dynamic evolution of the batch is modeled based on state rather
than time. When the operation of a batch differs from those in the training data, the
process states deviate from the trajectories they took in the database. Fundamentally,
the dynamics of the process are dependent on the process sate (as described by equation
4.1). For a time-indexed model therefore, when the process is moved to a new process
143

Ph.D. Thesis - Brandon Corbett McMaster University - Chemical Engineering
0.86 0.88 0.9 0.92 0.94 0.96 0.98 1 1.02 1.04 1.06 1.08 1.1 1.12 1.14 1.16 1.18 1.2
·105
1.5
1.55
1.6
1.65
1.7
1.75
1.8
1.85
1.9
1.95
·105
Figure 4.8: Scatter plot comparing the PI qualities (circles), SQMPC qualities for case1 (squares) and SQMPC qualiteis for case 2 (triangles) where the set-point for case1 is the nominal quality (x) and the set-point for case 2 is an outiler from historicaloperation (star)
144

Ph.D. Thesis - Brandon Corbett McMaster University - Chemical Engineering
−30 −20 −10 00
5
10
15
20
SQMPC
batches
(%)
MN
−30 −20 −10 00
5
10
15
20
MW
−20 0 200
5
10
15
20
Conversion
−30 −20 −10 00
5
10
15
20
LVMPC
batches
(%)
−30 −20 −10 00
5
10
15
20
−20 0 200
5
10
15
20
−30 −20 −10 00
5
10
15
20
rel. error (%)
PI
batches
(%)
−30 −20 −10 00
5
10
15
20
rel. error (%)−20 0 20
0
5
10
15
20
rel. error (%)
Figure 4.9: Histograms of case 2 qualities resulting from 186 batches operated underSQMPC, LVMPC, and PI control.
145

Ph.D. Thesis - Brandon Corbett McMaster University - Chemical Engineering
state trajectory, time-indexed models fail capture the dynamic behavior.
4.7 Conclusions
In this work we presented a novel data-driven model predictive control scheme for
batch processes. The method adapts subspace identification techniques to identify a
LTI, dynamic, state-space model from historical and identification batch data. The
states of the identified system are then related to quality. The overall model relates
process inputs and measurements in a causal manner to batch quality. The identified
model is then applied in a model predictive control scheme. Simulation results for
a batch PMMA reaction show the efficacy of the approach. Specifically, we are able
to demonstrate favorable results when compared with other benchmark batch control
schemes. The favorable results obtained by the proposed approach are explicable by
the beneficial theoretical properties inherent to the method.
146

Ph.D. Thesis - Brandon Corbett McMaster University - Chemical Engineering
Bibliography
[1] Bonvin D, Srinivasan B, Hunkeler D. Control and optimization of batch processesIEEE Control Systems Magazine. 2006;26:34-45.
[2] Bequette B. Nonlinear Control Of Chemical Processes - A Review Industrial &Engineering Chemistry Research. 1991;30:1391-1413.
[3] Berber R. Control of batch reactors: A review (Reprinted from Methods ofModel Based Process Control, 1995) Chemical Engineering Research & Design.1996;74:3-20.
[4] Shi D, El-Farra N, Li M, Mhaskar P, Christofides P. Predictive control of par-ticle size distribution in particulate processes Chemical Engineering Science.2006;61:268-281. 2nd International Conference on Population Balance Modelling,Valencia, Spain, MAY 05-07, 2004.
[5] Nayhouse M, Tran A, Kwon J. S.-I, Crose M, Orkoulas G, Christofides P. D.Modeling and control of ibuprofen crystal growth and size distribution ChemicalEngineering Science. 2015;134:414-422.
[6] Valappil J, Georgakis C. Accounting for batch reactor uncertainty in the nonlin-ear MPC of end-use properties AIChE Journal. 2003;49:1178-1192.
[7] Bonvin D, Srinivasan B. On the role of the necessary conditions of optimalityin structuring dynamic real-time optimization schemes Computers & ChemicalEngineering. 2013;51:172-180.
[8] Rafizadeh M, Solgi R, Abbaszadeh M. Constrained model predictive control ofMMA polymerization reactor based on genetic algorithm optimization in CCA2003: Proceedings of 2003 IEEE Conference on Control Applications, Vols 1and 2(345 E 47TH ST, New York, NY 10017 USA):464-469IEEE; Control SystSoc; Sci & Tech Res Council TurkeyIEEE 2003. IEEE Conference on ControlApplications, Istanbul, Turkey, Jun 23-25, 2003.
[9] Aumi S, Mhaskar P. Robust Model Predictive Control and Fault Handling ofBatch Processes AIChE Journal. 2011;57:1796-1808.
[10] Kozub D, Macgregor J. Feedback-control of Polymer Quality In SemibatchCopolymerization Reactors Chemical Engineering Science. 1992;47:929-942.
[11] Nayhouse M, Kwon J. S.-I, Christofides P. D, Orkoulas G. Crystal shape modelingand control in protein crystal growth Chemical Engineering Science. 2013;87:216-223.
[12] Bonvin D. Optimal operation of batch reactors - a personal view Journal ofProcess Control. 1998;8:355-368.
147

Ph.D. Thesis - Brandon Corbett McMaster University - Chemical Engineering
[13] Kwon J. S.-I, Nayhouse M, Orkoulas G, Ni D, Christofides P. D. Run-to-Run-Based Model Predictive Control of Protein Crystal Shape in Batch CrystallizationIndustrial & Engineering Chemistry Research. 2015;54:4293-4302.
[14] Flores-Cerrillo J, MacGregor J. Iterative learning control for final batch productquality using partial least squares models Industrial & Engineering ChemistryResearch. 2005;44:9146-9155.
[15] Clarke-Pringle T, MacGregor J. Optimization of molecular-weight distributionusing batch-to-batch adjustments Industrial & Engineering Chemistry Research.1998;37:3660-3669.
[16] Chin I, Lee K, Lee J. A technique for integrated quality control, profile control,and constraint handling for batch processes Industrial & Engineering ChemistryResearch. 2000;39:693-705.
[17] Lee J. H, Lee K. S. Iterative learning control applied to batch processes: Anoverview Control Engineering Practice. 2007;15:1306-1318. IFAC InternationalSymposium on Advanced Control of Chemical Processes, Gramado, Brazil, APR02-05, 2006.
[18] Lee K, Chin I, Lee H, Lee J. Model predictive control technique combined withiterative learning for batch processes AIChE Journal. 1999;45:2175-2187. Thisis available in print at the library in storage.
[19] Camacho J, Pico J, Ferrer A. Self-tuning run to run optimization of fed-batchprocesses using unfold-PLS AIChE Journal. 2007;53:1789-1804.
[20] Dorsey A, Lee J. Building inferential prediction models of batch processes usingsubspace identification Journal of Process Control. 2003;13:397-406.
[21] Aumi S, Corbett B, Mhaskar P, Clarke-Pringle T. Data-Based Modeling and Con-trol of Nylon-6, 6 Batch Polymerization IEEE Transactions on Control SystemsTechnology. 2013;21:94-106.
[22] Sjoberg J, Agarwal M. Trajectory tracking in batch processes using neural con-trollers Engineering Applications Of Artificial Intelligence. 2002;15:41-51.
[23] Hosen M. A, Hussain M. A, Mjalli F. S. Control of polystyrene batch reactorsusing neural network based model predictive control (NNMPC): An experimentalinvestigation Control Engineering Practice. 2011;19:454-467.
[24] Yu H, Flores-Cerrillo J. Latent Variable Model Predictive Control for TrajectoryTracking in Batch Processes: Internal Model Control Interpretation and De-sign Methodology Industrial & Engineering Chemistry Research. 2013;52:12437-12450.
148

Ph.D. Thesis - Brandon Corbett McMaster University - Chemical Engineering
[25] Golshan M, MacGregor J. F, Mhaskar P. Latent variable model predictive con-trol for trajectory tracking in batch processes: Alternative modeling approachesJournal of Process Control. 2011;21:1345-1358.
[26] Golshan M, MacGregor J. F, Bruwer M.-J, Mhaskar P. Latent Variable ModelPredictive Control (LV-MPC) for trajectory tracking in batch processes Journalof Process Control. 2010;20:538-550.
[27] Flores-Cerrillo J, MacGregor J. Latent variable MPC for trajectory tracking inbatch processes Journal of Process Control. 2005;15:651-663.
[28] Tsen A, Jang S, Wong D, Joseph B. Predictive control of quality in batch poly-merization using hybrid ANN models AIChE Journal. 1996;42:455-465.
[29] Flores-Cerrillo J, MacGregor J. Control of batch product quality by trajec-tory manipulation using latent variable models Journal Of Process Control.2004;14:539-553.
[30] Flores-Cerrillo J, MacGregor J. Control of particle size distributions in emul-sion semibatch polymerization using mid-course correction policies Industrial &Engineering Chemistry Research. 2002;41:1805-1814.
[31] Corbett B, Macdonald B, Mhaskar P. Model Predictive Quality Control ofPolymethyl Methacrylate IEEE Transactions on Control Systems Technology.2015;23:687-692.
[32] Wan J, Marjanovic O, Lennox B. Disturbance rejection for the control of batchend-product quality using latent variable models Journal of Process Control.2012;22:643-652.
[33] Overschee P. v. Subspace identification for linear systems : theory, implementa-tion, applications. Boston: Kluwer Academic Publishers c1996.
[34] VanOverschee P, DeMoor B. N4SID - Subspace algorithms for the Identificationof Combined Deterministic Stochastic-systems Automatica. 1994;30:75-93.
[35] Moonen M, Demoor B, Vandenberghe L, Vandewalle J. Online and Off-lineIdentification of Linear State-space Models International Journal of Control.1989;49:219-232.
[36] Shi R, MacGregor J. Modeling of dynamic systems using latent variable andsubspace methods Journal of Chemometrics. 2000;14:423-439. 6th ScandinavianSymposium on Chemometrics, Porsgrunn, Norway, AUG 15-19, 1999.
[37] Yao Y, Gao F. Subspace identification for two-dimensional dynamic batch processstatistical monitoring Chemical Engineering Science. 2008;63:3411-3418.
149

Ph.D. Thesis - Brandon Corbett McMaster University - Chemical Engineering
[38] Kassidas A, MacGregor J, Taylor P. Synchronization of batch trajectories usingdynamic time warping AIChE Journal. 1998;44:864-875.
[39] Nomikos P, Macgregor J. Multivariate SPC Charts for Monitoring Batch Pro-cesses Technometrics. 1995;37:41-59.
[40] Kourti T, Nomikos P, Macgregor J. Analysis, Monitoring and Fault-diagnosis ofBatch Processes Using Multiblock and Multiway PLS Journal of Process Control.1995;5:277-284. IFAC Symposium on Advanced Control of Chemical Processes(ADCHEM 94), Kyoto, Japan, May 25-27, 1994.
[41] Kourti T, Lee J, MacGregor J. Experiences with industrial applications of projec-tion methods for multivariate statistical process control Computers & ChemicalEngineering. 1996;20:S745-S750. European Symposium on Computer AidedProcess Engineering - 6 (escape-6), Rhodes, Greece, May 26-29, 1996.
[42] Neogi D, Schlags C. Multivariate statistical analysis of an emulsion batch processIndustrial & Engineering Chemistry Research. 1998;37:3971-3979.
[43] Viberg M. Subspace-based methods for the identification of linear time-invariantsystems Automatica. 1995;31:1835–1851.
[44] Qin S. J. An overview of subspace identification Computers & Chemical Engi-neering. 2006;30:1502-1513. 7th International Conference on Chemical ProcessControl (CPC 7), Lake Louise, Canada, Jan 08-13, 2006.
[45] VanOverschee P, DeMoor B. A unifying theorem for three subspace system iden-tification algorithms Automatica. 1995;31:1853-1864. 10th IFAC Symposium onSystem Identification, Copenhagen, Denmark, JUL 04-06, 1994.
[46] Ekpo E. E, Mujtaba I. M. Evaluation of neural networks-based controllers inbatch polymerisation of methyl methacrylate Neurocomputing. 2008;71:1401-1412.
[47] Fan S, Gretton-Watson S, Steinke J, Alpay E. Polymerisation of methylmethacrylate in a pilot-scale tubular reactor: modelling and experimental studiesChemical Engineering Science. 2003;58:2479-2490.
[48] Rho H, Huh Y, Rhee H. Application of adaptive model-predictive con-trol to a batch MMA polymerization reactor Chemical Engineering Science.1998;53:3729-3739.
[49] Golshan M, MacGregor J. F, Bruwer M.-J, Mhaskar P. Latent Variable MPC forTrajectory Tracking in Batch Processes: Role of the model structure in AmericanControl Conference, Vols 1-9Proceedings of the american Control Conference(345E 47TH ST, New York, NY 10017 USA):4779-4784IEEE 2009. American ControlConference 2009, St Louis, MO, JUN 10-12, 2009.
150

Ph.D. Thesis - Brandon Corbett McMaster University - Chemical Engineering
[50] Nelson P, Taylor P, MacGregor J. Missing data methods in PCA and PLS: Scorecalculations with incomplete observations Chemometrics and intelligent Labora-tory Systems. 1996;35:45-65.
[51] Arteaga F, Ferrer A. Dealing with missing data in MSPC: several methods, differ-ent interpretations, some examples Journal of Chemometrics. 2002;16:408-418.7th Scandinavian Symposium on Chemometrics, Copenhagen, Denmark, AUG19-23, 2001.
[52] Verhaegen M. Application of a Subspace Model Identification Technique to Iden-tify LTI Systems Operating in Closed-loop Automatica. 1993;29:1027-1040.
[53] Katayama T. Subspace identification of closed-loop systems in SICE 2002:Proceedings of the 41st SICE Annual Conference, Vols 1-5(345 E 47TH ST,New York, NY 10017 USA):1517-1520Soc Instrument & Control Engineer-sIEEE 2002. 41st Annual Conference of the Society-of-Instrument-and-Control-Engineers (SICE 2002), Osaka, Japan, AUG 05-07, 2002.
[54] Veen G, Wingerden J.-W, Bergamasco M, Lovera M, Verhaegen M. Closed-loopsubspace identification methods: an overview IET Control Theory and Applica-tions. 2013;7:1339-1358.
151

Ph.D. Thesis - Brandon Corbett McMaster University - Chemical Engineering
4.8 Appendix A: Identified PMMA Models
4.8.1 Dynamic Model (Subspace Identification)
A =
0.98516 −0.041768 −0.11588 −0.081012 0.14133 0.027337 0.065944 −0.008974 0.026833−0.053849 0.79861 0.063273 −0.074642 0.41775 0.21953 0.16301 0.074074 0.00763230.014815 0.053163 0.98982 0.039297 −0.078398 0.084098 0.075658 −0.01062 −0.015769−0.0084043 −0.029059 0.010815 0.96612 0.11911 −0.033243 0.078468 0.039254 0.0071832−0.005217 −0.019198 0.0048115 −0.011641 0.8878 −0.080295 −0.030649 −0.13453 0.1784−0.001108 −0.0040268 0.00085731 −0.004503 −0.03083 0.93209 −0.038058 −0.12716 0.052801−0.00041708 −0.001586 −0.00040162 −0.00030684 0.1618 0.086359 0.80687 −0.077694 −0.20116−0.006212 −0.022836 0.004279 −0.011486 −0.076859 −0.10873 −0.20005 0.18359 0.0142770.0037065 0.013566 −0.002334 0.0087541 −0.13833 −0.0099258 0.39496 0.66942 0.4205
λA =
0.22240.56704 + 0.19029i0.56704− 0.19029i
0.808660.86491
0.99958 + 0.0039544i0.99958− 0.0039544i
0.985340.95601
B =
−0.058874−0.209030.057585−0.032671−0.020277−0.004307−0.0016209−0.0241430.014406
C =
−0.26209 −0.97571 0.49382 −0.081618 0.077041 0.15654 0.3934 0.34012 −0.0645270.003204 0.16186 0.23888 −0.63143 0.010558 −0.1874 −0.030857 0.00037325 −0.01769−0.72052 0.17384 0.02821 0.024757 0.21978 0.045767 0.094573 −0.051717 0.00075872
4.8.2 Quality Model
Q =
−0.0043689 −0.016241 −0.073542 0.0384591458.7852 12206.803 21917.8887 −41581.04242432.0509 19726.6489 33292.0309 −72136.2077−0.00039146 −0.021493 −0.056014 0.03811
152

Ph.D. Thesis - Brandon Corbett McMaster University - Chemical Engineering
ck =
−5.0845
1985711.02763323464.3048
1.3826
153

Ph.D. Thesis - Brandon Corbett McMaster University - Chemical Engineering
4.9 Appendix B: Tuning Parameters for Bench-
mark Control
4.9.1 PI
kc = −0.1
τI = 30
4.9.2 LVMPC
Number of principal components = 5
Q1 =
0.01 0 0 0
0 0.01 0 00 0 0.01 00 0 0 0
Q2 =
10 0 0 0 00 10 0 0 00 0 10 0 00 0 0 10 00 0 0 0 10
λ = 100;
|∆t| ≤ 0.5
154

Chapter 5
Data-driven Modeling and QualityControl of Variable-duration BatchProcesses with Discrete Inputs
155

Ph.D. Thesis - Brandon Corbett McMaster University - Chemical Engineering
Manuscript Overview
This chapter consists of a manuscript which extends the results from the previous
chapter with two significant novel contributions. These are the inclusion of a mecha-
nism to handle discrete inputs and including batch duration as a decision variable in
the control scheme. Both of these contributions substantially improve the performance
of the proposed quality controller. Including variable batch duration is particularly
impactful since other data-driven batch control approaches have struggled with this
complex problem. In addition to the two major contributions, other smaller contribu-
tions include heuristic policies to improve performance and an adaptation of a batch
state observer more suitable than the Luenberger observer used in previous work.
156

Ph.D. Thesis - Brandon Corbett McMaster University - Chemical Engineering
Data-driven Modeling and Quality Control ofVariable Duration Batch Processes with Discrete
Inputs
Brandon Corbett and Prashant Mhaskar
Submitted for publication: August 2016, to Industrial Engineering & ChemistryResearch
Abstract
Batch process reactors are often used for products where quality is of paramount im-
portance. To this end, this work addresses the problem of direct, data-driven, quality
control for batch processes. Specifically, previous results using subspace identification
for modeling dynamic evolution and making quality predictions are extended with
two key novel contributions: first, a method is proposed to account for mid-batch
ingredient additions in both the modeling and control stages. Second, a novel model
predictive control scheme is proposed that includes batch duration as a decision vari-
able. The efficacy of the proposed modeling and control approaches are demonstrated
using a simulation study of a polymethyl methacrylate (PMMA) reactor. Closed loop
simulation results show that the proposed controller is able to reject disturbances in
feed stock and drive the number average molecular weight, weight average molecular
weight, and conversion to their respective set-points. Specifically, mean absolute per-
centage errors (MAPE) in these variables are reduced from 8.66%, 7.87%, and 6.13%
under traditional PI control to 1.61%, 1.90%, and 1.67% respectively.
157

Ph.D. Thesis - Brandon Corbett McMaster University - Chemical Engineering
5.1 Introduction
Specialty chemical products ranging from high end polymers to pharmaceuticals make
up a cornerstone of the modern economy. The Society of Chemical Manufacturers and
Affiliates (SOCMA) reports that its members alone produce $24 billion in products
and services [1]. Batch reactors are a natural choice for specialty chemical production
because they are sufficient to meet low volume demands while providing benefits over
continuous reactor configurations as discussed below. In batch reactors a sequence of
ingredient addition and reaction steps are carried out over a finite period of time to
produce the desired product. This sequence, often directly adapted from lab proce-
dures, is referred to as the recipe. Because of the high value of the products, even
infrequent off-spec batches represents a substantial economic loss. It is imperative,
therefore, to develop control strategies to reduce process variations that result in
off-spec product.
The most ubiquitous closed-loop batch strategy tracks predefined trajectories of
measurable process variables such as temperatures and pressures. This is referred to
as trajectory tracking control. In most implementations, traditional PI controllers are
used, sometimes with gain scheduling to account for the nonlinear dynamics arising
from the large range of state-space encountered by the process [2, 3]. However, many
more advanced trajectory tracking schemes using model based control have also been
considered [4, 5, 6]. While trajectory tracking is a good first step to reduce product
quality variation, even with perfect trajectory tracking, the desired quality specifica-
158

Ph.D. Thesis - Brandon Corbett McMaster University - Chemical Engineering
tions may not be achieved. This is because only output trajectories are being tracked
(not the corresponding state trajectories), thus even if the measured outputs traverse
the same path, the process states might be at an entirely different point, thus not
yielding the desired product quality.
The key challenge for direct quality control is that quality variables are often
not measured online. Therefore, to solve the problem of direct quality control, first
one must use models to make terminal quality predictions from measurable process
variables. The most intuitive way to achieve this is by using models developed from
first-principles knowledge of the reaction mechanisms [7, 8, 9, 10, 11, 12, 13, 14, 15,
16]. In many instances, however, substantial amount of historical data are available
that could be utilized for development of models that are easier to both build and
implement.
One approach to data driven batch quality modeling and control is to use latent
variable methods (see [17] for an excellent review). The common component of these
methods is projecting measurements from the process into a reduced dimensional
space where inferences about the process operation can be drawn based on past oper-
ations. The key difference between these approaches is the way in which the data are
projected into this lower dimensional space. The orientation of this projection is de-
termined by the arrangement (unfolding) of batch data into a two dimensional matrix
where columns represent measurements and rows represent observations. One of the
most common projection method [18, 19, 20] is to use batch-wise unfolding where each
159

Ph.D. Thesis - Brandon Corbett McMaster University - Chemical Engineering
row represents a complete batch duration. However, this unfolding method introduces
problems dealing with batches of unequal duration. To address these problems, two
methods have been introduced. One method uses a monotonically increasing variable
to align batches [19]. The second, more advanced method, uses a technique developed
for alignment of sound in voice recognition called dynamic time warping (DTW) [21].
While these approaches are useful tools for batch monitoring, they are not as helpful
for control because it is unclear how to map future variable trajectories back to the
real time domain. Models created from this unfolding represent time varying models,
and can easily be adapted to handle mid-batch quality measurements and mid-batch
additions. Because of the time varying nature of the underlying model, however, these
models are not directly applicable to batches of different durations. More explicitly,
while possible for monitoring, these models cannot be directly utilized to vary batch
durations to achieve improved product quality in a feedback control framework. An-
other batch quality control approach, referred to as batch-to-batch control, allows
changing batch durations [22, 23, 24, 25, 26, 27, 28, 29], however, the approaches do
not incorporate feedback during a batch (but only from batch-to-batch).
Beside the time varying modeling approaches, there also exist other approaches
to capture process nonlinearity (see [30, 31, 32]). One such approach combined local
linear ARX models with weights which depended on the lagged outputs and inputs at
any given sampling instant for trajectory tracking [31] and quality control [33] for fixed
batch durations. This limitation was necessary because, while a time independent
160

Ph.D. Thesis - Brandon Corbett McMaster University - Chemical Engineering
model was used for output predictions, quality predictions were achieved using a time-
dependent latent variable model. In more recent work, a subspace based modeling
and control approach for batch quality [32] control was proposed, comprising a state
space dynamic model and a quality model, that also did not require batches to be
of the same duration for building the model. However, this work stopped short of
including batch duration as a decision variable in closed loop control. Furthermore,
the work [32] considered a relatively simplistic batch recipe which did not include
mid-batch additions which often play a critical role in batch processes.
The current work generalizes the method proposed in [32] to address both mid-
batch additions and batch duration. Specifically, novel identification method is in-
troduce that accounts for and identifies the effects of mid-batch additions. Also, the
ability to use the identified models in batch quality control where batch duration
is a decision variable is demonstrated. The remainder of the paper is structured as
follows: first, in Section 5.2, background and notation needed to support the contri-
butions in subsequent sections is provided. Section 5.3 outlines the model structure
used for identification. Next, Section 5.4, goes step-by-step through the proposed
identification method. Section 5.5 proposes a shrinking horizon model predictive con-
trol scheme to use the identified models for direct quality control. To demonstrate
the efficacy of the proposed approach,Section 5.6 demonstrates the proposed identi-
fication and control methods applied to a simulation of a Poly Methyl Methacrylate
(PMMA) batch reactor. Finally, Section 5.7 draws a few brief conclusions.
161

Ph.D. Thesis - Brandon Corbett McMaster University - Chemical Engineering
5.2 Preliminaries
The first subsection of this section explicitly defines the class of processes considered
by this study. Then the well researched field of subspace identification is briefly
reviewed.
5.2.1 Class of processes
The key contributions of this work are motivated by the Markov assumption which
states that future behavior of the process is dependent solely on its current state
and future input excitation. For chemical systems, the state is captured by chemical
composition of the reaction media and thermodynamic variables (temperatures and
pressures). In this work, states in this physically motivated variable space are referred
to as fundamental states and are denoted as x.
The current work considers processes with two types of inputs: continuous and
discrete. Continuous inputs are defined as independently manipulatable variables
whose values impact process behavior through dynamics. A cooling jacket which
continually removes heat from the reactor is a good example of a continuous input.
Continuous inputs are denoted with the standard u notation. Discrete inputs are
defined as factors that effect the process state instantaneously (or sufficiently fast so
its easiest to treat it as instantaneous). For example, addition of an ingredient causes
concentration of the added species to instantly increase. Notationally, discrete inputs
are represented as ud.
162

Ph.D. Thesis - Brandon Corbett McMaster University - Chemical Engineering
To implement digital control, some narrowing of the input space is necessary.
Specifically, this work makes two assumptions: first, that continuous inputs occur
at a regular sampling frequency, equal to the measurement sampling frequency for
convenience of feedback, with a zero order hold. Second, that discrete inputs can only
occur at the end of sampling instances, immediately prior to the measurement of the
subsequent sampling instant. Note that the proposed approach would readily work
with any other policy, for instance a first-order hold policy. Also, the timing of the
addition of the discrete inputs could be easily changed.
In general, measurements are nonlinear functions of state. For instance, for a
polymerization reactor, the viscosity of the reaction media is a nonlinear function
of the temperature and composition. Further, process measurements are classified
into two types: online measurements and offline quality measurements. As the labels
imply, online measurements are taken from process sensors and are sampled frequently
in (nearly) real-time. This work denotes online measurements with the standard y
notation. Quality measurements, denoted by the vector q, provide a more direct and
detailed evaluation of the reaction product. These measurements capture the useful
properties of the product and, as such, define the production objectives. However,
quality measurements are generally only available infrequently (often at the end of a
batch) and with substantial delay.
163

Ph.D. Thesis - Brandon Corbett McMaster University - Chemical Engineering
The system described above can be represented mathematically as follows:
xk+1 = f (xk,uk) ∀ k /∈ Kd (5.1)
xk+1 = fd(x−d ,udk
)∀ k ∈ Kd (5.2)
x−d = f (xk,uk) (5.3)
yk = g (xk) (5.4)
qk = h (xk) (5.5)
where f (xk,uk) is the nonlinear function governing the dynamic evolution of the
fundamental states. fd is the function capturing the effect of the discrete addition
at the end of a sampling instant. g describes the relationship between states and
frequently sampled measurements. h is the relationship between fundamental states
and quality. x−d is the state immediately before a discrete addition occurs. Finally,
Kd is the set of all sampling instances at the end of which a discrete input occurs.
Note that the subsequent results do not require knowledge of the above functions;
they have only been introduced for notational purposes.
Remark 33 By definition, every batch has at least one discrete input at t = 0 cor-
responding to the initial charge of the reactor and another at t = Tf when the reactor
is discharged. This observation could be useful to extend the approaches presented in
this paper to situations where a statistical dependency is observed between subsequent
batches (for instance in a manner consistent with the case studies in batch-to-batch
164

Ph.D. Thesis - Brandon Corbett McMaster University - Chemical Engineering
control approaches). However, this work focuses on the within batch control problem.
Remark 34 For a system in the continuous time-domain, the discrete inputs in this
work (and the resulting discontinuities in state-space) could be handled exactly using
impulse functions. However, in the discrete-time (sampled) case, the additional steps
presented in this paper are necessary to adequately describe the behavior of the sys-
tem. Even for processes where additions involve some mixing dynamics, the methods
presented here are likely useful since the timescale of the mixing dynamics are likely
dramatically faster then the process sampling rate.
5.2.2 Subspace identification
This subsection provides a brief overview of subspace identification methods. These
methods were developed to be stable, non-iterative approaches for identifying state-
space, dynamic models directly from input and output data. Traditionally, these
methods are used to identify models around steady-state operating conditions, as is
the case for continuously fed chemical processes. Standard practice is to excite the
system using an identification signal (for instance pseudo random binary sequence
signals (PRBS)). This excitation is necessary to correctly isolate the influence of each
input on each of the states.
165

Ph.D. Thesis - Brandon Corbett McMaster University - Chemical Engineering
Consider the linear, time-invariant, discrete, state-space system:
xk+1 = Axk + Buk (5.6)
yk = Cxk + Duk (5.7)
To begin the identification procedure, a contiguous sequence of i+ j − 1 input values
and the corresponding output measurements from this system are arranged into a
Hankel matrix as follows:
Y1|i =
y1 y2 · · · yj
......
...
yi yi+1 · · · yi+j−1
Note that the notation Y1|i in this context refers to the Hankel matrix in which the
first column contains outputs from 1 to i. A corresponding unfolding of the state
vectors is defined as:
Xi =
[xi xi+1 · · · xi+j−1
]
Having defined these matrix arrangements of the available observations, the update
and output state-space equations (equations 5.6 and 5.7) can be re-expressed as:
Xi+1 = AiX1 + ∆iU1|i (5.8)
Y1|i = ΓiX1 + HiU1|i (5.9)
166

Ph.D. Thesis - Brandon Corbett McMaster University - Chemical Engineering
Where Ai is the dynamic A matrix to the ith power. ∆i, Γi, and Hi can be derived
by appropriate iterative substitutions of equations 5.6 and 5.7 (see [34] for the defini-
tion and derivation of these matrices). Next, using the pseudo-inverse (denoted •+),
equation 5.9 is solved for X1 which can be plugged into equation 5.8 and re-arranged
to get:
Xi+1 =
[∆i −AiΓ+
i Hi AiΓ+i
]U1|i
Y1|i
(5.10)
Next, re-write equation 5.9 for observations from i+ 1 to 2i to get:
Y i+1|2i = ΓiXi+1 + HiU i+1|2i (5.11)
Equations 5.10 and 5.11 taken together demonstrate the fundamental principal
behind subspace identification methods. Particularly, note that the matrix Xi+1 ap-
pears in both of these equations and forms a partial basis for the output measurements
in both cases. Assuming that inputs are independent from outputs (i.e., not purely
closed loop), it is possible to identify this basis through a series of appropriate pro-
jections (perpendicular to ’future’ inputs, U i+1|2i). In practice, care must be taken to
exploit this theoretical result in a numerically stable fashion. To this end, a number
of algorithms have been proposed.
This work does not present a new subspace identification algorithm; accordingly,
readers are referred to existing literature for algorithmic information. For specific
details of the subspace identification principles used in this work, including numeri-
167

Ph.D. Thesis - Brandon Corbett McMaster University - Chemical Engineering
cally stable algorithms, see [34]. For a good review and analysis of different subspace
identification methods see [35]. In previous work, [32], it was demonstrated that by
appropriately modifying Hankel matrices, one could apply the methods from [34] to
identify dynamic models for batch processes. This work generalizes these results for
batches with discrete inputs.
5.3 Proposed Model Structure
The idea motivating the selected model structure is to break the overall model into
multiple distinct parts. Partitioning the model facilitates identification by allowing
each part of the model to be identified individually. The selected partitioning, and
structure of each model part, is motivated by our fundamental understanding of these
processes as presented in Section 5.2.1. Specifically, the model is composed of a
dynamic model to explain the effects of continuous inputs, discrete input models for
instantaneous influences, and a quality model to predict quality at the end of the
batch. All three models are related through the state, x, defined by the dynamic
model. Mathematically, the model is represented as:
xk+1 =
Axk + Buk ∀k /∈ Kd
Ad (Axk + Buk) + Bdudk + cd ∀k ∈ Kd
yk = Cxk + Duk
qTf = MqxTf + µq
168

Ph.D. Thesis - Brandon Corbett McMaster University - Chemical Engineering
Where A, B, C, and D as well as the selected length (order) of x comprise the
dynamic, state model; the matrices Ad, Bd, and the vector cd comprise the dth
discrete addition model; and matrix Mq and vector µq comprise the quality model
relating the terminal state, xTf , to the terminal quality, qTf .
Note that this model structure is based on a latent state, x. Section 5.4.1, where
identification of the dynamic model using subspace methods is discussed, briefly de-
scribes the advantages afforded by this latent state including the ability to adequately
describe the evolution of the process dynamics using the proposed linear structure.
For a deeper examination of the way that LTI models capture behavior that is non-
linear in fundamental states space, readers are referred to the detailed treatment of
the topic in [32]. Other identification sections discuss the linear representations of the
quality and discrete input models as well.
5.3.1 Observer
The fact that the proposed model structure is state-space based introduces the state
estimation problem. Before presenting the proposed approach, this subsection in-
troduces a receding horizon observer design based on one presented in [36]. This
optimization based observer is used to estimate the states of the proposed model
structure for a series of inputs and the corresponding measured response. Impor-
tantly, this observer intuitively incorporates the full model structure proposed in this
section including the discrete-input component of the model stricture. To estimate a
169

Ph.D. Thesis - Brandon Corbett McMaster University - Chemical Engineering
state trajectory at sampling instant k, ˆxi∀i ≤ k, from measurements, yi, continuous
inputs, ui, and discrete inputs, udi, the optimization problem is formulated as:
minˆx1,...,ˆxk
(ˆx1|k−1 − ˆx1|k
)′Q0
(ˆx1|k−1
ˆx1|k
)+ · · ·
k∑i=1
(yi − yi)′R (yi − yi) + · · ·
k−1∑i=1
ω′iQωi
s.t. ωi =
xi+1 − (Axi + Bui) ∀i /∈ Kd
xi+1 − (Ad (Axi + Bui) + Bdudi + cd) ∀i ∈ Kd
yi = Cˆxi + Dui
where Q0, R, and Q are symmetric, positive-definite tuning matrices. ˆx1|k−1 is the
state estimate at the first sampling instant of the process calculated during the last
update of the observer. Similarly, ˆx1|k is equivalent in our notation to ˆx1 and is the
new estimate of the initial state. With these two definitions in mind, the first term
and the corresponding symmetric, positive-definite, tuning matrix, Q0 provides an
iterative dampening effect. The purpose of this term is to stabilize the state estimate
trajectories when the observer is updated online at each sampling instant with new
observations. The second term is similar to the innovation term in a Luenberger or
Kalman estimator and penalizes deviations between the observed output and that
predicted by the model. The final term enforces model validity. While it would be
170

Ph.D. Thesis - Brandon Corbett McMaster University - Chemical Engineering
equally feasible to include this term as a constraint (i.e., ωi = 0), doing so would not
enable accounting for plant model mismatch.
Remark 35 An alternative approach would be to use a Kalman filter. In fact, for
a linear system with Gaussian process and measurement noise a Kalman filter is
provably optimal. There are, however, a number of reasons not to use a Kalman
filter for the present framework. First and foremost, the underlying assumptions for
Kalman filters are not necessarily met. Specifically, as discussed later, in this work
non-linear dynamics are approximated using a linear dynamic model. As a result,
using a Kalman filter would result in a biased estimate because the state update error
would be autocorrelated and would not be Gaussian centered on the true state.
Furthermore, the presented batch estimator is provably equivalent to a Kalman
filter if the process is well described by the linear system and process noise is Gaussian
[36]. Therefore, there are no possible benefits to using a Kalman filter in place of the
proposed estimator. Another advantage of using a batch estimator is the ability to
‘even out’ the effect of the measurement noise over the entire batch without unduly
detuning the estimator.
5.4 Model Identification
The previous section proposed a model structure for batch processes motivated by
facilitating identification from process data. This section, provides methodology for
171

Ph.D. Thesis - Brandon Corbett McMaster University - Chemical Engineering
identifying the corresponding model parameters. The proposed method is simple
enough to be practical for industrial applications, yet general enough to describe
batches with a wide variety of recipes.
Model identification is broken into four distinct steps: first, subspace identification
is used to find a dynamic model. Next, discrete input models are identified. To
improve the early-batch performance of the proposed observer, a prototypical initial
state is determined. Finally, a model is developed relating terminal state to terminal
quality. Each of these steps is dependent on the preceding steps. Taken together, these
steps provide a way of using historical operation data in conjunction with minimal
identification data to describe the complex behavior of batch processes.
5.4.1 Dynamic model using subspace identification
[32] demonstrated that observations from a number of batches could be combined in
the Hankel matrix construction step of subspace identification. To achieve this, first
Hankel matrices were constructed from each individual batch using observations from
the entire batch duration as a single block of contiguous data. The resulting Hankel
sub-matrices were then concatenated horizontally to form a Hankel matrix containing
information from multiple batches. After concatenation, the completed Hankel matri-
ces possess the same pertinent row-space relationship as a training matrix constructed
from a single block of contiguous data. Accordingly, these Hankel matrices can be
used in unaltered subspace identification methods. Moreover, by including a number
172

Ph.D. Thesis - Brandon Corbett McMaster University - Chemical Engineering
of different batches in the training data, a sufficient range of the fundamental state-
space was exposed to identify a model capable of accurately capturing the dynamic
behavior of the system.
Remark 36 Note that these results incorporated batches of varying durations in the
training data. This was possible because the duration of the training data altered
only the number of columns in each Hankel sub-matrix. For horizontal concatenation,
only the number of rows must be consistent. The number of Hankel rows is a user
parameter (defining a size of a history of observations around the identified state) and
was therefore consistent regardless of batch duration.
The subspace identification approach adopted in the current work is a general-
ization of the framework presented in [32] to handle discrete inputs. To include
batches with discrete inputs in the training data, again Hankel matrix construction
is addressed. Subspace identification methods rely on the assumption that all state
changes arise from process dynamics or dynamic responses to input variables. Recall
that by our definition, a discrete input causes a discontinuity in state. As a result,
including observations around this discrete input would, at best, be inconsistent and
at worst substantially skew the identified model dynamics. Mathematically this is
reflected in the row-space of Hankel matrices. Consider, for instance, the case where
a discrete input is made half way through a batch. Were one to proceed as before,
constructing a Hankel matrix using observations from a complete batch, the row-space
relationship assumed of the Hankel matrix would be violated in the columns spanning
173

Ph.D. Thesis - Brandon Corbett McMaster University - Chemical Engineering
the discrete input.
To address the effects of discrete inputs, the Hankel sub-matrix for each batch
is further divided into sub-matrices. In some sense, one can think of the period of
time between each discrete input as an individual batch; for the duration between
each addition, the state of the process is transformed from an initial state (the result
of the last discrete input) to a final state (the state before the next discrete input).
This transformation is governed by process dynamics and continuous inputs made
during that time. Hence, it is appropriate to build Hankel sub-matrices for each of
these intervals. It is assumed that discrete inputs can only modify the system-state
and that process dynamics remain unaltered by discrete inputs. Therefore, instead
of modifying system dynamics, the effect of each discrete input is accounted for by
allowing a discontinuity in the identified state. With this in mind, it makes sense to
identify one dynamic model for the entire duration of the batch (including all intervals
between discrete events). Mathematically these ideas can be represented as follows.
For the set of L discrete input times:
Kd = {d1, d2, · · · , dL}
174

Ph.D. Thesis - Brandon Corbett McMaster University - Chemical Engineering
Define the set of l + 1 corresponding continuous intervals
I1 = {k |1 ≤ k ≤ d1}... =
...
Il = {k |dl−1 < k ≤ dl}... =
...
IL+1 = {k |dL < k ≤ Tf }
Then define the following sub Hankel matrices for each batch, b, and interval Il:
Yb,Il1|i =
ydl−1+1 ydl−1+2 · · · ydl−2i
ydl−1+2 ydl−1+3 · · · ydl−(2i−1)
......
...
ydl−1+i ydl−1+i+1 · · · ydl−i
(b)
Likewise for Y i+1|2i get:
Yb,Ili+1|2i =
ydl−1+i+1 ydl−1+2 · · · ydl−i
ydl−1+i+2 ydl−1+3 · · · ydl−(i−1)
......
...
ydl−1+2i ydl−1+i+1 · · · ydl
(b)
175

Ph.D. Thesis - Brandon Corbett McMaster University - Chemical Engineering
Then combine the data from all intervals and all sampling instances to form:
Y1|i =
[Y1,1
1|i Y1,21|i · · · Y1,L
1|i Y2,11|i Y2,2
1|i · · · Y2,L1|i · · · YB,L
1|i
]
The corresponding concatenation of sub-Hankel matrices Yb,Ili+1|2i gives the complete
Hankel matrix Y i+1|2i. Similarly, the same procedure can be used go generate U1|i
and U i+1|2i. Note that by partitioning the Hankel matrices around discrete inputs,
the Hankel matrices of inputs only contain continuous inputs. Critically, by parti-
tioning data into segments omitting sample instances with discrete inputs, the row-
space relationship of the resulting Hankel matrix is consistent with that described in
Section 5.2.2. Therefore, from this point forward, it is permissible to apply subspace-
identification algorithms without further alteration.
The result of the subspace identification algorithm’s state identification step is a
state vector for each training batch, b, of the following form:
X(b)i =
[x
(b)i x
(b)i+1 · · · x
(b)d1−i x
(b)d1+i x
(b)d1+i · · · x
(b)Tf−i
]
From this state progression and the corresponding input and output progressions it
is trivial to identify the state-space matrices, A, B, C, and D. In this work, this
step was done using linear regression (see [34] for details). However, as discussed
in the literature it is also possible to back calculate these values directly from the
intermediate calculation matrices. Linear regression was chosen to for simplicity.
176

Ph.D. Thesis - Brandon Corbett McMaster University - Chemical Engineering
The state matrices identified in this section are used extensively in the remaining
identification steps to inform the state observer. These remaining identification steps
are discussed next.
Remark 37 One side effect of partitioning the Hankel matrices around discrete in-
puts is that only states up to i sampling instances before and after the discrete input
can identified. This is, however, not a restriction of the proposed approach. As long
as there is sufficient time interval between discrete inputs (for batch processes, there
always is), and the sampling frequency is sufficiently fast compared to the process dy-
namics (necessary from a process identification standpoint regardless), the approach
enables capturing the discrete and continuous components of the process dynamics.
5.4.2 Identification of discrete input model
With continuous dynamics of the system identified, the next step in the proposed
method is to identify the effect of discrete inputs. The objective is to identify a
model relating the state immediately prior to the discrete input to that immediately
following it. One approach would be to use the state-estimates resulting directly from
the subspace identification step as training data. However, recall from the previous
section that the state-estimates provided by subspace identification leave a gap around
each discrete addition. This is undesirable since it is necessary to isolate the effects
of discrete inputs from the effects of continuous inputs implemented during the gap.
Therefore, another approach is required.
177

Ph.D. Thesis - Brandon Corbett McMaster University - Chemical Engineering
In order to identify the effect of the discrete input in isolation, first the state im-
mediately before and after the input takes place must be estimated. To achieve this, a
paired down version of the observer proposed in Section 5.3.1 is used on the continu-
ous observations from each of the L+ 1 segments of each batch. After completing the
dynamic identification, the only model parameters available to use from the overall
model proposed in Section 5.3 are the continuous dynamic matrices A, B, C, and D.
With these matrices, enough information is available to apply the observer indepen-
dently on each of the L+ 1 segments of continuous observations in the training data.
Note that since this is not an iterative application, and a good initial state estimate
is not available, Q0 is set to zero, Q0 = 0. The resulting observer is given by:
minˆxi,i∈Il
∑i∈Il
(yi − yi)′R (yi − yi) + · · · (5.12)
∑i∈Il
ω′iQωi (5.13)
ωi = xi+1 − (Axi + Bui) (5.14)
yi = Cˆxi + Dui (5.15)
The solution of the above optimization problem is an estimated state trajectory,
ˆxi, i ∈ (dl−1, dl]. By solving for all L+1 intervals, a complete state estimate trajectory
is obtained for each training batch. Of specific interest, for each discrete input, l,
now available are the states one sampling instant before the discrete input, ˆxdl and
the state immediately after the discrete input, ˆxdl+1. Recall however, that discrete
178

Ph.D. Thesis - Brandon Corbett McMaster University - Chemical Engineering
inputs are made at the end of sampling intervals, immediately prior to the next
measurement. Accordingly, the state at the end of the sampling instant, directly
preceding the discrete input, must be determined before a model from this data can
be built. Since no measurement is available after the sampling instant but before the
discrete addition, the best method to accomplish this is to propagate the state estimate
at xsdl forward using the continuous model. This is represented mathematically as:
ˆx−dl = Aˆxdl + Budl
Where ˆx−dl is our best estimate of the state immediately before the discrete addition
given our knowledge of the continuous process dynamics, measurements, and contin-
uous inputs.
With ˆx−dl and ˆxdl+1 identified, it is possible to construct regression matrices to
identify Ad, Bd, and cd. These regression matrices are given by:
Yreg =
[ˆx
(1)dl+1
ˆx(2)dl+1 · · · ˆx
(B)dl+1
](5.16)
Xreg =
ˆx− (1)dl
ˆx− (2)dl
· · · ˆx− (B)dl
ud(1)dl
ud(2)dl· · · ud
(B)dl
(5.17)
Then solving the regression problem yields:
Yreg =
[Ad Bd
]Xreg + cd (5.18)
179

Ph.D. Thesis - Brandon Corbett McMaster University - Chemical Engineering
Remark 38 Note that the proposed approach is designed to handle situations where
multiple discrete additions are part of the batch recipe. If the discrete additions are at
fixed instances during the batch, or involve the addition of separate ingredients, they
could be accounted for using separate models. On the other hand, the approach could
be readily generalized to handle variable discrete addition time by building a single
model for the discrete addition events.
Remark 39 An alternative to the form of the mid-batch model proposed above is
to instead model the change in state ∆x. This alternative form is motivated by the
assertion that a discrete input of zero magnitude should have no effect on the state
of the system. To use this alternative form, the steps to identify ˆx−dl and ˆxdl+1 are
unaltered. The new regression matrices are:
Yreg =
[ˆx
(1)dl+1 − ˆx
− (1)dl
ˆx(2)dl+1 − ˆx
− (2)dl
· · · ˆx(B)dl+1 − ˆx
− (B)dl
](5.19)
Xreg =
[ud
(1)dl
ud(2)dl· · · ud
(B)dl
](5.20)
For regression matrices in this form, it makes sense to force the regression solution
to pass through the origin. The direct result of the regression is Bd while Ad for this
case is the identity matrix and cd is the zero vector.
180

Ph.D. Thesis - Brandon Corbett McMaster University - Chemical Engineering
5.4.3 Identification of initial state model
In state-estimation applications where a first-principles, state-space model is used,
it is practical to provide an initial state estimate based on process knowledge. For
instance, initial concentration of product in a batch reactor would likely be close to
zero. However, in the proposed approach, the subspace states of the system have no
direct physical meaning. As a result, it is not possible to draw a reasonable initial
system state from process knowledge. Instead, a reasonable initial state must be
obtained from training data. This subsection provides one approach to setting a good
initial state estimate. In particular, the average of each initial state in the training
data are taken as initial state estimate vector. To determine the initial state estimate
for each training batch, first the observer outlined in Section 5.3.1 was applied to each
training batch. Note that, with the discrete input model(s) identified, the observer
can be applied to complete output, input, and discrete input trajectories from each
batch. Once again, the Q0 matrix is set to zero because the observer is not being
used iteratively.
Remark 40 For batch processes where measurements in excess of the first online
measurement are available, rather than using the average value for the initial state, a
model relating these additional measurements to initial state could also be built. Doing
so would leverage available initial measurements to make appropriate early control
decisions.
181

Ph.D. Thesis - Brandon Corbett McMaster University - Chemical Engineering
5.4.4 Identification of quality model
The last step to the proposed identification process is to identify the quality model.
Recall from Section 5.2.1 that quality is a function of state. Because the identified
models will be used to implement quality control, it is expected that the controller
will drive the quality to a narrow range. Therefore, our quality prediction model only
needs to be accurate for a small range of qualities near the set-point. As such, it is
reasonable to use a simple linear model to relate the quality to the terminal state.
This has the added advantage that it simplifies the identification process.
To identify a linear model relating terminal state and quality, the procedure is
similar to that from the previous subsection for identifying the initial state. First, an
observer of the form from Section 5.3.1 is constructed using the dynamic model and
discrete input model(s) identified in the previous sections. Note that once again Q0 is
set to 0. Next, the observer is solved with the measurements, continuous inputs, and
discrete inputs from each batch in the training data. The result, as in the previous
subsection, is a state trajectory for each batch in the training data.
Once a state trajectory has been identified for each batch, quality can be regressed
onto the terminal state of each batch to yield a linear model of the desired form.
Specifically, the matrices in this regression are:
Xreg =
[ˆx
(1)Tf
ˆx(2)Tf· · · ˆx
(B)Tf
](5.21)
182

Ph.D. Thesis - Brandon Corbett McMaster University - Chemical Engineering
where ˆx(b)Tf
denotes the state estimate after the final sampling instant in the bth batch.
Note that there is no requirement for the training batches to have equivalent length
(ie. Tf may be different for each batch).
Yreg =
[q
(1)Tf
q(2)Tf· · · q
(B)Tf
]
where q(b)Tf
is the terminal quality measurement in the database for the bth batch. The
result of this regression is a model of the form:
qTf = MqxTf + µq
where Mq is the coefficient matrix and µq is the intercept term that results from
appropriately centering the variables before the regression.
5.5 VD-SQMPC
In this section a model predictive control scheme is presented that uses the model
defined in Section 5.3 and identified in Section 5.4 in closed loop for direct quality
control. The decision space of this optimization problem includes future continuous
inputs and future discrete inputs. In addition, the proposed controller has the ability
to select the optimal duration of the batch. The proposed approach is one of the first
purely data driven, within-batch control designs to effectively incorporate batch dura-
183

Ph.D. Thesis - Brandon Corbett McMaster University - Chemical Engineering
tion as a decision variable. Furthermore, this result is achieved in a computationally
tractable manner that is suitable for online control.
To maintain a modest computational load, the proposed control problem is divided
into a two level optimization problem. The lower level controller is responsible for
determining the best input trajectory for a fixed batch duration. The upper level
selects between the solutions of the lower level to find the optimal duration. In
addition to the two optimization levels, a decision level is included in each calculation
step. This decision step is responsible for determining whether or not to terminate
the batch at the current sampling instant.
5.5.1 Inner MPC: fixed batch duration
This subsection discusses the lower level MPC for the proposed overall control ap-
proach. The objective of this level of MPC is to calculate the best input policy for a
fixed duration.
184

Ph.D. Thesis - Brandon Corbett McMaster University - Chemical Engineering
The optimization problem for this level of the control problem is given by:
minuk+1,uk+2,··· ,uTf ,ud1
,··· ,udL
(q − qset)′M (q − qset) +
Tf∑i=k+2
(ui − ui−1)′P (ui − ui−1) + · · ·
(5.22)
L∑l=1
(udl − udl,set)′Pd (udl − udl,set)
s.t. q = MqxTf + µq (5.23)
xi+1 =
Axi + Bui ∀k /∈ Kd
Ad (Axi + Bui) + Bdudi + cd ∀k ∈ Kd
∀ k + 1 ≤ i ≤ Tf − 1
(5.24)
xk+1 = ˆxk+1 (5.25)
umin ≤ ui ≤ umax (5.26)
udl,min ≤ udl ≤ udl,max (5.27)
where M is a positive-definite, symmetric, tuning matrix penalizing deviations of the
predicted quality for the candidate input from the target quality. In practice, it is
a natural choice to make this matrix a diagonal matrix so that the relative weight
on deviations from each of the quality targets can be set explicitly to reflect the
importance of each product quality to the end use of the product. P is also a positive-
definite, symmetric, tuning matrix which penalizes large input movements. This term
of the objective function provides a means of dampening input movements. Pd is
185

Ph.D. Thesis - Brandon Corbett McMaster University - Chemical Engineering
the final positive definite tuning matrix. The third term of the objective requires
a bit more analysis. Similar to the second term, Pd acts as an input dampening
matrix. However, since discrete inputs are made infrequently, the objective is not to
prevent movement as it is for the continuous inputs. Instead, the goal of this term
is to maintain discrete inputs close to a desired set point. The physical justification
of this is twofold. First, from an industrial operation perspective, it is desirable
to follow prior recipes as closely as possible. Second, and more importantly, this
term in the objective prevents undue extrapolation from the identified model. This
is particularly important for the discrete addition. While historical operation data
likely contains variations in continuous input policies (i.e., introduced by trajectory
tracking controllers rejecting disturbances) it is far less likely that a database rich in
discrete inputs is available. Naturally, in order to identify a discrete input model,
some variation in discrete inputs must be introduced in training batches. However,
even with these identification batches, it is likely that the training data for these
discrete input models will be less rich and it is therefore prudent to take extra steps
to avoid extrapolation.
Remark 41 Care must be taken in scaling the penalty matrices when unscaled engi-
neering units are used in the measurements and input levels. In this work, first tuning
matrices were set in an unscaled space so that a unity scaling would give equal influ-
ence to each variable in the objective. Next, tuning matrices were rescaled using the
average input and quality measurement levels. This allowed the control optimization
186

Ph.D. Thesis - Brandon Corbett McMaster University - Chemical Engineering
problem to be formulated in the original variables while providing consistent, intuitive
tuning parameters. An alternative and equivalent approach would be to rescale the
measurements before identification and control calculations.
The constraints in this level of the optimization problem enforce the identified
models, maintain operations between physical bounds on the system, and provide
the feedback mechanism for the control calculations. Specifically, equations 5.23 and
5.24 respectively enforce the quality and state models presented in Section 5.3 and
identified in Section 5.4. Equations 5.26 and 5.27 restrict continuous and discrete
inputs respectively between their operational bounds. Equation 5.25 implements the
current estimate of the state into the control calculation as the starting point for the
predicted state and quality predictions. This step is critical to the proposed method
and provides the feedback mechanism that allows the proposed control approach to
reject disturbances and drive the process to the desired set-point.
Note that all terms of the proposed optimization problem are quadratic and all
constraints are linear. Furthermore, all decision variables on this level of the MPC
are continuous bounded variables. As a result, the proposed optimization problem
is a relatively modest QP. Furthermore, the problem is convex. Therefore, exact
solutions to this lower level of the proposed control scheme can be calculated in a
computationally efficient manner.
The formulation proposed in this subsection provides a means to efficiently cal-
culate optimal input trajectories for a batch of fixed duration. However, as noted
187

Ph.D. Thesis - Brandon Corbett McMaster University - Chemical Engineering
earlier, batch duration is a key factor in determining batch quality. With this in
mind, the next subsection describes how the formulation from this section can be
used to implement an overall controller that considers batch duration as a decision
variable.
5.5.2 Outer MPC: selecting duration
The previous subsection described a control scheme to find the optimal input policy
for a batch process (including discrete and continuous inputs) given a fixed batch
duration, Tf . The control calculation depended on the current state estimate, ˆxk+1
and the current input uk. This subsection will refer to this mapping from state
estimate and input to optimal input as follows:
{u∗,u∗d, q∗} = C1
(Tf , ˆxk+1,uk
)
Where u∗ denotes the optimal continuous input trajectory and u∗d denotes the optimal
discrete input policy. By applying the identified models, the predicted quality result-
ing from implementing the calculated input trajectories, q∗, is also obtained. With
these definitions at hand, a policy for selecting the optimal duration can defined. The
188

Ph.D. Thesis - Brandon Corbett McMaster University - Chemical Engineering
optimization problem is as follows:
minTf∈Z
(q∗ − qset)′M (q∗ − qset) (5.28)
s.t. {u∗,u∗d, q∗} = C1
(Tf , ˆxk+1,uk
)(5.29)
Tf,min ≤ Tf ≤ Tf,max (5.30)
where Tf ∈ Z denotes that Tf is restricted to integer values. Note that this restriction
is necessary because the discretization of our dynamic models prevents their applica-
tion for partial sampling instances. The objective of this optimization problem is a
paired down version of the optimization problem at the lower level. In this work, the
design decision was made to eliminate the input movement suppression term and the
discrete input set-point term in the upper level MPC. This decision is motivated by
the fact that at the upper level, the input vector is of different lengths for different
batch durations. As a result, in extreme cases, a longer duration batch providing
better predicted quality could be overtaken in the objective function by a shorter
batch with fewer input movements to penalize. There is, however an argument for
including input movement in both levels of the MPC. That argument runs that if
smooth input trajectories are desirable, jumpy inputs should be penalized at all levels
and doing otherwise is inconsistent. One way to rectify these opposing views would be
to incorporate an input penalty weighting so that all input trajectory lengths would
be penalized equally.
189

Ph.D. Thesis - Brandon Corbett McMaster University - Chemical Engineering
Remark 42 In this work, focus is on processes where the primary economic benefits
come from tight quality control and therefore quality control is more important than
production rate. That said, for batch processes, batch duration fixes production rate.
As a result, in many industrial examples one objective of batch operations is to mini-
mize batch durations. In order to address these production goals, an alternative viable
configuration of the outer control level would be to select the minimum duration for
which the optimal quality, q∗Tf falls within an acceptable range. Note that, in this situ-
ation, it is better to make quality control a constraint: otherwise the optimal solution
could select short batch durations at the direct detriment of product quality. However,
note that with quality as a constraint, quality control to an exact quality set-point is
not feasible, instead one must settle for driving quality to an acceptable range.
Implementation of the optimization problem specified by equations 5.28 to 5.30
includes more subtleties compared to the lower level. The first subtlety arises from the
fact that the decision variable is an integer variable making the optimization an integer
programing problem. Furthermore, the constraint governing q∗ is itself a constrained
quadratic problem. Fortunately, the decision space for this optimization problem is
limited to a tightly bounded one dimension range. This small decision space and
the relatively quick solution of the lower level QP permits solution of this problem
by total enumeration. In subsection 5.5.4, where the practical implementation of the
proposed control design is discussed, further steps to solve this outer MPC problem
will be addressed.
190

Ph.D. Thesis - Brandon Corbett McMaster University - Chemical Engineering
Further improvement in the ability of our controller to reach the desired quality
can be achieved using the quality model to make an informed decision about when
to terminate a batch. In the next subsection logic is proposed to make this batch
termination decision.
5.5.3 Batch Termination
Recall that the quality model permits quality predictions from any state estimate.
With this in mind, one logical way to determine whether to terminate a batch would
be as follows: first calculate the quality corresponding to the current state estimate.
Apply the quality deviation term from the MPC objective function to this predicted
current quality. Next carry out the MPC calculations. If the objective of the quality
at the current sampling instant is less then the quality objective predicted by the
MPC, terminate the batch. This policy makes intuitive sense since it terminates the
batch if and only if the current predicted quality is better then any future quality.
Unfortunately, this approach will inevitably fail. To understand why, consider that it
is extremely improbable for any current state to produce exactly the correct quality.
However, the MPC will usually be able to invert the model in a way to drive the
quality to the set-point at some time in the future. Therefore, the termination policy
proposed above would lead to a controller continually ’chasing’ the set-point. The
factor that is unaccounted for in this termination method is that there is always
plant-model mismatch which is not accounted for in the predicted future qualities.
191

Ph.D. Thesis - Brandon Corbett McMaster University - Chemical Engineering
To overcome these difficulties, a different termination strategy is required.
The flawed termination logic proposed above has two logical features that make
it beneficial in theory. These are that the batch is terminated if the quality is very
close to the desired set-point and that the batch is terminated if no better quality is
expected in the future. Ideally, both of these features should be kept in the proposed,
effective termination logic. To achieve this, in the proposed approach two possible
termination criteria are considered. If either is true, the batch is terminated. The first
termination criteria is designed to address the current state. As before, the current
state-estimate is used to predict the current quality. Then, this predicted current
quality is checked to see if it is within a set of tight terminal quality bounds. If it is,
the batch is immediately terminated. This provides the first feature of termination
logic that the batch should terminate if it is very close to the desired quality target.
However, it does so while avoiding the chasing behavior that is set up by comparing
the current quality to potential future quality.
The second termination condition deals with the possibility that the current qual-
ity is better then any future qualities will be. This is achieved by asserting that a
batch should be terminated if the current time is equal to the optimal duration se-
lected by the controller at the previous sampling instant. Recall that the outer layer
of the MPC makes duration decision based on selecting the best quality from the
set of predicted qualities for all possible durations. Therefore, if the batch duration
selected in the last sampling instant is equal to the current time, it means that at
192

Ph.D. Thesis - Brandon Corbett McMaster University - Chemical Engineering
the last control calculation it was determined that any longer batch durations would
result in poorer quality objectives. Terminating based on duration selected in the
previous sampling instant effectively solves the set-point chasing problem since all of
the qualities considered by the outer MPC are pure prediction and therefore incorpo-
rate the same plant-model mismatch. In a sense, the comparison made by the outer
MPC when selecting duration is a comparison of apples to apples so the plant-model
mismatch is not a problem.
The previous three subsections have presented the fundamentals for a data-driven,
model predictive control scheme capable of direct quality control considering batch
duration as a decision variable. While these fundamentals provide a basis for the
method proposed in this work, practical implementation considerations and a few
heuristic methods are needed to achieve the most effective control. The next subsec-
tion outlines these practical considerations and provides a complete overview of the
proposed method.
5.5.4 Additional features and implementation
This subsection presents the so-called bells and whistles that make the methods pro-
posed in the previous subsection practicable. First, consider the timing of the pro-
posed method will addressed. Figure 5.1 shows the timing of the proposed MPC steps.
The process begins when the batch is charged. Immediately, the first measurement
is taken and the first continuous input is applied. Note that since there is no time
193

Ph.D. Thesis - Brandon Corbett McMaster University - Chemical Engineering
Figure 5.1: Flow diagram of timing of the proposed MPC scheme
between the first measurement becoming available and the first input being applied,
it is not possible to apply the MPC until the subsequent sampling instant. Instead,
for the first sampling instant of the process, a nominal input is used. After a new
measurement becomes available at sampling instant k, the observer is updated with
the new measurement. The observer update provides the state ˆxk. Since the input uk
has already been implemented, the next input to decide is uk+1. As such, the state
ˆxk+1 needs to be the basis of control calculations. To get ˆxk+1 the dynamic model
(and discrete input model if needed) is applied to the last available state estimate
ˆxk. Next, the prediction of ˆxk+1 is used in the termination calculations to determine
whether to end the batch. If the decision is made to terminate, the controller waits
until the end of the current (kth) sampling instant, discharges the batch and takes the
final quality and output measurements. Otherwise, the MPC calculations are carried
out to determine the optimal input policy. When the sampling instant is complete,
the discrete input and first input of the candidate input profile is implemented and
the process repeats.
In the beginning of the batch, the relatively small number of output measurements
available means that the state-estimate is relatively inaccurate. This inaccuracy arises
194

Ph.D. Thesis - Brandon Corbett McMaster University - Chemical Engineering
despite using our initial state model because the initial state model cannot account
for batch-to-batch variations in feed-stock. Importantly, the state estimate is the only
source of feedback informing the decision of input trajectory by the MPC. As a result,
using input trajectories calculated by the MPC based on an inaccurate state estimate
is, at best, unhelpful and at worst, could drive the process into a region of state-
space for which our models are inaccurate or for which the quality is far off-spec. To
avoid this, in practice tight bounds on the input trajectory (around a nominal input
trajectory) are applied for the first several sampling instances of a new batch. This
provides time for the observer to converge to a correct state estimate before large
input moves are implemented.
Like the beginning of the batch, special care must be taken towards the end of
the batch. However, unlike the beginning of the batch, the issues at the end of the
batch do not arise from inaccurate state estimates. Instead, the issue that needs to
be avoided is over-excitation of the process. Because the quality term in the objective
function only penalizes the last sampling instant, there is a large incentive (from an
optimization perspective) to make large input moves in the last few sampling instances
of the batch to exploit the linear dynamic model by exciting the process enough to
hit the desired quality. Of course, since this kind of excitation does not occur in any
of the training data, this input behavior takes the models well outside their range of
validity. Therefore, it is unlikely that this kind of policy will actually result in the
predicted behavior. To avoid this effect, tight bounds on input movements are placed
195

Ph.D. Thesis - Brandon Corbett McMaster University - Chemical Engineering
on a period towards the end of the batch.
Remark 43 In principal, there is an argument that tight input movement constraints
like the ones discussed above should be applied to all sampling instances throughout
the batch. It is true that large input movements cause model validity problems in
all time regions of the process. However, for every sampling instant where an input
movement constraint is included, two new inequality constraints must be added to the
optimization problem. In our experience, the tendency for the controller to proscribe
this kind of large input only occurs towards the end of the candidate input (likely
because the input movement penalty prevents it in other parts of the batch). Therefore,
in order to reduce the number of constraints and increase the computational speed, we
elected to only include input movement constraints for a window at the end of the
batch.
The final heuristic tweak used in this work are so-called blackout regions. Prac-
tically, these are user specified regions around critical batch events (discrete inputs,
batch termination, etc.) where rather then calculating new input trajectories at every
sampling instant, the candidate input trajectory from the last sampling instant be-
fore the blackout region is implemented. In this work, these regions are used around
discrete inputs and before batch termination. The justification for using blackout
regions after discrete additions is similar to that for using a restricted input range at
the beginning of a batch. Discrete inputs generally have a large, instantaneous impact
on the system state. As a result, directly after a discrete addition, it is likely that the
196

Ph.D. Thesis - Brandon Corbett McMaster University - Chemical Engineering
state-estimate will have higher then average error. Applying a blackout region after
the discrete addition provides the observer some time to converge and prevents input
decisions from being made with poor state estimates.
The justification for applying a blackout phase before discrete additions is more
nuanced. The benefit of this policy stems from the identification of the dynamic
model. Recall that for a period of i sampling instances before and after the addition,
it is impossible to identify a state trajectory during subspace identification. This
inability is because a window of i contiguous past and future output measurements are
needed. As a result, our dynamic models have a built-in blind-spot around the discrete
addition sampling instant. This slightly reduces the accuracy of the dynamic model
around those instances. From experimental observations, this inaccuracy appears to
particularly negatively impact the state observer around those sampling instances.
Once again, to avoid making detrimental input decisions based on inaccurate state
estimates, a blackout period is applied.
The same justification as the above about blackout regions before discrete inputs
can be made about the end of the batch. In the subspace identification step, state
values of any given training batch cannot be determined for i sampling instances
before batch termination. However, there is a second, stronger justification. It is
that applying a blackout period at the end of the batch further avoids the set-point
’chasing’ behavior described in subsection 5.5.3. Applying a blackout period at the
end of the batch ensures that the duration decision is made several sampling instances
197

Ph.D. Thesis - Brandon Corbett McMaster University - Chemical Engineering
Figure 5.2: Time line of implementation features that improve the ability of theproposed controller to obtain desired quality
before termination which effectively prevents the controller from chasing the set-point
trying to eliminate plant-model mismatch.
Remark 44 The most extreme extension of the blackout region concept is to use a
small number of fixed decision points throughout the batch and blackout all other sam-
pling instances. This decision point strategy has been widely proposed and accepted in
the batch literature [20]. The justification for this policy in general is to prevent undue
excitation of the process. It also has the benefit of allowing the operator to approve
candidate input trajectories after every decision point. For the proposed approach,
using decision points has some theoretical justification as well in that it potentially
reduces the amount of excitation of the process which allows the observer to converge
to a more accurate state estimate. However, the downside is that by limiting the num-
ber of times the trajectory is updated, the speed at which the controller can reject new
disturbances is also reduced.
198

Ph.D. Thesis - Brandon Corbett McMaster University - Chemical Engineering
5.6 Simulation study
This section demonstrates the efficacy of the proposed approach through an indus-
trially relevant simulation example. Specifically, this simulation study considers the
free radical polymerization reaction of polymethyl methacrylate (PMMA). In this
section, first a brief overview of the process, its objectives and its simulation are pre-
sented. Next the model building approach is demonstrated and validation results are
presented. Finally, the ability of the proposed controller to eliminate quality error
introduced through feed-stock disturbance is demonstrated.
5.6.1 Overview of PMMA process
In this study, PMMA quality is characterized by its number and weight average
molecular weight as well as the percent conversion of monomer to polymer. Therefore,
the control objective is to reach the desired values of these three variables by batch
termination.
The reaction takes place in a continuously stirred jacketed reactor where jacket
temperature is manipulated following a zero-order hold throughout the batch. Note
that it is assumed that jacket temperature dynamics are much faster then the reactor
dynamics so that, for modeling purposes, jacket dynamics are considered negligible.
At the beginning of each batch, the vessel is charged the monomer, the initiator
(AIBN), and the solvent (toluene). To simulate feed stock disturbances, normally
distributed errors are introduced to the initial charge recipe. The nominal recipe for
199

Ph.D. Thesis - Brandon Corbett McMaster University - Chemical Engineering
Table 5.1: Initial conditions for PMMA simulations
Ingredient Nominal initial concentration Standard deviationMonomer 3.0 kg/m3 0.5AIBN Initiator 1.03×10⁻² kg/m3 1×10⁻³
Temperature 61 ◦C 2.5
this initial charge, as well as the standard deviation for each ingredient, are presented
in Table 5.1.
To achieve the desired number and weight average molecular weight, the recipe for
this process calls for a mid-batch addition of monomer. In this work, it is assumed that
this addition is time indexed (i.e., made a specified amount of time after the initial
charge of the reactor). Specifically, the recipe calls for an addition of 1.3 kilograms of
monomer two hours after the start of the batch.
Throughout the batch, online measurements of reaction media temperature, den-
sity (calculated using volume measurements), and viscosity (calculated from stirrer
torque) are considered available with a sampling frequency of one minute. To simu-
late measurement noise, white noise was added to each of the measurements. To serve
as the simulation test bed, a nonlinear first-principles model from [37] was adapted
with appropriate changes from [38] and [39]. The final model consisted of nine states
dictated by non-linear ODEs. These states were the concentration of monomer, con-
centration of initiator, six states for the moments of the molecular weight distribution,
and the temperature. Throughout the study this model was treated as a purely black-
box model. The model was used to generate a database of historical and training data
and as a test bed for the proposed control.
200

Ph.D. Thesis - Brandon Corbett McMaster University - Chemical Engineering
Table 5.2: Tuning for benchmark PI trajectory tracking controller
Parameter Valuekc -.1τi 30
5.6.2 Existing PI Control
It is assumed that the batch has been historically operated under a PI controller track-
ing an optimal temperature trajectory taken from [37]. The overall rate of reaction
for each batch varies because of variations in the initial concentrations of initiator
and monomer. To account for this variation, alignment techniques were applied to
the set-point trajectory. Specifically, the set-point trajectory for a nominal batch
was indexed to density, which increases monotonically and captures overall reaction
progress. For new batches, the temperature set-point at any given sampling instant
was selected from the set-point from the nominal batch at the corresponding density.
With this alignment in place, the tracking PI controller was tightly tuned for a set
of batches to minimize the root mean squared tracking error. The resulting tuning
parameters for the PI are shown in Table 5.2. Despite the nonlinear dynamic response
of the reactor, the trajectory tracking performance of the PI controller was very good
as demonstrated in Figure 5.3.
To address the effects of batch duration on the quality for the PI trajectory tracking
case, density measurements were used. Because density reflects the average polymer
chain length, it also reflects, on some level, closeness to the desired molecular weight
201

Ph.D. Thesis - Brandon Corbett McMaster University - Chemical Engineering
0 50 100 150 200 250330
332
334
336
338
340
342
344
Time (min)
Tem
per
ature
(K)
Figure 5.3: Representative PI trajectory tracking response. Nominal set-point (dottedline), set-point aligned on density (dashed line), response (solid line)
distribution. For the PI case, this was exploited by using density measurements to
determine when to terminate a batch. Specifically, a density threshold was taken
from the nominal batch. For new batches, the reaction was carried out until either
the density threshold from the nominal batch was reached or the maximum amount
of time (five hours) had elapsed.
The PI trajectory tracking controller described above served two roles in this
work. First, it provided a reasonable way to simulate data available from historical
operation of an industrial process. This historical data was used in training and
validating models as discussed in the following subsections. The PI controller was
also used as a benchmark for comparison of the proposed model predictive control.
This PI scheme is a reasonable benchmark both because it is representative of the
202

Ph.D. Thesis - Brandon Corbett McMaster University - Chemical Engineering
Table 5.3: Composition of batch database for model identification
Batch input policy Number of batchesHistorical PI operation 20PI with perturbations of monomer addition 10PRBS added to nominal continuous input 3Nominal input shifted up or down by a constant 4
industrial state-of-the-art and because it provides a rudimentary implementation of
variable batch duration.
5.6.3 Training data generation
The first step in this simulation study was to generate an appropriate database of
historical and identification batches to use as training data for the proposed model
identification technique. To this end, a database of 37 batches was constructed. A
summary of the input policies for these batches is given in Table 5.3. Of these batches,
20 batches were generated under the PI trajectory tracking control as described in
the previous subsection. These batches were intended to simulate data that would be
available from historical process operation.
Ideally, all of the models could be identified from historical data which has the
distinct advantage of being cost free. In contrast, running identification batches may
yield off-spec product which is either less profitable or completely unsalable. Un-
fortunately, historical data alone is unlikely to provide a rich enough database to
adequately identify dynamic behavior. To improve the richness of the training data,
seven open loop training batches were generated (shown in Figure 5.4). Of these
203

Ph.D. Thesis - Brandon Corbett McMaster University - Chemical Engineering
0 50 100 150 200 250 300330
332
334
336
338
340
342
Time (min)
Jac
ket
Tem
per
ature
(K)
Figure 5.4: 7 identification input signals (3 PRBS (solid line) and 4 shifted nominal(dash dotted line)) added to the training database
batches, three were generated by implementing the nominal input trajectory shifted
by a pseudo-random binary sequence signal (PRBS). The remaining four identifi-
cation batches were generated by shifting the nominal input by a constant amount
(two shifted higher, two lower). These shifted nominal trajectories provide valuable
information because they illuminate the behavior of the process when inputs are oper-
ated near their limits, expanding the range in which identified models can be applied
without extrapolation.
In addition to dynamic identification batches, batches designed to identify effects
of monomer addition were also generated. Recall that in the existing control scheme,
the amount of monomer added in each batch was constant. In order to quantify the
effect of monomer addition, the amount added was varied linearly between 0 and 2.6
204

Ph.D. Thesis - Brandon Corbett McMaster University - Chemical Engineering
kilograms for the seven identification batches and 10 PI batches. The large number
of discrete input identification batches required is reflective of the fact that each of
these batches only provides one new datum point. This is in contrast to dynamic
identification batches which each provide hundreds of new dynamic observations.
Remark 45 For continuous processes, when closed loop controllers are applied, the
inputs are strongly dependent on the previous outputs because of the proportional mode
of the controller. Mathematically this is because of the constant set-point in this kind of
control design. Fortunately, for batch processes under trajectory tracking control, this
problem is alleviated by the constantly changing set-point trajectory. By implementing
a time-varying set-point, there is a component, independent from the output measure-
ments, that is introduced to the error at each sampling instant. Theoretically this
breaks the necessity to have purely open loop data for subspace identification. How-
ever, from a practical standpoint, open loop data still provides the richest dynamic
information for identification purposes.
5.6.4 Model training and validation
This subsection describes how the database identified in the previous subsection was
used to apply the methods discussed in Section 5.4 to identify a dynamic, discrete
input, initial state, and quality model for the PMMA process.
205

Ph.D. Thesis - Brandon Corbett McMaster University - Chemical Engineering
Dynamic model
The first step of the proposed identification approach is to identify a dynamic state-
space model from training-data outputs and inputs using subspace identification. Re-
call from Section 5.4.1 that the number of Hankel rows i and number of identified
states are user specified parameters. Generally speaking, the number of Hankel rows
should be selected to be slightly higher then the number of states. With this in mind,
focus can be solely on selecting an appropriate number of states.
In literature, subspace algorithms are shown to be capable of selecting system
order from training data based on the amount of explained variance. However, for
the transient systems in this work, selecting system order from training data alone is
fraught as it is impossible to tell if undue over-fitting has occurred. The solution is to
use a set of validation batches omitted from the training data. If the identified model
adequately predicts behavior of the validation batches, it is strong evidence that an
appropriate system order has been selected.
Remark 46 Even if the user has very good process knowledge, it is not straight-
forward to estimate the model order. This is because process knowledge only informs
the nonlinear evolution of fundamental states. A process which can be described well
with a small number of nonlinear fundamental states may require substantially more
LTI states to be described effectively. Similarly, it is possible that some fundamental
states are redundant and the process can be represented with substantially fewer LTI
subspace states.
206

Ph.D. Thesis - Brandon Corbett McMaster University - Chemical Engineering
The metric for validation is a comparison of predicted outputs and measured out-
puts from validation batches. In practice, validation is complicated by discrete inputs.
Consider the validation steps: first, an observer is constructed using the dynamic
model identified with a given number of states. Next, for each validation batch, the
observer is updated with observations from the beginning of the batch. This provides
a state estimate for sampling instant kpredstart. Next the dynamic model is applied
to make output predictions for the rest of the batch using the estimated state as an
initial condition and the input trajectory in the database. Unfortunately, however,
without first identifying a discrete input model, the effects of discrete additions can-
not be accounted for. Consequently, outputs occurring after discrete inputs cannot
be used for the validation. The solution is to identify the discrete input model prior
to validation. Doing so has the added advantage that validation evaluates accuracy
of the combined dynamic and discrete input models. As a result, the system order
that provides the best overall dynamic description of the process is selected. With
this in mind, in the next subsection identification of the monomer addition model is
discussed and validation results are presented for the combined models.
Mid batch addition model
As described in Section 5.6.1, the recipe for this process involves a single discrete input,
in the form of a shot of monomer, which takes place 120 minutes into the batch. To
identify the discrete input model the observer based on the dynamic model identified
in the previous subsection was updated, for each batch in the training data, first with
207

Ph.D. Thesis - Brandon Corbett McMaster University - Chemical Engineering
observations up to 119 minutes and then again with observations from 120 minutes
on. The resulting state-estimates were used to fit a regression model as discussed in
Section 5.4.2.
As mentioned in the previous subsection, the discrete input model and the dy-
namic model were validated together. For each potential system order, the root mean
squared error (RMSE) of output predictions for validation batches were calculated.
Each number of states between four and sixteen was tested. Based on these results,
it was determined that using six subspace states gave the best output predictions for
the validation batches. On this basis, the dynamic and discrete input models with six
states were used for the rest of this work.
Figure 5.5 shows the output results for the validation of the dynamic model. To
generate this figure, for each validation batch, first the observer was updated with
observations between 1 and 50 minutes. This provided the state estimate at k = 50.
Next the dynamic model was applied utilizing the actual inputs to the process. The
identified mid-batch model was applied as appropriate between the 119th and 120th
minutes. Finally, the complete state trajectories were used with the identified C andD
matrices to make output predictions for each validation batch. These results demon-
strate the predictive ability of both the dynamic model and the monomer addition
model.
As discussed earlier, for subsequent validation and closed-loop results, the initial
values of the states were the mean value of the indentifed states from the training
208
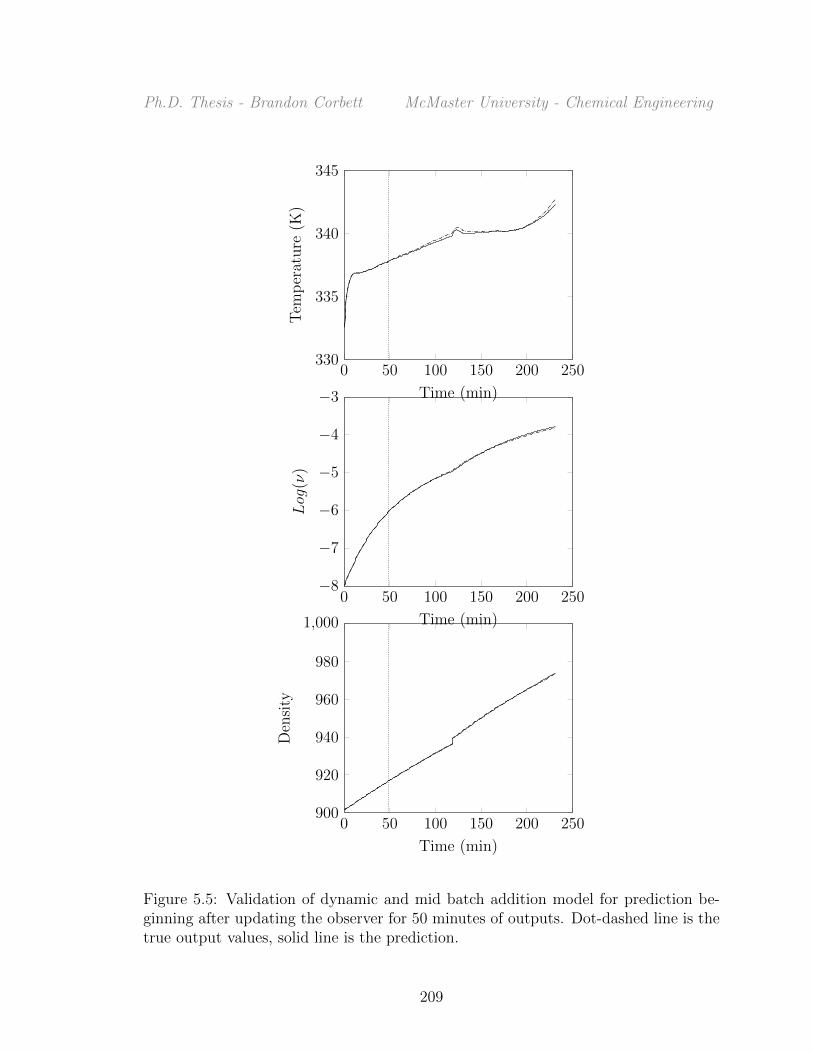
Ph.D. Thesis - Brandon Corbett McMaster University - Chemical Engineering
0 50 100 150 200 250330
335
340
345
Time (min)
Tem
per
ature
(K)
0 50 100 150 200 250−8
−7
−6
−5
−4
−3
Time (min)
Log
(ν)
0 50 100 150 200 250900
920
940
960
980
1,000
Time (min)
Den
sity
Figure 5.5: Validation of dynamic and mid batch addition model for prediction be-ginning after updating the observer for 50 minutes of outputs. Dot-dashed line is thetrue output values, solid line is the prediction.
209
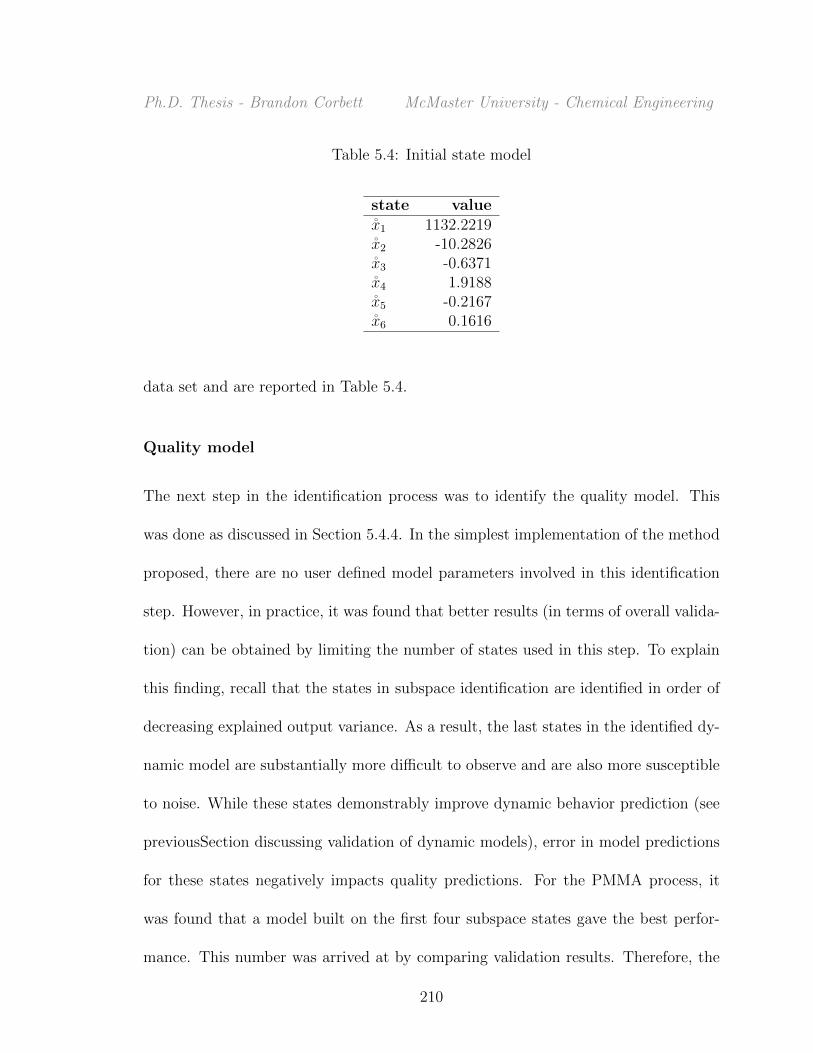
Ph.D. Thesis - Brandon Corbett McMaster University - Chemical Engineering
Table 5.4: Initial state model
state valuex1 1132.2219x2 -10.2826x3 -0.6371x4 1.9188x5 -0.2167x6 0.1616
data set and are reported in Table 5.4.
Quality model
The next step in the identification process was to identify the quality model. This
was done as discussed in Section 5.4.4. In the simplest implementation of the method
proposed, there are no user defined model parameters involved in this identification
step. However, in practice, it was found that better results (in terms of overall valida-
tion) can be obtained by limiting the number of states used in this step. To explain
this finding, recall that the states in subspace identification are identified in order of
decreasing explained output variance. As a result, the last states in the identified dy-
namic model are substantially more difficult to observe and are also more susceptible
to noise. While these states demonstrably improve dynamic behavior prediction (see
previousSection discussing validation of dynamic models), error in model predictions
for these states negatively impacts quality predictions. For the PMMA process, it
was found that a model built on the first four subspace states gave the best perfor-
mance. This number was arrived at by comparing validation results. Therefore, the
210

Ph.D. Thesis - Brandon Corbett McMaster University - Chemical Engineering
final identified quality model related four terminal subspace states to MN , MW , and
conversion.
To validate the identified quality model, the observer was applied to obtain termi-
nal state estimates for each of the validation batches. These terminal state estimates
were then applied in the quality model and the results compared to the actual mea-
sured qualities. This comparison is plotted in the bottom row plots in Figure 5.6.
The results clearly demonstrate the predictive ability of the model.
Overall validation
The last model identification step was a final, overall model validation. In this step,
the dynamic, discrete input, and quality models were combined to verify the predic-
tive ability of the coupled models. Similar to the dynamic validation procedure, first
the observer was applied for each batch with observations up to a specified prediction
start time. Next, these state estimates were applied in the dynamic and discrete input
models (as appropriate), using the input implemented for each validation batch, to
predict the terminal subspace state of each batch. Finally, the predicted terminal
subspace states were used to make quality predictions. This procedure provides valu-
able validation insights as it closely resembles the way these models are applied in
model predictive control. The results of this procedure for predictions starting at 50
minutes and 120 minutes are shown in Figure 5.6.
Remark 47 Note that quality predictions improve as the length of the prediction
211

Ph.D. Thesis - Brandon Corbett McMaster University - Chemical Engineering
0.85 0.9 0.95 1 1.05
·105
0.85
0.9
0.95
1
1.05·105
Mn Actual
Mn
Pre
dic
ted
1.45 1.5 1.55 1.6 1.65 1.7 1.75
·105
1.5
1.6
1.7
·105
Mw Actual
Mw
Pre
dic
ted
Prediction from 50 min
0.58 0.6 0.62 0.64 0.66 0.68 0.70.58
0.6
0.62
0.64
0.66
0.68
0.7
Actual Conversion
Pre
dic
ted
Con
vers
ion
0.85 0.9 0.95 1 1.05
·105
0.85
0.9
0.95
1
1.05·105
Mn Actual
Mn
Pre
dic
ted
1.45 1.5 1.55 1.6 1.65 1.7 1.75
·105
1.5
1.6
1.7
·105
Mw Actual
Mw
Pre
dic
ted
Prediction from 180 min
0.58 0.6 0.62 0.64 0.66 0.68 0.70.58
0.6
0.62
0.64
0.66
0.68
0.7
Actual Conversion
Pre
dic
ted
Con
vers
ion
0.85 0.9 0.95 1 1.05
·105
0.85
0.9
0.95
1
1.05·105
Mn Actual
Mn
Pre
dic
ted
1.45 1.5 1.55 1.6 1.65 1.7 1.75
·105
1.5
1.6
1.7
·105
Mw Actual
Mw
Pre
dic
ted
Prediction from terminal state
0.58 0.6 0.62 0.64 0.66 0.68 0.70.58
0.6
0.62
0.64
0.66
0.68
0.7
Actual Conversion
Pre
dic
ted
Con
vers
ion
Figure 5.6: Rows 1 and 2 - Overall validation of the combined models for predictionsstarting 50 minutes and 180 minutes after the beginning of the batch. Row 3 -Validation of the quality model for ’true’ terminal state. (Note: points on the diagonalrepresent perfect predictions)
212

Ph.D. Thesis - Brandon Corbett McMaster University - Chemical Engineering
horizon shrinks and more observations are used in the estimator. In the beginning
of the batch, using the first 50 minutes of measurements, quality predictions are not
accurate but are good enough to inform input moves of the correct direction. By the
end of the batch, predictions improve allowing for tight quality control. This creates
a stabilizing effect where, as the batch gets closer to termination, better predictions
allow for appropriate inputs to fine tune the final quality.
5.6.5 Tuning
With the models identified, the next step was to construct the model predictive control
for this process. This was done following the framework laid out in Section 5.5. In
practice, determining reasonable values for each of the tuning parameters can be
challenging. For the base case, the tuning parameters needing to be identified are:
the quality penalty, the input movement penalty, the observer initial state penalty,
the observer output penalty, and the observer state validity penalty. When one also
includes the features discussed in Section 5.5.4, additional tuning parameters are
introduced. These are the duration of restricted input movements at the start of the
batch, the duration of the black-out regions at discrete inputs and at the end of the
batch, and the duration of the restricted input movement at the end of the batch. In
principal, this large number of tuning parameters could be a distinct downside to the
proposed method. Fortunately, it was found that the method is fairly insensitive to
the values of the selected tuning parameters.
213

Ph.D. Thesis - Brandon Corbett McMaster University - Chemical Engineering
0 2 4 6 8 10 12 14 16 18 200
5
10
15
20
25
30
35
Tuning number
Abso
lute
Per
cent
Err
or(%
)
MPC tunings MAPEMAPE PI
Maximum absolute percentage error of PI
Figure 5.7: Comparison of 20 random tunings for the proposed controller applied to 10representative batches. Plotted points are mean absolute percentage errors (MAPE)for all three qualities and all 10 batches. Error bars show the maximum and minimumobserved absolute percentage errors over the 10 batches and 3 qualities. Similarly,the dot-dashed line shows the MAPE for the same batches under PI control and thedashed line shows the maximum absolute percentage error for PI.
To demonstrate that the proposed method is robust to tuning parameter selection,
simulations of batches, starting from a representative set of 10 initial conditions, were
repeated for 20 randomly selected tunings. The results, in terms of mean, maximum,
and minimum relative error for each tuning are shown in Figure 5.7. Note that,
for all but three tunings, the mean absolute percentage error was lower then that
for PI trajectory tracking. In 14 of the 20 tunings, the maximum error over the
three qualities and 10 batches was also reduced. This demonstrates the relatively low
sensitivity of the proposed approach to the specific values of tuning parameters.
214

Ph.D. Thesis - Brandon Corbett McMaster University - Chemical Engineering
Table 5.5: Controller tuning used for the closed loop studies. Note that all penaltiesare rescaled so that presented represent relative weight in the objective function (basedon magnitude of variables they penalize)
Tuning Parameter ValuePenalty on MN 10Penalty on MW 4Penalty on conversion 8Jacket Temp. Movement Penalty 0.5Observer Initial State Penalty diag(.01)Observer Innovation Penalty diag(200)Observer State Validity Penalty diag(60)Initial input restriction 50 minutesBlackout before monomer addition 25 minutes
following monomer addition 15 minutesbefore batch termination 50 minutes
Batch end input movement restriction 30 minutes
For the remainder of this simulation study, the tuning parameters presented in
Table 5.5 are used. This tuning was selected from a Monte Carlo approach similar to
the one described above. Clearly, this kind of Monte Carlo tuning is not practicable
for an actual process. However, this approach was used in this work in an effort to
demonstrate the efficacy for control of models identified using the proposed identifi-
cation approach. Future work will address tuning using a more explicit and practical
procedure.
5.6.6 Closed loop results
To demonstrate the efficacy of the proposed control structure, the models identified in
the previous subsections were applied in the control framework presented in Section
215

Ph.D. Thesis - Brandon Corbett McMaster University - Chemical Engineering
5.5. To demonstrate the flexibility of the proposed approach, two case studies were
carried out. For both case studies in this section, the same 200 initial conditions,
different from the training and validation set, were used. These initial conditions were
drawn from a normal distribution centered on the nominal initial batch condition.
Table 5.1 shows the nominal initial fundamental state and the standard deviation
in each initial condition. The two case studies differ only in the selected quality
set-point. Therefore, comparison of these studies demonstrates the efficacy of the
proposed approach to drive the process to the desired quality.
Base Case: Nominal Quality Set-point
In the first case study, the quality set-point for the controller was taken from a nom-
inal batch in the training database. For the nominal batch, the initial fundamental
state was exactly the nominal initial fundamental state and trajectory tracking was
applied. At the discrete monomer addition, the nominal amount of monomer was
added. Because every variable in the nominal batch was forced to the middle of its
distribution, the nominal batch quality represents a reasonable expectation for the
quality arising from PI trajectory tracking. Therefore, it is a good set-point to use for
the proposed controller to provide a comparison to the trajectory tracking approach.
Figure 5.8 shows histograms of the qualities achieved by the proposed VD-SQMPC
compared to the trajectory tracking control for the first case study. Clearly, the
proposed control scheme is able to reduce the variance of all three quality variables
compared to PI trajectory tracking. Specifically, the mean absolute percentage error
216

Ph.D. Thesis - Brandon Corbett McMaster University - Chemical Engineering
−20 −10 0 10 200
20
40
SQ
MP
Cbat
ches
(%)
MN
−20 −10 0 10 200
20
40
MW
−20 −10 0 10 200
20
40
Conversion
−20 −10 0 10 200
20
40
Relative error (%)
PI
bat
ches
(%)
−20 −10 0 10 200
20
40
Relative error (%)
−20 −10 0 10 200
20
40
Relative error (%)
Figure 5.8: Histograms of relative errors in qualities resulting from PI trajectorytracking and the proposed VD-SQMPC control schemes for the base case
(MAPE) values for the base case for both the PI and VD-SQMPC are shown in
Table 5.6. Furthermore, in 172 out of the 200 batches, the magnitude of the error
was reduced for every one of the three quality measurements when compared with PI
control. Figure 5.9 shows a scatter plot matrix of qualities resulting from both PI
trajectory tracking and the proposed VD-SQMPC. Note that the VD-SQMPC rejects
disturbances in initial condition and, as a result, significantly tightens the cluster of
qualities obtained.
Figure 5.10 shows the input trajectories for five representative batches from the
proposed VD-SQMPC approach. PI trajectories for the same batches are shown in
light gray for reference. Interestingly, the shape of the input trajectory proscribed
217

Ph.D. Thesis - Brandon Corbett McMaster University - Chemical Engineering
Table 5.6: Mean absolute percentage error (MAPE) in qualities resulting from PI andthe proposed VD-SQMPC control schemes
Quality Variable VD-SQMPC (%) PI (%)Conversion 1.67 6.13Mn 1.61 8.66Mw 1.90 7.87
1.3 1.4 1.5 1.6 1.7
·105
0.8
0.9
1
·105
Mw
Mn
0.5 0.6 0.7 0.8
0.8
0.9
1
·105
PI Trajectory TrackingVD-SQMPC Base CaseVD-SQMPC Setpoint ChangeNominal Quality Set-pointSet-point Change Quality Set-point
0.5 0.6 0.7 0.8
1.3
1.4
1.5
1.6
1.7
·105
Conversion (%)
Mw
Figure 5.9: Scatter plot matrix showing quality set-points for both case studies andresulting qualities achieved by PI and VD-SQMPC. Note that all three data setscontain the same initial conditions and quality results are achieved purely throughcontinuous and discrete inputs
218

Ph.D. Thesis - Brandon Corbett McMaster University - Chemical Engineering
0 0.5 1 1.5 2 2.5 3 3.5 4 4.5 5334
335
336
337
338
339
340
341
342
Time (hr)
Jac
ket
Tem
per
ature
(K)
PI inputVD-SQMPC inputMonomer added
Figure 5.10: Representative input trajectories for the base case.
by the VD-SQMPC varies substantially between batches. This variation reflects the
different actions taken by the proposed controller to reject disturbances in the initial
conditions. In addition to selecting an appropriate continuous input, the VD-SQMPC
is able to coordinate the approach to the continuous input with the discrete addition of
monomer. Figure 5.11 is a histogram of the monomer addition amounts for the batches
in the base case. The fairly even distribution of monomer addition amounts indicates
that the inverted empirical models are able to appropriately proscribe monomer ad-
dition amounts.
Remark 48 It is interesting to note the high percentage of batches for which the
219

Ph.D. Thesis - Brandon Corbett McMaster University - Chemical Engineering
0 0.5 1 1.5 2 2.5
0
5
10
15
20
25
Additional monomer (kg)
Bat
ches
(%)
Figure 5.11: Histogram of monomer added in the base case.
maximum allowable monomer addition (2.5 kg) was made. Since a large number of
batches hit this upper bound, it indicates that there would potentially be an advantage
to increasing the limit on added monomer. However, to do this, additional training
batches with greater amounts of added monomer would be necessary to expand the
range of monomer additions. In principle, this could readily be done by using these
new batches to re identify the model and use for the purpose of closed-loop control.
Figure 5.12 is a histogram of the batch durations selected by the controller. In-
terestingly, the distribution is centered very near the nominal batch duration of 240
minutes. This makes intuitive sense since the duration of the reaction has a strong
impact on the degree of completion of the reaction and therefore the resulting quality.
220

Ph.D. Thesis - Brandon Corbett McMaster University - Chemical Engineering
200 210 220 230 2400
10
20
30
Batch durations (min)
Bat
ches
(%)
Base caseExtreme quality set-point
Figure 5.12: Histograms of batch durations for the base case and the new qualityset-point
5.6.7 Case Two: Set-Point Change
In the second case study, the set-point of the controller was changed. Specifically, a
quality from an extreme outliers of the qualities obtained by the PI control scheme
in the first case study was selected as a new target. Figure 5.13 is a histogram of
the resulting relative error in qualities obtained in this case. Note that, in contrast
to the previous case study, there is no meaningful way to compare these results to
the PI control scheme. That is because there is no way to directly specify a quality
set-point under the PI control scheme. Instead, to make a quality change in the
trajectory tracking approach, a new temperature trajectory expected to result in the
desired quality would have to be determined. This difficulty is one of the principal
shortcomings of trajectory tracking control.
Figure 5.9 also shows the resulting qualities for this second case. Clearly, the
221

Ph.D. Thesis - Brandon Corbett McMaster University - Chemical Engineering
−20 0 200
10
20
30
SQ
MP
Cbat
ches
(%)
MN
−20 0 200
10
20
30
MW
−20 0 200
10
20
30
Conversion
−20 0 200
10
20
30
Relative error (%)
PI
bat
ches
(%)
−20 0 200
10
20
30
Relative error (%)
−20 0 200
10
20
30
Relative error (%)
Figure 5.13: Histograms of the qualities resulting from the proposed controller witha new quality set-point. (The dashed line is the set-point from the base case.)
proposed control scheme is able to drive batches closer to the desired quality. That
said, in both Figures 5.9 and 5.13, it is apparent that the quality control attained in
this case is not nearly as tight as that from the base case. The decrease of performance
in this case is directly related to the empirical modeling process. Note that models for
this second case are not re-identified, instead models from the base-case are applied
at the far limit of their validity range. This kind of extrapolation from the training
data naturally degrades the predictive ability of the models and therefore their ability
to provide good quality control.
Figure 5.12 shows (in dark gray) the histogram of batch durations used in this
222

Ph.D. Thesis - Brandon Corbett McMaster University - Chemical Engineering
second case study. Clearly, one of the key ways that the controller is able to meet
the new quality set-point is by appropriately shortening the duration of the batch.
This capability to recognize and act on the influence of batch durations is one of the
strongest advantages of the proposed method.
Remark 49 Ideally, one would like to be able to improve the performance for each
subsequent batch after a quality set-point change. Intuitively, this should be achievable
because each batch operated with the new set-point provides added information about
operations in the new state-space region. To achieve this, one option is to add an
adaptation step to retrain the models after each batch is complete using the new ob-
servations from that batch. In practice, this kind of adaptation needs to be approached
carefully because there may be a risk of reducing the predictive ability of the models
by diluting the valuable insights from identification batches with too much closed loop
data. As such, methods to successfully adapt the models between batches is an area of
future research.
5.7 Conclusions
In this work, results from [32] were generalized to encompass two key features of batch
processes: namely, discrete inputs were incorporated and batch duration was included
as a control decision variable. We approached these problems in two steps. First, a
new model structure and a corresponding identification method for that structure
223

Ph.D. Thesis - Brandon Corbett McMaster University - Chemical Engineering
are proposed to relate process measurements, continuous inputs, and discrete inputs
to product quality. Next, a model predictive control scheme was designed for direct
quality control. Through a simulation example, the efficacy of this approach was
demonstrated. The results of this simulation study clearly demonstrate the advantage
of including batch duration as a decision variable.
Bibliography
[1] Unspecified; SOCMA by the Numbers ; 2016;http://specialtymanufacturing.socma.com/Helpful-Links-Resources/By-the-Numbers.
[2] Bequette, B. Industrial & Engineering Chemistry Research 1991, 30, 1391–1413.
[3] Berber, R. Chemical Engineering Research & Design 1996, 74, 3–20.
[4] Aumi, S.; Corbett, B.; Mhaskar, P.; Clarke-Pringle, T. IEEE Transactions onControl Systems Technology 2013, 21, 94–106.
[5] Golshan, M.; MacGregor, J. F.; Mhaskar, P. Journal of Process Control 2011,21, 1345–1358.
[6] Flores-Cerrillo, J.; MacGregor, J. Journal of Process Control 2005, 15, 651–663.
[7] Shi, D.; El-Farra, N.; Li, M.; Mhaskar, P.; Christofides, P. Chemical EngineeringScience 2006, 61, 268–281.
[8] Bonvin, D.; Srinivasan, B.; Hunkeler, D. IEEE Control Systems Magazine 2006,26, 34–45.
[9] Nayhouse, M.; Tran, A.; Kwon, J. S.-I.; Crose, M.; Orkoulas, G.; Christofides,P. D. Chemical Engineering Science 2015, 134, 414–422.
[10] Valappil, J.; Georgakis, C. AIChE Journal 2003, 49, 1178–1192.
[11] Bonvin, D.; Srinivasan, B. Computers & Chemical Engineering 2013, 51, 172–180.
[12] Rafizadeh, M.; Solgi, R.; Abbaszadeh, M. In CCA 2003: Proceedings of 2003IEEE Conference on Control Applications, Vols 1 and 2 ; IEEE; pp 464–469.
224

Ph.D. Thesis - Brandon Corbett McMaster University - Chemical Engineering
[13] Kozub, D.; Macgregor, J. Chemical Engineering Science 1992, 47, 929–942.
[14] Nayhouse, M.; Kwon, J. S.-I.; Christofides, P. D.; Orkoulas, G. Chemical Engi-neering Science 2013, 87, 216–223.
[15] Li, R.; Prasad, V.; Huang, B. Processes 2016, 4.
[16] Kiparissides, A.; Koutinas, M.; Kontoravdi, C.; Mantalaris, A.; Pistikopoulos,E. N. Automatica 2011, 47, 1147–1155.
[17] Kourti, T. Journal of Chemometrics 2003, 17, 93–109.
[18] Nomikos, P.; MacGregor, J. AIChE Journal 1994, 40, 1361–1375.
[19] Nomikos, P.; Macgregor, J. Technometrics 1995, 37, 41–59.
[20] Flores-Cerrillo, J.; MacGregor, J. Journal Of Process Control 2004, 14, 539–553.
[21] Kassidas, A.; MacGregor, J.; Taylor, P. AIChE Journal 1998, 44, 864–875.
[22] Kwon, J. S.-I.; Nayhouse, M.; Orkoulas, G.; Ni, D.; Christofides, P. D. Industrial& Engineering Chemistry Research 2015, 54, 4293–4302.
[23] Flores-Cerrillo, J.; MacGregor, J. Industrial & Engineering Chemistry Research2005, 44, 9146–9155.
[24] Clarke-Pringle, T.; MacGregor, J. Industrial & Engineering Chemistry Research1998, 37, 3660–3669.
[25] Chin, I.; Lee, K.; Lee, J. Industrial & Engineering Chemistry Research 2000, 39,693–705.
[26] Lee, J. H.; Lee, K. S. Control Engineering Practice 2007, 15, 1306–1318.
[27] Lee, K.; Chin, I.; Lee, H.; Lee, J. AIChE Journal 1999, 45, 2175–2187.
[28] Camacho, J.; Pico, J.; Ferrer, A. AIChE Journal 2007, 53, 1789–1804.
[29] Dorsey, A.; Lee, J. Journal of Process Control 2003, 13, 397–406.
[30] Chen, L.; Khatibisepehr, S.; Huang, B.; Liu, F.; Ding, Y. AIChE Journal 2015,61, 3270–3287.
[31] Aumi, S.; Mhaskar, P. AIChE Journal 2012, 58, 2105–2119.
[32] Corbett, B.; Mhaskar, P. AIChE Journal 2016, 62, 1581–1601.
[33] Aumi, S.; Corbett, B.; Clarke-Pringle, T.; Mhaskar, P. AIChE Journal 2013,59, 2852–2861.
225

Ph.D. Thesis - Brandon Corbett McMaster University - Chemical Engineering
[34] Moonen, M.; Demoor, B.; Vandenberghe, L.; Vandewalle, J. International Jour-nal of Control 1989, 49, 219–232.
[35] VanOverschee, P.; DeMoor, B. Automatica 1995, 31, 1853–1864; 10th IFACSymposium on System Identification, Copenhagen, Denmark, JUL 04-06, 1994.
[36] Muske, K.; Rawlings, J.; Lee, J. In Proceedings of the 1993 American ControlConference, Vols 1-3 ; pp 900–904.
[37] Ekpo, E. E.; Mujtaba, I. M. Neurocomputing 2008, 71, 1401–1412.
[38] Fan, S.; Gretton-Watson, S.; Steinke, J.; Alpay, E. Chemical Engineering Science2003, 58, 2479–2490.
[39] Rho, H.; Huh, Y.; Rhee, H. Chemical Engineering Science 1998, 53, 3729–3739.
226

Chapter 6
Conclusions and Future ResearchDirections
227

Ph.D. Thesis - Brandon Corbett McMaster University - Chemical Engineering
In this chapter, we will draw conclusions from the current work and present a few
ideas for future research.
6.1 Conclusion
This thesis presented two novel approaches for data-based modeling and quality con-
trol of batch processes. The first of these approaches, discussed in Chapters 2 and 3,
adapts the well studied technique of using PLS models to make quality predictions
from complete batch measurement and input trajectories. The novel aspect in these
chapters is the use of a data-driven, multiple-model dynamic modeling approach to
fill future measurement trajectories before batch completion. In Chapter 2, the fun-
damentals for this method of quality control were discussed. To demonstrate the
efficacy of this approach, simulation examples were carried out on a batch nylon-6,6
polymerization reactor. Results were notably improved over PI trajectory tracking
control which is the industrial standard for this process.
In the next chapter, Chapter 3, the results from the previous chapter were ex-
tended to a batch PMMA polymerization reactor. In this work, constraints were
added to the quality control scheme to ensure model validity. Closed-loop simula-
tions demonstrated that these model validity constraints were often active in optimal
input profiles. To address the apparent need to broaden these constraints, without
dramatically increasing the need for identification batches, a basic adaptive scheme
was adopted such that each new closed-loop batch could broaden the model validity
228

Ph.D. Thesis - Brandon Corbett McMaster University - Chemical Engineering
range. As with the nylon-6,6 process from the preceding chapter, closed-loop results
for the PMMA process demonstrated that this method could effectively reduce quality
variance. Specifically, average relative errors in number average and weight average
molecular weight were reduced from 20.4% and 19.0% for the PI trajectory tracking
to 10.3% and 7.4% for the proposed approach.
Remark 50 Note that the PMMA reactor, first described in Chapter 3, was used as
a simulation test-bed for each of the remaining chapters. It is important to highlight
that no direct inferences should be gleaned from comparison of the closed-loop results
in each of these cases: conditions were varied between these studies to facilitate study
of different aspects of the batch control problem. However, the similarity between
the simulation examples does permit observation of an overall trend of increasing
effectiveness from one study to the next.
In Chapter 4, a novel state-space based approach was introduced for data-driven
batch modeling and quality control. To achieve this, subspace identification methods
were adapted for use with batch data. Using these methods, LTI dynamic models
were identified that described the evolution and captured the underlying state of
the process. The resulting subspace states were then related to quality. The over-
all resulting model provided a time-independent, causal link between batch inputs,
measurements and the resulting quality. This relationship was inverted using a shrink-
ing horizon model predictive control scheme for direct quality control. Notably, the
method permitted models to be built from variable duration training batches without
229

Ph.D. Thesis - Brandon Corbett McMaster University - Chemical Engineering
using alignment techniques. The ability of the proposed approach was demonstrated
on the PMMA simulation example. In so doing, the ability of the proposed controller
for both disturbance rejection and quality set-point tracking was demonstrated.
Finally, in Chapter 5, the results from Chapter 4 were extended with two addi-
tional contributions. These were the inclusion of discrete inputs and variable batch
duration as decision variables in the control scheme. This was achieved in two steps:
first, a comprehensive methodology for identification of models with instantaneous
discrete inputs was proposed. Next, a new, two-layer, shrinking-horizon model pre-
dictive control scheme was proposed. Through simulations of the PMMA process, the
increased quality control ability afforded by these additions was demonstrated.
6.2 Future Research
The results presented in this thesis provide a starting-point for a wide variety of new
research directions in batch and batch-like control. Some of these research directions
are already under investigation by other members of the Mhaskar research group.
Others will be the topic of a planned postdoctoral collaboration with the tech com-
pany, ProSensus. This section provides a few very brief thoughts on two of these
future directions.
230

Ph.D. Thesis - Brandon Corbett McMaster University - Chemical Engineering
6.2.1 Incorporating Additional, Infrequent Measurements
In the current work, we have considered online measurements available frequently
during the course of a batch. However, industrially it is common that other, less
frequent measurements are also available. These additional measurements potentially
provide valuable information about the state of the process that may not be captured
by the online measurements alone. In some cases, complete measurements of mid-
batch qualities may be available. The challenge, however, is that these additional
measurements are often the result of slow lab analysis. As a result, such measurements
are typically only available with substantial (relative to batch duration) delays.
One fairly easily implementable adaptation to the method proposed in Chapter
5 would exploit infrequent measurements. In order to incorporate these measure-
ments into the state-estimation process, and therefore use the information contained
in them for control, two steps would need to be accomplished. The first step would be
to build a model relating historical supplemental mid-batch measurements to the cor-
responding best state-estimate obtained from complete historical online measurement
trajectories. This step is similar to the quality modeling step in Chapter 5. Next,
a term penalizing prediction error for the identified mid-batch measurement model
would be added to the observer. In a new batch, this new observer term would be
given zero weight until the measurement became available, at which point the term
would incorporate the new measurement into the current state estimate. Note that
this approach would elegantly deal with the delay in the measurement and provide a
231

Ph.D. Thesis - Brandon Corbett McMaster University - Chemical Engineering
means to use infrequent measurements for quality control.
6.2.2 Better Framework for Adaptive Models
In Chapter 3, we presented a rudimentary method for adapting models with the
results from new closed-loop batches. Namely, after each new batch, the resulting
trajectories were added to the training data and the models retrained. In that work,
this adaptation was incorporated as a means to slowly improve model validity without
the need for excessive numbers of training batches. However, industrially, there is a
different and more critical need for model adaptation.
All industrial processes ‘drift’ over time. In this context, the word drift refers to the
fact that process dynamics change slowly as equipment ages, heat exchangers foul,
catalysts degrade, etc.. Accordingly, these drifting effects need to be incorporated
into data-driven models to maintain successful control performance. The adaptation
method discussed in Chapter 3 provides some adaptive ability but is not practical for
long term use because the training data set would become prohibitively large with
time. This highlights the need to develop more explicit ways to adapt the proposed
models as new batch data becomes available.
232