![pure.uvt.nl€¦ · 3 &KZ /'E E d/KE > WZ/^KE Z^ ñ ó ] ( } u Z ô ó } µ v ] ] ] o } } ] o } u } v](https://static.fdocuments.net/doc/165x107/5f082d167e708231d420b7a4/pureuvtnl-3-kz-e-e-dke-wzke-z-u-z-v-.jpg)
pure.uvt.nl€¦ · 3 &KZ /'E E d/KE > WZ/^KE Z^ ñ ó ] ( } u Z ô ó } µ v ] ] ] o } } ] o } u } v

Tilburg University
Estimating the reproducibility of psychological science
Open Science Collaboration; Aarts, Alexander A.; Anderson, Joanna E.; Anderson,Christopher J.; Attridge, Peter R.; Attwood, Angela; Axt, Jordan; Babel, Molly; Bahnik,Stepan; Baranski, Erica; Barnett-Cowan, Michael; Bartmess, Elizabeth; Beer, Jennifer; Bell,Raoul; Bentley, Heather; Beyan, Leah; Binion, Grace; Borsboom, Denny; Bosch, Annick;Bosco, Frank A.; Bowman, Sara D.; Brandt, Mark; Braswell, Erin; Brohmer, Hilmar; Brown,Benjamin T.; Brown, Kristina; Bruening, Jovita; Calhoun-Sauls, Ann; Callahan, Shannon P.;Chagnon, Elizabeth; Chandler, Jesse; Chartier, Christopher R.; Cheung, Felix;Christopherson, Cody D.; Cillessen, Linda; Clay, Russ; Cleary, Hayley; Cloud, Mark D.; Cohn,Michael; Cohoon, Johanna; Columbus, Simon; Cordes, Andreas; Costantini, Giulio;Hartgerink, Chris; Krijnen, Job; Nuijten, Michèle; van 't Veer, Anna E.; van Aert, Robbie; vanAssen, Marcus; Wissink, Joeri; Zeelenberg, Marcel; Rahal, RimaPublished in:Science
Document version:Peer reviewed version
DOI:10.1126/science.aac4716
Publication date:2015
Link to publication
Citation for published version (APA):Open Science Collaboration, & Rahal, R. M. (2015). Estimating the reproducibility of psychological science.Science, 349(6251), [aac4716]. https://doi.org/10.1126/science.aac4716
General rightsCopyright and moral rights for the publications made accessible in the public portal are retained by the authors and/or other copyright ownersand it is a condition of accessing publications that users recognise and abide by the legal requirements associated with these rights.
- Users may download and print one copy of any publication from the public portal for the purpose of private study or research - You may not further distribute the material or use it for any profit-making activity or commercial gain - You may freely distribute the URL identifying the publication in the public portal

Reproducibility Project
1
MANUSCRIPT
DOWNLOADED
FOR
RESUBMISSION TO
SCIENCE AT 1:49P
ET ON JULY 20,
2015
Reproducibility Project
2
Estimating the Reproducibility of Psychological Science
Group Author: Open Science Collaboration1
Abstract
Reproducibility is a defining feature of science, but the extent to which it characterizes current
research is unknown. We conducted replications of 100 experimental and correlational studies
published in three psychology journals using high-powered designs and original materials when
available. Replication effects were half the magnitude of original effects, representing a
substantial decline. Ninety-seven percent of original studies had significant results. Thirty-six
percent of replications had significant results; 47% of original effect sizes were in the 95%
confidence interval of the replication effect size; 39% of effects were subjectively rated to have
replicated the original result; and, if no bias in original results is assumed, combining original
and replication results left 68% with significant effects. Correlational tests suggest that
replication success was better predicted by the strength of original evidence than by
characteristics of the original and replication teams.
Abstract word count = 149 words
Keywords = Reproducibility, psychology, replication, meta-analysis, decline effect
Authors’ Note: Authors are listed alphabetically. This project was supported by the Center for
Open Science and the Laura and John Arnold Foundation. The authors declare no financial
conflict of interest with the reported research.
1The full author list is included at the end of the manuscript.

Reproducibility Project
3
Reproducibility is a core principle of scientific progress (1-6). Scientific claims should not
gain credence because of the status or authority of their originator but by the replicability of their
supporting evidence. Scientists attempt to transparently describe the methodology and
resulting evidence used to support their claims. Other scientists agree or disagree whether the
evidence supports the claims, citing theoretical or methodological reasons, or by collecting new
evidence. Such debates are meaningless, however, if the evidence being debated is not
reproducible.
Even research of exemplary quality may have irreproducible empirical findings because
of random or systematic error. Direct replication is the attempt to recreate the conditions
believed sufficient for obtaining a previously observed finding (7, 8) and is the means of
establishing reproducibility of a finding with new data. A direct replication may not obtain the
original result for a variety of reasons: Known or unknown differences between the replication
and original study may moderate the size of an observed effect, the original result could have
been a false positive, or the replication could produce a false negative. False positives and
false negatives provide misleading information about effects; and, failure to identify the
necessary and sufficient conditions to reproduce a finding indicates an incomplete theoretical
understanding. Direct replication provides the opportunity to assess and improve
reproducibility.
There is plenty of concern (9-13) about the rate and predictors of reproducibility, but
limited evidence. In a theoretical analysis, Ioannidis estimated that publishing and analytic
practices make it likely that more than half of research results are false, and therefore
irreproducible (9). Some empirical evidence supports this analysis. In cell biology, two
industrial laboratories reported success replicating the original results of landmark findings in
only 11 and 25% of the attempted cases, respectively (10, 11). These numbers are stunning
Reproducibility Project
4
but also difficult to interpret because no details are available about the studies, methodology, or
results. With no transparency, the reasons for low reproducibility cannot be evaluated.
Other investigations point to practices and incentives that may inflate the likelihood of
obtaining false—positive results in particular or irreproducible results more generally.
Potentially problematic practices include selective reporting, selective analysis, and insufficient
specification of the conditions necessary or sufficient to obtain the results (12-23). We were
inspired to address the gap in direct empirical evidence about reproducibility. In this Research
Article, we report a large-scale, collaborative effort to obtain an initial estimate of the
reproducibility of psychological science.
Method
Starting in November 2011, we constructed a protocol for selecting and conducting high-
quality replications (24). Collaborators joined the project, selected a study for replication from
the available studies in the sampling frame, and were guided through the replication protocol.
The replication protocol articulated the process of selecting the study and key effect from the
available articles, contacting the original authors for study materials, preparing a study protocol
and analysis plan, obtaining review of the protocol by the original authors and other members
within the present project, registering the protocol publicly, conducting the replication, writing the
final report, and auditing the process and analysis for quality control. Project coordinators
facilitated each step of the process and maintained the protocol and project resources.
Replication materials and data were required to be archived publicly in order to maximize
transparency, accountability, and reproducibility of the project (https://osf.io/ezcuj).
In total, 100 replications were completed by 270 contributing authors. There were many
different research designs and analysis strategies in the original research. Through consultation
with original authors, obtaining original materials, and internal review, replications maintained
high fidelity to the original designs. Analyses converted results to a common effect size metric
[correlation coefficient (r)] with confidence intervals (CIs). The units of analysis for inferences
Reproducibility Project
5
about reproducibility were the original and replication study effect sizes. The resulting open
dataset provides an initial estimate of the reproducibility of psychology and correlational data to
support development of hypotheses about the causes of reproducibility.
Sampling frame and study selection
We constructed a sampling frame and selection process to minimize selection biases
and maximize generalizability of the accumulated evidence. Simultaneously, to maintain high
quality, within this sampling frame we matched individual replication projects with teams that
had relevant interests and expertise. We pursued a quasi-random sample by defining the
sampling frame as 2008 articles of three important psychology journals: Psychological Science
(PSCI), Journal of Personality and Social Psychology (JPSP), and Journal of Experimental
Psychology: Learning, Memory, and Cognition (JEP:LMC). The first is a premier outlet for all
psychological research, the second and third are leading disciplinary-specific journals for social
psychology and cognitive psychology respectively [more information is available in (24)]. These
were selected a priori in order to (i) provide a tractable sampling frame that would not plausibly
bias reproducibility estimates, (ii) enable comparisons across journal types and sub-disciplines,
(iii) fit with the range of expertise available in the initial collaborative team, (iv) be recent enough
to obtain original materials, (v) be old enough to obtain meaningful indicators of citation impact,
and (vi) represent psychology subdisciplines that have a high frequency of studies that are
feasible to conduct at relatively low cost.
The first replication teams could select from a pool of the first 20 articles from each
journal, starting with the first article published in the first 2008 issue. Project coordinators
facilitated matching articles with replication teams by interests and expertise until the remaining
articles were difficult to match. If there were still interested teams, then another 10 articles from
one or more of the three journals were made available from the sampling frame. Further,
project coordinators actively recruited teams from the community with relevant experience for
particular articles. This approach balanced competing goals: minimizing selection bias by
Reproducibility Project
6
having only a small set of articles available at a time and matching studies with replication
teams’ interests, resources, and expertise.
By default, the last experiment reported in each article was the subject of replication.
This decision established an objective standard for study selection within an article and was
based on the intuition that the first study in a multiple-study article (the obvious alternative
selection strategy) was more frequently a preliminary demonstration. Deviations from selecting
the last experiment were made occasionally on the basis of feasibility or recommendations of
the original authors. Justifications for deviations were reported in the replication reports, which
were made available on the Open Science Framework (OSF) (http://osf.io/ezcuj). In total, 84 of
the 100 completed replications (84%) were of the last reported study in the article. On average,
the to-be-replicated articles contained 2.99 studies (SD = 1.78) with the following distribution: 24
single study, 24 two studies, 18 three studies, 13 four studies, 12 five studies, 9 six or more
studies. All following summary statistics refer to the 100 completed replications.
For the purposes of aggregating results across studies to estimate reproducibility, a key
result from the selected experiment was identified as the focus of replication. The key result
had to be represented as a single statistical inference test or an effect size. In most cases, that
test was a t test, F test, or correlation coefficient. This effect was identified before data
collection or analysis and was presented to the original authors as part of the design protocol for
critique. Original authors occasionally suggested that a different effect be used, and by default,
replication teams deferred to original authors’ judgments. Nonetheless, because the single
effect came from a single study, it is not necessarily the case that the identified effect was
central to the overall aims of the article. In the individual replication reports and subjective
assessments of replication outcomes, more than a single result could be examined, but only the
result of the single effect was considered in the aggregate analyses [additional details of the
general protocol and individual study methods are provided in the supplementary materials and
(25)].
Reproducibility Project
7
In total, there were 488 articles in the 2008 issues of the three journals. One hundred
fifty-eight of these (32%) became eligible for selection for replication during the project period,
between November 2011 and December 2014. From those, 111 articles (70%) were selected
by a replication team, producing 113 replications. Two articles had two replications each
(supplementary materials). And, 100 of those (88%) replications were completed by the project
deadline for inclusion in this aggregate report. After being claimed, some studies were not
completed because the replication teams ran out of time or could not devote sufficient resources
to completing the study. By journal, replications were completed for 39 of 64 (61%) articles from
PSCI, 31 of 55 (56%) articles from JPSP, and 28 of 39 (72%) articles from JEP:LMC.
The most common reasons for failure to match an article with a team were feasibility
constraints for conducting the research. Of the 47 articles from the eligible pool that were not
claimed, six (13%) had been deemed infeasible to replicate because of time, resources,
instrumentation, dependence on historical events, or hard-to-access samples. The remaining
41 (87%) were eligible but not claimed. These often required specialized samples (such as
macaques or people with autism), resources (such as eye tracking machines or functional
magnetic resonance imaging), or knowledge making them difficult to match with teams.
Aggregate Data Preparation
Each replication team conducted the study, analyzed their data, wrote their summary
report, and completed a checklist of requirements for sharing the materials and data. Then,
independent reviewers and analysts conducted a project-wide audit of all individual projects,
materials, data, and reports. A description of this review is available on the OSF
(https://osf.io/xtine). Moreover, to maximize reproducibility and accuracy, the analyses for every
replication study were reproduced by another analyst independent of the replication team using
the R statistical programming language and a standardized analytic format. A controller R script
was created to regenerate the entire analysis of every study and recreate the master datafile.
This R script, available at https://osf.io/fkmwg, can be executed to reproduce the results of the
Reproducibility Project
8
individual studies. A comprehensive description of this reanalysis process is available publicly
(https://osf.io/a2eyg).
Measures and Moderators
We assessed features of the original study and replication as possible correlates of
reproducibility and conducted exploratory analyses to inspire further investigation. These
included characteristics of the original study such as the publishing journal; original effect size,
P value, and sample size; experience and expertise of the original research team; importance of
the effect with indicators such as the citation impact of the article; and rated surprisingness of
the effect. We also assessed characteristics of the replication such as statistical power and
sample size, experience and expertise of the replication team, independently assessed
challenge of conducting an effective replication, and self-assessed quality of the replication
effort. Variables such as the P value indicate the statistical strength of evidence given the null
hypothesis, and variables such as “effect surprisingness” and “expertise of the team” indicate
qualities of the topic of study and the teams studying it respectively. The master data file,
containing these and other variables, is available for exploratory analysis (https://osf.io/5wup8).
It is possible to derive a variety of hypotheses about predictors of reproducibility. To
reduce the likelihood of false positives due to many tests, we aggregated some variables into
summary indicators: experience and expertise of original team, experience and expertise of
replication team, challenge of replication, self-assessed quality of replication, and importance of
the effect. We had no a priori justification to give some indicators stronger weighting over
others, so aggregates were created by standardizing [mean (M) = 0, SD = 1] the individual
variables and then averaging to create a single index. In addition to the publishing journal and
subdiscipline, potential moderators included six characteristics of the original study, and five
characteristics of the replication (supplementary materials).
Publishing journal and subdiscipline.
Journals’ different publishing practices may result in a selection bias that covaries with
Reproducibility Project
9
reproducibility. Articles from three journals were made available for selection: JPSP (n=59
articles), JEP:LMC (n=40 articles), and PSCI (n=68 articles). From this pool of available
studies, replications were selected and completed from JPSP (n=32 studies), JEP:LMC (n=28
studies), and PSCI (n=40 studies), and were coded as representing cognitive (n=43 studies) or
social-personality (n=57 studies) subdisciplines. Four studies that would ordinarily be
understood as “developmental psychology” because of studying children or infants were coded
as having a cognitive or social emphasis. Reproducibility may vary by subdiscipline in
psychology because of differing practices. For example, within-subjects designs are more
common in cognitive than social psychology, and these designs often have greater power to
detect effects with the same number of participants.
Statistical Analyses
There is no single standard for evaluating replication success (25). We evaluated
reproducibility using significance and P values, effect sizes, subjective assessments of
replication teams, and meta-analysis of effect sizes. All five of these indicators contribute
information about the relations between the replication and original finding and the cumulative
evidence about the effect and were positively correlated with one another (r ranged from 0.22 to
0.96, median r = 0.57). Results are summarized in Table 1, and full details of analyses are in
the supplementary materials.
Significance and P values
Assuming a two-tailed test and significance or ɑ level of 0.05, all test results of original
and replication studies were classified as statistically significant (P ≤ 0.05) and nonsignificant (P
> 0.05). However, original studies that interpreted nonsignificant P values as significant were
coded as significant (four cases, all with P values < 0.06). Using only the nonsignificant P
values of the replication studies and applying Fisher’s method (26), we tested the hypothesis
that these studies had “no evidential value” (the null hypothesis of zero-effect holds for all these
Reproducibility Project
10
studies). We tested the hypothesis that the proportions of statistically significant results in the
original and replication studies are equal using the McNemar test for paired nominal data and
calculated a CI of the reproducibility parameter. Second, we compared the central tendency of
the distribution of P values of original and replication studies using the Wilcoxon signed-rank
test and the t test for dependent samples. For both tests, we only used study-pairs for which
both P values were available.
Reproducibility Project
11
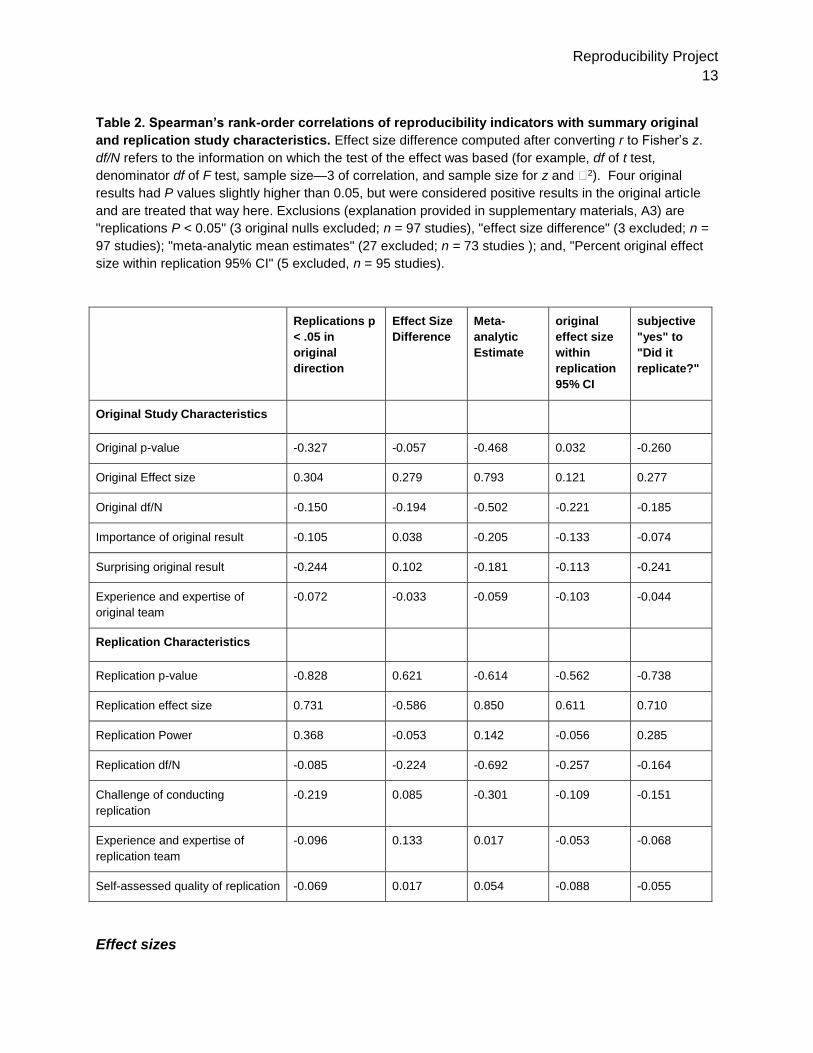
Table 1. Summary of reproducibility rates and effect sizes for original and replication studies
overall and by journal/discipline. df/N refers to the information on which the test of the effect was based
(for example, df of t test, denominator df of F test, sample size—3 of correlation, and sample size for z
and �2). Four original results had P values slightly higher than 0.05 but were considered positive results
in the original article and are treated that way here. Exclusions (explanation provided in supplementary
materials, A3) are "replications P < 0.05" (3 original nulls excluded; n = 97 studies); "mean original and
replication effect sizes" (3 excluded; n = 97 studies); "meta-analytic mean estimates" (27 excluded; n = 73
studies); "Percent meta-analytic (P < 0.05)" (25 excluded; n = 75 studies); and, "Percent original effect
size within replication 95% CI" (5 excluded, n = 95 studies).
Overall JPSP - Social JEP:LMC -
Cognitive PSCI - Social PSCI -
Cognitive
Replications p
< .05 in original
direction
35 / 97 7 / 31 13 / 27 7 / 24 8 / 15
% 36% 23% 48% 29% 53%
Effect Size
Comparison Mean (SD)
Original Effect
Size
.403 (.188) .29 (.10) .47 (.18) .39 (.20) .53 (.2)
Median Original
df/N 54 73 36.5 76 23
Mean (SD)
Replication
Effect Size
.197 (.257) .07 (.11) .27 (.24) .21 (.30) .29 (.35)
Median
Replication
df/N
68 120 43 122 21
Average
Replication
Power
0.92 0.907 0.933 0.915 0.943
Original and
Replication
Combined
Meta-analytic
Mean (SD)
Estimate
.309 (.223) .138 (.087) .393 (.209) .286 (.228) .464 (.221)
% meta-
analytic (p <
.05)
68% 43% 86% 58% 92%
% original 47% 34% 62% 40% 60%

Reproducibility Project
12
effect size
within
replication 95%
CI
% subjective
"yes" to "Did it
replicate?"
39% 25% 54% 32% 53%
Reproducibility Project
13
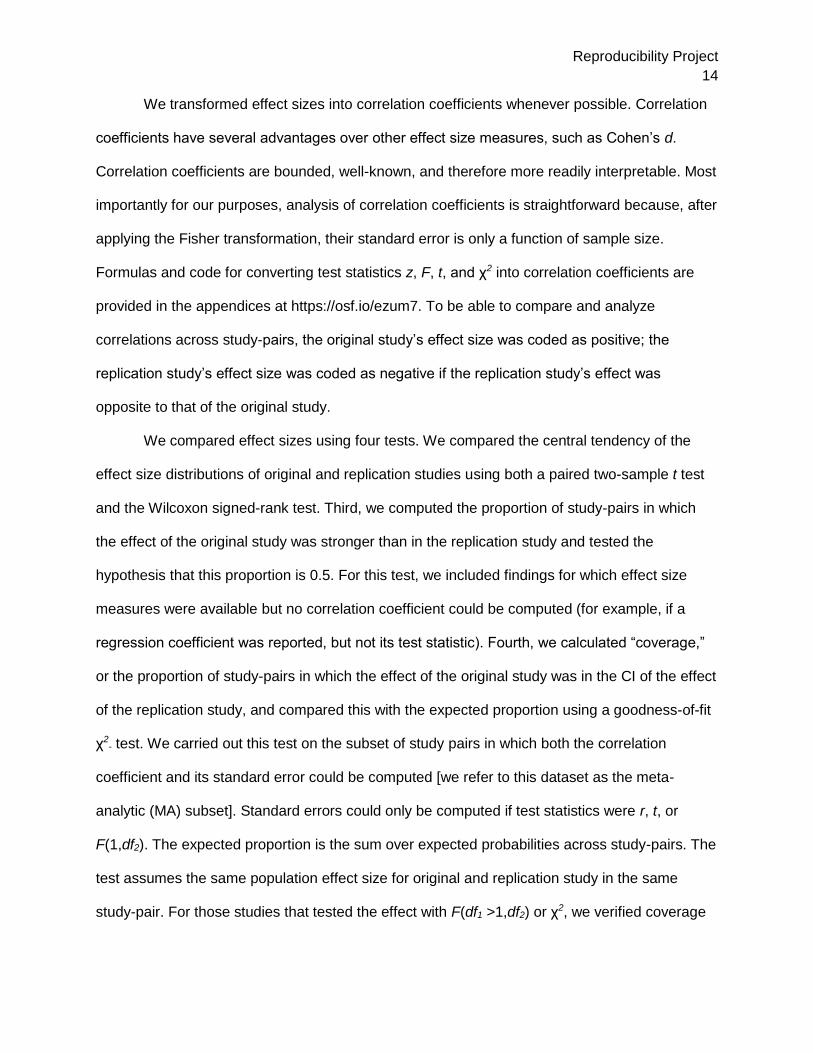
Table 2. Spearman’s rank-order correlations of reproducibility indicators with summary original
and replication study characteristics. Effect size difference computed after converting r to Fisher’s z.
df/N refers to the information on which the test of the effect was based (for example, df of t test,
denominator df of F test, sample size—3 of correlation, and sample size for z and �2). Four original
results had P values slightly higher than 0.05, but were considered positive results in the original article
and are treated that way here. Exclusions (explanation provided in supplementary materials, A3) are
"replications P < 0.05" (3 original nulls excluded; n = 97 studies), "effect size difference" (3 excluded; n =
97 studies); "meta-analytic mean estimates" (27 excluded; n = 73 studies ); and, "Percent original effect
size within replication 95% CI" (5 excluded, n = 95 studies).
Replications p
< .05 in
original
direction
Effect Size
Difference Meta-
analytic
Estimate
original
effect size
within
replication
95% CI
subjective
"yes" to
"Did it
replicate?"
Original Study Characteristics
Original p-value -0.327 -0.057 -0.468 0.032 -0.260
Original Effect size 0.304 0.279 0.793 0.121 0.277
Original df/N -0.150 -0.194 -0.502 -0.221 -0.185
Importance of original result -0.105 0.038 -0.205 -0.133 -0.074
Surprising original result -0.244 0.102 -0.181 -0.113 -0.241
Experience and expertise of
original team -0.072 -0.033 -0.059 -0.103 -0.044
Replication Characteristics
Replication p-value -0.828 0.621 -0.614 -0.562 -0.738
Replication effect size 0.731 -0.586 0.850 0.611 0.710
Replication Power 0.368 -0.053 0.142 -0.056 0.285
Replication df/N -0.085 -0.224 -0.692 -0.257 -0.164
Challenge of conducting
replication -0.219 0.085 -0.301 -0.109 -0.151
Experience and expertise of
replication team -0.096 0.133 0.017 -0.053 -0.068
Self-assessed quality of replication -0.069 0.017 0.054 -0.088 -0.055
Effect sizes
Reproducibility Project
14
We transformed effect sizes into correlation coefficients whenever possible. Correlation
coefficients have several advantages over other effect size measures, such as Cohen’s d.
Correlation coefficients are bounded, well-known, and therefore more readily interpretable. Most
importantly for our purposes, analysis of correlation coefficients is straightforward because, after
applying the Fisher transformation, their standard error is only a function of sample size.
Formulas and code for converting test statistics z, F, t, and χ2 into correlation coefficients are
provided in the appendices at https://osf.io/ezum7. To be able to compare and analyze
correlations across study-pairs, the original study’s effect size was coded as positive; the
replication study’s effect size was coded as negative if the replication study’s effect was
opposite to that of the original study.
We compared effect sizes using four tests. We compared the central tendency of the
effect size distributions of original and replication studies using both a paired two-sample t test
and the Wilcoxon signed-rank test. Third, we computed the proportion of study-pairs in which
the effect of the original study was stronger than in the replication study and tested the
hypothesis that this proportion is 0.5. For this test, we included findings for which effect size
measures were available but no correlation coefficient could be computed (for example, if a
regression coefficient was reported, but not its test statistic). Fourth, we calculated “coverage,”
or the proportion of study-pairs in which the effect of the original study was in the CI of the effect
of the replication study, and compared this with the expected proportion using a goodness-of-fit
χ2 test. We carried out this test on the subset of study pairs in which both the correlation
coefficient and its standard error could be computed [we refer to this dataset as the meta-
analytic (MA) subset]. Standard errors could only be computed if test statistics were r, t, or
F(1,df2). The expected proportion is the sum over expected probabilities across study-pairs. The
test assumes the same population effect size for original and replication study in the same
study-pair. For those studies that tested the effect with F(df1 >1,df2) or χ2, we verified coverage
Reproducibility Project
15
using other statistical procedures (computational details are provided in the supplementary
materials).
Meta-analysis combining original and replication effects
We conducted fixed-effect meta-analyses using the R package metafor (27) on Fisher-
transformed correlations for all study-pairs in subset MA and on study-pairs with the odds ratio
as the dependent variable. The number of times the CI of all these meta-analyses contained 0
was calculated. For studies in the MA subset, estimated effect sizes were averaged and
analyzed by discipline.
Subjective assessment of “Did it replicate?”
In addition to the quantitative assessments of replication and effect estimation, we
collected subjective assessments of whether the replication provided evidence of replicating the
original result. In some cases, the quantitative data anticipates a straightforward subjective
assessment of replication. For more complex designs, such as multivariate interaction effects,
the quantitative analysis may not provide a simple interpretation. For subjective assessment,
replication teams answered “yes” or “no” to the question, “Did your results replicate the original
effect?” Additional subjective variables are available for analysis in the full dataset.
Analysis of moderators
We correlated the five indicators evaluating reproducibility with six indicators of the
original study (original P value, original effect size, original sample size, importance of the effect,
surprising effect, and experience and expertise of original team) and seven indicators of the
replication study (replication P value, replication effect size, replication power based on original
effect size, replication sample size, challenge of conducting replication, experience and
expertise of replication team, and self-assessed quality of replication) (Table 2). As follow-up,
we did the same with the individual indicators comprising the moderator variables (tables S3
and S4).
Results
Reproducibility Project
16
Evaluating replication effect against null hypothesis of no effect
A straightforward method for evaluating replication is to test whether the replication shows a
statistically significant effect (P < 0.05) with the same direction as the original study. This
dichotomous vote-counting method is intuitively appealing and consistent with common
heuristics used to decide whether original studies “worked.” Ninety-seven of 100 (97%) effects
from original studies were positive results (four had P values falling a bit short of the .05
criterion—P = 0.0508, 0.0514, 0.0516, and 0.0567—but all of these were interpreted as positive
effects). On the basis of only the average replication power of the 97 original, significant effects
[M = 0.92, median (Mdn) = 0.95), we would expect approximately 89 positive results in the
replications if all original effects were true and accurately estimated; however, there were just 35
[36.1%; 95% CI = (26.6%, 46.2%)], a significant reduction [McNemar test, χ2(1) = 59.1, P <
0.001].
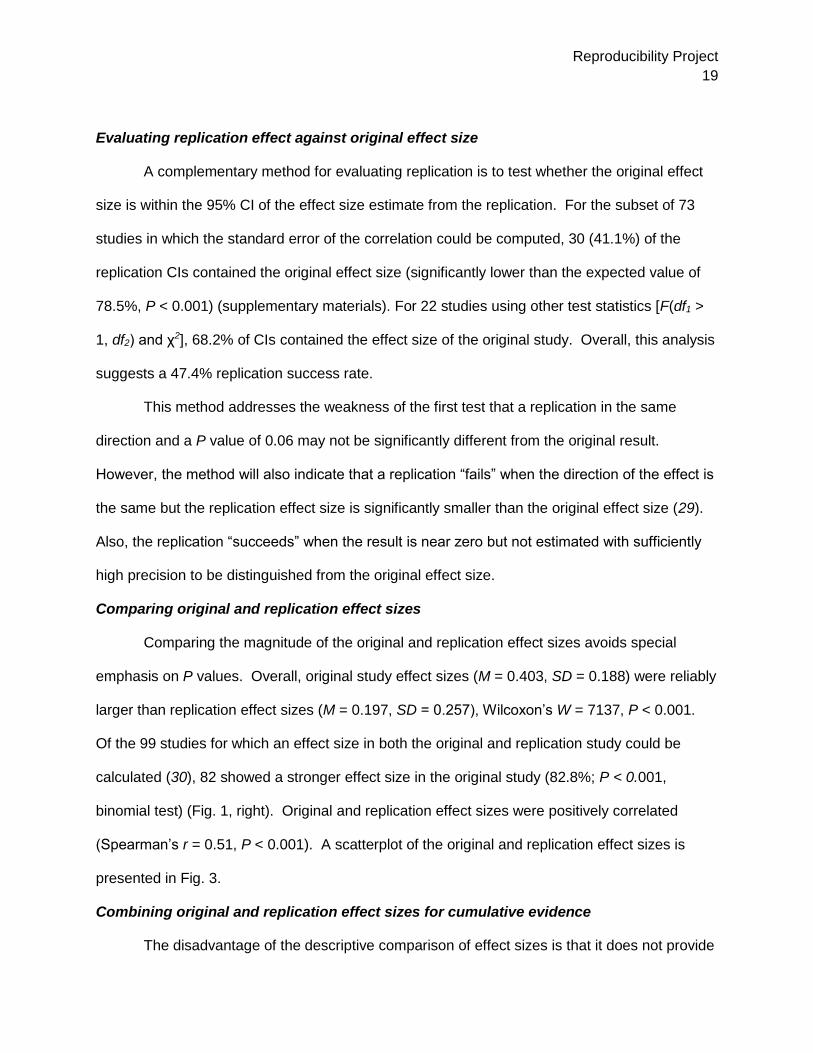
Fig. 1. Density plots of original and replication P values and effect sizes. (A) P values. (B) Effect
sizes (correlation coefficients). Lowest quantiles for P values are not visible because they are clustered
near zero.
A key weakness of this method is that it treats the 0.05 threshold as a bright-line criterion
between replication success and failure (28). It could be that many of the replications fell just
short of the 0.05 criterion. The density plots of P values for original studies (mean P value =

Reproducibility Project
17
0.028) and replications (mean P value = 0.302) are shown in Fig. 1, left. The 64 nonsignificant
P values for replications were distributed widely. When there is no effect to detect, the null
distribution of P values is uniform. This distribution deviated slightly from uniform with positive
skew, however, suggesting that at least one replication could be a false negative, χ2(128) =
155.83, P = 0.048. Nonetheless, the wide distribution of P values suggests against insufficient
power as the only explanation for failures to replicate. A scatterplot of original compared with
replication study P values is shown in Fig. 2.

Reproducibility Project
18
Fig. 2. Scatterplots of original study and replication P values for three psychology journals. Data
points scaled by power of the replication based on original study effect size. Dotted red lines indicate P =
0.05 criterion. Subplot below shows P values from the range between the gray lines (P = 0 to 0.005) in
the main plot above.
Reproducibility Project
19
Evaluating replication effect against original effect size
A complementary method for evaluating replication is to test whether the original effect
size is within the 95% CI of the effect size estimate from the replication. For the subset of 73
studies in which the standard error of the correlation could be computed, 30 (41.1%) of the
replication CIs contained the original effect size (significantly lower than the expected value of
78.5%, P < 0.001) (supplementary materials). For 22 studies using other test statistics [F(df1 >
1, df2) and χ2], 68.2% of CIs contained the effect size of the original study. Overall, this analysis
suggests a 47.4% replication success rate.
This method addresses the weakness of the first test that a replication in the same
direction and a P value of 0.06 may not be significantly different from the original result.
However, the method will also indicate that a replication “fails” when the direction of the effect is
the same but the replication effect size is significantly smaller than the original effect size (29).
Also, the replication “succeeds” when the result is near zero but not estimated with sufficiently
high precision to be distinguished from the original effect size.
Comparing original and replication effect sizes
Comparing the magnitude of the original and replication effect sizes avoids special
emphasis on P values. Overall, original study effect sizes (M = 0.403, SD = 0.188) were reliably
larger than replication effect sizes (M = 0.197, SD = 0.257), Wilcoxon’s W = 7137, P < 0.001.
Of the 99 studies for which an effect size in both the original and replication study could be
calculated (30), 82 showed a stronger effect size in the original study (82.8%; P < 0.001,
binomial test) (Fig. 1, right). Original and replication effect sizes were positively correlated
(Spearman’s r = 0.51, P < 0.001). A scatterplot of the original and replication effect sizes is
presented in Fig. 3.
Combining original and replication effect sizes for cumulative evidence
The disadvantage of the descriptive comparison of effect sizes is that it does not provide
Reproducibility Project
20
information about the precision of either estimate, or resolution of the cumulative evidence for
the effect. This is often addressed by computing a meta-analytic estimate of the effect sizes by
combining the original and replication studies (28). This approach weights each study by the
inverse of its variance, and uses these weighted estimates of effect size to estimate cumulative
evidence and precision of the effect. Using a fixed-effect model, 51 of the 75 (68%) effects for
which a meta-analytic estimate could be computed had 95% CIs that did not include 0.
One qualification about this result is the possibility that the original studies have inflated
effect sizes due to publication, selection, reporting, or other biases (9, 12-23). In a discipline
with low-powered research designs and an emphasis on positive results for publication, effect
sizes will be systematically overestimated in the published literature. There is no publication
bias in the replication studies because all results are reported. Also, there are no selection or
reporting biases because all were confirmatory tests based on pre-analysis plans. This
maximizes the interpretability of the replication P values and effect estimates. If publication,
selection, and reporting biases completely explain the effect differences, then the replication
estimates would be a better estimate of the effect size than would the meta-analytic and original
results. However, to the extent that there are other influences, such as moderation by sample,
setting, or quality of replication, the relative bias influencing original and replication effect size
estimation is unknown.
Subjective assessment of “Did it replicate?”
In addition to the quantitative assessments of replication and effect estimation,
replication teams provided a subjective assessment of replication success of the study they
conducted. Subjective assessments of replication success were very similar to significance
testing results (39 of 100 successful replications), including evaluating “success” for two null
replications when the original study reported a null result and “failure” for a P < 0.05 replication
when the original result was a null.
Correlates of Reproducibility
Reproducibility Project
21
The overall replication evidence is summarized in Table 1 across the criteria described
above, and then separately by journal/discipline. Considering significance testing,
reproducibility was stronger in studies and journals representing cognitive psychology than
social psychology topics. For example, combining across journals, 14 of 55 (25%) of social
psychology effects replicated by the P < 0.05 criterion, whereas 21 of 42 (50%) of cognitive
psychology effects did so. Simultaneously, all journals and disciplines showed substantial and
similar [χ2(3) = 2.45, P = 0.48] declines in effect size in the replications compared with the
original studies. The difference in significance testing results between fields appears to be
partly a function of weaker original effects in social psychology studies, particularly in JPSP and
perhaps of the greater frequency of high-powered within-subjects manipulations and repeated
measurement designs in cognitive psychology as suggested by high power despite relatively
small participant samples. Further, the type of test was associated with replication success.
Among original, significant effects, 23 of the 49 (47%) that tested main or simple effects
replicated at P < 0.05, but just 8 of the 37 (22%) that tested interaction effects did.
Correlations between reproducibility indicators and characteristics of replication and
original studies are provided in Table 2. A negative correlation of replication success with the
original study P value indicates that the initial strength of evidence is predictive of
reproducibility. For example, 26 of 63 (41%) original studies with P < 0.02 achieved P < 0.05 in
the replication, whereas 6 of 23 (26%) that had a P value between 0.02 < P < 0.04 and 2 of 11
(18%) that had a P value > 0.04 did so (Fig. 2). Almost two thirds (20 of 32, 63%) of original
studies with P < 0.001 had a significant P value in the replication.
Reproducibility Project
22
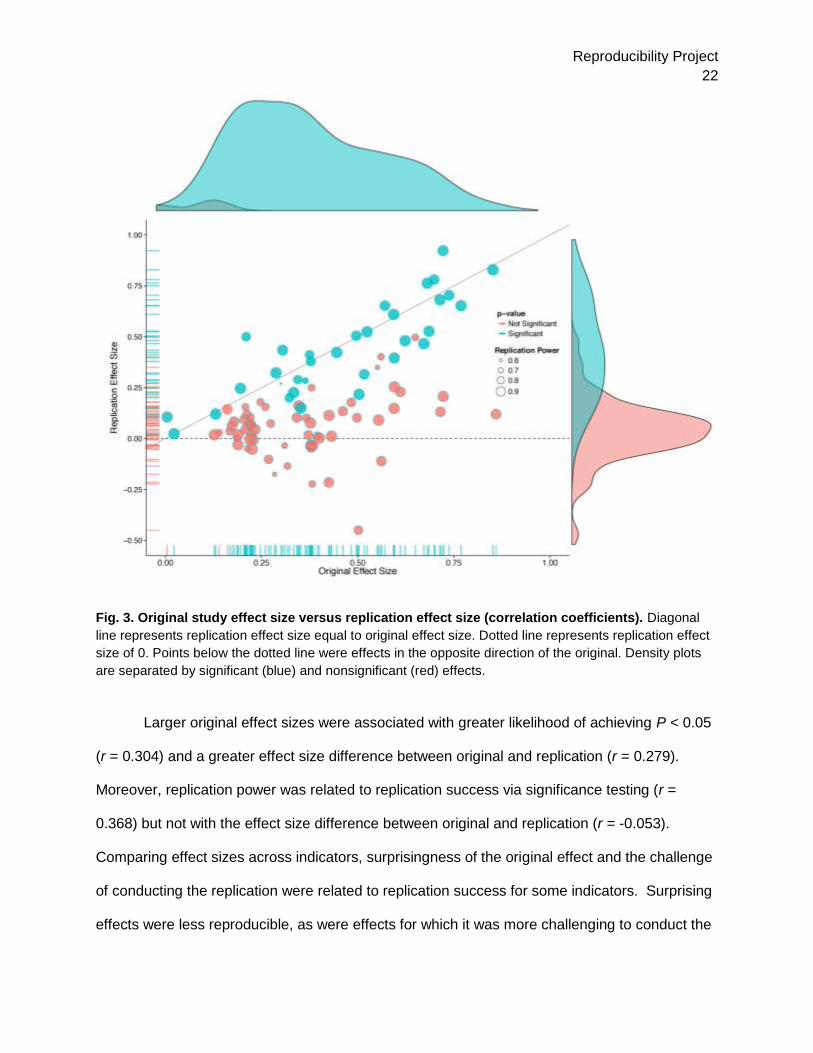
Fig. 3. Original study effect size versus replication effect size (correlation coefficients). Diagonal
line represents replication effect size equal to original effect size. Dotted line represents replication effect
size of 0. Points below the dotted line were effects in the opposite direction of the original. Density plots
are separated by significant (blue) and nonsignificant (red) effects.
Larger original effect sizes were associated with greater likelihood of achieving P < 0.05
(r = 0.304) and a greater effect size difference between original and replication (r = 0.279).
Moreover, replication power was related to replication success via significance testing (r =
0.368) but not with the effect size difference between original and replication (r = -0.053).
Comparing effect sizes across indicators, surprisingness of the original effect and the challenge
of conducting the replication were related to replication success for some indicators. Surprising
effects were less reproducible, as were effects for which it was more challenging to conduct the

Reproducibility Project
23
replication. Last, there was little evidence that perceived importance of the effect, expertise of
the original or replication teams, or self-assessed quality of the replication accounted for
meaningful variation in reproducibility across indicators. Replication success was more
consistently related to the original strength of evidence (such as original P value, effect size,
and effect tested) than to characteristics of the teams and implementation of the replication
(such as expertise, quality, challenge of conducting study) (tables S3 and S4).
Discussion
No single indicator sufficiently describes replication success, and the five indicators
examined here are not the only ways to evaluate reproducibility. Nonetheless, collectively,
these results offer a clear conclusion: A large portion of replications produced weaker evidence
for the original findings (31) despite using materials provided by the original authors, review in
advance for methodological fidelity, and high statistical power to detect the original effect sizes.
Moreover, correlational evidence is consistent with the conclusion that variation in the strength
of initial evidence (such as original P value) was more predictive of replication success than was
variation in the characteristics of the teams conducting the research (such as experience and
expertise). The latter factors certainly can influence replication success, but the evidence is that
they did not systematically do so here. Other investigators may develop alternative indicators to
explore further the role of expertise and quality in reproducibility on this open dataset.
Insights on Reproducibility
It is too easy to conclude that successful replication means that the theoretical
understanding of the original finding is correct. Direct replication mainly provides evidence for
the reliability of a result. If there are alternative explanations for the original finding, those
alternatives could likewise account for the replication. Understanding is achieved through
multiple, diverse investigations that provide converging support for a theoretical interpretation
and rule out alternative explanations.
Reproducibility Project
24
It is also too easy to conclude that a failure to replicate a result means that the original
evidence was a false positive. Replications can fail if the replication methodology differs from
the original in ways that interfere with observing the effect. We conducted replications designed
to minimize a priori reasons to expect a different result by using original materials, engaging
original authors for review of the designs, and conducting internal reviews. Nonetheless,
unanticipated factors in the sample, setting, or procedure could still have altered the observed
effect magnitudes (32).
More generally, there are indications of cultural practices in scientific communication that
may be responsible for the observed results. Low-power research designs combined with
publication bias favoring positive results together produce a literature with upwardly biased
effect sizes (14, 16, 33, 34). This anticipates that replication effect sizes would be smaller than
original studies on a routine basis—not because of differences in implementation but because
the original study effect sizes are affected by publication and reporting bias, and the replications
are not. Consistent with this expectation, most replication effects were smaller than original
results and reproducibility success was correlated with indicators of the strength of initial
evidence, such as lower original P values and larger effect sizes. This suggests publication,
selection, and reporting biases as plausible explanations for the difference between original and
replication effects. The replication studies significantly reduced these biases because
replication pre-registration and pre-analysis plans ensured confirmatory tests and reporting of all
results.
The observed variation in replication and original results may reduce certainty about the
statistical inferences from the original studies but also provides an opportunity for theoretical
innovation to explain differing outcomes, and then new research to test those hypothesized
explanations. The correlational evidence, for example, suggests that procedures that are more
challenging to execute may result in less reproducible results, and that more surprising original
effects may be less reproducible than less surprising original effects. Last, systematic, repeated
Reproducibility Project
25
replication efforts that fail to identify conditions under which the original finding can be observed
reliably may reduce confidence in the original finding.
Implications and Limitations
The present study provides the first open, systematic evidence of reproducibility from a
sample of studies in psychology. We sought to maximize generalizability of the results with a
structured process for selecting studies for replication. However, it is unknown the extent to
which these findings extend to the rest of psychology or other disciplines. In the sampling frame
itself, not all articles were replicated; in each article, only one study was replicated; and, in each
study, only one statistical result was subject to replication. More resource intensive studies
were less likely to be included than were less resource-intensive studies. Although study
selection bias was reduced by the sampling frame and selection strategy, the impact of
selection bias is unknown.
We investigated the reproducibility rate of psychology not because there is something
special about psychology, but because it is our discipline. Concerns about reproducibility are
widespread across disciplines (9-21). Reproducibility is not well understood because the
incentives for individual scientists prioritize novelty over replication (20). If nothing else, this
project demonstrates that it is possible to conduct a large-scale examination of reproducibility
despite the incentive barriers. Here, we conducted single-replication attempts of many effects
obtaining broad-and-shallow evidence. These data provide information about reproducibility in
general but little precision about individual effects in particular. A complementary narrow-and-
deep approach is characterized by the Many Labs replication projects (34). In those, many
replications of single effects allow precise estimates of effect size but result in generalizability
that is circumscribed to those individual effects. Pursuing both strategies across disciplines,
such as the ongoing effort in cancer biology (35), would yield insight about common and distinct
challenges and may cross-fertilize strategies so as to improve reproducibility.
Reproducibility Project
26
Because reproducibility is a hallmark of credible scientific evidence, it is tempting to think
that maximum reproducibility of original results is important from the onset of a line of inquiry
through its maturation. This is a mistake. If initial ideas were always correct, then there would
hardly be a reason to conduct research in the first place. A healthy discipline will have many
false starts as it confronts the limits of present understanding.
Innovation is the engine of discovery and is vital for a productive, effective scientific
enterprise. However, innovative ideas become old news fast. Journal reviewers and editors
may dismiss a new test of a published idea as unoriginal. The claim that “we already know this”
belies the uncertainty of scientific evidence. Deciding the ideal balance of resourcing innovation
versus verification is a question of research efficiency. How can we maximize the rate of
research progress? Innovation points out paths that are possible; replication points out paths
that are likely; progress relies on both. The ideal balance is a topic for investigation itself.
Scientific incentives—funding, publication, or awards—can be tuned to encourage an optimal
balance in the collective effort of discovery (36, 37).
Progress occurs when existing expectations are violated and a surprising result spurs a
new investigation. Replication can increase certainty when findings are reproduced and promote
innovation when they are not. This project provides accumulating evidence for many findings in
psychological research and suggests that there is still more work to do to verify whether we
know what we think we know.
Conclusion
After this intensive effort to reproduce a sample of published psychological findings, how
many of the effects have we established are true? Zero. And, how many of the effects have we
established are false? Zero. Is this a limitation of the project design? No. It is the reality of
doing science, even if it is not appreciated in daily practice. Humans desire certainty, and
science infrequently provides it. As much as we might wish it to be otherwise, a single study
almost never provides definitive resolution for or against an effect and its explanation. The
Reproducibility Project
27
original studies examined here offered tentative evidence; the replications we conducted offered
additional, confirmatory evidence. In some cases, the replications increase confidence in the
reliability of the original results; in other cases, the replications suggest that more investigation
is needed to establish validity of the original findings. Scientific progress is a cumulative
process of uncertainty reduction that can only succeed if science itself remains the greatest
skeptic of its explanatory claims.
The present results suggest that there is room to improve reproducibility in psychology.
Any temptation to interpret these results as a defeat for psychology, or science more generally,
must contend with the fact that this project demonstrates science behaving as it should.
Hypotheses abound that the present culture in science may be negatively affecting the
reproducibility of findings. An ideological response would discount the arguments, discredit the
sources, and proceed merrily along. The scientific process is not ideological. Science does not
always provide comfort for what we wish to be; it confronts us with what is. Moreover, as
illustrated by the Transparency and Openness Promotion (TOP) Guidelines (http://cos.io/top)
(37), the research community is taking action already to improve the quality and credibility of the
scientific literature.
We conducted this project because we care deeply about the health of our discipline,
and believe in its promise for accumulating knowledge about human behavior that can advance
the quality of the human condition. Reproducibility is central to that aim. Accumulating
evidence is the scientific community’s method of self-correction and is the best available option
for achieving that ultimate goal: truth.
Reproducibility Project
28
References
1. C. Hempel, Maximal specificity and lawlikeness in probabilistic explanation. Philos. Sci. 35,
116–133 (1968).
2. C. Hempel, P. Oppenheim, Studies in the logic of explanation. Philos. Sci. 15, 135–175
(1948).
3. I. Lakatos, in Criticism and the Growth of Knowledge, I. Lakatos, A. Musgrave, Eds.
(Cambridge Univ. Press, London, 1970) pp. 170-196.
4. P. E. Meehl, Appraising and amending theories: The strategy of Lakatosian defense and two
principles that warrant it. Psychol. Inq. 1, 108–141 (1990).
5. J. Platt, Strong inference. Science 146, 347–353 (1964).
6. W. C. Salmon, in Introduction to the Philosophy of Science, M. H. Salmon Ed. (Hackett
Publishing Company, Inc., Indianapolis, 1999) pp. 7-41.
7. B. A. Nosek, D. Lakens, Registered reports: A method to increase the credibility of published
results. Soc. Psychol. 45, 137-141 (2014).
8. S. Schmidt, Shall we really do it again? The powerful concept of replication is neglected in the
social sciences. Rev. Gen. Psychol. 13, 90-100 (2009).
9. J. P. A. Ioannidis, Why most published research findings are false. PLoS Med. 2, e124
(2005), doi: 10.1371/journal.pmed.0020124.
10. C. G. Begley, L. M. Ellis, Raise standards for preclinical cancer research. Nature 483, 531-
533 (2012).
11. F. Prinz, T. Schlange, K. Asadullah, Believe it or not: How much can we rely on published
data on potential drug targets? Nat. Rev. Drug Disc. 10, 712-713 (2011
12. M. McNutt, Reproducibility. Science, 343, 229 (2014).
13. H. Pashler, E-J. Wagenmakers, Editors’ introduction to the special section on replicability in
psychological science: A crisis of confidence? Perspect. Psychol. Sci. 7, 528-530 (2012).
14. K. S. Button, et al., Power failure: Why small sample size undermines the reliability of
neuroscience. Nat. Rev. Neurosci. 14, 1-12 (2013).
Reproducibility Project
29
15. D. Fanelli, “Positive” results increase down the hierarchy of the Sciences. PLoS One 5,
e10068 (2010), doi: 10.1371/journal.pone.0010068 .
16. A. G. Greenwald, Consequences of prejudice against the null hypothesis. Psychol. Bull. 82,
1–20 (1975).
17. G. S. Howard, M. Y. Lau, S. E. Maxwell, A. Venter, R. Lundy, R. M. Sweeny, Do research
literatures give correct answers? Rev. Gen. Psychol. 13, 116-121 (2009).
18. J. P. A. Ioannidis, M. R. Munafo, P. Fusar-Poli, B. A. Nosek, S. P. David, Publication and
other reporting biases in cognitive sciences: Detection, prevalence, and prevention. Trends
Cogn. Sci. 18, 235-241 (2014).
19. L. John, G. Loewenstein, D. Prelec, Measuring the prevalence of questionable research
practices with incentives for truth-telling. Psychol. Sci. 23, 524-532 (2012).
20. B. A. Nosek, J. R. Spies, M. Motyl, Scientific utopia: II. Restructuring incentives and
practices to promote truth over publishability. Perspect. Psychol. Sci. 7, 615-631 (2012).
21. R. Rosenthal, The file drawer problem and tolerance for null results. Psychol. Bull. 86, 638-
641 (1979).
22. P. Rozin, What kind of empirical research should we publish, fund, and reward?: A different
perspective. Perspect. Psychol. Sci. 4, 435-439 (2009).
23. J. P. Simmons, L. D. Nelson, U. Simonsohn, False-positive psychology: Undisclosed
flexibility in data collection and analysis allows presenting anything as significant. Psychol. Sci.
22, 1359-1366 (2011).
24. Open Science Collaboration, An open, large-scale, collaborative effort to estimate the
reproducibility of psychological science. Perspect. Psychol. Sci. 7, 657-660 (2012).
25. Open Science Collaboration, in Implementing Reproducible Computational Research (A
Volume in The R Series), V. Stodden, F. Leisch, R. Peng, Eds. (Taylor & Francis, New York,
2014) pp. 299-323.
26. R. A. Fisher, Theory of statistical estimation. Math. Pro. Camb. Phil. Soc. 22, 700-725
(1925).
27. W. Viechtbauer, (2010). Conducting meta-analyses in R with the metafor package. J. Stat.
Softw. 36, 1– 48.
28. S. L. Braver, F. J. Thoemmes, R. Rosenthal, Continuously cumulating meta-analysis and
replicability. Perspect. Psychol. Sci. 9, 333-342 (2014).
Reproducibility Project
30
29. U. Simonsohn, Small telescopes: Detectability and the evaluation of replication results.
Psychol. Sci. (2015), doi: 10.1177/0956797614567341.
30. D. Lakens, Calculating and reporting effect sizes to facilitate cumulative science: A practical
primer for t-tests and ANOVAs. Front. Psychol. 4, 863 (2013), doi: 10.3389/fpsyg.2013.00863.
31. J. Lehrer, The truth wears off: Is there something wrong with the scientific method? The
New Yorker, 52-57 (2010).
32. R. Klein, et al., Investigating variation in replicability: A “many labs” replication project. Soc.
Psychol. 45, 142-152 (2014).
33. J. Cohen, The statistical power of abnormal-social psychological research: A review. J.
Abnorm. Soc. Psychol. 65, 145–153 (1962).
34. T. D. Sterling, Publication decisions and their possible effects on inferences
35. T. Errington, et al., An open investigation of the reproducibility of cancer biology research.
eLife 3, e04333 (2014), doi: 10.7554/eLife.04333.
36. J. K. Hartshorne, A. Schachner, Tracking replicability as a method of post-publication open
evaluation. Front. Comput. Neurosci (2012), doi:10.3389/fncom.2012.00008
37. B. A. Nosek et al., Promoting an open research culture. Science 348, 1422-1424 (2015).
38. R. Rosenthal, K. L. Fode, The effect of experimenter bias on the performance of the albino
rat. Behav. Sci. 8, 183-189 (1963).
39. P. Bressan, D. Stranieri, The best men are (not always) already taken: Female preference
for single versus attached males depends on conception risk. Psychol. Sci. 19, 145-151 (2008).
40. D. Albarracín, et al., Increasing and decreasing motor and cognitive output: A model of
general action and inaction goals. J. Pers. Soc. Psychol. 95, 510-523 (2008).
41. G. Cumming, The new statistics: why and how. Psychol. Sci. 25, 7-29 (2013).
Supplementary Materials
www.sciencemag.org
Materials and Methods
Figs. S1-S7
Tables S1-S4
References (38-41)
Reproducibility Project
31
Acknowledgments
In addition to the co authors of this manuscript, there were many volunteers that contributed to
project success. We thank D. Acup, J. Anderson, S. Anzellotti, R. Araujo, J. D. Arnal, T. Bates,
R. Battleday, R. Bauchwitz, M. Bernstein, B. Blohowiak, M. Boffo, E. Bruneau, B. Chabot-
Hanowell, J. Chan, P. Chu, A. Dalla Rosa, B. Deen, P. DiGiacomo, C. Dogulu, N. Dufour, C.
Fitzgerald, A. Foote, A. Garcia, E. Garcia, C. Gautreau, L. Germine, T. Gill, L. Goldberg, S. D.
Goldinger, H. Gweon, D. Haile, K. Hart, F. Hjorth, J. Hoenig, Å. Innes-Ker, B. Jansen, R.
Jersakova, Y. Jie, Z. Kaldy, W. K. Vong, A. Kenney, J. Kingston, J. Koster-Hale, A. Lam, R.
LeDonne, D. Lumian, E. Luong, S. Man-pui, J. Martin, A. Mauk, T. McElroy, K. McRae, T. Miller,
K. Moser, M. Mullarkey, A. R. Munoz, J. Ong, C. Parks, D. S. Pate, D. Patron, H. J. M.
Pennings, M. Penuliar, A. Pfammatter, J. P. Shanoltz, E. Stevenson, E. Pichler, H. Raudszus,
H. Richardson, N. Rothstein, T. Scherndl, S. Schrager, S. Shah, Y. S. Tai, A. Skerry, M.
Steinberg, J. Stoeterau, H. Tibboel, A. Tooley, A. Tullett, C. Vaccaro, E. Vergauwe, A.
Watanabe, I. Weiss, M. H. White II, P. Whitehead, C. Widmann, D. K. Williams, K. M. Williams,
and H. Yi.
Also, we thank the authors of the original research that was the subject of replication in this
project. These authors were generous with their time, materials, and advice for improving the
quality of each replication and identifying the strengths and limits of the outcomes.
The authors of this work are listed alphabetically.
This project was supported by the Center for Open Science and the Laura and John Arnold
Foundation. The authors declare no financial conflict of interest with the reported research.
Reproducibility Project
32
Authors (alphabetical)
Alexander A. Aarts1, Joanna E. Anderson2, Christopher J. Anderson3, Peter R. Attridge4,5,
Angela Attwood6, Jordan Axt7, Molly Babel8, Štěpán Bahník9, Erica Baranski10, Michael Barnett-
Cowan11, Elizabeth Bartmess12, Jennifer Beer13, Raoul Bell14, Heather Bentley5, Leah Beyan5,
Grace Binion15, 5, Denny Borsboom16, Annick Bosch17, Frank A. Bosco18, Sara D. Bowman19,
Mark J. Brandt20, Erin Braswell19, Hilmar Brohmer20, Benjamin T. Brown5, Kristina Brown5, Jovita
Brüning21, 22, Ann Calhoun-Sauls23, Shannon P. Callahan24, Elizabeth Chagnon25, Jesse
Chandler26, 27, Christopher R. Chartier28, Felix Cheung29, 30, Cody D. Christopherson31, Linda
Cillessen17, Russ Clay32, Hayley Cleary18, Mark D. Cloud33, Michael Cohn12, Johanna Cohoon19,
Simon Columbus16, Andreas Cordes34, Giulio Costantini35, Leslie D. Cramblet Alvarez36, Ed
Cremata37, Jan Crusius38, Jamie DeCoster7, Michelle A. DeGaetano5, Nicolás Della Penna39,
Bobby den Bezemer16, Marie K. Deserno16, Olivia Devitt5, Laura Dewitte40, David G. Dobolyi7,
Geneva T. Dodson7, M. Brent Donnellan41, Ryan Donohue42, Rebecca A. Dore7, Angela
Dorrough43, 44, Anna Dreber45, Michelle Dugas25, Elizabeth W. Dunn8, Kayleigh Easey46, Sylvia
Eboigbe5, Casey Eggleston7, Jo Embley47, Sacha Epskamp16, Timothy M. Errington19, Vivien
Estel48, Frank J. Farach49, 50, Jenelle Feather51, Anna Fedor52, Belén Fernández-Castilla53,
Susann Fiedler44, James G. Field18, Stanka A. Fitneva54, Taru Flagan13, Amanda L. Forest55,
Eskil Forsell45, Joshua D. Foster56, Michael C. Frank57, Rebecca S. Frazier7, Heather Fuchs38,
Philip Gable58, Jeff Galak59, Elisa Maria Galliani60, Anup Gampa7, Sara Garcia61, Douglas
Gazarian62, Elizabeth Gilbert7, Roger Giner-Sorolla47, Andreas Glöckner34, 44, Lars Goellner43,
Jin X. Goh63, Rebecca Goldberg64, Patrick T. Goodbourn65, Shauna Gordon-McKeon66, Bryan
Gorges19, Jessie Gorges19, Justin Goss67, Jesse Graham37, James A. Grange68, Jeremy Gray29,
Chris Hartgerink20, Joshua Hartshorne51, Fred Hasselman17, 69, Timothy Hayes37, Emma
Heikensten45, Felix Henninger70, 44, John Hodsoll71, 72, Taylor Holubar57, Gea Hoogendoorn20,
Denise J. Humphries5, Cathy O.-Y. Hung30, Nathali Immelman73, Vanessa C. Irsik74, Georg
Jahn75, Frank Jäkel76, Marc Jekel34, Magnus Johannesson45, Larissa G. Johnson77, David J.
Johnson29, Kate M. Johnson37, William J. Johnston78, Kai Jonas16, Jennifer A. Joy-Gaba18,
Heather Barry Kappes79, Kim Kelso36, Mallory C. Kidwell19, Seung Kyung Kim57, Matthew
Kirkhart80, Bennett Kleinberg81, 16, Goran Knežević82, Franziska Maria Kolorz17, Jolanda J.
Kossakowski16, Robert Wilhelm Krause83, Job Krijnen20, Tim Kuhlmann84, Yoram K. Kunkels16,
Megan M. Kyc33, Calvin K. Lai7, Aamir Laique85, Daniël Lakens86, Kristin A. Lane62, Bethany
Lassetter87, Ljiljana B. Lazarević82, Etienne P. LeBel88, Key Jung Lee57, Minha Lee7, Kristi
Lemm89, Carmel A. Levitan90, Melissa Lewis91, Lin Lin30, Stephanie Lin57, Matthias Lippold34,
Darren Loureiro25, Ilse Luteijn17, Sean Mackinnon92, Heather N. Mainard5, Denise C. Marigold93,
Daniel P. Martin7, Tylar Martinez36, E.J. Masicampo94, Josh Matacotta95, Maya Mathur57,
Michael May44, 96, Nicole Mechin58, Pranjal Mehta15, Johannes Meixner21, 97, Alissa Melinger98,
Jeremy K. Miller99, Mallorie Miller64, Katherine Moore42, 100, Marcus Möschl101, Matt Motyl102,
Stephanie M. Müller48, Marcus Munafo6, Koen I. Neijenhuijs17, Taylor Nervi28, Gandalf
Nicolas103, Gustav Nilsonne104, 105, Brian A. Nosek7, 19, Michèle B. Nuijten20, Catherine Olsson106,
51, Colleen Osborne7, Lutz Ostkamp76, Misha Pavel63, Ian S. Penton-Voak6, Olivia Perna28, Cyril
Pernet107, Marco Perugini35, R. Nathan Pipitone36, Michael Pitts91, Franziska Plessow108, 101,
Jason M. Prenoveau80, Rima-Maria Rahal44, 16, Kate A. Ratliff109, David Reinhard7, Frank
Reproducibility Project
33
Renkewitz48, Ashley A. Ricker10, Anastasia Rigney13, Andrew M. Rivers24, Mark Roebke110,
Abraham M. Rutchick111, Robert S. Ryan112, Onur Sahin16, Anondah Saide10, Gillian M.
Sandstrom8, David Santos113, 114, Rebecca Saxe51, René Schlegelmilch48, 44, Kathleen
Schmidt115, Sabine Scholz116, Larissa Seibel17, Dylan Faulkner Selterman25, Samuel Shaki117,
William B. Simpson7, H. Colleen Sinclair64, Jeanine L. M. Skorinko118, Agnieszka Slowik119, Joel
S. Snyder74, Courtney Soderberg19, Carina Sonnleitner119, Nick Spencer36, Jeffrey R. Spies19,
Sara Steegen40, Stefan Stieger84, Nina Strohminger120, Gavin B. Sullivan121, 122, Thomas
Talhelm7, Megan Tapia36, Anniek te Dorsthorst17, Manuela Thomae73, 123, Sarah L. Thomas7, Pia
Tio16, Frits Traets40, Steve Tsang124, Francis Tuerlinckx40, Paul Turchan125, Milan Valášek107,
Anna E. van 't Veer20, 126, Robbie Van Aert20, Marcel van Assen20, Riet van Bork16, Mathijs van
de Ven17, Don van den Bergh16, Marije van der Hulst17, Roel van Dooren17, Johnny van Doorn40,
Daan R. van Renswoude16, Hedderik van Rijn116, Wolf Vanpaemel40, Alejandro Vásquez
Echeverría127, Melissa Vazquez5, Natalia Velez57, Marieke Vermue17, Mark Verschoor20,
Michelangelo Vianello60, Martin Voracek119, Gina Vuu7, Eric-Jan Wagenmakers16, Joanneke
Weerdmeester17, Ashlee Welsh36, Erin C. Westgate7, Joeri Wissink20, Michael Wood73, Andy
Woods128, 46, Emily Wright36, Sining Wu64, Marcel Zeelenberg20, Kellylynn Zuni36
Affiliations
1Nuenen, the Netherlands; 2Defence Research and Development Canada; 3Southern New
Hampshire University; 4Mercer School of Medicine; 5Georgia Gwinnett College; 6University of
Bristol; 7University of Virginia; 8University of British Columbia; 9University of Würzburg; 10University of California, Riverside; 11University of Waterloo; 12University of California, San
Francisco; 13University of Texas at Austin; 14Heinrich Heine University Düsseldorf; 15University
of Oregon; 16University of Amsterdam; 17Radboud University Nijmegen; 18Virginia
Commonwealth University; 19Center for Open Science; 20Tilburg University; 21Humboldt
University of Berlin; 22Charité - Universitätsmedizin Berlin; 23Belmont Abbey College; 24University of California, Davis; 25University of Maryland; 26University of Michigan; 27Mathematica Policy Research; 28Ashland University; 29Michigan State University; 30University
of Hong Kong; 31Southern Oregon University; 32College of Staten Island, City University of New
York; 33Lock Haven University; 34University of Göttingen; 35University of Milan-Bicocca; 36Adams
State University; 37University of Southern California; 38University of Cologne; 39Australian
National University; 40University of Leuven; 41Texas A & M; 42Elmhurst College; 43University of
Siegen; 44Max Planck Institute for Research on Collective Goods; 45Stockholm School of
Economics; 46Bristol University; 47University of Kent; 48University of Erfurt; 49University of
Washington; 50Prometheus Research; 51Massachusetts Institute of Technology; 52Parmenides
Center for the Study of Thinking; 53Universidad Complutense de Madrid; 54Queen's University; 55University of Pittsburgh; 56University of South Alabama; 57Stanford University; 58University of
Alabama; 59Carnegie Mellon University; 60University of Padua; 61Universidad Nacional De
Asunción; 62Bard College; 63Northeastern University; 64Mississippi State University; 65University
of Sydney; 66Hampshire College; 67Colorado State University-Pueblo; 68Keele University; 69School of Pedagogy and Educational Science & Behavioural Science Institute: Learning and
Plasticity; 70University of Koblenz-Landau; 71NIHR Biomedical Research Centre for Mental
Health at the South London; 72Maudsley NHS Foundation Trust, King's College London;

Reproducibility Project
34
73University of Winchester; 74University of Nevada, Las Vegas; 75University of Lübeck; 76University of Osnabrück; 77University of Birmingham; 78University of Chicago; 79London School
of Economics and Political Science; 80Loyola University Maryland; 81University College London; 82University of Belgrade; 83University of Nijmegen; 84University of Konstanz; 85Saratoga, CA; 86Eindhoven University of Technology; 87University of Iowa; 88Western University; 89Western
Washington University; 90Occidental College; 91Reed College; 92Dalhousie University; 93Renison
University College at University of Waterloo; 94Wake Forest University; 95California State
University, Fullerton; 96University of Bonn; 97University of Potsdam; 98University of Dundee; 99Willamette University; 100Arcadia University ; 101Technische Universität Dresden; 102University
of Illinios at Chicago; 103William and Mary; 104Stockholm University; 105Karolinska Institute; 106New York University; 107The University of Edinburgh; 108Harvard Medical School; 109University
of Florida; 110Wright State University; 111California State University, Northridge; 112Kutztown
University of Pennsylvania; 113Universidad Autónoma de Madrid; 114IE Business School; 115University of Virginia's College at Wise; 116University of Groningen; 117Ariel University; 118Worchester Polytechnic Institute; 119University of Vienna; 120Duke University; 121Centre for
Resarch in Psychology, Behaviour and Achievement; 122Coventry University; 123The Open
University; 124City University of Hong Kong; 125Jacksonville University; 126TIBER (Tilburg Institute
for Behavioral Economics Research); 127Universidad de la República Uruguay; 128University of
Oxford
Reproducibility Project
35
OSF project Final report
R script to reproduce
key finding DOI
A Roelofs https://osf.io/janu3/ https://osf.io/64pz8/ 10.17605/OSF.IO/SPTYB
AL Alter, DM Oppenheimer https://osf.io/jym7h/ https://osf.io/5axfe/ 10.17605/OSF.IO/8EW6S
AL Morris, ML Still https://osf.io/5f42t/ https://osf.io/qg9j7/ 10.17605/OSF.IO/6XJQM
B Dessalegn, B Landau https://osf.io/83n4z/ https://osf.io/qmupg/ 10.17605/OSF.IO/4KR6E
B Eitam, RR Hassin, Y Schul https://osf.io/x75fq/ https://osf.io/bvgyq/ 10.17605/OSF.IO/NMRJG
B Liefooghe, P Barrouillet, A
Vandierendonck, V Camos https://osf.io/2h4vx/ https://osf.io/69b27/ 10.17605/OSF.IO/AVY86
B Monin, PJ Sawyer, MJ
Marquez https://osf.io/a4fmg/ https://osf.io/27gpt/ 10.17605/OSF.IO/SUYFC
BC Storm, EL Bjork, RA Bjork https://osf.io/byxjr/ https://osf.io/xsmzb/ 10.17605/OSF.IO/7UFYV
BK Payne, MA Burkley, MB
Stokes https://osf.io/79y8g/ https://osf.io/u23g9/ 10.17605/OSF.IO/TYS7B
C Farris, TA Treat, RJ Viken, RM
McFall https://osf.io/5u4km/ https://osf.io/ihcrs/ 10.17605/OSF.IO/WMBP2
C Janiszewski, D Uy https://osf.io/ehjdm/ https://osf.io/8qc4x/ 10.17605/OSF.IO/HPK2M
C McKinstry, R Dale, MJ Spivey https://osf.io/pu9nb/ https://osf.io/8hurj/ 10.17605/OSF.IO/WZXQ9
C Mitchell, S Nash, G Hall https://osf.io/beckg/ https://osf.io/n539q/ 10.17605/OSF.IO/A9VRQ
CJ Berry, DR Shanks, RN
Henson https://osf.io/yc2fe/ https://osf.io/9ivaj/ 10.17605/OSF.IO/CBWGJ
CJ Soto, OP John, SD Gosling, J
Potter https://osf.io/6zdct/ https://osf.io/3y9sj/ 10.17605/OSF.IO/U3X7S
CP Beaman, I Neath, AM
Surprenant https://osf.io/a6mje/ https://osf.io/pmhd7/ 10.17605/OSF.IO/Q7HM4
CR Cox, J Arndt, T Pyszczynski,
J Greenberg, A Abdollahi, S
Solomon https://osf.io/uhnd2/ https://osf.io/fg2u9/ 10.17605/OSF.IO/853UE
CS Dodson, J Darragh, A
Williams https://osf.io/b9dpu/ https://osf.io/dctav/ 10.17605/OSF.IO/49XEA
D Albarracín, IM Handley, K
Noguchi, KC McCulloch, H Li, J
Leeper, RD Brown,
A Earl, WP Hart https://osf.io/2pbaf/ https://osf.io/gtewj/ 10.17605/OSF.IO/36DR5
D Albarracín, IM Handley, K
Noguchi, KC McCulloch, H Li, J
Leeper, RD Brown, A Earl, WP
Hart https://osf.io/tarp4/ https://osf.io/256xy/ 10.17605/OSF.IO/CTVEJ
Reproducibility Project
36
D Ganor-Stern, J Tzelgov https://osf.io/7mgwh/ https://osf.io/s5e3w/ 10.17605/OSF.IO/693JY
D Mirman, JS Magnuson https://osf.io/r57hu/ https://osf.io/tjzqr/ 10.17605/OSF.IO/PK952
DA Armor, C Massey, AM
Sackett https://osf.io/8u5v2/ https://osf.io/esa3j/ 10.17605/OSF.IO/WBS96
DB Centerbar, S Schnall, GL
Clore, ED Garvin https://osf.io/wcgx5/ https://osf.io/g29pw/ 10.17605/OSF.IO/NGXYE
DM Amodio, PG Devine, E
Harmon-Jones https://osf.io/ysxmf/ https://osf.io/9gky5/ 10.17605/OSF.IO/DQYBC
DR Addis, AT Wong, DL
Schacter https://osf.io/9ayxi/ https://osf.io/gfn65/ 10.17605/OSF.IO/E89GH
E Harmon-Jones, C Harmon-
Jones, M Fearn, JD Sigelman, P
Johnson https://osf.io/zpwne/ https://osf.io/79ctv/ 10.17605/OSF.IO/RQTGZ
E Nurmsoo, P Bloom https://osf.io/ictp5/ https://osf.io/ewtn6/ 10.17605/OSF.IO/VK6D9
E van Dijk, GA van Kleef, W
Steinel, I van Beest https://osf.io/2idfu/ https://osf.io/cxwev/ 10.17605/OSF.IO/4HQD6
E Vul, H Pashler https://osf.io/7kimb/ https://osf.io/8twa9/ 10.17605/OSF.IO/2HK76
E Vul, M Nieuwenstein, N
Kanwisher https://osf.io/jupew/ https://osf.io/2mcdv/ 10.17605/OSF.IO/PYT4E
EJ Masicampo, RF Baumeister https://osf.io/897ew/ https://osf.io/4tb8a/ 10.17605/OSF.IO/8YBK5
EP Lemay, MS Clark https://osf.io/efjn3/ https://osf.io/nhsdq/ 10.17605/OSF.IO/XY9MV
EP Lemay, MS Clark https://osf.io/mv3i7/ https://osf.io/wb4vd/ 10.17605/OSF.IO/3RTVZ
G Hajcak, D Foti https://osf.io/83tsz/ https://osf.io/vjb2a/ 10.17605/OSF.IO/HSNTD
G Tabibnia, AB Satpute, MD
Lieberman https://osf.io/56fmw/ https://osf.io/e3ckz/ 10.17605/OSF.IO/VQZX9
GA Alvarez, A Oliva https://osf.io/dm2kj/ https://osf.io/xgdqy/ 10.17605/OSF.IO/FS3UT
GP Lau, AC Kay, SJ Spencer https://osf.io/42hgf/ https://osf.io/cwkzu/ 10.17605/OSF.IO/FYMUE
H Ersner-Hershfield, JA Mikels,
SJ Sullivan, LL Carstensen https://osf.io/fw6hv/ https://osf.io/qedt9/ 10.17605/OSF.IO/X5SZY
J Correll https://osf.io/hzka3/ https://osf.io/476wy/ 10.17605/OSF.IO/8DZPJ
J Förster, N Liberman, S
Kuschel https://osf.io/sxnu6/ https://osf.io/h2r9c/ 10.17605/OSF.IO/AK3RJ
J Winawer, AC Huk, L
Boroditsky https://osf.io/ertbg/ https://osf.io/efu3h/ 10.17605/OSF.IO/M9SUF
JA Richeson, S Trawalter https://osf.io/phwi4/ https://osf.io/wi6hv/ 10.17605/OSF.IO/S2D6T
JE Marsh, F Vachon, DM Jones https://osf.io/sqcwk/ https://osf.io/pfmwj/ 10.17605/OSF.IO/VJ2XR
JI Campbell, ND Robert https://osf.io/bux7k/ https://osf.io/z75yu/ 10.17605/OSF.IO/689XC
JJ Exline, RF Baumeister, AL
Zell, AJ Kraft, CV Witvliet https://osf.io/es7ub/ https://osf.io/jfigk/ 10.17605/OSF.IO/NRJS5
Reproducibility Project
37
JL Risen, T Gilovich https://osf.io/wvcgb/ https://osf.io/itc9q/ 10.17605/OSF.IO/BFZN9
JL Tracy, RW Robins https://osf.io/9uqxr/ https://osf.io/k7huw/ 10.17605/OSF.IO/TY9XH
JR Crosby, B Monin, D
Richardson https://osf.io/nkaw4/ https://osf.io/3nay6/ 10.17605/OSF.IO/HB7KJ
JR Schmidt, D Besner https://osf.io/bskwq/ https://osf.io/ktgnq/ 10.17605/OSF.IO/X5B6D
JS Nairne, JN Pandeirada, SR
Thompson https://osf.io/v4d2b/ https://osf.io/witg3/ 10.17605/OSF.IO/ZC468
JT Larsen, AR McKibban https://osf.io/h4cbg/ https://osf.io/qewvf/ 10.17605/OSF.IO/K5CWT
K Fiedler https://osf.io/vtz2i/ https://osf.io/4m8ir/ 10.17605/OSF.IO/3FJVT
K Oberauer https://osf.io/n32zj/ https://osf.io/vhzi6/ 10.17605/OSF.IO/9P2QR
KA Ranganath, BA Nosek https://osf.io/9xt25/ https://osf.io/m4xp8/ 10.17605/OSF.IO/PX56H
KD Vohs, JW Schooler https://osf.io/2nf3u/ https://osf.io/eyk8w/ 10.17605/OSF.IO/3F9KR
KE Stanovich, RF West https://osf.io/p3gz2/ https://osf.io/jv4tw/ 10.17605/OSF.IO/7BNFP
KL Blankenship, DT Wegener https://osf.io/v3e2z/ https://osf.io/4vuhw/ 10.17605/OSF.IO/KG2X5
KR Morrison, DT Miller https://osf.io/2jwi6/ https://osf.io/hau4p/ 10.17605/OSF.IO/JHN4G
L Demany, W Trost, M Serman,
C Semal https://osf.io/wx74s/ https://osf.io/dw4xu/ 10.17605/OSF.IO/WM2A8
L Sahakyan, PF Delaney, ER
Waldum https://osf.io/kcwfa/ https://osf.io/2hasj/ 10.17605/OSF.IO/BK79Y
LE Williams, JA Bargh https://osf.io/7uh8g/ https://osf.io/85bnh/ 10.17605/OSF.IO/P87CN
LS Colzato, MT Bajo, W van den
Wildenberg, D Paolieri, S
Nieuwenhuis, W La Heij, B
Hommel https://osf.io/a5ukz/ https://osf.io/kb59n/ 10.17605/OSF.IO/NRA37
M Bassok, SF Pedigo, AT
Oskarsson https://osf.io/irgbs/ https://osf.io/25vhj/ 10.17605/OSF.IO/3VA2J
M Couture, D Lafond, S
Tremblay https://osf.io/qm5n6/ https://osf.io/3zg7e/ 10.17605/OSF.IO/MGHVS
M Koo, A Fishbach https://osf.io/68m2c/ https://osf.io/p5i9j/ 10.17605/OSF.IO/7CZWD
M Reynolds, D Besner https://osf.io/fkcn5/ https://osf.io/yscmg/ 10.17605/OSF.IO/RC2KZ
M Tamir, C Mitchell, JJ Gross https://osf.io/7i2tf/ https://osf.io/mwgub/ 10.17605/OSF.IO/TR7FP
MD Henderson, Y de Liver, PM
Gollwitzer https://osf.io/cjr7d/ https://osf.io/b2ejv/ 10.17605/OSF.IO/45VWM
MJ Yap, DA Balota, CS Tse, D
Besner https://osf.io/dh4jx/ https://osf.io/nuab4/ 10.17605/OSF.IO/397FH
N Epley, S Akalis, A Waytz, JT
Cacioppo https://osf.io/m5a2c/ https://osf.io/utcr3/ 10.17605/OSF.IO/HT9DU
N Halevy, G Bornstein, L Sagiv https://osf.io/sjwcd/ https://osf.io/7xyi5/ 10.17605/OSF.IO/K82YB
N Janssen, FX Alario, A https://osf.io/e3ry5/ https://osf.io/7cab3/ 10.17605/OSF.IO/QMPKY
Reproducibility Project
38
Caramazza
N Janssen, W Schirm, BZ
Mahon, A Caramazza https://osf.io/5p7i6/ https://osf.io/iwaqf/ 10.17605/OSF.IO/8QRTD
N Shnabel, A Nadler https://osf.io/fuj2c/ https://osf.io/5bwva/ 10.17605/OSF.IO/3M7QW
NB Turk-Browne, PJ Isola, BJ
Scholl, TA Treat https://osf.io/ktnmc/ https://osf.io/gpvrm/ 10.17605/OSF.IO/CHF7M
NO Rule, N Ambady https://osf.io/4peq6/ https://osf.io/2bu9s/ 10.17605/OSF.IO/3UW96
P Bressan, D Stranieri https://osf.io/7vriw/ https://osf.io/2a5ru/ 10.17605/OSF.IO/J3CFM
P Bressan, D Stranieri https://osf.io/7vriw/ https://osf.io/47cs8/ 10.17605/OSF.IO/J3CFM
P Fischer, S Schulz-Hardt, D
Frey https://osf.io/5afur/ https://osf.io/bajxq/ 10.17605/OSF.IO/CY9V4
P Fischer, T Greitemeyer, D
Frey https://osf.io/9pnct/ https://osf.io/7htc9/ 10.17605/OSF.IO/E35Y2
PA Goff, CM Steele, PG Davies https://osf.io/7q5us/ https://osf.io/xfj5w/ 10.17605/OSF.IO/PKTMA
PA White https://osf.io/x7c9i/ https://osf.io/ygh35/ 10.17605/OSF.IO/Y8NJT
PW Eastwick, EJ Finkel https://osf.io/5pjsn/ https://osf.io/x3hbe/ 10.17605/OSF.IO/ZDW87
S Farrell https://osf.io/tqf2u/ https://osf.io/nmpdc/ 10.17605/OSF.IO/BVU64
S Forti, GW Humphreys https://osf.io/nhqgs/ https://osf.io/jknef/ 10.17605/OSF.IO/FJ6E8
S Pacton, P Perruchet https://osf.io/asn7w/ https://osf.io/3kn4c/ 10.17605/OSF.IO/FSUT4
S Schnall, J Benton, S Harvey https://osf.io/2dem3/ https://osf.io/pkaqw/ 10.17605/OSF.IO/7XUPR
SE Palmer, T Ghose https://osf.io/en42q/ https://osf.io/jnqky/ 10.17605/OSF.IO/GKNAU
SJ Heine, EE Buchtel, A
Norenzayan https://osf.io/g4hn3/ https://osf.io/akv6y/ 10.17605/OSF.IO/PUA6S
SK Moeller, MD Robinson, DL
Zabelina https://osf.io/7dybc/ https://osf.io/uevha/ 10.17605/OSF.IO/76J48
SL Murray, JL Derrick, S Leder,
JG Holmes https://osf.io/3hndq/ https://osf.io/9ue7j/ 10.17605/OSF.IO/T75E3
SM McCrea https://osf.io/ytxgr/ https://osf.io/7pdh8/ 10.17605/OSF.IO/2KJGZ
T Goschke, G Dreisbach https://osf.io/pnius/ https://osf.io/mvdsw/ 10.17605/OSF.IO/RKQW2
T Makovski, R Sussman, YV
Jiang https://osf.io/xtcuv/ https://osf.io/saq6x/ 10.17605/OSF.IO/BHNKQ
TJ Pleskac https://osf.io/gyn9e/ https://osf.io/scqrd/ 10.17605/OSF.IO/3AMJ4
V LoBue, JS DeLoache https://osf.io/5ygej/ https://osf.io/p67kr/ 10.17605/OSF.IO/CSM3D
V Purdie-Vaughns, CM Steele,
PG Davies, R Ditlmann, JR
Crosby https://osf.io/3rxvs/ https://osf.io/5vdrg/ 10.17605/OSF.IO/2R7NK
X Dai, K Wertenbroch, CM
Brendl https://osf.io/js7gd/ https://osf.io/aigrv/ 10.17605/OSF.IO/P6JXM

Reproducibility Project
39
Z Estes, M Verges, LW Barsalou https://osf.io/b7zek/ https://osf.io/eqp4w/ 10.17605/OSF.IO/Z6QW2
Reproducibility Project
40
Supplemental Information for
Estimating the Reproducibility of Psychological Science
Open Science Collaboration
Table of Contents
1. Method
a. Replication Teams
b. Replication Protocol
2. Measures and Moderators
a. Characteristics of Original Study
b. Characteristics of Replication
3. Guide to the Information Commons
4. Results
a. Preliminary Analyses
b. Evaluating replication against null hypothesis
c. Evaluating replication against original effect size
d. Comparing original and replication effect sizes
e. Combining original and replication effect sizes for cumulative evidence
f. Subjective assessment: Did it replicate?
g. Meta-analysis of all original study effect, and of all replication study effects
h. Meta-analysis of difference of effect size between original and replication study
i. Moderator analyses

Reproducibility Project
41
Method
Two articles have been published on the methodology of the Reproducibility Project:
Psychology.
1. Open Science Collaboration, An open, large-scale, collaborative effort to estimate the
reproducibility of psychological science. Perspect. Psychol. Sci.7, 657-660 (2012).
2. Open Science Collaboration, The Reproducibility Project: A Model of Large-Scale
Collaboration for Empirical Research on Reproducibility. In Implementing Reproducible
Computational Research (A Volume in The R Series), V. Stodden, F. Leisch, R. Peng,
Eds. (Taylor & Francis, New York, 2014) pp. 299-323.
The first introduced the project aims and basic design. The second provided detail on the
methodology and mechanisms for maintaining standards and quality control. The methods
sections in the main text and below summarize the key aspects of the methodology and provide
additional information, particularly concerning the latter stages of the project that were not
addressed in the prior articles.
Replication Teams
RPP was introduced publicly as a crowdsourcing research project in November 2011.
Interested researchers were invited to get involved to design the project, conduct a replication,
or provide other kinds of research support such as coding articles. A total of 270 individuals
contributed sufficiently to earn co-authorship on this report.
Of the 100 replications completed, 85 unique senior members were identified—several
of whom led multiple replications. Among those senior members, 72 had a PhD or equivalent, 9
had a master’s degree or equivalent, 1 had some graduate school, and 3 had or were near
completing a bachelor’s degree or equivalent. By occupation, 62 were faculty members or
equivalent, 8 were post-docs, 13 were graduate students, 1 was an undergraduate student, and
1 was a private sector researcher. By domain, 36 identified social psychology as their primary
domain, 22 identified cognitive psychology, 6 identified quantitative psychology, and 21
identified other domains.
Replication Protocol
Sloppy or underpowered replication attempts would provide uninteresting reasons for
irreproducibility. Replication teams followed an extensive protocol to maximize quality, clarity,
and standardization of the replications. Full documentation of the protocol is available at
https://osf.io/ru689/.
Power analysis. After identifying the key effect, power analyses estimated the sample
sizes needed to achieve 80%, 90%, and 95% power to detect the originally reported effect size.
Teams were required to propose a study design that would achieve at least 80% power and
were encouraged to obtain higher power if feasible to do so. All protocols proposed 80% power

Reproducibility Project
42
or greater, however, after corrections to power analyses, three fell short in their planning, with
56%, 69%, and 76% power. On average, 92% power was proposed (median = 95%). Three
replication teams were unable to conduct power analyses based on available data—their
method for planning sample size is detailed in their replication reports. Following data collection,
90 of the 97 achieved 80% or greater power to detect the original effect size. Post-hoc
calculations showed an average of 92% power to detect an effect size equivalent to the original
studies’. The median power was 95% and 57 had 95% power or better. Note that these power
estimates do not account for the possibility that the published effect sizes are overestimated
because of publication biases. Indeed, this is one of the potential challenges for reproducibility.
Obtaining or creating materials. Project coordinators or replication teams contacted
original authors for study materials in order to maximize the consistency between the original
and replication effort. Of the completed replications, 89 were able to obtain some or all of the
original materials. In 8 cases, the original materials were not available, and in only 3 cases the
original authors did not share materials or provide information about where the materials could
be obtained. Replication teams prepared materials, adapting or creating them for the particular
data collection context. If information available from the original report or author contacts was
insufficient, teams noted deviations or inferences in their written protocols.
Writing study protocols. The protocols included a brief introduction explaining the
main idea of the study, the key finding for replication, and any other essential information about
the study. Then, they had a complete methods section describing the power analysis, sampling
plan, procedure, materials, and analysis plan. Analysis plans included details of data exclusion
rules, data cleaning, inclusion of covariates in the model, and the inferential test/model that
would be used. Finally, the protocol listed known differences from the original study in
sampling, setting, procedure, and analysis plan. The objective was to minimize differences that
are expected to alter the effect, but report transparently about them to provide a means of
identifying possible reasons for variation in observed effects, and to identify factors for
establishing generalizability of the results when similar effects are obtained. All replication
teams completed a study protocol in advance of data collection.
Replication teams were encouraged to apply for funding for the replication to the Center
for Open Science (http://cos.io/). A grants committee comprised of members of the
collaboration reviewed study protocols made award recommendations.
Reviewing study protocols. The written protocols were shared with original authors for
critique prior to initiating data collection. Also, protocols were reviewed by another member of
the RPP team for quality assurance and consistency with the reporting template. Feedback
from the original authors was incorporated into the study design. If the replication team could
not address the feedback, the original author comments were included in the protocol so that
readers could identify the a priori comments by original authors about the design. Replication
teams recorded whether the original authors endorsed the design (69 replications), maintained
concerns based on informed judgment/speculation (8 replications), maintained concerns based
on published empirical evidence for constraints on the effect (3 replications), or did not respond
(18 replications). Two replications did not seek and receive feedback prior to data collection.
Uploading the study protocol. Once finalized, the protocol and shareable materials
were posted publicly on the Open Science Framework (OSF; https://osf.io/ezcuj/) following a
standard format. If the original author requested to keep materials private, replication teams
Reproducibility Project
43
noted this and indicated how to contact the original author to obtain the materials. After upload,
the replication team could begin data collection.
Reporting. Following data collection, teams initiated report writing and data sharing. If
there were any deviations from the registered protocol, teams noted those in the final report.
Also, teams posted anonymized datasets and a codebook to the OSF project page. Teams
conducted the planned data analysis from the protocol as a confirmatory analysis. Following
completion of the confirmatory analysis phase, teams were encouraged to conduct follow-up
exploratory analysis if they wished and report both—clearly distinguished—in their final report.
After writing the results section of the final report, teams added discussion with open-
ended commentary about insights gained from exploratory analysis, an overall assessment of
the outcome of the replication attempt, and discussion of any objections or challenges raised by
the original authors’ review of the protocol. At least one other RPP member then conducted a
review of the final report to maximize consistency in reporting format, identify errors, and
improve clarity. Following review, replication teams shared their report directly with the original
authors and publicly on the OSF project page. If additional issues came up following posting of
the report, teams could post a revision of the report. The OSF offers version control so all prior
versions of posted reports can be retrieved in order to promote transparent review of edits and
improvements.
Measures and Moderators
Characteristics of Original Study
Original study effect size, P value, and sample size. Qualities of the original
statistical evidence may predict reproducibility. All else being equal, results with larger effect
sizes and smaller P values ought to be more reproducible than others. Also, larger sample
sizes are a factor for increasing the precision of estimating effects; all else being equal, larger
sample sizes should be associated with more reproducible results. A qualification of this
expectation is that some study designs use very few participants and gain substantial power via
repeated measurements.
Importance of the result. Some effects are more important than others. This variable
was the aggregate of the citation impact of the original article and coder ratings of the extent to
which the article was exciting and important. Effect importance could be a positive predictor of
reproducibility because findings that have a strong impact on the field do so, in part, because
they are reproducible and spur additional innovation. If they were not reproducible, then they
may not have a strong impact on the field. On the other hand, exciting or important results are
appealing because they advance an area of research, but they may be less reproducible than
mundane results because true advances are difficult and infrequent, and theories and
methodologies employed at the fringe of knowledge are often less refined or validated making
them more difficult to reproduce.
Citation impact of original article. Project coordinators used Google Scholar data to
calculate the citation impact of the original article at the time of conducting the project analysis
(March 2015).

Reproducibility Project
44
Exciting/important effect. Coders independent from the replication teams reviewed the
methodology for the replication studies and answered the following prompt: “To what extent is
the key effect an exciting and important outcome?” To answer this question, coders read the
pre-data collection reports that the replication teams had created. These reports included a
background on the topic, a description of the effect, a procedure, and analysis plan. Responses
were provided on a scale from 1 = Not at all exciting and important, 2 = Slightly exciting and
important, 3 = Somewhat exciting and important, 4 = Moderately exciting and important, 5 =
Very exciting and important, 6 = Extremely exciting and important. One-hundred twenty nine
coders were presented effect reports and these questions for 112 studies (100 replications
reported in the main text + others for which data collection was in progress) in a random order,
and coders rated as many as they wished. Each effect was rated an average of 4.52 times
(median = 4). Ratings were averaged across coders.
Surprising result. Counterintuitive results are appealing because they violate one’s
priors, but they may be less reproducible if priors are reasonably well-tuned to reality. The
same coders that rated the extent to which the effect was exciting/important reviewed the
methodology for the replication studies and answered the following prompt: “To what extent is
the key effect a surprising or counterintuitive outcome?” Responses were provided on a scale
from 1 = Not at all surprising, 2 = Slightly surprising, 3 = Somewhat surprising, 4 = Moderately
surprising, 5 = Very surprising, 6 = Extremely surprising.
Experience and expertise of original team. Higher quality teams may produce more
reproducible results. Quality is multi-faceted and difficult to measure. In the present study, after
standardizing we averaged four indicators of quality - the rated prestige of home institutions of
the 1st and senior authors, and the citation impact of the 1st and senior authors. Other means
of assessing quality could reveal results quite distinct from those obtained by these indicators.
Institution prestige of 1st author and senior author. Authors were coded as being 1st
and most senior; their corresponding institutions were also recorded. The resulting list was
presented to two samples (Mechanical Turk participants n = 108; Project team members n = 70)
to rate institution prestige on a scale from 7 = never heard of this institution, 6 = not at all
prestigious, 5 = slightly prestigious, 4 = moderately prestigious, 3 = very prestigious, 2 =
extremely prestigious, 1 = one of the few most prestigious. MTurk participants rated institution
prestige in general. Project team members were randomly assigned to rate institution prestige
in psychology (n = 33) or in general (n = 37). Correlations of prestige ratings among the three
samples were very high (r’s range .849 to .938). As such, before standardizing, we averaged
the three ratings for a composite institution prestige score.
Citation impact of 1st author and senior author. Project members used Google Scholar
data to estimate the citation impact of first authors and senior authors. These indicators
identified citation impact at the time of writing this report, not at the time the original research
was conducted.
Characteristics of Replication
Replication power and sample size. All else equal, lower power and smaller sample
tests ought to be less likely to reproduce results than higher power and larger sample tests.
Reproducibility Project
45
The caveat above on sample size for original studies is the same as for replication studies.
Replications were required to achieve at least 80% power based on the effect size of the
original study. This narrows the range of actual power in replication tests to maximize likelihood
of obtaining effects, but nonetheless offers a range that could be predictive of reproducibility. A
qualification of this expectation is that power estimates are based on original effects. If
publication bias or other biases produce exaggerated effect sizes in the original studies, then
the power estimates would be less likely to provide predictive power for reproducibility.
Challenge of conducting replication. Reproducibility depends on effective
implementation and execution of the research methodology. However, some methodologies are
more challenging or prone to error and bias than others. As a consequence, variation in the
challenges of conducting replications may be a predictor of reproducibility. This indicator
includes coders’ assessments of expertise required, opportunity for experimenter expectations
to influence outcomes, and opportunity for lack of diligence to influence outcomes. Of course
these issues apply to conducting the original study and interpreting its results, but we treated
these as characteristics of the replication for the present purposes.
For these variables, a small group of coders were trained on evaluating original reports
and a single coder evaluated each study.
Perceived expertise required. Reproducibility might be lower for study designs that
require specialized expertise. Coders independent from the replication teams reviewed the
methodology for the replication studies and answered the following prompt: “To what extent
does the methodology of the study require specialized expertise to conduct effectively? [Note:
This refers to data collection, not data analysis]” Responses were provided on a scale from 1 =
no expertise required, 2 = slight expertise required, 3 = moderate expertise required, 4 = strong
expertise required, 5 = extreme expertise required.
Perceived opportunity for expectancy biases. The expectations of the experimenter can
influence study outcomes (38). Study designs that provide opportunity for researchers’ beliefs
to influence data collection may be more prone to reproducibility challenges than study designs
that avoid opportunity for influence. Coders independent from the replication teams reviewed
the methodology for the replication studies and answered the following prompt: “To what extent
does the methodology of the study provide opportunity for the researchers’ expectations about
the effect to influence the results? (i.e., researchers belief that the effect will occur could elicit
the effect, or researchers belief that the effect will not occur could eliminate the effect) [Note:
This refers to data collection, not data analysis].” Responses were provided on a scale from 1 =
No opportunity for researcher expectations to influence results, 2 = Slight opportunity for
researcher expectations to influence results, 3 = Moderate opportunity for researcher
expectations to influence results, 4 = Strong opportunity for researcher expectations to influence
results, 5 = Extreme opportunity for researcher expectations to influence results.
Perceived opportunity for impact of lack of diligence. Studies may be less likely to be
reproducible if they are highly reliant on experimenters’ diligence to conduct the procedures
effectively. Coders independent from the replication teams reviewed the methodology for the
replication studies and answered the following prompt: “To what extent could the results be
affected by lack of diligence by experimenters in collecting the data? [Note: This refers to data
collection, not creating the materials].” Responses were provided on a scale from 1 = No
opportunity for lack of diligence to affect the results, 2 = Slight opportunity for lack of diligence to
Reproducibility Project
46
affect the results, 3 = Moderate opportunity for lack of diligence to affect the results, 4 = Strong
opportunity for lack of diligence to affect the results, 5 = Extreme opportunity for lack of
diligence to affect the results.
Experience and expertise of replication team. Just as experience and expertise may
be necessary to obtain reproducible results, expertise and experience may be important for
conducting effective replications. We focused on the senior member of the replication team and
created an aggregate by standardizing and averaging scores on 7 characteristics: position
(undergraduate to professor), highest degree (high school to PhD or equivalent), self-rated
domain expertise, self-rated method expertise, total number of publications, total number of
peer-reviewed empirical articles, and citation impact.
Position of senior member of replication team. Reproducibility may be enhanced by
having more seasoned researchers guiding the research process. Replication teams reported
the position of the senior member of the team from: 7 = Professor (or equivalent), 6 = Associate
Professor (or equivalent), 5 = Assistant Professor (or equivalent), 4 = Post-doc, Research
Scientist, or Private Sector Researcher, 3 = Ph.D. student, 2 = Master’s student, 1 =
Undergraduate student, or other.
Highest degree of replication team’s senior member. Replication teams reported the
highest degree obtained by the senior member of the team from 4 = PhD/equivalent, 3 =
Master’s/equivalent, 2 = some graduate school, 1 = Bachelor’s/equivalent.
Replication team domain expertise. Reproducibility may be stronger if the replication
team is led by a person with high domain expertise in the topic of study. Replication teams self-
rated the domain expertise of the senior member of the project on the following scale: 1 = No
expertise - No formal training or experience in the topic area, 2 = Slight expertise - Researchers
exposed to the topic area (e.g., took a class), but without direct experience researching it, 3 =
Some expertise - Researchers who have done research in the topic area, but have not
published in it, 4 = Moderate expertise - Researchers who have previously published in the topic
area of the selected effect, and do so irregularly, 5 = High expertise - Researchers who have
previously published in the topic area of the selected effect, and do so regularly.
Replication team method expertise. Reproducibility may be stronger if the replication
team is led by a person with high expertise in the methodology used for the study. Replication
teams self-rated the domain expertise of the senior member of the project on the following
scale: 1 = No expertise - No formal training or experience with the methodology, 2 = Slight
expertise - Researchers exposed to the methodology, but without direct experience using it, 3 =
Some expertise - Researchers who have used the methodology in their research, but have not
published with it, 4 = Moderate expertise - Researchers who have previously published using
the methodology of the selected effect, and use the methodology irregularly, 5 = High expertise
- Researchers who have previously published using the methodology of the selected effect, and
use the methodology regularly.
Replication team senior member's total publications and total number of peer-reviewed
articles. All else being equal, more seasoned researchers may be better prepared to reproduce
research results than more novice researchers. Replication teams self-reported the total
number of publications and total number of peer-reviewed articles by the senior member of the
team.
Reproducibility Project
47
Institution prestige of replication 1st author and senior author. We followed the same
methodology for computing institution prestige for replication teams as we did for original author
teams.
Citation impact of replication 1st author and senior author. Researchers who have
conducted more research that has impacted other research via citation may have done so
because of additional expertise and effectiveness in conducting reproducible research. Project
members calculated the total citations of the 1st author and most senior member of the team via
Google Scholar.
Self-assessed quality of replication. Lower quality replications may produce results
less similar to original effects than higher quality replications. Replication teams are in the best
position to know the quality of project execution, but are also likely to be ego invested in
reporting high quality. Nonetheless, variation in self-assessed quality across teams may
provide a useful indicator of quality. Also, some of our measures encouraged variation in quality
reports by contrasting directly with the original study, or studies in general. After standardizing,
we created an aggregate score by averaging four variables: self-assessed quality of
implementation, self-assessed quality of data collection, self-assessed similarity to original, and
self-assessed difficulty of implementation. Future research may assess additional quality
indicators from the public disclosure of methods to complement this assessment.
Self-assessed implementation quality of replication. Sloppy replications may be less
likely to reproduce original results because of error and inattention. Replication teams self-
assessed the quality of the replication study methodology and procedure design in comparison
to the original research by answering the following prompt: “To what extent do you think that the
replication study materials and procedure were designed and implemented effectively?
Implementation of the replication materials and procedure…” Responses were provided on a
scale from 1 = was of much higher quality than the original study, 2 = was of moderately higher
quality than the original study, 3 = was of slightly higher quality than the original study, 4 = was
about the same quality as the original study, 5 = was of slightly lower quality than the original
study, 6 = was of moderately lower quality than the original study, 7 = was of much lower quality
than the original study.
Self-assessed data collection quality of replication. Sloppy replications may be less
likely to reproduce original results because of error and inattention. Replication teams self-
assessed the quality of the replication study data collection in comparison to the average study
by answering the following prompt: “To what extent do you think that the replication study data
collection was completed effectively for studies of this type?” Responses were provided on a
scale from 1 = Data collection quality was much better than the average study, 2 = Data
collection quality was better than the average study, 3 = Data collection quality was slightly
better than the average study, 4 = Data collection quality was about the same as the average
study, 5 = Data collection quality was slightly worse than the average study, 6 = Data collection
quality was worse than the average study, 7 = Data collection quality was much worse than the
average study.
Self-assessed replication similarity to original. It can be difficult to reproduce the
conditions and procedures of the original research for a variety of reasons. Studies that are
more similar to the original research may be more reproducible than those that are more
dissimilar. Replication teams self-evaluated the similarity of the replication with the original by
Reproducibility Project
48
answering the following prompt: “Overall, how much did the replication methodology resemble
the original study?” Responses were provided on a scale from 1 = Not at all similar, 2 = Slightly
similar, 3 = Somewhat similar, 4 = Moderately similar, 5 = Very similar, 6 = Extremely similar, 7
= Essentially identical.
Self-assessed difficulty of implementation. Another indicator of adherence to the original
protocol is the replication team’s self-assessment of how challenging it was to conduct the
replication. Replication teams responded to the following prompt: “How challenging was it to
implement the replication study methodology?” Responses were provided on a scale from 1 =
Extremely challenging, 2 = Very challenging, 3 = Moderately challenging, 4 = Somewhat
challenging, 5 = Slightly challenging, 6 = Not at all challenging.
Other variables. Some additional variables were collected and appear in the tables not
aggregated with other indicators, or are not reported at all in the main text. They are
nonetheless available for additional analysis. Below are highlights and a comprehensive
summary of additional variables is available in the Master Data File.
Replication team surprised by outcome of replication. The replication team rated the
extent to which they were surprised by the results of their replication. Teams responded to the
following prompt: “To what extent was the replication team surprised by the replication results?”
Responses were provided on a scale from 1 = Results were exactly as anticipated, 2 = Results
were slightly surprising, 3 = Results were somewhat surprising, 4 = Results were moderately
surprising, 5 = Results were extremely surprising. Results are reported in Table S5. Across
reproducibility criteria, there was a moderate relationship such that greater surprise with the
outcome was associated with weaker reproducibility.
Effect similarity. In addition to the subjective “yes/no” assessment of replication in the
main text, replication teams provided another rating of the extent to which the key effect in the
replication was similar to the original result. Teams responded to the following prompt: “How
much did the key effect in the replication resemble the key effect in the original study?”
Responses were provided on a scale from: 7 = virtually identical (12), 6 = extremely similar (16),
5 = very similar (8), 4 = moderately similar (12), 3 = somewhat similar (14), 2 = slightly similar
(9), 1 = not at all similar (28). Replication results of key effects were deemed between
somewhat and moderately similar to the original results, M = 3.60, SD = 2.18.
Findings similarity. Replication teams assessed the extent to which the overall findings
of the study, not just the key result, were similar to the original study findings. Teams
responded to the following prompt: “Overall, how much did the findings in the replication
resemble the findings in the original study?” Responses were provided on a scale from: 7 =
virtually identical (5), 6 = extremely similar (13), 5 = very similar (21), 4 = moderately similar
(20), 3 = somewhat similar (13), 2 = slightly similar (13), 1 = not at all similar (15). Replication
results of overall findings were deemed between somewhat and moderately similar to the
original results, M = 3.78, SD = 1.78.
Internal conceptual and direct replications. Original articles may have contained
replications of the key effect in other studies. Coders evaluated whether other studies
contained replications of the key result, and whether those replications were direct or
conceptual. There were few of both (M = 0.91 for conceptual replications, M = 0.06 for direct
replications).
Reproducibility Project
49
Guide to the Information Commons
There is a substantial collection of materials comprising this project that is publicly accessible
for review, critique, and reuse. The following list of links are a guide to the major components.
1. RPP OSF Project: The main repository for all project content is here
(https://osf.io/ezcuj/)
2. RPP Information Commons: The project background and instructions for replication
teams is in the wiki of the main OSF project (https://osf.io/ezcuj/wiki/home/)
3. RPP Researcher Guide: Protocol for replications teams to complete a replication
(https://osf.io/ru689/)
4. Master Data File: Aggregate data across replication studies (https://osf.io/5wup8/)
5. Master Analysis Scripts: R script for reproducing analyses for each replication
(https://osf.io/fkmwg/); R script for reproducing Reproducibility Project: Psychology
findings (https://osf.io/vdnrb/)
6. Appendices: Text summaries of analysis scripts
All reports, materials, and data for each replication are available publicly. In a few cases,
research materials could not be made available because of copyright. In those cases, a note is
available in that project’s wiki explaining the lack of access and how to obtain the materials.
The following table provides quick links to the projects (with data and materials), final reports,
and the R script to reproduce the key finding for all replication experiments.
Two of the articles available for replication were replicated twice (39, 40). The first (39), was
replicated in an in lab setting, and online as a secondary replication. The second, experiment 7
of Albarracín et al. (2008) was replicated in a lab setting and a secondary replication of
experiment 5 was conducted online. These two supplementary replications bring the total
number of replications pursued to 113 and total completed to 100.
Results
Preliminary analyses
The input of our analyses were the P values (DH and DT in the Master Data File), their
significance (columns EA and EB), effect sizes of both original and replication study (columns
DJ and DV), which effect size was larger (column EC), direction of the test (column BU), and
whether the sign of both studies’ effects was the same or opposite (column BT). First, we
checked the consistency of P value and test statistics whenever possible (i.e., when all were
provided), by recalculating the p-value using the test statistics. We used the recalculated P
values in our analysis, with a few exceptions (see Appendix [A1] for details on the recalculation
of P values). These P values were used to code the statistical (non)significance of the effect,
with the exception of four effects with P values slightly larger than .05 that were interpreted as
significant; these studies were treated as significant. We ended up with 99 study-pairs with
complete data on P values, and 100 study-pairs with complete data on the significance of the
replication effect.
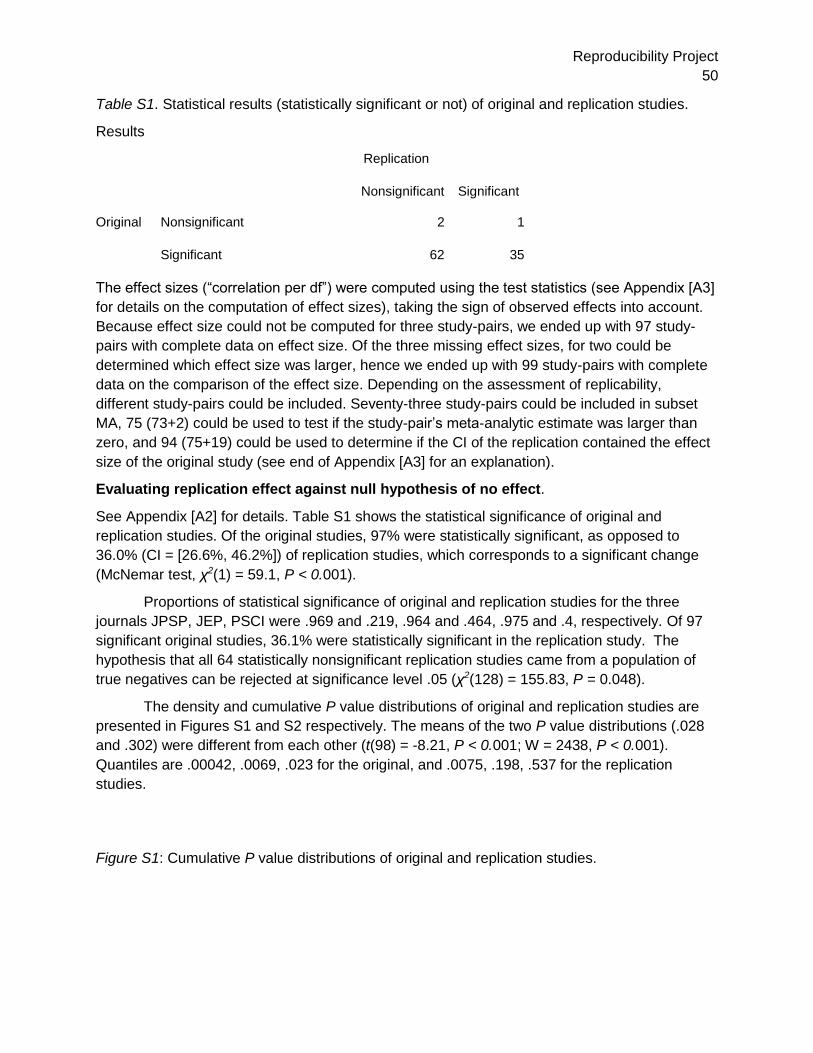
Reproducibility Project
50
Table S1. Statistical results (statistically significant or not) of original and replication studies.
Results
Replication
Nonsignificant Significant
Original Nonsignificant 2 1
Significant 62 35
The effect sizes (“correlation per df”) were computed using the test statistics (see Appendix [A3]
for details on the computation of effect sizes), taking the sign of observed effects into account.
Because effect size could not be computed for three study-pairs, we ended up with 97 study-
pairs with complete data on effect size. Of the three missing effect sizes, for two could be
determined which effect size was larger, hence we ended up with 99 study-pairs with complete
data on the comparison of the effect size. Depending on the assessment of replicability,
different study-pairs could be included. Seventy-three study-pairs could be included in subset
MA, 75 (73+2) could be used to test if the study-pair’s meta-analytic estimate was larger than
zero, and 94 (75+19) could be used to determine if the CI of the replication contained the effect
size of the original study (see end of Appendix [A3] for an explanation).
Evaluating replication effect against null hypothesis of no effect.
See Appendix [A2] for details. Table S1 shows the statistical significance of original and
replication studies. Of the original studies, 97% were statistically significant, as opposed to
36.0% (CI = [26.6%, 46.2%]) of replication studies, which corresponds to a significant change
(McNemar test, χ2(1) = 59.1, P < 0.001).
Proportions of statistical significance of original and replication studies for the three
journals JPSP, JEP, PSCI were .969 and .219, .964 and .464, .975 and .4, respectively. Of 97
significant original studies, 36.1% were statistically significant in the replication study. The
hypothesis that all 64 statistically nonsignificant replication studies came from a population of
true negatives can be rejected at significance level .05 (χ2(128) = 155.83, P = 0.048).
The density and cumulative P value distributions of original and replication studies are
presented in Figures S1 and S2 respectively. The means of the two P value distributions (.028
and .302) were different from each other (t(98) = -8.21, P < 0.001; W = 2438, P < 0.001).
Quantiles are .00042, .0069, .023 for the original, and .0075, .198, .537 for the replication
studies.
Figure S1: Cumulative P value distributions of original and replication studies.
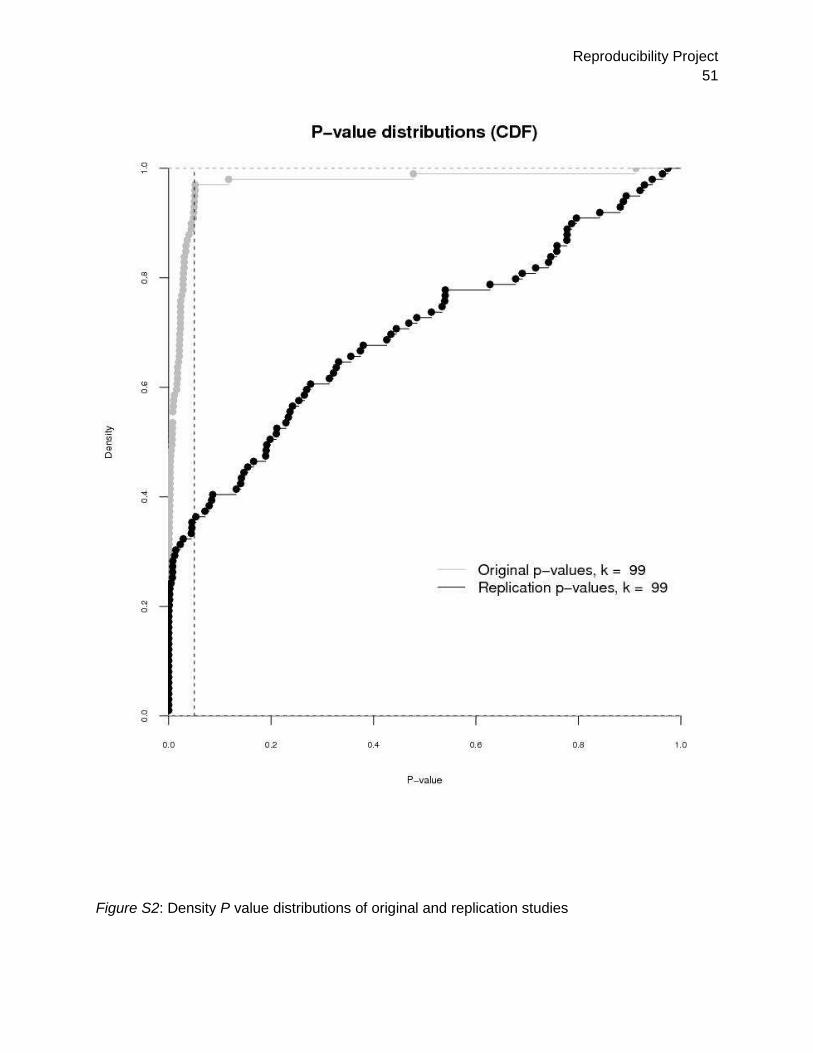
Reproducibility Project
51
Figure S2: Density P value distributions of original and replication studies

Reproducibility Project
52
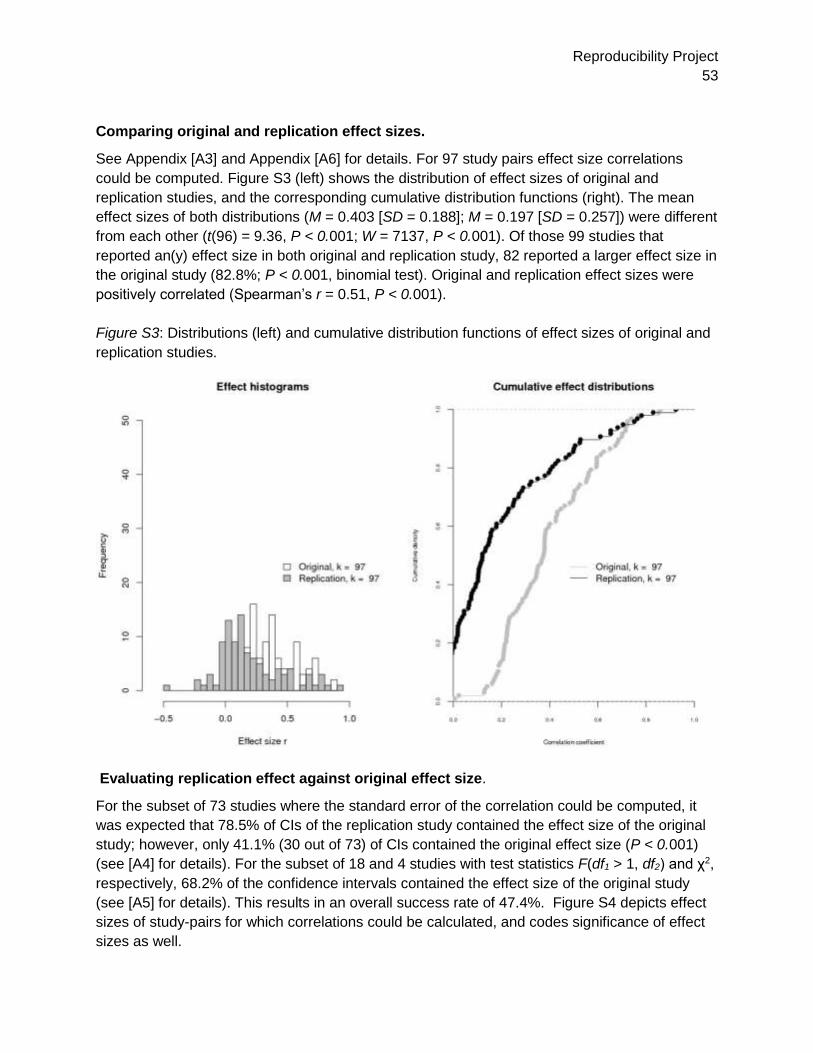
Reproducibility Project
53
Comparing original and replication effect sizes.
See Appendix [A3] and Appendix [A6] for details. For 97 study pairs effect size correlations
could be computed. Figure S3 (left) shows the distribution of effect sizes of original and
replication studies, and the corresponding cumulative distribution functions (right). The mean
effect sizes of both distributions (M = 0.403 [SD = 0.188]; M = 0.197 [SD = 0.257]) were different
from each other (t(96) = 9.36, P < 0.001; W = 7137, P < 0.001). Of those 99 studies that
reported an(y) effect size in both original and replication study, 82 reported a larger effect size in
the original study (82.8%; P < 0.001, binomial test). Original and replication effect sizes were
positively correlated (Spearman’s r = 0.51, P < 0.001).
Figure S3: Distributions (left) and cumulative distribution functions of effect sizes of original and
replication studies.
Evaluating replication effect against original effect size.
For the subset of 73 studies where the standard error of the correlation could be computed, it
was expected that 78.5% of CIs of the replication study contained the effect size of the original
study; however, only 41.1% (30 out of 73) of CIs contained the original effect size (P < 0.001)
(see [A4] for details). For the subset of 18 and 4 studies with test statistics F(df1 > 1, df2) and χ2,
respectively, 68.2% of the confidence intervals contained the effect size of the original study
(see [A5] for details). This results in an overall success rate of 47.4%. Figure S4 depicts effect
sizes of study-pairs for which correlations could be calculated, and codes significance of effect
sizes as well.
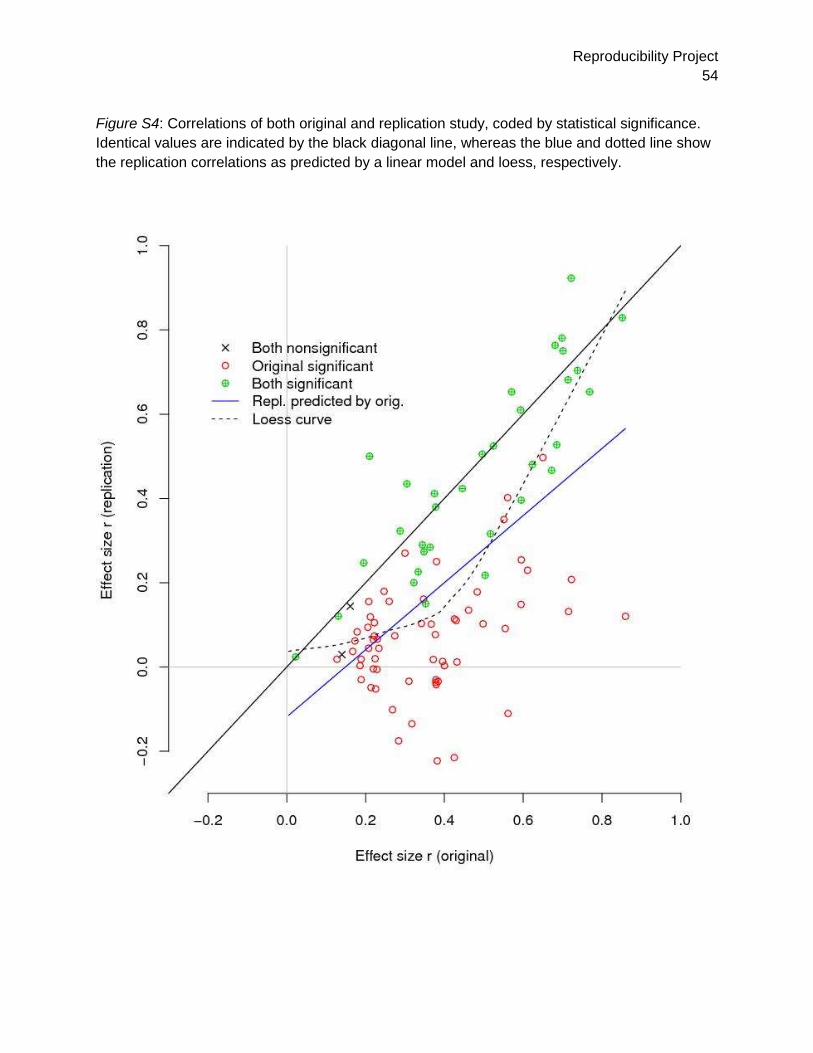
Reproducibility Project
54
Figure S4: Correlations of both original and replication study, coded by statistical significance.
Identical values are indicated by the black diagonal line, whereas the blue and dotted line show
the replication correlations as predicted by a linear model and loess, respectively.

Reproducibility Project
55
Combining original and replication effect sizes for cumulative evidence.
See Appendix [A7] for details. For 75 study-pairs a meta-analysis could be conducted on the
Fisher-transformed correlation scale. In 51 out of 75 pairs the null-hypothesis of no effect was
rejected (68%). The average correlation, after transforming back the Fisher-transformed
estimate, was .310 (SD = 0.223). However, the results differed across discipline; average effect
size was smaller for JPSP (M = 0.138, SD = 0.087) than for the other four journal/discipline
categories, and the percentage of meta-analytic effects rejecting the null-hypothesis was also
lowest for JPSP (42.9%; see Table 1). As noted in the main text, the interpretability of these
meta-analytic estimates is qualified by the possibility of publication bias inflating the original
effect sizes.
Subjective assessment of “Did it replicate?”
Replication teams provided a dichotomous yes/no assessment of whether the effect replicated
or not (Column BX). Assessments were very similar to evaluations by significance testing (P <
0.05) including two original null results being interpreted as successful replications when the
replication was likewise null, and one original null result being interpreted as a failed replication
when the replication showed a significant effect. Overall, there were 39 assessments of
successful replication (39 of 100; 39%).
There are three subjective variables assessing replication success. Additional analyses can be
conducted on replication teams’ assessments of the extent to which key effect and overall
findings resemble the original results (Columns CR and CQ).
Meta-analysis of all original study effects, and of all replication study effects.
Two random-effects meta-analyses were run (on studies in set MA) using REML estimation for
estimating the amount of heterogeneity, one on effect sizes of original and one on effect sizes of
replication studies. We ran four models; one without any predictor, one with discipline as
predictor, one with studies’ standard error as predictor, and one with standard error and
discipline as predictor. Discipline is a categorical variable with categories JPSP-social (=
reference category), JEP:LMC-cognitive, PSCI-social, and PSCI-cognitive. Standard error was
added to examine small-study effects. A positive effect of standard error on effect size indicates
that studies’ effect sizes are positively associated with their sample sizes. The results of this
one-tailed test, also known as Egger’s test, is often used as test of publication bias. However, a
positive effect of standard error on effect size may also indicate the use of power analysis or
using larger sample sizes in fields where smaller effect sizes are observed.
See Appendix [A7] for details. The meta-analysis on all original study effect sizes showed
significant (Q(72) = 302.67, P < 0.001) and large heterogeneity (�̂�=.19, I2 = 73.3%), with
average effect size equal to .42 (z = 14.74, P < 0.001). The average effect size differed across
disciplines (QM(3) = 14.70, P = 0.0021), with effect size in JPSP (.29) being significantly smaller
than in JEP:LMC (.52; z = 3.17, P = 0.0015) and PSCI-Cog (.57; z = 3.11, P = 0.0019), but not
PSCI-Soc (.40; z = 1.575, P = 0.12). The effect of the original studies’ standard error on effect
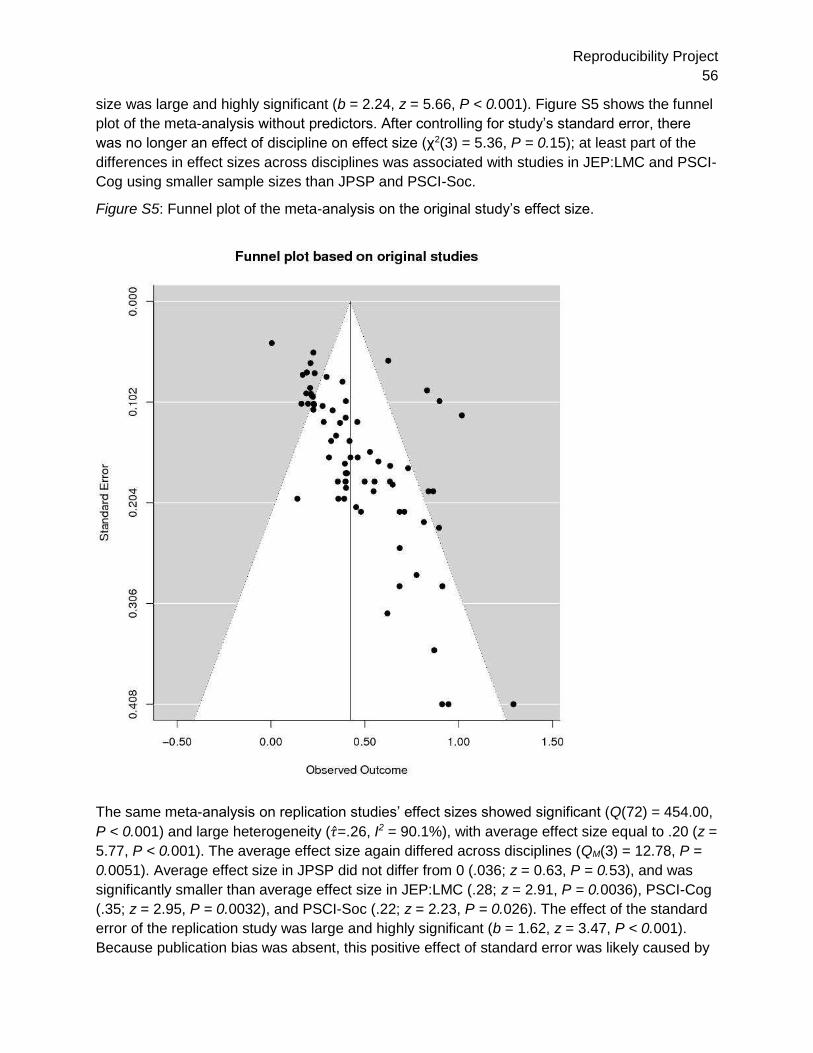
Reproducibility Project
56
size was large and highly significant (b = 2.24, z = 5.66, P < 0.001). Figure S5 shows the funnel
plot of the meta-analysis without predictors. After controlling for study’s standard error, there
was no longer an effect of discipline on effect size (χ2(3) = 5.36, P = 0.15); at least part of the
differences in effect sizes across disciplines was associated with studies in JEP:LMC and PSCI-
Cog using smaller sample sizes than JPSP and PSCI-Soc.
Figure S5: Funnel plot of the meta-analysis on the original study’s effect size.
The same meta-analysis on replication studies’ effect sizes showed significant (Q(72) = 454.00,
P < 0.001) and large heterogeneity (�̂�=.26, I2 = 90.1%), with average effect size equal to .20 (z =
5.77, P < 0.001). The average effect size again differed across disciplines (QM(3) = 12.78, P =
0.0051). Average effect size in JPSP did not differ from 0 (.036; z = 0.63, P = 0.53), and was
significantly smaller than average effect size in JEP:LMC (.28; z = 2.91, P = 0.0036), PSCI-Cog
(.35; z = 2.95, P = 0.0032), and PSCI-Soc (.22; z = 2.23, P = 0.026). The effect of the standard
error of the replication study was large and highly significant (b = 1.62, z = 3.47, P < 0.001).
Because publication bias was absent, this positive effect of standard error was likely caused by

Reproducibility Project
57
using power analysis for replication studies, i.e., generally larger replication samples were used
for smaller true effects. Figure S6 shows the corresponding funnel plot. The effect of discipline
did not remain statistically significant after controlling for the standard error of the replication
study (χ2(3) = 6.488, P = 0.090); similar to the results of original studies, at least part of the
differences in effect sizes across disciplines was associated with studies in JEP:LMC and PSCI-
Cog using smaller sample sizes than JPSP and PSCI-Soc.
Figure S6: Funnel plot of the meta-analysis on the replication study’s effect size.
Meta-analysis of difference of effect size between original and replication study
The dependent variable was the difference of Fisher-transformed correlations (original –
replication), with variance equal to the sum of variances of the correlation of the original and of
the replication study. Several random-effect meta-analyses were run using REML estimation for
estimating the amount of heterogeneity in metafor. First, the intercept-only model was
estimated; the intercept denotes the average difference effect size between original and
replication study. Second, to test for small study effects, we added the standard error of the
Reproducibility Project
58
original study as a predictor, akin to Egger’s test; a positive effect is often interpreted as
evidence for publication bias. Our third model tested the effect of discipline.
The null-model without predictors yielded an average estimated difference in effect size equal to
.21 (z = 7.55, P < 0.001) in favor of the original study. The null-hypothesis of homogeneous
difference in effect sizes was rejected (Q(72) = 152.39, P < 0.001), with medium observed
heterogeneity (�̂�=.149, I2 = 47.8%). Via Egger’s test, precision of the original study was
associated with the difference in effect size (b = 0.85, z = 1.88, one-tailed P = 0.030), hence
imprecise original studies (large standard error) yielded larger differences in effect size between
original and replication study. This is confirmed by the funnel plot in Figure S7. Discipline was
not associated with the difference in effect size, χ2(3) = 2.451, P = 0.48, (i.e., the average
difference in effect size was equal for JPSP, JEP:LMC, PSCI-soc, and PSCI-cog). Also, after
controlling for the effect of the standard error of the original study, no differences between
disciplines were observed (𝜒2(3) = 2.807, P = 0.42). No moderating effects were observed for:
importance of the effect (b = -.010, P = 0.77), surprising effect (b = 0.001, P = 0.97), experience
and expertise of original team (b = -.0017, P = 0.96), challenge of conducting replication (b =
0.026, P = 0.45), and self-assessed quality of replication (b = -.037, P = 0.51). However, a
positive effect of experience and expertise of replication team was observed (b = 0.13, P =
0.0063), meaning that the difference between original and replication effect size was higher for
replication teams with more experience and expertise.
The results from the three meta-analyses tentatively suggest that the journals/disciplines are
similarly influenced by publication bias leading to overestimated effect sizes, and that cognitive
effects are larger than social effects on average -- possibly because of the target of study or the
sensitivity of the research designs (e.g., within-subject designs reducing error and increasing
sensitivity).
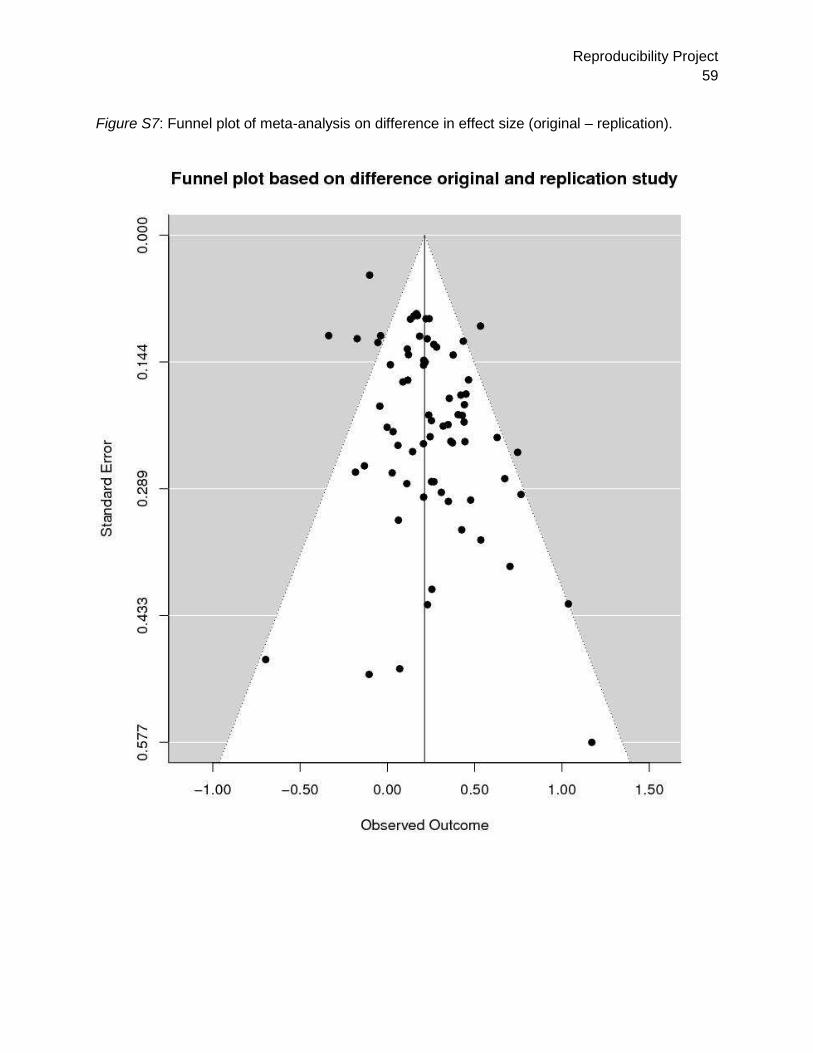
Reproducibility Project
59
Figure S7: Funnel plot of meta-analysis on difference in effect size (original – replication).

Reproducibility Project
60
Moderator Analyses
The main text reports correlations between five reproducibility indicators and aggregate
variables of original and replication study characteristics. Below are correlations among the five
reproducibility indicators (Table S3), correlations of individual characteristics of original studies
with reproducibility indicators (Table S4), and correlations of individual characteristics of
replication studies with reproducibility indicators (Table S5).
Table S2. Spearman’s rank order correlations among reproducibility indicators
Replications
P < 0.05 in
original
direction
Effect Size
Difference
Meta-analytic
Estimate
original
effect size
within
replication
95% CI
subjective
"yes" to "Did
it replicate?"
Replications P < 0.05 in
original direction .
Effect Size Difference -0.619 .
Meta-analytic Estimate 0.592 -0.218 .
original effect size within
replication 95% CI 0.551 -0.498 0.515 .
subjective "yes" to "Did it
replicate?" 0.956 -0.577 0.565 0.606 .
Notes: Effect size difference (original - replication) computed after converting r's to Fisher's z. Notes:
Four original results had P values slightly higher than .05, but were considered positive results in the
original article and are treated that way here. Exclusions (see SI [A3] for explanation): "replications P <
0.05" (3 excluded; n = 97), "effect size difference" (3 excluded; n = 97); "meta-analytic mean estimates"
(27 excluded; n = 73); and, "% original effect size within replication 95% CI" (5 excluded, n=95).
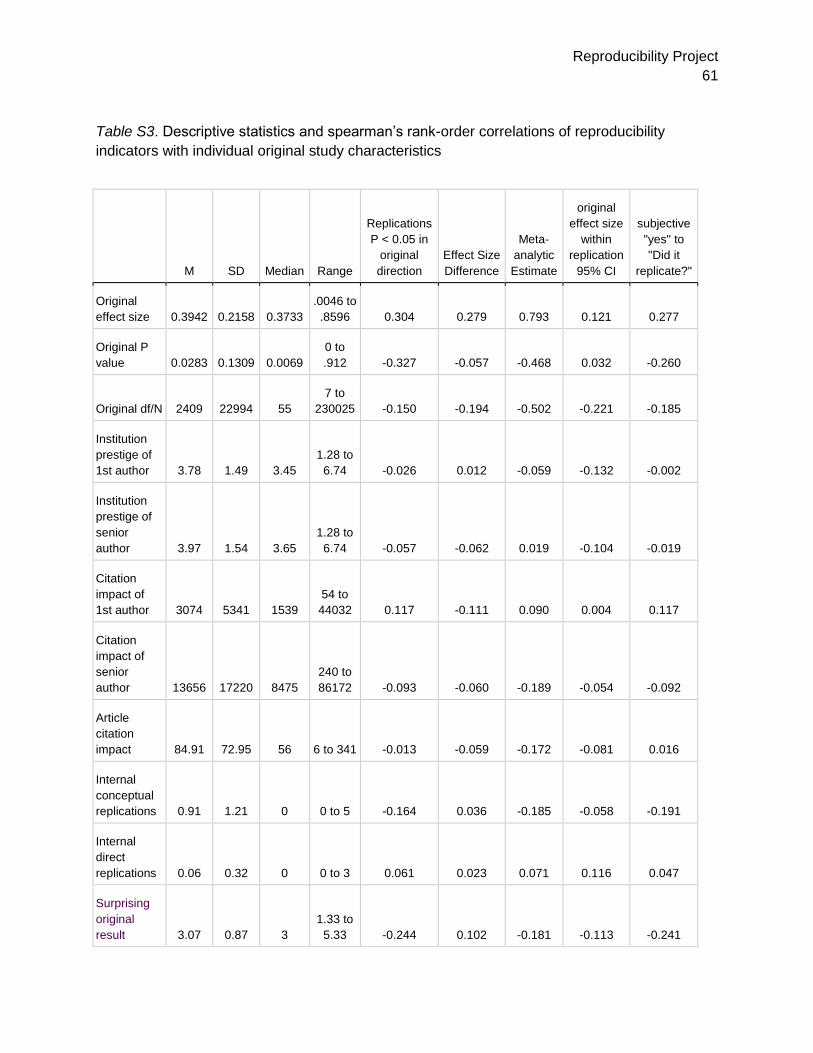
Reproducibility Project
61
Table S3. Descriptive statistics and spearman’s rank-order correlations of reproducibility
indicators with individual original study characteristics
M SD Median Range
Replications
P < 0.05 in
original
direction Effect Size
Difference
Meta-
analytic
Estimate
original
effect size
within
replication
95% CI
subjective
"yes" to
"Did it
replicate?"
Original
effect size 0.3942 0.2158 0.3733 .0046 to
.8596 0.304 0.279 0.793 0.121 0.277
Original P
value 0.0283 0.1309 0.0069 0 to
.912 -0.327 -0.057 -0.468 0.032 -0.260
Original df/N 2409 22994 55 7 to
230025 -0.150 -0.194 -0.502 -0.221 -0.185
Institution
prestige of
1st author 3.78 1.49 3.45 1.28 to
6.74 -0.026 0.012 -0.059 -0.132 -0.002
Institution
prestige of
senior
author 3.97 1.54 3.65 1.28 to
6.74 -0.057 -0.062 0.019 -0.104 -0.019
Citation
impact of
1st author 3074 5341 1539 54 to
44032 0.117 -0.111 0.090 0.004 0.117
Citation
impact of
senior
author 13656 17220 8475 240 to
86172 -0.093 -0.060 -0.189 -0.054 -0.092
Article
citation
impact 84.91 72.95 56 6 to 341 -0.013 -0.059 -0.172 -0.081 0.016
Internal
conceptual
replications 0.91 1.21 0 0 to 5 -0.164 0.036 -0.185 -0.058 -0.191
Internal
direct
replications 0.06 0.32 0 0 to 3 0.061 0.023 0.071 0.116 0.047
Surprising
original
result 3.07 0.87 3 1.33 to
5.33 -0.244 0.102 -0.181 -0.113 -0.241

Reproducibility Project
62
Importance
of original
result 3.36 0.71 3.28 1 to
5.33 -0.105 0.038 -0.205 -0.133 -0.074
Notes: Effect size difference computed after converting r's to Fisher's z. df/N refers to the
information on which the test of the effect was based (e.g., df of t-test, denominator df of F-test,
sample size - 3 of correlation, and sample size for z and chi2). Four original results had P
values slightly higher than .05, but were considered positive results in the original article and are
treated that way here. Exclusions (see SI [A3] for explanation): "replications P < 0.05" (3 original
nulls excluded; n = 97), "effect size difference" (3 excluded; n = 97); "meta-analytic mean
estimates" (27 excluded; n = 73); and, "% original effect size within replication 95% CI" (5
excluded, n=95).
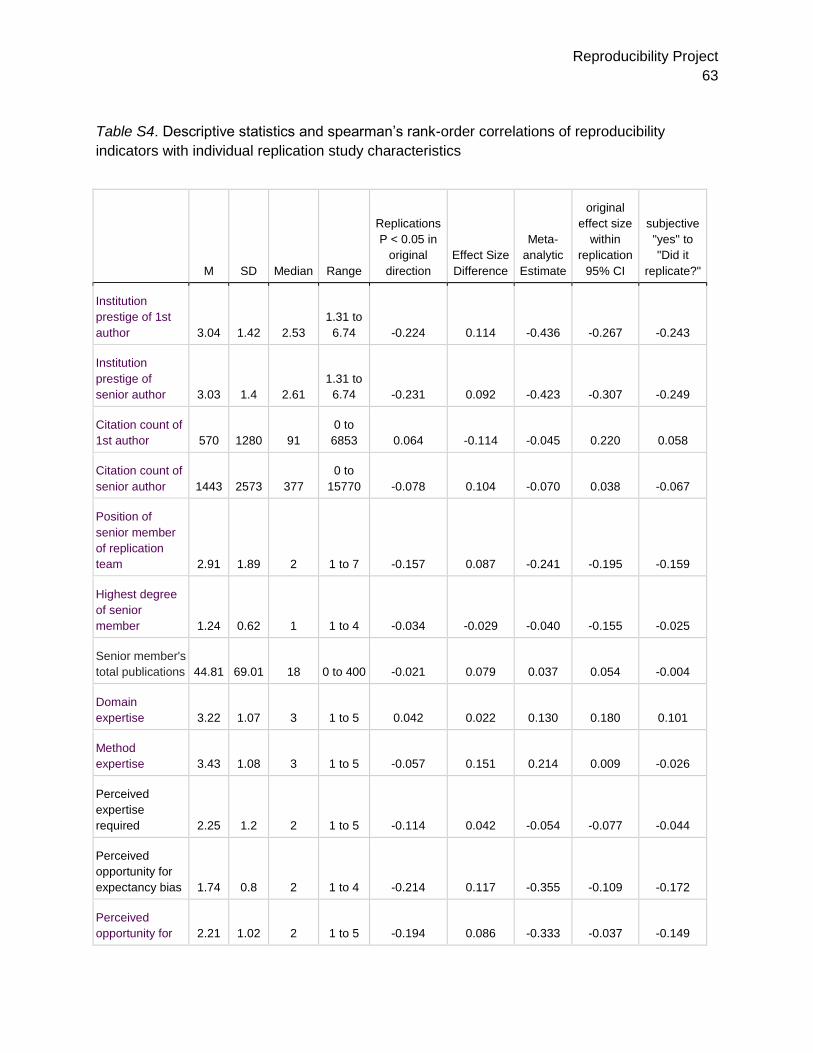
Reproducibility Project
63
Table S4. Descriptive statistics and spearman’s rank-order correlations of reproducibility
indicators with individual replication study characteristics
M SD Median Range
Replications
P < 0.05 in
original
direction Effect Size
Difference
Meta-
analytic
Estimate
original
effect size
within
replication
95% CI
subjective
"yes" to
"Did it
replicate?"
Institution
prestige of 1st
author 3.04 1.42 2.53 1.31 to
6.74 -0.224 0.114 -0.436 -0.267 -0.243
Institution
prestige of
senior author 3.03 1.4 2.61 1.31 to
6.74 -0.231 0.092 -0.423 -0.307 -0.249
Citation count of
1st author 570 1280 91 0 to
6853 0.064 -0.114 -0.045 0.220 0.058
Citation count of
senior author 1443 2573 377 0 to
15770 -0.078 0.104 -0.070 0.038 -0.067
Position of
senior member
of replication
team 2.91 1.89 2 1 to 7 -0.157 0.087 -0.241 -0.195 -0.159
Highest degree
of senior
member 1.24 0.62 1 1 to 4 -0.034 -0.029 -0.040 -0.155 -0.025
Senior member's
total publications 44.81 69.01 18 0 to 400 -0.021 0.079 0.037 0.054 -0.004
Domain
expertise 3.22 1.07 3 1 to 5 0.042 0.022 0.130 0.180 0.101
Method
expertise 3.43 1.08 3 1 to 5 -0.057 0.151 0.214 0.009 -0.026
Perceived
expertise
required 2.25 1.2 2 1 to 5 -0.114 0.042 -0.054 -0.077 -0.044
Perceived
opportunity for
expectancy bias 1.74 0.8 2 1 to 4 -0.214 0.117 -0.355 -0.109 -0.172
Perceived
opportunity for 2.21 1.02 2 1 to 5 -0.194 0.086 -0.333 -0.037 -0.149
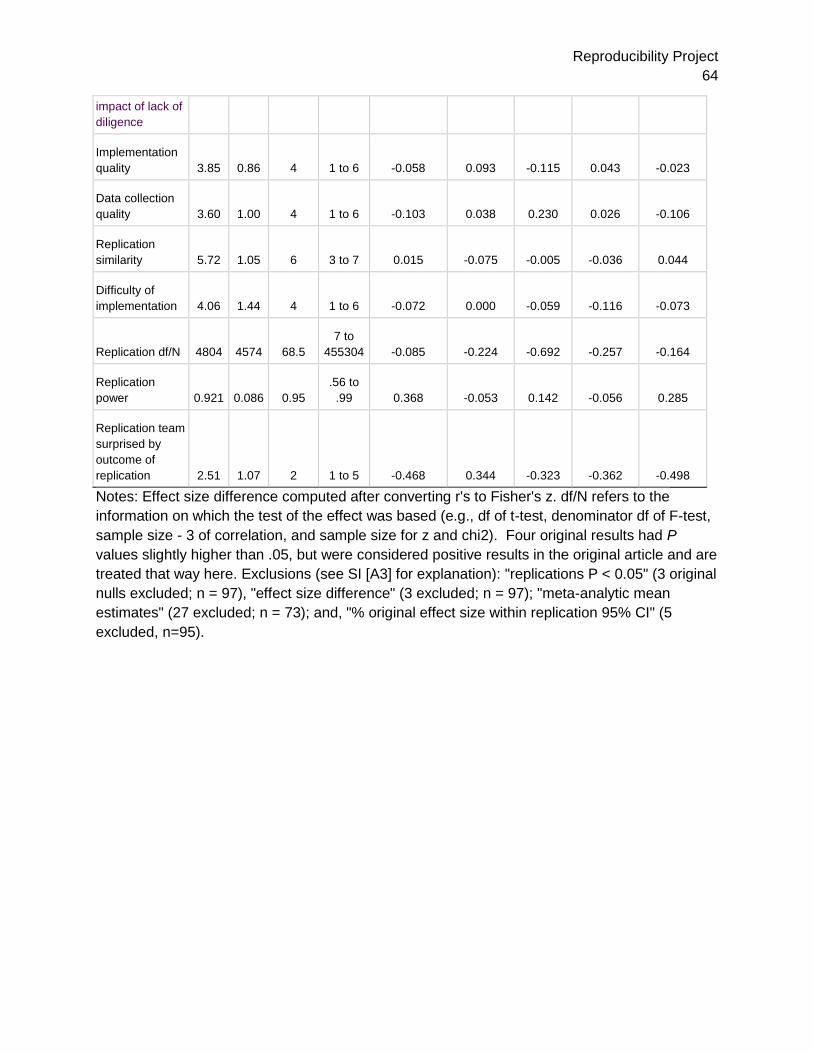
Reproducibility Project
64
impact of lack of
diligence
Implementation
quality 3.85 0.86 4 1 to 6 -0.058 0.093 -0.115 0.043 -0.023
Data collection
quality 3.60 1.00 4 1 to 6 -0.103 0.038 0.230 0.026 -0.106
Replication
similarity 5.72 1.05 6 3 to 7 0.015 -0.075 -0.005 -0.036 0.044
Difficulty of
implementation 4.06 1.44 4 1 to 6 -0.072 0.000 -0.059 -0.116 -0.073
Replication df/N 4804 4574 68.5 7 to
455304 -0.085 -0.224 -0.692 -0.257 -0.164
Replication
power 0.921 0.086 0.95 .56 to
.99 0.368 -0.053 0.142 -0.056 0.285
Replication team
surprised by
outcome of
replication 2.51 1.07 2 1 to 5 -0.468 0.344 -0.323 -0.362 -0.498
Notes: Effect size difference computed after converting r's to Fisher's z. df/N refers to the
information on which the test of the effect was based (e.g., df of t-test, denominator df of F-test,
sample size - 3 of correlation, and sample size for z and chi2). Four original results had P
values slightly higher than .05, but were considered positive results in the original article and are
treated that way here. Exclusions (see SI [A3] for explanation): "replications P < 0.05" (3 original
nulls excluded; n = 97), "effect size difference" (3 excluded; n = 97); "meta-analytic mean
estimates" (27 excluded; n = 73); and, "% original effect size within replication 95% CI" (5
excluded, n=95).
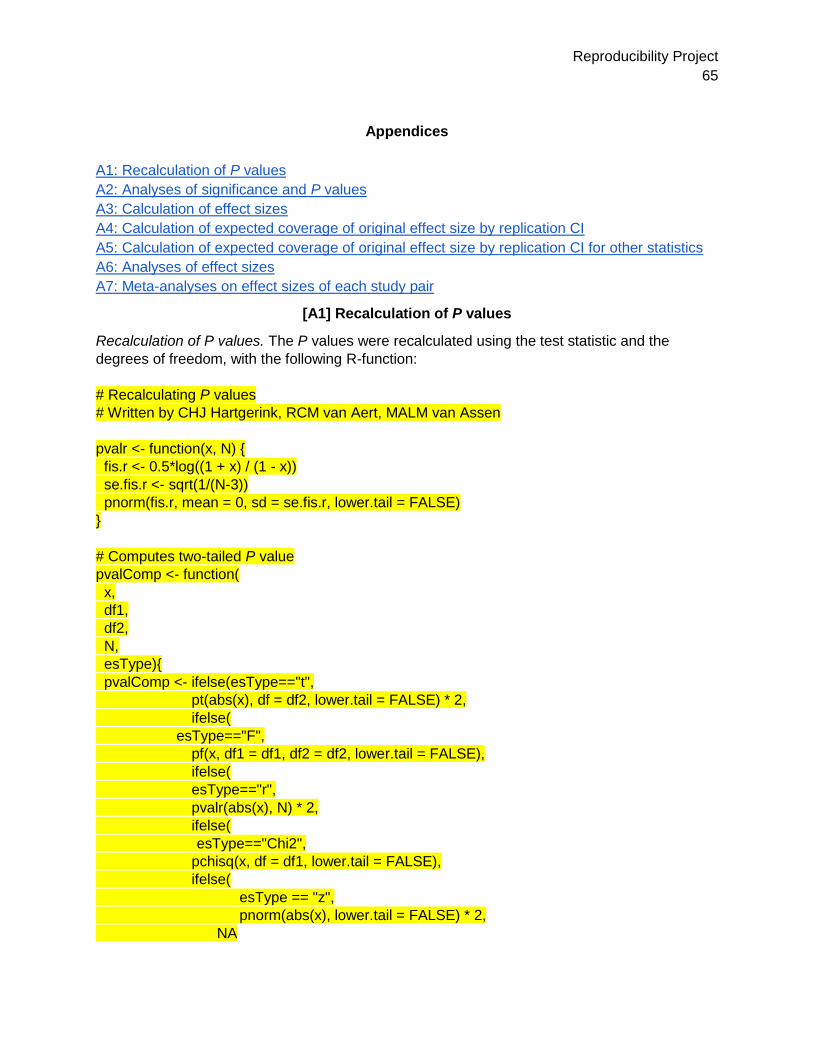
Reproducibility Project
65
Appendices
A1: Recalculation of P values
A2: Analyses of significance and P values
A3: Calculation of effect sizes
A4: Calculation of expected coverage of original effect size by replication CI
A5: Calculation of expected coverage of original effect size by replication CI for other statistics
A6: Analyses of effect sizes
A7: Meta-analyses on effect sizes of each study pair
[A1] Recalculation of P values
Recalculation of P values. The P values were recalculated using the test statistic and the
degrees of freedom, with the following R-function:
# Recalculating P values
# Written by CHJ Hartgerink, RCM van Aert, MALM van Assen
pvalr <- function(x, N) {
fis.r <- 0.5*log((1 + x) / (1 - x))
se.fis.r <- sqrt(1/(N-3))
pnorm(fis.r, mean = 0, sd = se.fis.r, lower.tail = FALSE)
}
# Computes two-tailed P value
pvalComp <- function(
x,
df1,
df2,
N,
esType){
pvalComp <- ifelse(esType=="t",
pt(abs(x), df = df2, lower.tail = FALSE) * 2,
ifelse(
esType=="F",
pf(x, df1 = df1, df2 = df2, lower.tail = FALSE),
ifelse(
esType=="r",
pvalr(abs(x), N) * 2,
ifelse(
esType=="Chi2",
pchisq(x, df = df1, lower.tail = FALSE),
ifelse(
esType == "z",
pnorm(abs(x), lower.tail = FALSE) * 2,
NA
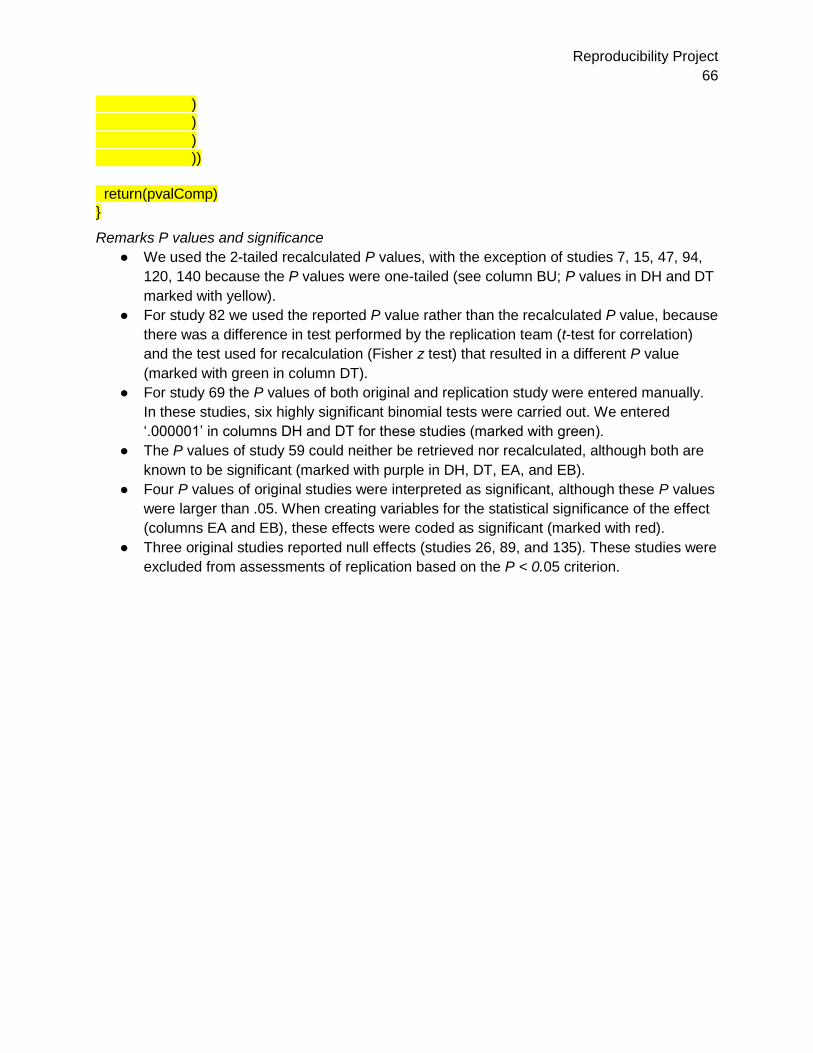
Reproducibility Project
66
)
)
)
))
return(pvalComp)
}
Remarks P values and significance
● We used the 2-tailed recalculated P values, with the exception of studies 7, 15, 47, 94,
120, 140 because the P values were one-tailed (see column BU; P values in DH and DT
marked with yellow).
● For study 82 we used the reported P value rather than the recalculated P value, because
there was a difference in test performed by the replication team (t-test for correlation)
and the test used for recalculation (Fisher z test) that resulted in a different P value
(marked with green in column DT).
● For study 69 the P values of both original and replication study were entered manually.
In these studies, six highly significant binomial tests were carried out. We entered
‘.000001’ in columns DH and DT for these studies (marked with green).
● The P values of study 59 could neither be retrieved nor recalculated, although both are
known to be significant (marked with purple in DH, DT, EA, and EB).
● Four P values of original studies were interpreted as significant, although these P values
were larger than .05. When creating variables for the statistical significance of the effect
(columns EA and EB), these effects were coded as significant (marked with red).
● Three original studies reported null effects (studies 26, 89, and 135). These studies were
excluded from assessments of replication based on the P < 0.05 criterion.
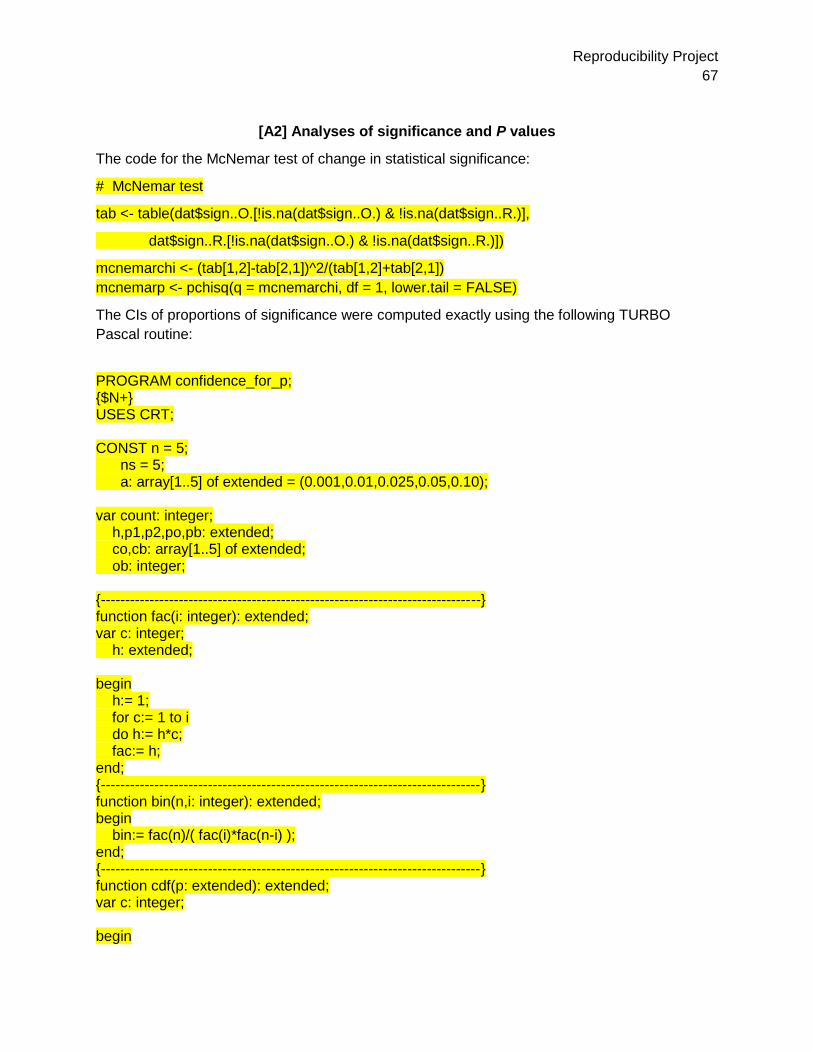
Reproducibility Project
67
[A2] Analyses of significance and P values
The code for the McNemar test of change in statistical significance:
# McNemar test
tab <- table(dat$sign..O.[!is.na(dat$sign..O.) & !is.na(dat$sign..R.)],
dat$sign..R.[!is.na(dat$sign..O.) & !is.na(dat$sign..R.)])
mcnemarchi <- (tab[1,2]-tab[2,1])^2/(tab[1,2]+tab[2,1])
mcnemarp <- pchisq(q = mcnemarchi, df = 1, lower.tail = FALSE)
The CIs of proportions of significance were computed exactly using the following TURBO
Pascal routine:
PROGRAM confidence_for_p; {$N+} USES CRT; CONST n = 5; ns = 5; a: array[1..5] of extended = (0.001,0.01,0.025,0.05,0.10); var count: integer; h,p1,p2,po,pb: extended; co,cb: array[1..5] of extended; ob: integer; {------------------------------------------------------------------------------} function fac(i: integer): extended; var c: integer; h: extended; begin h:= 1; for c:= 1 to i do h:= h*c; fac:= h; end; {------------------------------------------------------------------------------} function bin(n,i: integer): extended; begin bin:= fac(n)/( fac(i)*fac(n-i) ); end; {------------------------------------------------------------------------------} function cdf(p: extended): extended; var c: integer; begin
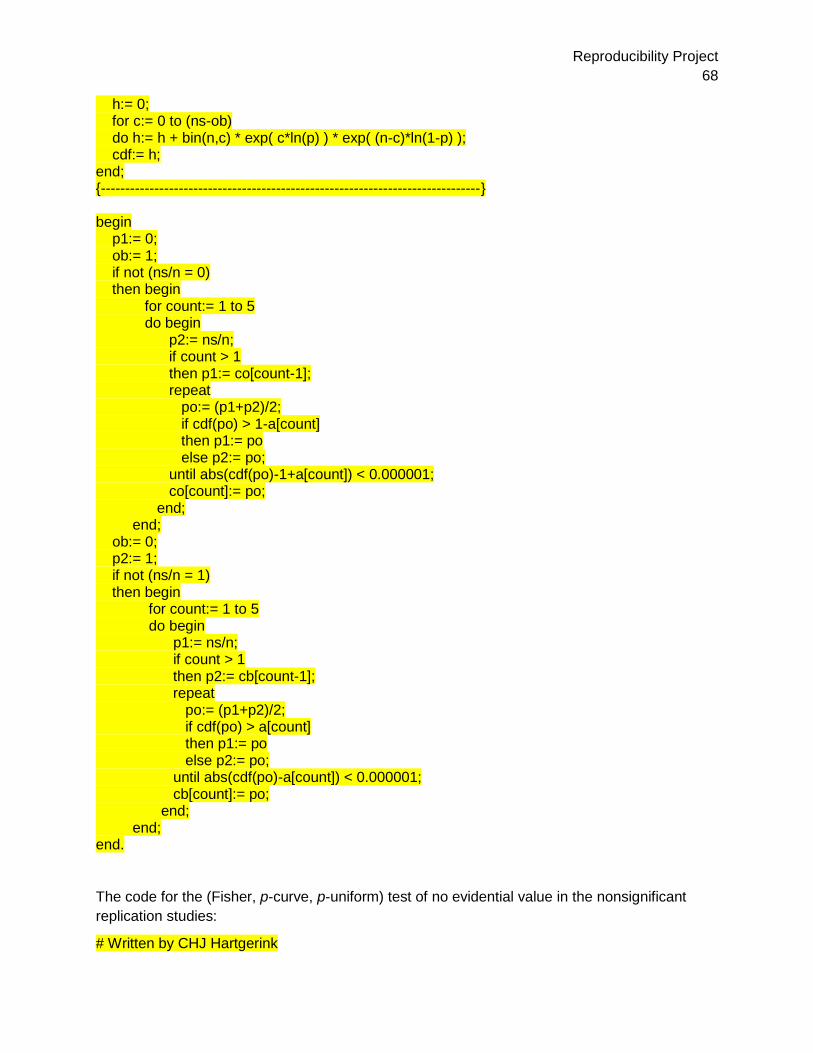
Reproducibility Project
68
h:= 0; for c:= 0 to (ns-ob) do h:= h + bin(n,c) * exp( c*ln(p) ) * exp( (n-c)*ln(1-p) ); cdf:= h; end; {------------------------------------------------------------------------------} begin p1:= 0; ob:= 1; if not (ns/n = 0) then begin for count:= 1 to 5 do begin p2:= ns/n; if count > 1 then p1:= co[count-1]; repeat po:= (p1+p2)/2; if cdf(po) > 1-a[count] then p1:= po else p2:= po; until abs(cdf(po)-1+a[count]) < 0.000001; co[count]:= po; end; end; ob:= 0; p2:= 1; if not (ns/n = 1) then begin for count:= 1 to 5 do begin p1:= ns/n; if count > 1 then p2:= cb[count-1]; repeat po:= (p1+p2)/2; if cdf(po) > a[count] then p1:= po else p2:= po; until abs(cdf(po)-a[count]) < 0.000001; cb[count]:= po; end; end; end.
The code for the (Fisher, p-curve, p-uniform) test of no evidential value in the nonsignificant
replication studies:
# Written by CHJ Hartgerink
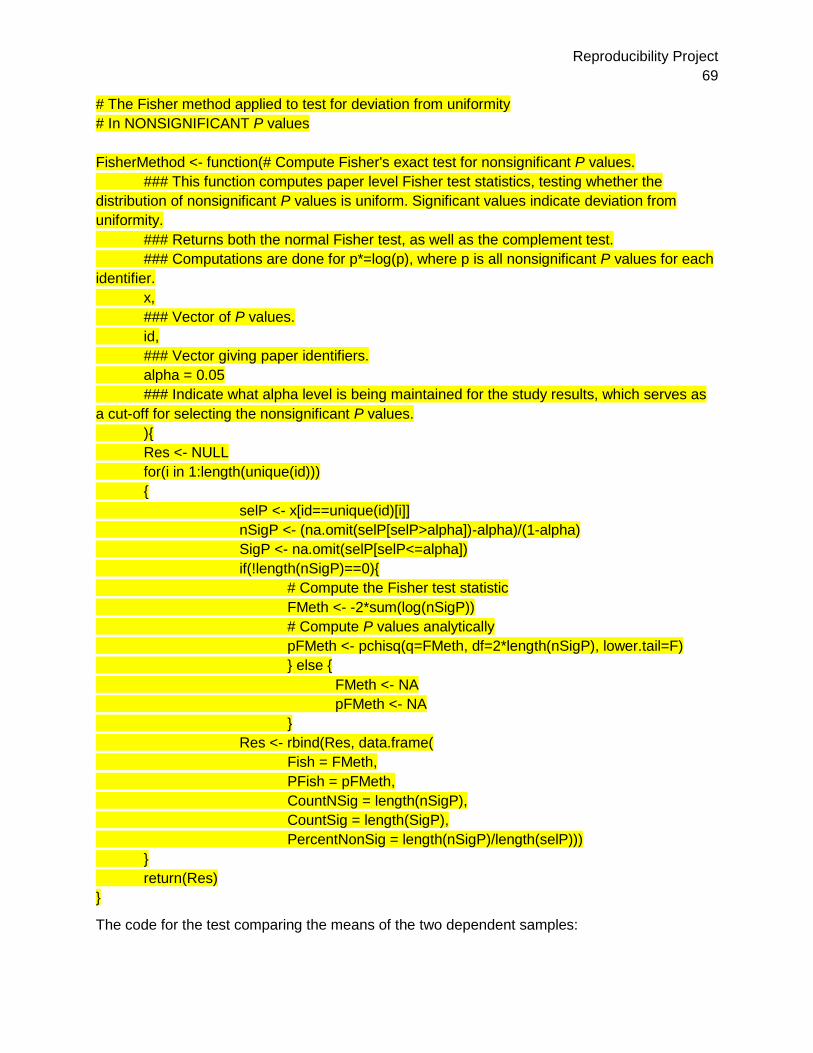
Reproducibility Project
69
# The Fisher method applied to test for deviation from uniformity
# In NONSIGNIFICANT P values
FisherMethod <- function(# Compute Fisher's exact test for nonsignificant P values.
### This function computes paper level Fisher test statistics, testing whether the
distribution of nonsignificant P values is uniform. Significant values indicate deviation from
uniformity.
### Returns both the normal Fisher test, as well as the complement test.
### Computations are done for p*=log(p), where p is all nonsignificant P values for each
identifier.
x,
### Vector of P values.
id,
### Vector giving paper identifiers.
alpha = 0.05
### Indicate what alpha level is being maintained for the study results, which serves as
a cut-off for selecting the nonsignificant P values.
){
Res <- NULL
for(i in 1:length(unique(id)))
{
selP <- x[id==unique(id)[i]]
nSigP <- (na.omit(selP[selP>alpha])-alpha)/(1-alpha)
SigP <- na.omit(selP[selP<=alpha])
if(!length(nSigP)==0){
# Compute the Fisher test statistic
FMeth <- -2*sum(log(nSigP))
# Compute P values analytically
pFMeth <- pchisq(q=FMeth, df=2*length(nSigP), lower.tail=F)
} else {
FMeth <- NA
pFMeth <- NA
}
Res <- rbind(Res, data.frame(
Fish = FMeth,
PFish = pFMeth,
CountNSig = length(nSigP),
CountSig = length(SigP),
PercentNonSig = length(nSigP)/length(selP)))
}
return(Res)
}
The code for the test comparing the means of the two dependent samples:
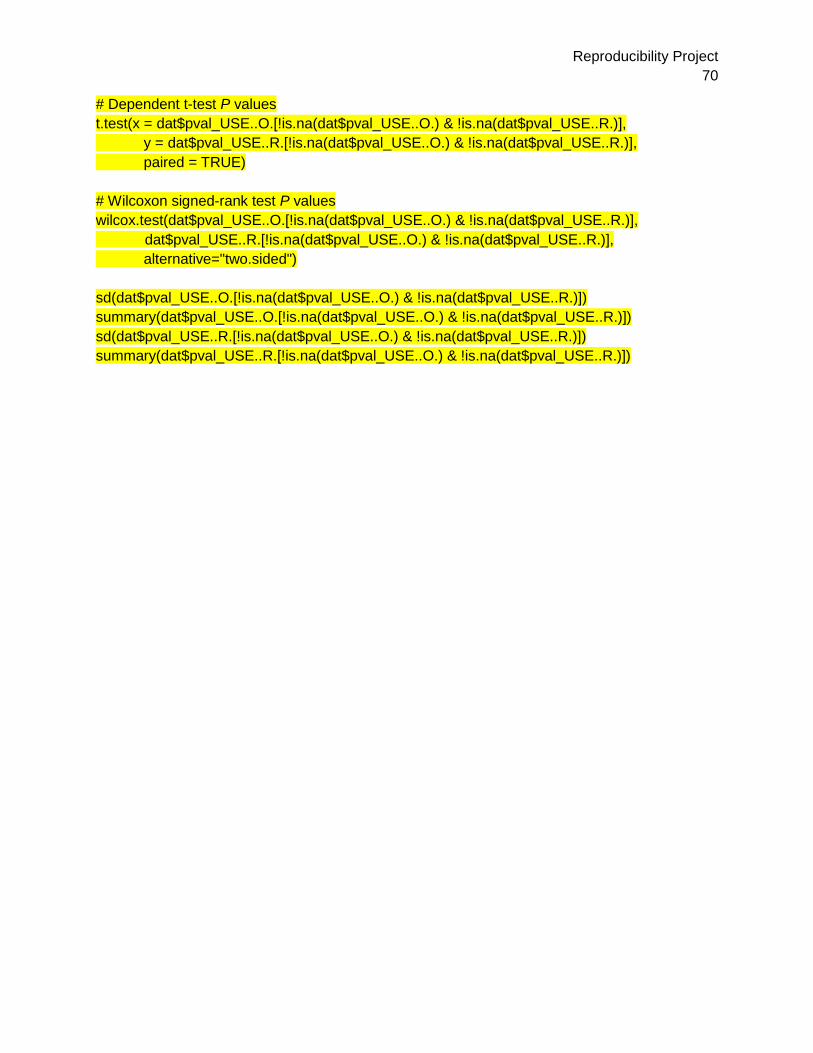
Reproducibility Project
70
# Dependent t-test P values
t.test(x = dat$pval_USE..O.[!is.na(dat$pval_USE..O.) & !is.na(dat$pval_USE..R.)],
y = dat$pval_USE..R.[!is.na(dat$pval_USE..O.) & !is.na(dat$pval_USE..R.)],
paired = TRUE)
# Wilcoxon signed-rank test P values
wilcox.test(dat$pval_USE..O.[!is.na(dat$pval_USE..O.) & !is.na(dat$pval_USE..R.)],
dat$pval_USE..R.[!is.na(dat$pval_USE..O.) & !is.na(dat$pval_USE..R.)],
alternative="two.sided")
sd(dat$pval_USE..O.[!is.na(dat$pval_USE..O.) & !is.na(dat$pval_USE..R.)])
summary(dat$pval_USE..O.[!is.na(dat$pval_USE..O.) & !is.na(dat$pval_USE..R.)])
sd(dat$pval_USE..R.[!is.na(dat$pval_USE..O.) & !is.na(dat$pval_USE..R.)])
summary(dat$pval_USE..R.[!is.na(dat$pval_USE..O.) & !is.na(dat$pval_USE..R.)])

Reproducibility Project
71
[A3] Calculation of effect sizes
Whenever possible, we calculated the “correlation coefficient per df” as effect size measure
based on the reported test statistics. This was possible for the z, χ2, t, and F statistic. The code
for the calculation is:
esComp <- function( x, df1, df2, N, esType){ esComp <- ifelse(esType=="t", sqrt((x^2*(1 / df2)) / (((x^2*1) / df2) + 1)), ifelse( esType=="F", sqrt((x*(df1 / df2)) / (((x*df1) / df2) + 1))*sqrt(1/df1), ifelse( esType=="r", x, ifelse( esType=="Chi2", sqrt(x/N), ifelse( esType == "z", tanh(x * sqrt(1/(N-3))), NA ) ) ) )) return(esComp)
The z statistic is transformed into a correlation using sample size N with ,
with rf the Fisher-transformed correlation. The χ2 is transformed into the or correlation coefficient
with . The t and F statistic are transformed into a “correlation per df” using
, where F= t2. The expression in the first square-root equals the
proportion of variance explained by the df1 predictors of the variance not yet explained by these
same predictors. To take into account that more predictors can explain more variance, we
divided this number by df1 to obtain the “explained variance by predictor”. Taking the square
root gives the correlation, or more precisely, it gives the correlation of each predictor assuming
that all df1 predictors contribute equally to the explained variance of the dependent variable.
The correlation effect sizes can be found in columns DJ and DV of the master data file.
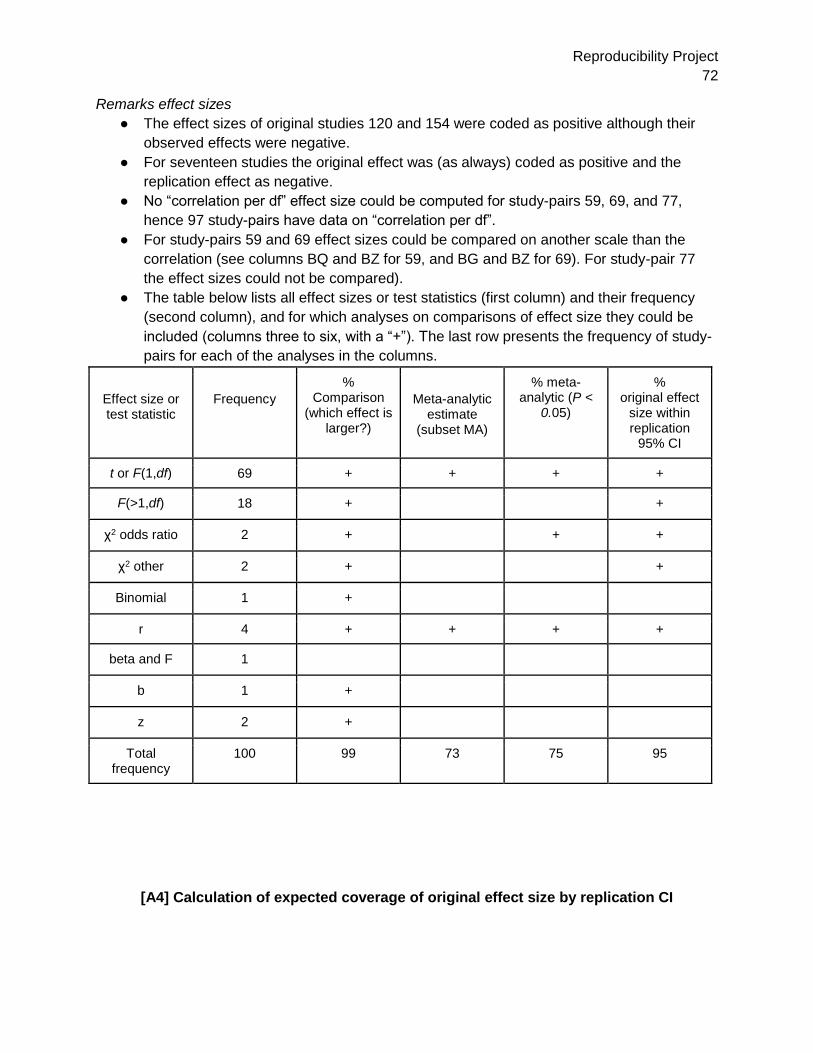
Reproducibility Project
72
Remarks effect sizes
● The effect sizes of original studies 120 and 154 were coded as positive although their
observed effects were negative.
● For seventeen studies the original effect was (as always) coded as positive and the
replication effect as negative.
● No “correlation per df” effect size could be computed for study-pairs 59, 69, and 77,
hence 97 study-pairs have data on “correlation per df”.
● For study-pairs 59 and 69 effect sizes could be compared on another scale than the
correlation (see columns BQ and BZ for 59, and BG and BZ for 69). For study-pair 77
the effect sizes could not be compared).
● The table below lists all effect sizes or test statistics (first column) and their frequency
(second column), and for which analyses on comparisons of effect size they could be
included (columns three to six, with a “+”). The last row presents the frequency of study-
pairs for each of the analyses in the columns.
Effect size or test statistic
Frequency
% Comparison
(which effect is larger?)
Meta-analytic
estimate (subset MA)
% meta-analytic (P <
0.05)
% original effect
size within replication
95% CI
t or F(1,df) 69 + + + +
F(>1,df) 18 + +
χ2 odds ratio 2 + + +
χ2 other 2 + +
Binomial 1 +
r 4 + + + +
beta and F 1
b 1 +
z 2 +
Total frequency
100 99 73 75 95
[A4] Calculation of expected coverage of original effect size by replication CI
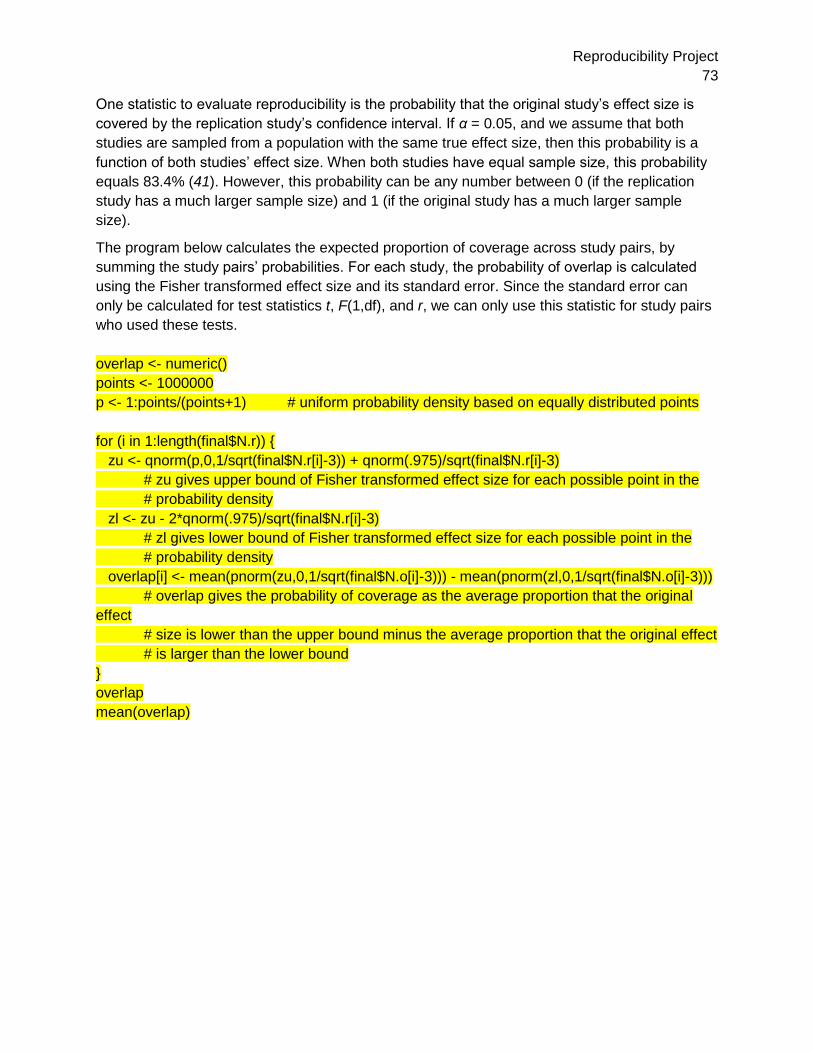
Reproducibility Project
73
One statistic to evaluate reproducibility is the probability that the original study’s effect size is
covered by the replication study’s confidence interval. If α = 0.05, and we assume that both
studies are sampled from a population with the same true effect size, then this probability is a
function of both studies’ effect size. When both studies have equal sample size, this probability
equals 83.4% (41). However, this probability can be any number between 0 (if the replication
study has a much larger sample size) and 1 (if the original study has a much larger sample
size).
The program below calculates the expected proportion of coverage across study pairs, by
summing the study pairs’ probabilities. For each study, the probability of overlap is calculated
using the Fisher transformed effect size and its standard error. Since the standard error can
only be calculated for test statistics t, F(1,df), and r, we can only use this statistic for study pairs
who used these tests.
overlap <- numeric()
points <- 1000000
p <- 1:points/(points+1) # uniform probability density based on equally distributed points
for (i in 1:length(final$N.r)) {
zu <- qnorm(p,0,1/sqrt(final$N.r[i]-3)) + qnorm(.975)/sqrt(final$N.r[i]-3)
# zu gives upper bound of Fisher transformed effect size for each possible point in the
# probability density
zl <- zu - 2*qnorm(.975)/sqrt(final$N.r[i]-3)
# zl gives lower bound of Fisher transformed effect size for each possible point in the
# probability density
overlap[i] <- mean(pnorm(zu,0,1/sqrt(final$N.o[i]-3))) - mean(pnorm(zl,0,1/sqrt(final$N.o[i]-3)))
# overlap gives the probability of coverage as the average proportion that the original
effect
# size is lower than the upper bound minus the average proportion that the original effect
# is larger than the lower bound
}
overlap
mean(overlap)

Reproducibility Project
74
[A5] Calculation of expected coverage of original effect size by replication CI for other
statistics
Effect size statistics based on F(df1 > 1, df2) and χ2(df) can be converted to correlations (see
A3), but their standard errors cannot be computed. Hence, coverage, or the probability that the
original study’s effect size is covered by the replication study’s confidence interval, needs to be
computed in another way. For F statistics we first computed the 95% confidence interval of the
non-centrality parameter based on the observed F-statistic of the replication study. Then, we
estimated the non-centrality parameter of the original study using the fact that the expected
value of the F-statistic equals
.
Rewriting this expected value yields . Coverage then means that the CI
contains . See the code below.
Similarly, for χ2(df) statistics we checked if the CI of the non-centrality parameter of the
replication study contains the estimated non-centrality parameter of the original study. Using
the fact that the expected value of the non-central chi-square distribution equals df + , we
obtain = χ2(df) -1, which χ2(df) equal to the test statistic of the original study. The CI contains
, if the cumulative probability of the chi-square value of the replication study given is
between .025 and .975. See the code below.
tol <- 1e-7
xm <- 0
df1.or <- df2.or <- F.or <- df1.rep <- df2.rep <- F.rep <- 1:17
ncp.L <- ncp.U <- ncp.o <- in.ci <- 1:17
### study 12
df1.or[1] <- 2
df2.or[1] <- 92
F.or[1] <- 3.13
df1.rep[1] <- 2
df2.rep[1] <- 232
F.rep[1] <- 1.63
### study 13
df1.or[2] <- 2
df2.or[2] <- 68
F.or[2] <- 41.59
df1.rep[2] <- 2
df2.rep[2] <- 68

Reproducibility Project
75
F.rep[2] <- 41.603
### study 17
df1.or[3] <- 2
df2.or[3] <- 76
F.or[3] <- 8.67
df1.rep[3] <- 1.58
df2.rep[3] <- 72.4
F.rep[3] <- 19.48
### study 22
df1.or[4] <- 3
df2.or[4] <- 93
F.or[4] <- 5.23
df1.rep[4] <- 2.33
df2.rep[4] <- 90
F.rep[4] <- 0.38
### study 43
df1.or[5] <- 2
df2.or[5] <- 64
F.or[5] <- 10.17
df1.rep[5] <- 2
df2.rep[5] <- 72
F.rep[5] <- 1.97
### study 46
df1.or[6] <- 21
df2.or[6] <- 230025
F.or[6] <- 118.15
df1.rep[6] <- 21
df2.rep[6] <- 455304
F.rep[6] <- 261.93
### study 50
df1.or[7] <- 2
df2.or[7] <- 92
F.or[7] <- 4.36
df1.rep[7] <- 2
df2.rep[7] <- 103
F.rep[7] <- 2.601
### study 55
df1.or[8] <- 2

Reproducibility Project
76
df2.or[8] <- 54
F.or[8] <- 3.19
df1.rep[8] <- 2
df2.rep[8] <- 68
F.rep[8] <- 0.3
### study 64
df1.or[9] <- 2
df2.or[9] <- 76
F.or[9] <- 21.57
df1.rep[9] <- 2
df2.rep[9] <- 65
F.rep[9] <- 0.865
### study 80
df1.or[10] <- 2
df2.or[10] <- 43
F.or[10] <- 3.36
df1.rep[10] <- 2
df2.rep[10] <- 67
F.rep[10] <- 1.7
### study 86
df1.or[11] <- 2
df2.or[11] <- 82
F.or[11] <- 4.05
df1.rep[11] <- 2
df2.rep[11] <- 137
F.rep[11] <- 1.99
### study 117
df1.or[12] <- 18
df2.or[12] <- 660
F.or[12] <- 16.31
df1.rep[12] <- 18
df2.rep[12] <- 660
F.rep[12] <- 12.98
### study 132
df1.or[13] <- 3
df2.or[13] <- 69
F.or[13] <- 5.15
df1.rep[13] <- 1.48
df2.rep[13] <- 41.458

Reproducibility Project
77
F.rep[13] <- 1.401
### study 139
df1.or[14] <- 3
df2.or[14] <- 9
F.or[14] <- 8.5
df1.rep[14] <- 3
df2.rep[14] <- 12
F.rep[14] <- 13.06
### study 140
df1.or[15] <- 2
df2.or[15] <- 81
F.or[15] <- 4.97
df1.rep[15] <- 2
df2.rep[15] <- 122
F.rep[15] <- 0.24
### study 142
df1.or[16] <- 2
df2.or[16] <- 162
F.or[16] <- 192.89
df1.rep[16] <- 2
df2.rep[16] <- 174
F.rep[16] <- 252.83
### study 143
df1.or[17] <- 4
df2.or[17] <- 108
F.or[17] <- 3.67
df1.rep[17] <- 4
df2.rep[17] <- 150
F.rep[17] <- 0.58
### Added later, after reviews, before re-submitting to Science [July 16, 2015]
### study 25
df1.or[18] <- 3
df2.or[18] <- 48
F.or[18] <- 9.14
df1.rep[18] <- 3
df2.rep[18] <- 59
F.rep[18] <- 5.681
### loop
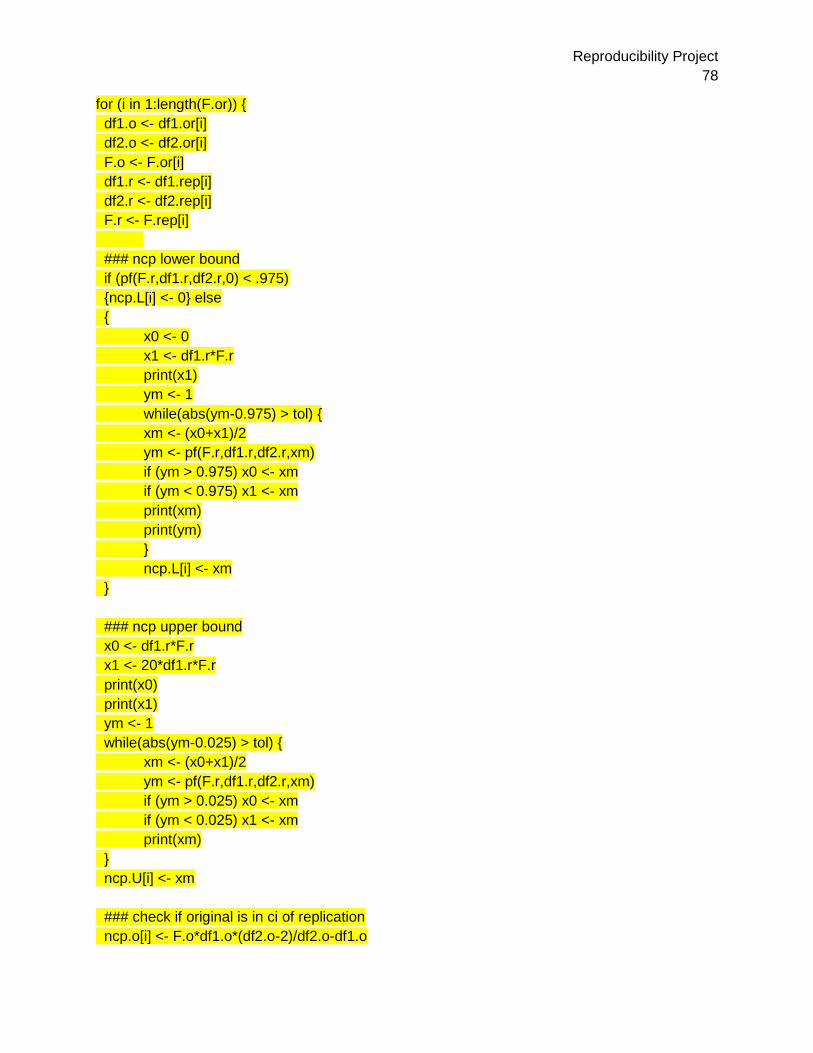
Reproducibility Project
78
for (i in 1:length(F.or)) {
df1.o <- df1.or[i]
df2.o <- df2.or[i]
F.o <- F.or[i]
df1.r <- df1.rep[i]
df2.r <- df2.rep[i]
F.r <- F.rep[i]
### ncp lower bound
if (pf(F.r,df1.r,df2.r,0) < .975)
{ncp.L[i] <- 0} else
{
x0 <- 0
x1 <- df1.r*F.r
print(x1)
ym <- 1
while(abs(ym-0.975) > tol) {
xm <- (x0+x1)/2
ym <- pf(F.r,df1.r,df2.r,xm)
if (ym > 0.975) x0 <- xm
if (ym < 0.975) x1 <- xm
print(xm)
print(ym)
}
ncp.L[i] <- xm
}
### ncp upper bound
x0 <- df1.r*F.r
x1 <- 20*df1.r*F.r
print(x0)
print(x1)
ym <- 1
while(abs(ym-0.025) > tol) {
xm <- (x0+x1)/2
ym <- pf(F.r,df1.r,df2.r,xm)
if (ym > 0.025) x0 <- xm
if (ym < 0.025) x1 <- xm
print(xm)
}
ncp.U[i] <- xm
### check if original is in ci of replication
ncp.o[i] <- F.o*df1.o*(df2.o-2)/df2.o-df1.o
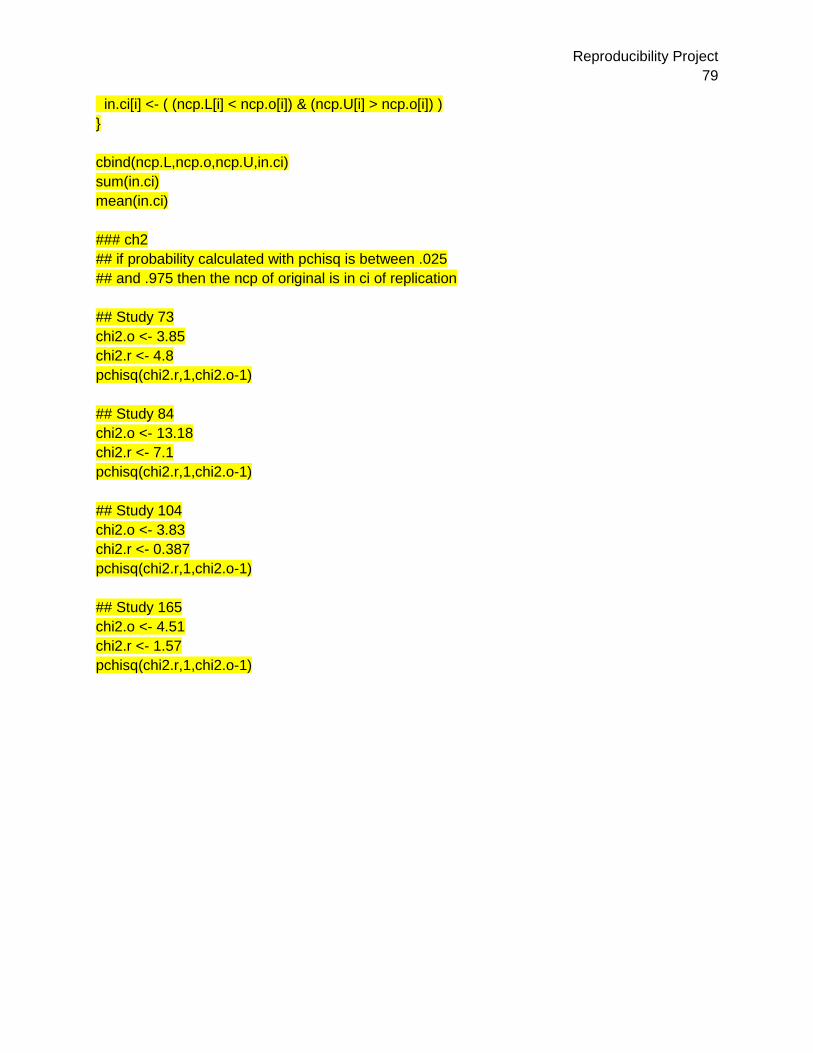
Reproducibility Project
79
in.ci[i] <- ( (ncp.L[i] < ncp.o[i]) & (ncp.U[i] > ncp.o[i]) )
}
cbind(ncp.L,ncp.o,ncp.U,in.ci)
sum(in.ci)
mean(in.ci)
### ch2
## if probability calculated with pchisq is between .025
## and .975 then the ncp of original is in ci of replication
## Study 73
chi2.o <- 3.85
chi2.r <- 4.8
pchisq(chi2.r,1,chi2.o-1)
## Study 84
chi2.o <- 13.18
chi2.r <- 7.1
pchisq(chi2.r,1,chi2.o-1)
## Study 104
chi2.o <- 3.83
chi2.r <- 0.387
pchisq(chi2.r,1,chi2.o-1)
## Study 165
chi2.o <- 4.51
chi2.r <- 1.57
pchisq(chi2.r,1,chi2.o-1)
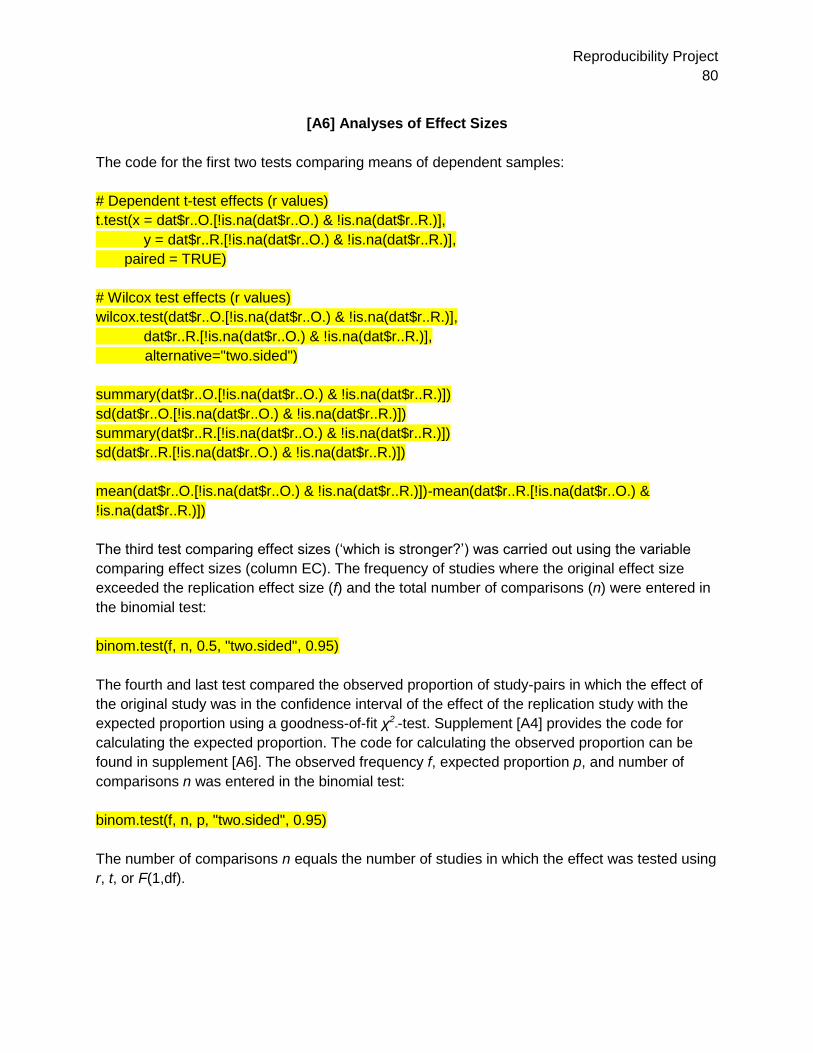
Reproducibility Project
80
[A6] Analyses of Effect Sizes
The code for the first two tests comparing means of dependent samples:
# Dependent t-test effects (r values)
t.test(x = dat$r..O.[!is.na(dat$r..O.) & !is.na(dat$r..R.)],
y = dat$r..R.[!is.na(dat$r..O.) & !is.na(dat$r..R.)],
paired = TRUE)
# Wilcox test effects (r values)
wilcox.test(dat$r..O.[!is.na(dat$r..O.) & !is.na(dat$r..R.)],
dat$r..R.[!is.na(dat$r..O.) & !is.na(dat$r..R.)],
alternative="two.sided")
summary(dat$r..O.[!is.na(dat$r..O.) & !is.na(dat$r..R.)])
sd(dat$r..O.[!is.na(dat$r..O.) & !is.na(dat$r..R.)])
summary(dat$r..R.[!is.na(dat$r..O.) & !is.na(dat$r..R.)])
sd(dat$r..R.[!is.na(dat$r..O.) & !is.na(dat$r..R.)])
mean(dat$r..O.[!is.na(dat$r..O.) & !is.na(dat$r..R.)])-mean(dat$r..R.[!is.na(dat$r..O.) &
!is.na(dat$r..R.)])
The third test comparing effect sizes (‘which is stronger?’) was carried out using the variable
comparing effect sizes (column EC). The frequency of studies where the original effect size
exceeded the replication effect size (f) and the total number of comparisons (n) were entered in
the binomial test:
binom.test(f, n, 0.5, "two.sided", 0.95)
The fourth and last test compared the observed proportion of study-pairs in which the effect of
the original study was in the confidence interval of the effect of the replication study with the
expected proportion using a goodness-of-fit χ2-test. Supplement [A4] provides the code for
calculating the expected proportion. The code for calculating the observed proportion can be
found in supplement [A6]. The observed frequency f, expected proportion p, and number of
comparisons n was entered in the binomial test:
binom.test(f, n, p, "two.sided", 0.95)
The number of comparisons n equals the number of studies in which the effect was tested using
r, t, or F(1,df).
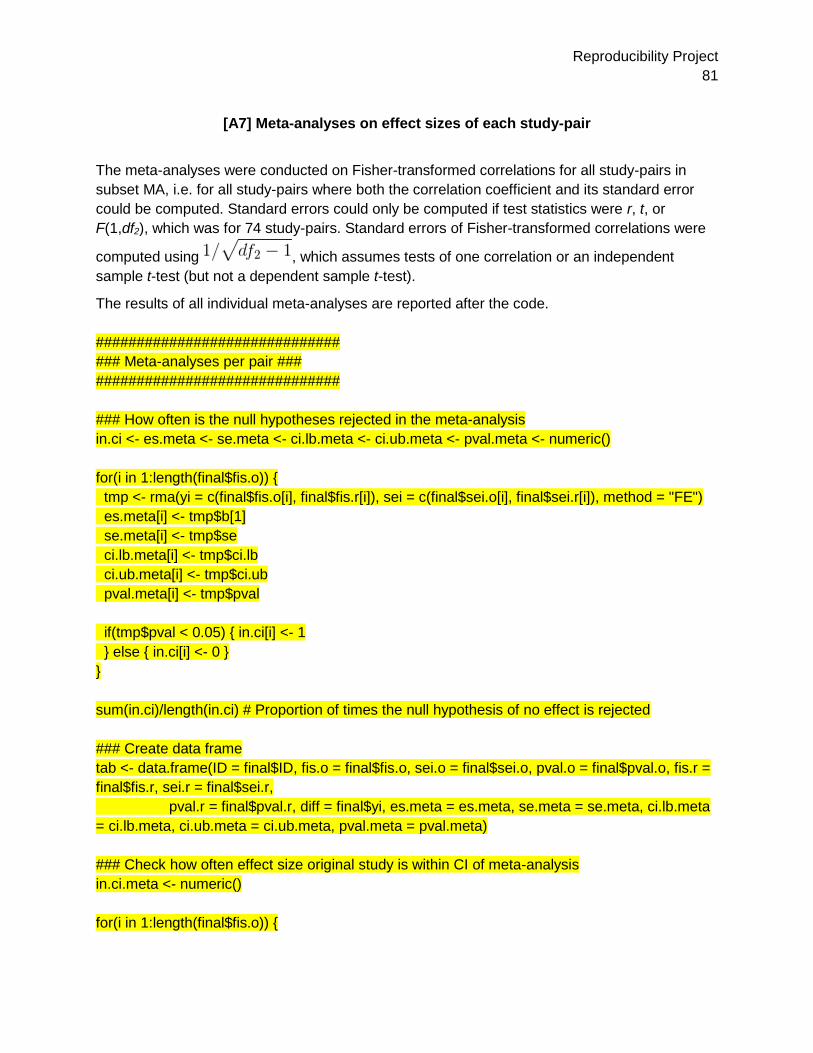
Reproducibility Project
81
[A7] Meta-analyses on effect sizes of each study-pair
The meta-analyses were conducted on Fisher-transformed correlations for all study-pairs in
subset MA, i.e. for all study-pairs where both the correlation coefficient and its standard error
could be computed. Standard errors could only be computed if test statistics were r, t, or
F(1,df2), which was for 74 study-pairs. Standard errors of Fisher-transformed correlations were
computed using , which assumes tests of one correlation or an independent
sample t-test (but not a dependent sample t-test).
The results of all individual meta-analyses are reported after the code.
##############################
### Meta-analyses per pair ###
##############################
### How often is the null hypotheses rejected in the meta-analysis
in.ci <- es.meta <- se.meta <- ci.lb.meta <- ci.ub.meta <- pval.meta <- numeric()
for(i in 1:length(final$fis.o)) {
tmp <- rma(yi = c(final$fis.o[i], final$fis.r[i]), sei = c(final$sei.o[i], final$sei.r[i]), method = "FE")
es.meta[i] <- tmp$b[1]
se.meta[i] <- tmp$se
ci.lb.meta[i] <- tmp$ci.lb
ci.ub.meta[i] <- tmp$ci.ub
pval.meta[i] <- tmp$pval
if(tmp$pval < 0.05) { in.ci[i] <- 1
} else { in.ci[i] <- 0 }
}
sum(in.ci)/length(in.ci) # Proportion of times the null hypothesis of no effect is rejected
### Create data frame
tab <- data.frame(ID = final$ID, fis.o = final$fis.o, sei.o = final$sei.o, pval.o = final$pval.o, fis.r =
final$fis.r, sei.r = final$sei.r,
pval.r = final$pval.r, diff = final$yi, es.meta = es.meta, se.meta = se.meta, ci.lb.meta
= ci.lb.meta, ci.ub.meta = ci.ub.meta, pval.meta = pval.meta)
### Check how often effect size original study is within CI of meta-analysis
in.ci.meta <- numeric()
for(i in 1:length(final$fis.o)) {
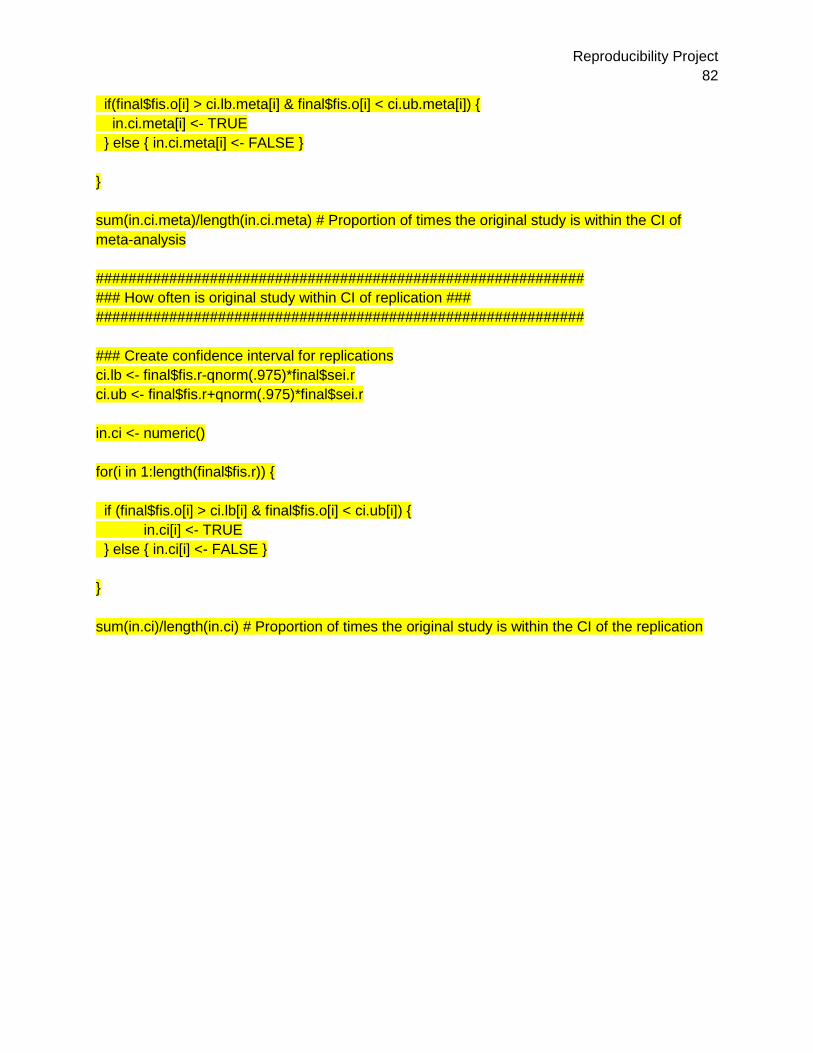
Reproducibility Project
82
if(final$fis.o[i] > ci.lb.meta[i] & final$fis.o[i] < ci.ub.meta[i]) {
in.ci.meta[i] <- TRUE
} else { in.ci.meta[i] <- FALSE }
}
sum(in.ci.meta)/length(in.ci.meta) # Proportion of times the original study is within the CI of
meta-analysis
############################################################
### How often is original study within CI of replication ###
############################################################
### Create confidence interval for replications
ci.lb <- final$fis.r-qnorm(.975)*final$sei.r
ci.ub <- final$fis.r+qnorm(.975)*final$sei.r
in.ci <- numeric()
for(i in 1:length(final$fis.r)) {
if (final$fis.o[i] > ci.lb[i] & final$fis.o[i] < ci.ub[i]) {
in.ci[i] <- TRUE
} else { in.ci[i] <- FALSE }
}
sum(in.ci)/length(in.ci) # Proportion of times the original study is within the CI of the replication