Ti-6Al-4V Using reo - irep.iium.edu.myirep.iium.edu.my/26890/1/TL_PCD_#27.pdf · Proceeding ofthe...
6
Proceeding of the 2008 International Joint Conference in Engineering IJSE2008, August 4-5, Jakarta, Indonesia Tool Life Prediction by Response Surface Methodology for End Milling Titanium Alloy Ti-6Al-4V Using reo Inserts Tumad L. Ginta 1 ), A.K.M. Nurul Amirr", A.N.M. Karim 2 ), M.A.Lajis 2 ) I)Jurusan Teknik Mesin, Universitas Jenderal Achmad Yani, JI. Terusan Jend. Soedirman PO BOX. 148 Cimahi, Indonesia; Email: [email protected] 2Manufacturing and Materials Engineering, International Islamic University Malaysia, PO. Box 10 50728 Kuala Lumpur, Malaysia; Email: [email protected]@[email protected] Abstract-This paper presents an approach to establish models for tool life in end milling of titanium alloy Ti-- 6AI- 4V using pcn inserts under dry conditions. Small central composite design (CCn) was employed in developing the tool life model in relation to primary cutting parameters such as cutting speed, axial depth of cut and feed. Flank wear has been considered as the criteria for tool failure and the wear was measured under a Hisomet II Toolmaker's microscope. Further testing was stopped and an insert rejected when an average flank wear greater than 0.30 mm was achieved. Design-expert version 6.0.8 software was applied to establish the first-order and the second-order models and develop the contours. The adequacy of the predictive model was verified using analysis of variance (ANOV A) at 95% confidence level. Keywords - PCD, Too/life, Ti-6A/-4V,response surface 1. INTRODUCTION T he performance of a cutting tool is normally assessed in terms of its life. Wear criteria are usually used in assessing tool life. Mostly, flank wear is considered, since it largely affects the stability of the cutting wedge and consequently the dimensional tolerance of the machined work surface [1]. Titanium alloys are generally difficult to machine at cutting speed at of over 30 mlmin with high speed steel (HSS) tools, and over 60 mlmin with cemented tungsten carbide (WC) tools, resulting in a very low productivity [2]. With the evolution of a number of new cutting tool materials, advanced tool materials such as cubic boron nitride (CBN) and polycrystalline diamond (PCD) have been developed. These tools have the good potential for use in high speed milling. However, polycrystalline diamond is currently very expensive. In addition, it is highly reactive with titanium alloys at higher temperature, hence, its performance in machining of titanium alloys should be assessed. In order to develop an adequate relationship between the tool life and the cutting parameters (such as cutting speed, depth of cut, feed, etc), a large number of tests are needed, requiring a separate set of tests for each combinations of cutting parameters. This increases the total number of tests and as a result the experimentation cost also increases. As a group of mathematical and statistical techniques, response surface methodology (RSM) is useful for modeling the relationship between the input parameters and output responses. RSM could save cost and time by reducing number of experiments required. In assessing machinability, some researchers have tried to employ response surface methodology to design their experimentations, and to establish the models. Kaye et a/ [3] used response surface methodology in predicting tool flank wear using spindle speed change. A unique model has been developed which predicts tool flank wear, based on the spindle speed change, provided the initial flank wear at the beginning of the normal cutting stage is known. Alauddin et a/ [4] applied response surface methodology to optimize the surface finish in end milling of Inconel 718. Fuh and Wang proposed a predicted milling force model for end milling operation. They found that the proposed predicted milling force had a good correlation with experimental values [5J. Choudhury and el-Baradie found that response surface methodology coupled with the factorial design of experiments were useful techniques for tool life testing. Relative smaller number of designed experiments is required to generate much useful information that could be used to develop the predicting equation for tool life [6]. Choudhury and EI-Baradie also used response surface methodology for assessing machinability of Inconel 718. They found that the dual response contours of tool life and surface roughness are very useful in assessing the maximum attainable tool life for the same surface finish [Z]. Mansour et al developed a surface roughness model for end milling of a semi - free cutting carbon casehardened steel. They 95
Transcript of Ti-6Al-4V Using reo - irep.iium.edu.myirep.iium.edu.my/26890/1/TL_PCD_#27.pdf · Proceeding ofthe...

Proceeding of the 2008 International Joint Conference in EngineeringIJSE2008, August 4-5, Jakarta, Indonesia
Tool Life Prediction by Response SurfaceMethodology for End Milling Titanium Alloy
Ti-6Al-4V Using reo InsertsTumad L. Ginta1), A.K.M. Nurul Amirr", A.N.M. Karim2), M.A.Lajis2)
I)Jurusan Teknik Mesin, Universitas Jenderal Achmad Yani,JI. Terusan Jend. Soedirman PO BOX. 148 Cimahi, Indonesia; Email: [email protected]
2Manufacturing and Materials Engineering, International Islamic University Malaysia,PO. Box 10 50728 Kuala Lumpur, Malaysia;
Email: [email protected]@[email protected]
Abstract-This paper presents an approach to establishmodels for tool life in end milling of titanium alloy Ti--6AI- 4V using pcn inserts under dry conditions. Smallcentral composite design (CCn) was employed indeveloping the tool life model in relation to primarycutting parameters such as cutting speed, axial depth ofcut and feed. Flank wear has been considered as thecriteria for tool failure and the wear was measuredunder a Hisomet II Toolmaker's microscope. Furthertesting was stopped and an insert rejected when anaverage flank wear greater than 0.30 mm was achieved.Design-expert version 6.0.8 software was applied toestablish the first-order and the second-order models anddevelop the contours. The adequacy of the predictivemodel was verified using analysis of variance (ANOV A)at 95% confidence level.
Keywords - PCD, Too/life, Ti-6A/-4V,response surface
1. INTRODUCTION
The performance of a cutting tool is normally assessed interms of its life. Wear criteria are usually used in
assessing tool life. Mostly, flank wear is considered, since itlargely affects the stability of the cutting wedge andconsequently the dimensional tolerance of the machinedwork surface [1]. Titanium alloys are generally difficult tomachine at cutting speed at of over 30 mlmin with highspeed steel (HSS) tools, and over 60 mlmin with cementedtungsten carbide (WC) tools, resulting in a very lowproductivity [2]. With the evolution of a number of newcutting tool materials, advanced tool materials such as cubicboron nitride (CBN) and polycrystalline diamond (PCD)have been developed. These tools have the good potentialfor use in high speed milling. However, polycrystallinediamond is currently very expensive. In addition, it is highlyreactive with titanium alloys at higher temperature, hence,
its performance in machining of titanium alloys should beassessed.
In order to develop an adequate relationship between thetool life and the cutting parameters (such as cutting speed,depth of cut, feed, etc), a large number of tests are needed,requiring a separate set of tests for each combinations ofcutting parameters. This increases the total number of testsand as a result the experimentation cost also increases. As agroup of mathematical and statistical techniques, responsesurface methodology (RSM) is useful for modeling therelationship between the input parameters and outputresponses. RSM could save cost and time by reducingnumber of experiments required.
In assessing machinability, some researchers have triedto employ response surface methodology to design theirexperimentations, and to establish the models. Kaye et a/ [3]used response surface methodology in predicting tool flankwear using spindle speed change. A unique model has beendeveloped which predicts tool flank wear, based on thespindle speed change, provided the initial flank wear at thebeginning of the normal cutting stage is known. Alauddin eta/ [4] applied response surface methodology to optimize thesurface finish in end milling of Inconel 718. Fuh and Wangproposed a predicted milling force model for end millingoperation. They found that the proposed predicted millingforce had a good correlation with experimental values [5J.Choudhury and el-Baradie found that response surfacemethodology coupled with the factorial design ofexperiments were useful techniques for tool life testing.Relative smaller number of designed experiments is requiredto generate much useful information that could be used todevelop the predicting equation for tool life [6].
Choudhury and EI-Baradie also used response surfacemethodology for assessing machinability of Inconel 718.They found that the dual response contours of tool life andsurface roughness are very useful in assessing the maximumattainable tool life for the same surface finish [Z]. Mansouret al developed a surface roughness model for end milling ofa semi - free cutting carbon casehardened steel. They
95
Proceeding of the 2008 International Joint Conference in EngineeringUSE2008, August 4-5, Jakarta, Indonesia
investigated a first-order equation covering the speed range30--35 m/min and a second order generation equationcovering the speed range 24--38 m/min. They suggested thatan increase in either the feed or the axial depth of cutincreases the surface roughness, whilst an increase in thecutting speed decreases the surface roughness [8]. Oktem etal used response surface methodology with a developedgenetic algorithm (GA) in the optimization ofcutting conditions for surface roughness [9]. S. Sharif et alused factorial design coupled with response surfacemethodology in developing the surface roughness model inrelation to the primary machining variables such as cuttingspeed, feed, and radial rake angle [10]. Ginta et al [11] usedresponse surface methodology in assessing tool life in endmilling titanium alloy Ti-6AI-4V with uncoated WC-Coinserts. They found that an increase of cutting speed, axialdepth of cut and feed by 100%, will lead to reduction of toollife by 70%, 27%, and 37%, respectively.
The main objective of the current work was to establishthe tool life models of polycrystalline diamond (PCD)inserts in end milling titanium alloy Ti-6AI-4V under dryconditions. Tool life models were established based oncutting speed, axial depth of cut and feed. Small centralcomposite design (CCD) was used to design theexperimentations. Design-expert Version 6.0.8 package wasused to analyze the data and to develop the models. Theadequacy of the model was tested at 95% confidence level.
II. MATHEMATICAL MODEL
Tool life mathematical model for end milling in terms ofthe cutting parameters can be expressed as:
k II! IT = CV a f (I)
:zWhere, T is the predicted tool life (minutes), V is the
cutting speed (m/min), a is the axial depth of cut (mm) andfzis the feed per tooth (mm/tooth), and C, k; m, and I are modelparameters to be estimated using the experimental results.To determine the constants and exponents, this mathematicalmodel can be linearized by employing a logarithmictransformation, and (1) can be expressed as:
In T =In Cw]: In V+m In a+l usf (2)
The linear model of (2) is:
y = POxO + PIXt + P2x2 + fhX3 (3)
Where, y is the true response of surface roughness UII alogarithmic scale Xo = 1 (dummy variable), x., x], X3 arelogarithmic transformations of speed, axial depth cut, andfeed respectively, while 130. J3b 132. and 133 are the parametersto be estimated. Equation (3) can be expressed as:
.:VI =Y-E =boxo +~xl +h:Jx2 +h.3X3 (4)
where, y' is the estimated response and y the measured lUUI
life on a logarithmic scale, e the experimental error and the bvalues are estimates of the 13 parameters.
96
The second-order model can be extended from the first-order model's equation as:
"12 =y-e=boxo+b1x1 +b2X2 +b]X3 +~lxi +
b 2 2 b b (5)22X2 + bJJx] + b12X1X2 + 13X1Xl + nX2x]
Where y' 2 is the estimated responses based on the secondorder models. Analysis of variance (ANOV A) is used toverify and validate the model.
III. EXPERIMENT DETAILS
3.1 Experimental design and conditionsThe design of experiments has an effect on the number of
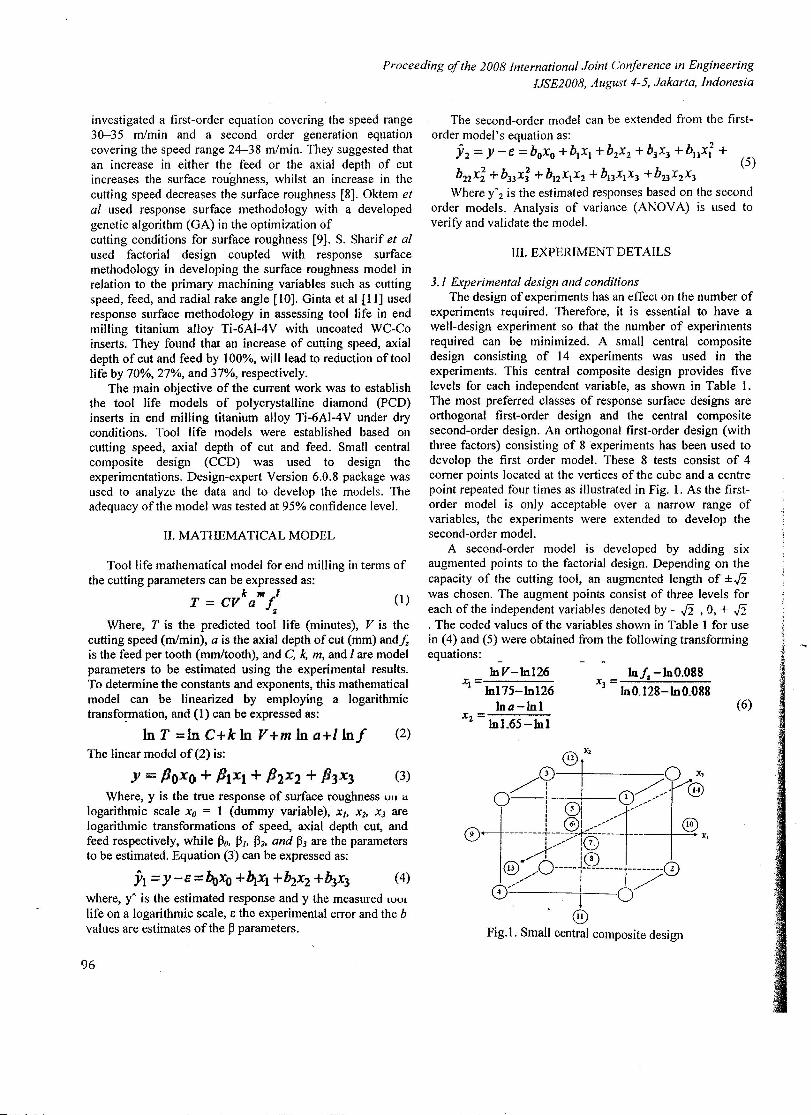
experiments required. Therefore, it is essential to have awell-design experiment so that the number of experimentsrequired can be minimized. A small central compositedesign consisting of 14 experiments was used in theexperiments. This central composite design provides fivelevels for each independent variable, as shown in Table I.The most preferred classes of response surface designs areorthogonal first-order design and the central compositesecond-order design. An orthogonal first-order design (withthree factors) consisting of 8 experiments has been used todevelop the first order model. These 8 tests consist of 4comer points located at the vertices of the cube and a centrepoint repeated four times as illustrated in Fig. I. As the first-order model is only acceptable over a narrow range ofvariables, the experiments were extended to develop thesecond-order model.
A second-order model is developed by adding sixaugmented points to the factorial design. Depending on thecapacity of the cutting tool, an augmented length of ±J2was chosen. The augment points consist of three levels foreach of the independent variables denoted by - J2 ,0, + J2. The coded values of the variables shown in Table 1 for usein (4) and (5) were obtained from the following transformingequations:
lnV-ln126Xi 1n115-1n126
loa-lolx2 - InL65-101
Inf. -100.088Xl =-1n-0";;".1"-28---In-.-0.-Og-g
(6)
x,@ev-=i 0 Xl
0/: i f1\~/ @I 1'7\' v --1 01 ••• ~'"
: I ....."I 01 10
I ••.••••.••1t;'\7 II ' I\.:J
~ kD@ ,.0-----1--------- --------0all i 0/
I®
Fig.l , Small central composite design
Proceeding of the 2008 International Joint Conference in EngineeringIJSE2008, August 4-5, Jakarta, Indonesia
Table I.Level of the independent variables and codingidentifications
Levels Lowest Low CeDtre Hi~b HighestCoding
-J2-I 0 +1
+J2xr, cutting 80.53 92 126.9 175 200speed, V(m/win)Xl. axial 0.5 0.61 1.00 1.65 2.03dq>th ofcut. a (mm)Xl. feed./. 0.05 0.06 0.088 0.128 0.15(mmltooth)
3.2 Experimental WorksEnd milling tests were conducted on Vertical Machining
Centre (VMC ZPS, Model: MLR 542 with full immersioncutting under dry condition. Titanium alloy Ti-6AI-4V barwas used as the work-piece. Machining was performed witha 20 mm diameter end-mill tool holder (R390-020B20-11 M)fitted with one insert. PCD inserts were used in theexperiments. All of the experiments were run under dryconditions and each test was started with a new cutting edge.Depending on the cutting conditions and wear rate,machining was stopped at various interval of cutting lengthfrom 100 mm to 200 mm to record the wear of the inserts.Flank wear has been considered as the criteria for tool failureand the wear was measured under a Hisomet II Toolmaker'smicroscope. Further testing was stopped and an insertrejected when an average flank wear greater than 0.30 mmwas recorded. The experimental design in coding of leveland actual values are presented in Table 2.
IV. RESULTS AND DISCUSSION
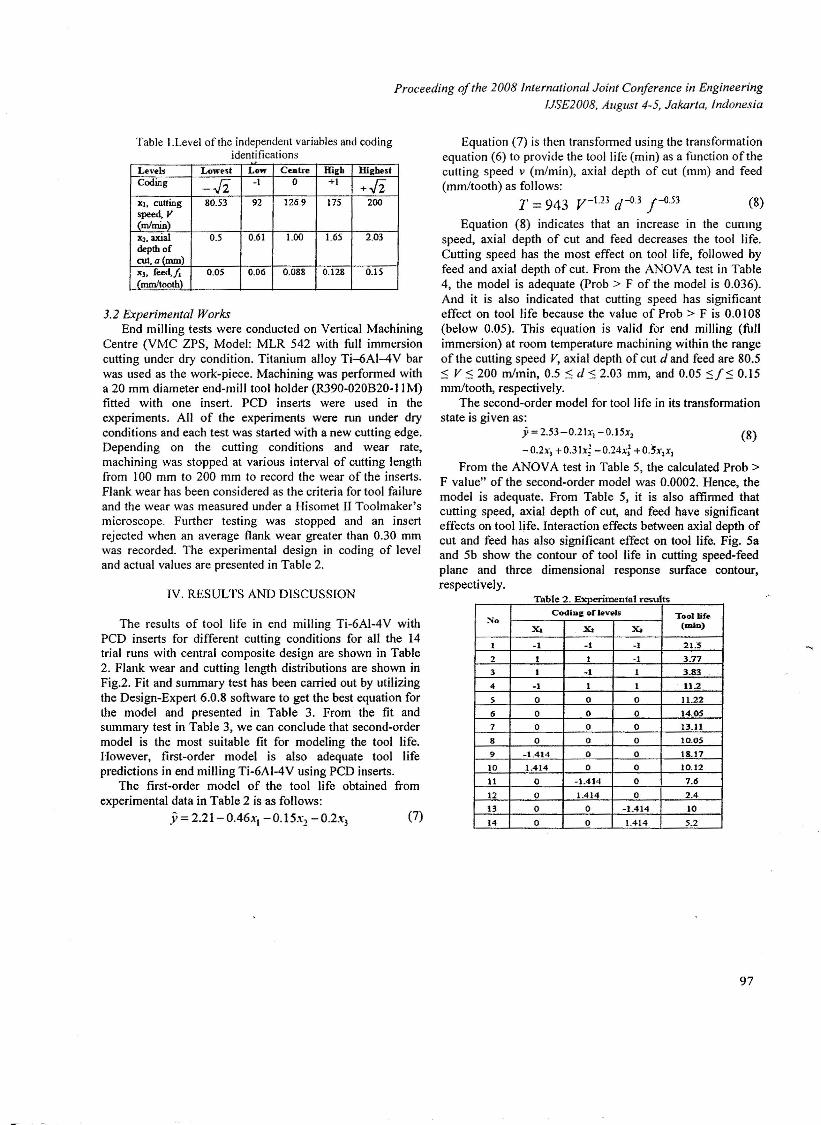
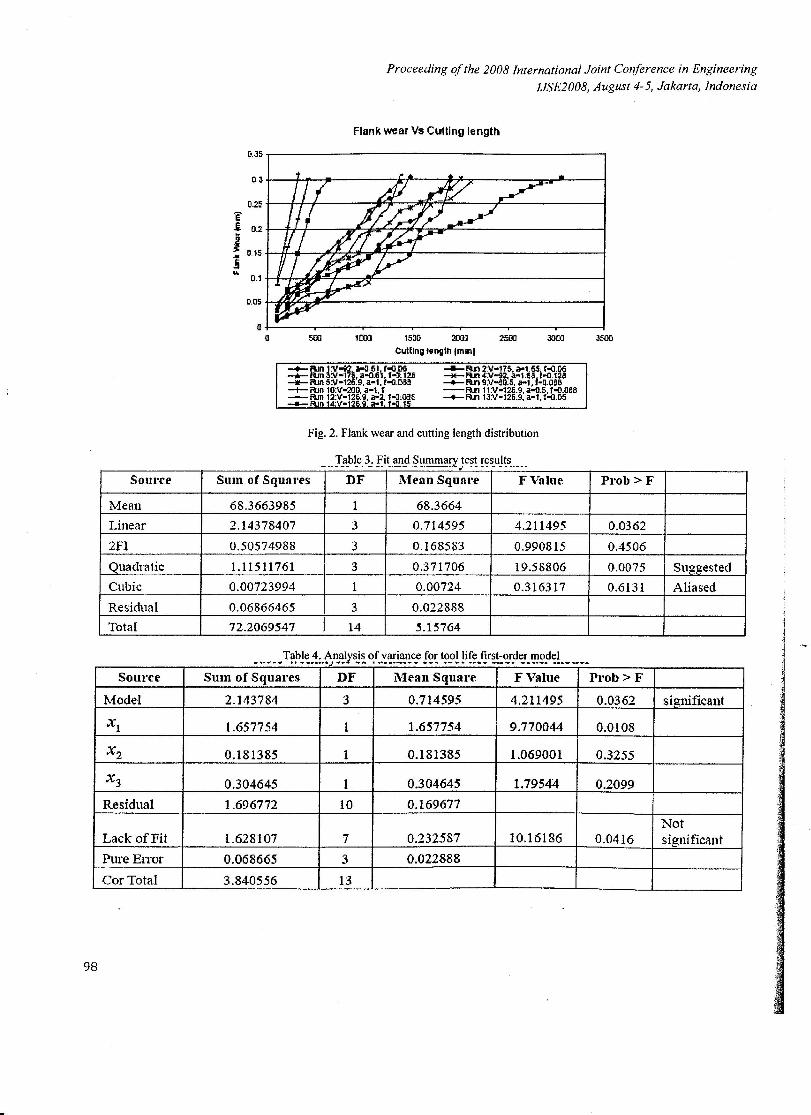
The results of tool life in end milling Ti-6AI-4V withPCD inserts for different cutting conditions for all the 14trial runs with central composite design are shown in Table2. Flank wear and cutting length distributions are shown inFig.2. Fit and summary test has been carried out by utilizingthe Design-Expert 6.0.8 software to get the best equation forthe model and presented in Table 3. From the fit andsummary test in Table 3, we can conclude that second-ordermodel is the most suitable fit for modeling the tool life.However, first-order model is also adequate tool lifepredictions in end milling Ti-6AI-4V using PCD inserts.
The first-order model of the tool life obtained fromexperimental data in Table 2 is as follows:
.y = 2.21- 0.46x1 - 0.15.'1:2 - O.2X3 (7)
Equation (7) is then transformed using the transformationequation (6) to provide the tool life (min) as a function of thecutting speed v (rnImin), axial depth of cut (mm) and feed(mm/tooth) as follows:
T = 943 V-113 d-O.3 1-0.53 (8)
Equation (8) indicates that an increase in the cumngspeed, axial depth of cut and feed decreases the tool life.Cutting speed has the most effect on tool life, followed byfeed and axial depth of cut. From the ANOV A test in Table4, the model is adequate (Prob > F of the model is 0.036).And it is also indicated that cutting speed has significanteffect on tool life because the value of Prob > F is 0.0108(below 0.05). This equation is valid for end milling (fullimmersion) at room temperature machining within the rangeof the cutting speed V, axial depth of cut d and feed are 80.5::s V::S 200 rnImin, 0.5 ::s d::s 2.03 mm, and 0.05 ::Sf::S 0.15mm/tooth, respectively.
The second-order model for tool life in its transformationstate is given as:
y = 2.53-0.21xl - O.15xl (8)-O.2x) +O.31xi -O.24x; +O.5X2X1
From the ANOV A test in Table 5, the calculated Prob >F value" of the second-order model was 0.0002. Hence, themodel is adequate. From Table 5, it is also affirmed thatcutting speed, axial depth of cut, and feed have significanteffects on tool life. Interaction effects between axial depth ofcut and feed has also significant effect on tool life. Fig. Saand Sb show the contour of tool life in cutting speed-feedplane and three dimensional response surface contour,respectively.
Table 2. Exoerimental resultsCodiDI: orlevels Toollif •.~o
(miD)X. X. X.
1 -1 -1 -1 21.5
2 I 1 -1 3.77
3 1 -I 1 3.83
4 -I 1 1 11.2.
S 0 0 0 11.22
6 0 0 0 14.05
7 0 0 0 13.11
8 0 0 0 10.05
9 -1.414 0 0 18.17
10 1.414 0 0 10.12
11 0 -1.414 0 7.6
12 0 1.414 0 2.4
13 0 0 -1.414 10
14 0 0 1.414 5.2
97
Proceeding of the 2008 International Joint Conference in EngineeringIJSE2008, August 4-5, Jakarta, Indonesia
Flank wear Vs Cutting length
D.35 -r-----------------------,0.3+--i-'r--j-----i:-fL--~HC__x_---___;L::II".IL----l
O.2~+---++-f----*.il--;;;:;>IITX-=F"---____,r:--------IE~ 0.2+--4-}'-+--~y~:.r-7'l--,r-....,..-==-----------I
j ~~~~~~----------,..•• D.1S Ijj"- 0.1 H'-+-~~=+____,:::oe<-----------------I
0.05 ~~~.¥-=--------------------I
lCOO 150!! :2000cut ling length Imm)
2500
-+-A.m 1:V-92. iPlI.61. r-o.C<5-.- Rll13:V-175. 3-0.61, f·O'.I25__ A.mS:V-126.9. a-I. r-o.oes-t-1\Jn In:V'''20~ a-I. f- Rll112:V-126: 9. a-2, f-n,096__ Rm 14:V-126.9 a-1 f-0'.15
Fig. 2. Flank wear and cutting length distribution
Source Sum of Squares DF Mean Square FValue Pl'ob > F
Mean 68.3663985 1 68.3664
Linear 2.14378407 3 0.714595 4.211495 0.0362
2FI 0.50574988 3 0.168583 0.990815 0.4506
Quadratic 1.11511761 3 0.371706 19.58806 0.0075 SuggestedCubic 0.00723994 1 0.00724 0.316317 0.6131 AliasedResidual 0.06866465 3 0.022888
Total 72.2069547 14 5.15764
• __ T~ple 4. ~I!.alysj~ o,fyariance [o~ too!!ife.flrst-order model- - - .............. - .•. -........_ ..•. - - -- .. •.__ .......... -_ ... _ .•.-----Source Sum of Squares DF Mean Square F Value Prob > F
Model 2.143784 3 0.714595 4.211495 0.0362 significant
Xl 1.657754 1 1.657754 9.770044 0.DI08
X2 0.181385 1 0.181385 1.069001 0.3255
X3 0.304645 1 0.30464:5 1.79:544 0.2099
Residual 1.696772 10 0.169677Not
Lack of Fit 1.628107 7 0.232587 10.16186 0.0416 significantPure Enol' 0.068665 3 0.022888
Cor Total 3.840556 13
98

a e . nalYSIS0 variance or too I e secon -or er mo e
Source Sum of Squares DF Mean Square FValue Prob > F
Model 3.752098 7 0.536014 36.35728 0.0002 significant
XI 0.171264 1 0.171264 11.61663 0.0143
X2 0.181385 1 0.181385 12.30317 0.0127
X3 0.304645 1 0.304645 20.66377 0.00392
Xl 0.047114 1 0.047114 3.195714 0.12412
X2 0.678679 1 0.678679 46.03409 0.0005X2
0.407076 1 0.407076 27.61155 0.00193
X2X3 0.493197 1 0.493197 33.45303 0.0012Residual 0.088458 6 0.014743Lack of Fit 0.019793 3 0.006598 0.288258 0.8329 not significant
Pure En-or 0.068665 3 0.022888
Cor Total 3.840556 IJ
T bl 5 A I . f
Proceeding of the 20081nternational Joint Conference in EngineeringJJSE2008, August 4-5, Jakarta, Indonesia
f< d d d I
(a) (0)fig. 3.Toollife contour in end milling at axial depth of cut 1 mm at : (a) Cutting speed-feed plane, (b), Three-dimensional response surface.
V. CONCLUSIONS
The following conclusions can be drawn from thisstudy:I. Small central composite design has successfully proved to
be a successful technique to assess the tool life in end-milling of titanium alloy Ti-6AI-4V using PCD insertsunder dry conditions.
2. The tool life models show that the cutting speed is themain factors on the tool life, followed by the feed and
axial depth of cut. Increase many of these three cuttingvariables leads to reduction of tool life.
3. The second-order model can be used to see the interactioneffects between the cutting parameters.
4. The variance analysis for the second-order model showsthat most of the interaction terms and the square termsare statistically insignificant.
99

iI
Proceeding of the 2008 International Joint Conference in EngineeringUSE2008, August 4-5, Jakarta, Indonesia
ACKNOWLEDGEMENTS
The authors wish to thank the Research Centre HUM andthe Ministry of Science, Technology and Innovation(MOSTI) Malaysia for their financial support to the aboveproject through the e-Science Fund Project (Project No.03-01-08-SFOOOI).
REFERENCES
[I] Z.A. Zoya, R. Krisnamurthy, The performance ofCBN tools inthe machining of titanium alloys, Journal of Mat. Process.Technology 100, pp. 80 - 86, 2000.[2] L.N. Lopez de lacalle, J. Perez, 1.1. Llorente, J. A Sanchez,Advanced cutting conditions for the milling of aeronauticalalloys,"Journal of Mater. Process. Technology 100, pp. I - II,2000.[3] J.E. Kaye, D.H. Yan, N. Popplewell, S. Balakrishnan,Predicting tool flank wear using spindle speed change, Int. J. Mach.Tools Manufact. Vol. 35 No.9, pp 1309-1320, 1995.[4] M. Alauddin, M.A. EI Baradie, M.SJ. Hashmi, Optimization ofsurface finish in end milling Inconel 718, Journal of Mater. Processand Technology 56, pp. 54 - 65, 1996.[5] Kuang- Hua Fuh, Ren-Ming Hwang, A predicted milling forcemodel high-speed end milling operation, Int. J. Mech. ToolsManufact. Vol. 37 No.7, pp. 969 - 979,1997.[6] LA. Choudhury, M.A. EI-Baradie, Tool-life prediction modelby design of experiments for turning high strength steel (290BHN), Journal of Mater. Process. And Technology 77, pp. 319 -326,1998.[7] I.A. Choudhury, M.A E1-Baradie, Machinability assessment ofInconel 718 by factorial design of experiment coupled withresponse surface methodology, Journal of Material Processing andTechnology 95, pp. 30 - 39, 1999.[8] Mansour, H. Abdalla, Surface roughness model for end milling:a semi-free cutting carbon casehardening steel (EN32) in drycondition," Journal of Materials Processing Technology 124, pp.183 - 191,2002.[9] H. Oktem, T. Erzurumlu, H. Kurtaran, Application of responsesurface methodology in the optimization of cutting conditions forsurface roughness," Journal of Material Processing and Technology170, pp. II - 16,2005.[10] S. Sharif, AS. Mohruni, M.Y. Noordin, V.C. Vencatesh,Optimization of surface roughness prediction model in end millingtitanium alloy (Ti-6AI-4V), Proceeding of ICOMAST, pp. 55 - 59,2006.[II] Turnad L. Ginta, A.K.M. Nurul Amin, A N. M. Karim, "Toollife prediction by response surface methodology for end millingtitanium alloy Ti--{iAI-4V using uncoated carbide inserts", 7thInternational Conference on Mechanical Engineering, ICMEDhaka, Bangladesh, 2007
100