Thyrocare Technologies Limited Presentation - Quarter... · • This presentation is for...
17
Thyrocare Technologies Limited Q2-FY18 Presentation
Transcript of Thyrocare Technologies Limited Presentation - Quarter... · • This presentation is for...

Thyrocare Technologies
Limited
Q2-FY18 Presentation

Disclaimer
• This presentation is for information purposes only and it contains general background information about the Company’s activities.
The Company assumes no responsibility to publicly amend, modify or revise any forward looking statements on the basis of any
subsequent development, information or events, or otherwise. This Presentation comprises information given in summary form
and does not purport to be complete. This Presentation should not be considered as a recommendation to any investor to purchase
the equity shares of the Company. This Presentation includes statements that are, or may be deemed to be, “forward-looking
statements”. By their nature, forward-looking statements involve risks and uncertainties because they relate to events and depend
on circumstances that may or may not occur in the future. Forward-looking statements are not guarantees of future performance
including those relating to general business plans and strategy of the Company, its future financial condition and growth
prospects, and future developments in its businesses and its competitive and regulatory environment. No representation, warranty
or undertaking, express or implied, is made or assurance given that such statements, views, projections or forecasts, if any, are
correct or that the objectives of the Company will be achieved. The past performance is not indicative of future results.
• This document has not been and will not be reviewed or approved by the statutory auditors or a regulatory authority in India or by
any stock exchange in India.

Transition to IndAS (Indian Accounting Standards)
Beginning 1 April 2017, the Company has for the first time adopted Indian Accounting Standards (Ind AS) with a transition date of 1 April 2016. Accordingly, theunaudited standalone financial results have been prepared in compliance with IndAS as notified by the Ministry of Corporate Affairs and prescribed under Section133 of the Companies Act, 2013, read with relevant rules issued thereunder and other accounting pronouncements generally accepted in India
Key IndAS Adjustments:
• Re-imbursement of advertisement expenses by shareholders – Non reciprocal contributions
received from the shareholders are considered as capital contribution and the expenses
incurred thereof considering the nature and size are recognized as exceptional expenses.
• Sale of product with sale of services under linked transaction are recognized as single
transaction therefore clubbed together. The incentive paid to service provider is adjusted
against revenue. The fees collected from service provider at inception is amortized over a
period of association.
• As an accounting policy choice adopted, the carrying value of property plant and equipment
and the investment in subsidiaries is deemed as the fair value on IndAS transition.
• The trademarks assigned to the Company and Subsidiary are recognized at fair value on the
basis of valuation certificate. The value of goodwill is tested for impairment.
• The consideration paid to the manufacturers/ vendors under contractual arrangement for
purchase of reagents is bifurcated into lease rental and reagent purchase cost on the
estimates basis on the terms of placement of these analyzers.
• The accounts of ESOP trust are consolidated with the company as the controls are exercised
on the related activities by the entity.
• The ESOP liabilities have been determined on fair value of options under the Black and
Scholes model. The actuarial gain/ loss on employee benefit valuations adjusted through
‘OCI’.
• Fair valuation of financial instruments such as interest-free security deposits, investments in
mutual funds, long-term advances, etc.
• Deferred tax on GAAP adjustments.
[Rs. in million]Six months ended
30 September 2016Quarter ended
30 September 2016
Consolidated Standalone Consolidated Standalone
Net profit (after tax) under Indian GAAP 366.35 376.39 202.32 204.02
Add/ (less) : Adjustment for GAAP differences
Net gain arising on fair value accounting of financial assets/ liabilities (mutual fund, security deposit, etc.)
(9.02) 3.43 (12.36) (0.18)
Accounting of employees stock options as per Black Scholes valuation model
0.66 0.66 0.09 0.09
Net acturial gain on employee benefit plans reclassified to Other Comprehensive Income (OCI)
(0.14) (0.14) (0.10) (0.10)
Others
Adjustment on account of prior period transactions
(1.47) 0.34 (1.43) (0.10)
Deferrement of one time association fees (0.58) (0.56) (0.22) (0.23)
Recognition of contribution towards advertisement
(165.23) (165.23) (165.23) (165.23)
Deferred tax on the above adjustments (8.08) (8.08) (11.36) (11.36)
Net profit before OCI/ reserve as per Ind AS 182.49 206.81 11.71 26.91
% change in the net profit on transition to IndAS -50% -45% -94% -87%

Consolidated Financials
Thyrocare Technologies Limited [Consolidated] Thyrocare Technologies Limited [Consolidated]
P&L Statement (INR mn, except per share data) Balance Sheet (INR mn)
Particulars Year to Date YoY Growth 3 months ended YoY Growth
30 Sep 17 30 Sep 16 30 Sep 17 30 Sep 16 Particulars 30 Sep 17 30 Sep 16
Revenue from operations 1,757.92 1,468.93 20% 880.36 781.48 13% Cash and cash equivalents 87.92 107.80
Cost of Materials consumed/ sales 482.28 395.64 22% 259.02 212.91 22% Current investments 1,277.35 1,086.76
Gross margin 1,275.64 1,073.29 19% 621.34 568.57 9% Trade receivables 76.09 83.89
Operating expenses : Property, plant and equipments 1,536.75 1,483.50
Employee benefits expense 145.79 147.19 -1% 71.97 75.58 -5% Non-current investments - -
Finance cost 1.82 0.82 - - Other assets 1,629.03 1,637.50
Depreciation and amortisation expense 93.56 84.57 11% 49.37 43.25 14% Total assets 4,607.14 4,399.45
Other expenses 408.53 353.12 16% 193.25 189.48 2% Total liabilities 348.85 383.41
Total operating expenses 649.70 585.70 11% 314.59 308.31 2% Total equity 4,258.29 4,016.04
Operating profit 625.94 487.59 28% 306.75 260.27 18% Total liabilities and equity 4,607.14 4,399.45
Other income, net 84.40 61.73 37% 36.76 30.97 19%
Exceptional items (21.93) (165.23) (1.44) (165.23)
Profit before taxes 688.41 384.09 342.07 126.00
Income tax and deferred tax (221.64) (201.60) (95.49) (114.30)
Net profit 466.77 182.49 246.58 11.71
Earnings per equity share
Basic 8.69 3.40 4.59 0.22
Diluted 8.67 3.40 4.58 0.22

Thyrocare Standalone

Standalone Financials
Thyrocare Technologies Limited Thyrocare Technologies Limited
Standalone P&L (INR mn, except for per share data) Balance sheet data (INR mn)
Particulars Year to Date YoY Growth 3 months ended YoY Growth Particulars 30 Sep 17 30 Sep 16
30 Sep 17 30 Sep 16 30 Sep 17 30 Sep 16
Revenue from operations 1,639.26 1,458.09 19%* 817.87 775.43 11%* Cash and cash equivalents 80.69 69.47
Cost of Materials consumed/ sales 461.46 379.30 22% 249.10 204.61 22% Current investments 1,277.35 973.15
Gross margin 1,177.80 1,078.79 18%* 568.76 570.82 7%* Trade receivables 72.36 81.18
Operating expenses : Property, plant and equipments 893.83 887.11
Employee benefits expense 133.47 139.06 -4% 65.65 71.29 -8% Non-current investments 1,946.74 1,946.74
Finance cost 0.88 0.82 8% - - Other assets 408.85 502.44
Depreciation and amortisation expense 56.70 56.24 1% 29.28 28.99 1% Total assets 4,679.82 4,460.09
Other expenses 347.08 368.96 15%* 164.34 195.65 2%* Total liabilities 302.72 336.17
Total operating expenses 538.13 565.08 8%* 259.26 295.93 0%* Total equity 4,377.10 4,123.92
Operating profit 639.67 513.71 27%* 309.50 274.89 15%* Total liabilities and equity 4,679.82 4,460.09
Other income, net 79.74 59.96 33% 31.45 31.58 0%
Exceptional items (21.93) (165.23) (1.44) (165.23)
Profit before taxes 697.48 408.44 339.51 141.24
Income tax and deferred tax (231.25) (201.63) 15% (105.09) (114.33) -8%
Net profit 466.23 206.81 234.42 26.91
Other comprehensive income (net of tax) 1.00 0.14 0.14 0.10
Earnings per equity share
Basic 8.68 3.85 4.37 0.50
Diluted 8.66 3.85 4.36 0.50
*Normalized for the adjustment of revenue/ cost of imaging business in the comparable previous period.
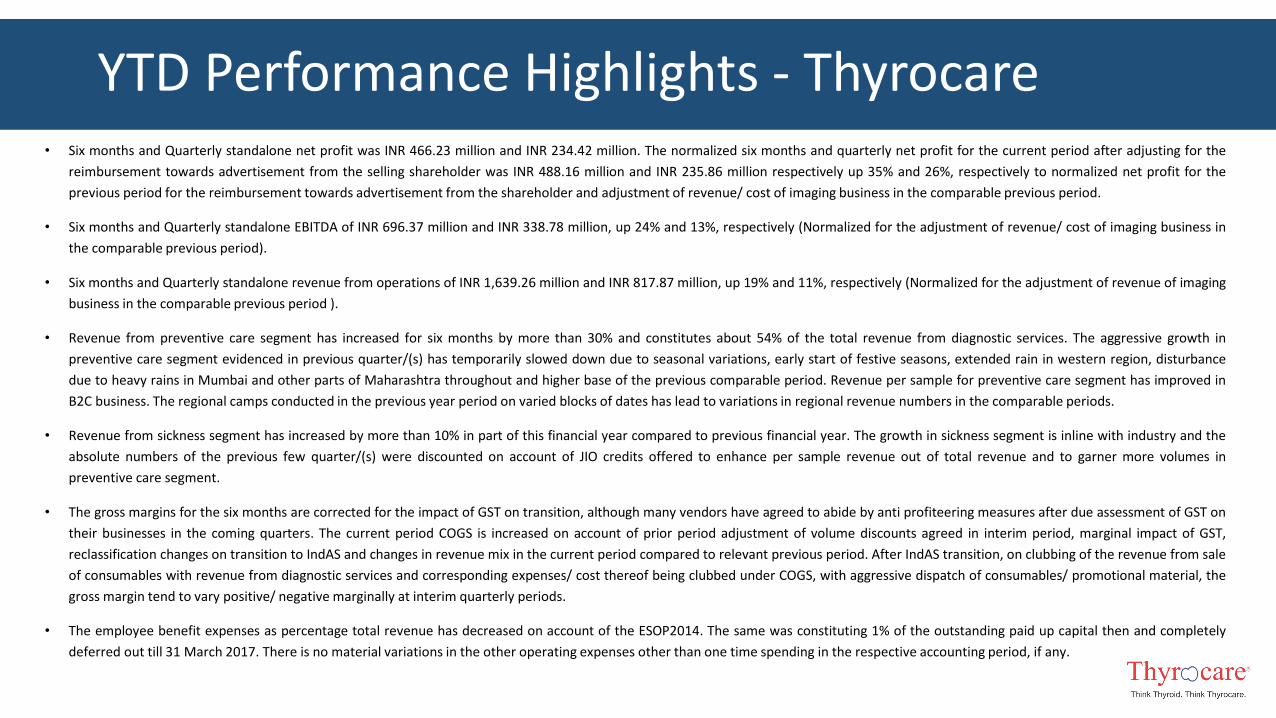
YTD Performance Highlights - Thyrocare• Six months and Quarterly standalone net profit was INR 466.23 million and INR 234.42 million. The normalized six months and quarterly net profit for the current period after adjusting for the
reimbursement towards advertisement from the selling shareholder was INR 488.16 million and INR 235.86 million respectively up 35% and 26%, respectively to normalized net profit for the
previous period for the reimbursement towards advertisement from the shareholder and adjustment of revenue/ cost of imaging business in the comparable previous period.
• Six months and Quarterly standalone EBITDA of INR 696.37 million and INR 338.78 million, up 24% and 13%, respectively (Normalized for the adjustment of revenue/ cost of imaging business in
the comparable previous period).
• Six months and Quarterly standalone revenue from operations of INR 1,639.26 million and INR 817.87 million, up 19% and 11%, respectively (Normalized for the adjustment of revenue of imaging
business in the comparable previous period ).
• Revenue from preventive care segment has increased for six months by more than 30% and constitutes about 54% of the total revenue from diagnostic services. The aggressive growth in
preventive care segment evidenced in previous quarter/(s) has temporarily slowed down due to seasonal variations, early start of festive seasons, extended rain in western region, disturbance
due to heavy rains in Mumbai and other parts of Maharashtra throughout and higher base of the previous comparable period. Revenue per sample for preventive care segment has improved in
B2C business. The regional camps conducted in the previous year period on varied blocks of dates has lead to variations in regional revenue numbers in the comparable periods.
• Revenue from sickness segment has increased by more than 10% in part of this financial year compared to previous financial year. The growth in sickness segment is inline with industry and the
absolute numbers of the previous few quarter/(s) were discounted on account of JIO credits offered to enhance per sample revenue out of total revenue and to garner more volumes in
preventive care segment.
• The gross margins for the six months are corrected for the impact of GST on transition, although many vendors have agreed to abide by anti profiteering measures after due assessment of GST on
their businesses in the coming quarters. The current period COGS is increased on account of prior period adjustment of volume discounts agreed in interim period, marginal impact of GST,
reclassification changes on transition to IndAS and changes in revenue mix in the current period compared to relevant previous period. After IndAS transition, on clubbing of the revenue from sale
of consumables with revenue from diagnostic services and corresponding expenses/ cost thereof being clubbed under COGS, with aggressive dispatch of consumables/ promotional material, the
gross margin tend to vary positive/ negative marginally at interim quarterly periods.
• The employee benefit expenses as percentage total revenue has decreased on account of the ESOP2014. The same was constituting 1% of the outstanding paid up capital then and completely
deferred out till 31 March 2017. There is no material variations in the other operating expenses other than one time spending in the respective accounting period, if any.

Key Financial Trends - Thyrocare
261.3
298.7
259.7
313.0
357.6338.8
Q1 Q2 Q3 Q4
EBITDA (INR mn)
FY17 FY18
645.2
734.1
656.9
823.6 821.4 817.9
Q1 Q2 Q3 Q4
Revenue (INR mn)
FY17 FY18
41% 41%40%
38%
44%
41%
Q1 - FY17 Q2 - FY17 Q3 - FY17 Q4 - FY17 Q1 - FY18 Q2 - FY18
EBITDA Margin(%)
# Previous period figures are normalized for the adjustment of revenue/ cost of imaging business.

Key Operating Metrics – Business Lines
110
133
129
185
188
167
169
217
177
243
227
238
15
17
16
20
19
17
300
309
278
313
328
341
0% 10% 20% 30% 40% 50% 60% 70% 80% 90% 100%
Q1-FY17
Q2-FY17
Q3-FY17
Q4-FY17
Q1-FY18
Q2-FY18
Revenue Breakup (INR mn)
Aarogyam - B2C Aarogyam - B2B Sickness - B2C Sickness - B2B
83.8
105.3
99.9
149.7
146.9
126.2
293.9
359.7
288.4
376.9
357.0
374.4
155.5
188.6
180.6
253.4
237.5
219.5
2,921.8
3,014.9
2,659.0
3,152.9
3,276.4
3,362.3
0% 10% 20% 30% 40% 50% 60% 70% 80% 90% 100%
Q1-FY17
Q2-FY17
Q3-FY17
Q4-FY17
Q1-FY18
Q2-FY18
Volume Breakup (‘000 Samples)
Aarogyam - B2C Aarogyam - B2B Sickness - B2C Sickness - B2B

Key Operating Metrics – Regional Breakup
309.0
432.2
356.7
395.8
369.8
425.8
228.6
264.1
0% 10% 20% 30% 40% 50% 60% 70% 80% 90% 100%
1HFY17
1HFY18
Value Breakup (INR mn)
North South West East
1.63
1.98
2.18
2.35
1.56
1.86
1.74
1.89
0% 10% 20% 30% 40% 50% 60% 70% 80% 90% 100%
1HFY17
1HFY18
Volume Breakup (mn Samples)
North South West East

Operating DataThyrocare Technologies Limited
(Rs. in million, except per share data)
Particulars Year to DateYear-on-Year
Growth (%)3 months ended
Year-on-Year Growth (%)
September 30, 2017
September 30, 2016
September 30, 2017
September 30, 2016
B2B revenue (in million) 1,133.68 995.78 14% 579.26 526.90 10%
B2C revenue (in million) 391.42 275.85 42% 184.38 150.13 23%
B2B revenue/ total revenue (%) 69.2% 72.2% - 70.8% 71.8% -
B2C revenue/ total revenue (%) 23.9% 20.0% 19% 22.5% 20.5% 10%
Preventivecare revenue (in million) 819.98 630.34 30% 404.98 350.56 16%
Preventivecare revenue/ Revenue from operations (%) 50.0% 45.7% - 49.5% 47.8% -
Preventivecare revenue from B2B segment (%) 41.0% 38.8% - 41.1% 41.3% -
Preventivecare revenue from B2C segment (%) 90.8% 88.3% - 90.7% 88.7% -
Revenue - East/ revenue (%) 17.3% 18.0% - 17.3% 17.3% -
Revenue - West/ revenue (%) 27.9% 29.1% - 26.9% 29.5% -
Revenue - South/ revenue (%) 26.0% 28.0% - 25.8% 29.8% -
Revenue - North/ revenue (%) 28.3% 24.3% - 29.6% 22.8% -
Revenue - others/ revenue (%) 0.5% 0.6% - 0.4% 0.5% -
Gross margins/ total revenue (%) 71.8% 72.5% - 69.5% 72.1% -
Employee benefits expense/ total revenue (%) 8.1% 10.1% - 8.0% 9.7% -
Other expenses/ total revenue (%) 21.2% 21.8% - 20.1% 21.7% -
EBITDA margins/ total revenue (%) 42.5% 40.6% 5% 41.4% 40.7% 2%
Profit after tax / total revenue (%) 28.4% 14.2% - 28.7% 3.5% -
Effective tax rate - Tax/ PBT 33.2% - 31.0% -
Current ratio * 8.8 6.6 35% 8.8 6.6 35%
Return on capital employed (ROCE) $ 64.6% 49.1% 32% 30.3% 26.3% 15%
Price/ earnings, end of the reproting period $ 79.53 NA - 158.19 NA -
Market capitalisation/ total revenue, end of the reporting period $ 22.58 22.48 - 45.26 42.26 -
# previous period revenue, expenses and profits adjusted for internal arrangements
* represents number of times
RoCE = Profit before exceptional items and tax / (Tangible assets + Capital work-in-progress + Inventories + Trade receivables + Short term loans and advances + Other current assets – Current liabilities)
$ earning or total revenue considered for the respective period only
Nueclear Standalone

Standalone Financials - NueclearNueclear Healthcare Limited Nueclear Healthcare Limited
Standalone P&L (INR mn) Balance sheet data (INR mn)
Particulars Year to Date # YoY Growth 3 months ended # YoY Growth Particulars
30 Sep 17 #30 Sep 16 30 Sep 17 #30 Sep 16 30 Sep 17 30 Sep 16
Revenue from operations 118.66 89.51 33% 62.50 47.42 32% Cash and cash equivalents 7.21 37.31
Cost of Materials consumed/ sales 21.82 16.34 34% 9.91 8.10 22% Current investments - 113.60
Gross margins 96.84 73.17 32% 52.58 39.32 34% Trade receivables 3.73 2.71
Operating expenses : Property, plant and equipments 643.07 596.39
Employee benefits expense 12.32 8.13 51% 6.32 4.29 47% Non-current investments - -
Finance cost 0.29 - 0.29 - Other assets 299.33 175.63
Depreciation and amortisation expense 36.86 28.33 30% 20.10 14.26 41% Total assets 953.34 925.65
Other expenses 65.17 59.12 10% 30.85 33.05 -7% Total liabilities 177.30 138.43
Total operating expenses 114.64 95.59 20% 57.56 51.60 12% Total equity 776.05 787.23
Operating loss (17.79) (22.42) -21% (4.98) (12.29) -59% Total liabilities and equity 953.34 925.65
Other income, net 8.74 14.54 7.55 1.23
Exceptional items - - - -
(Loss) before taxes (9.05) (7.88) 2.57 (11.06)
Income tax and deferred tax 9.61 - 9.61 -
Net profit 0.56 (7.88) 12.18 (11.06)
Earnings per equity share
Basic 0.01 (1.45) 1.10 (1.37)
Diluted 0.01 (1.45) 1.10 (1.37)
# Previous period figures are normalized for the adjustment of revenue/ cost of imaging business.
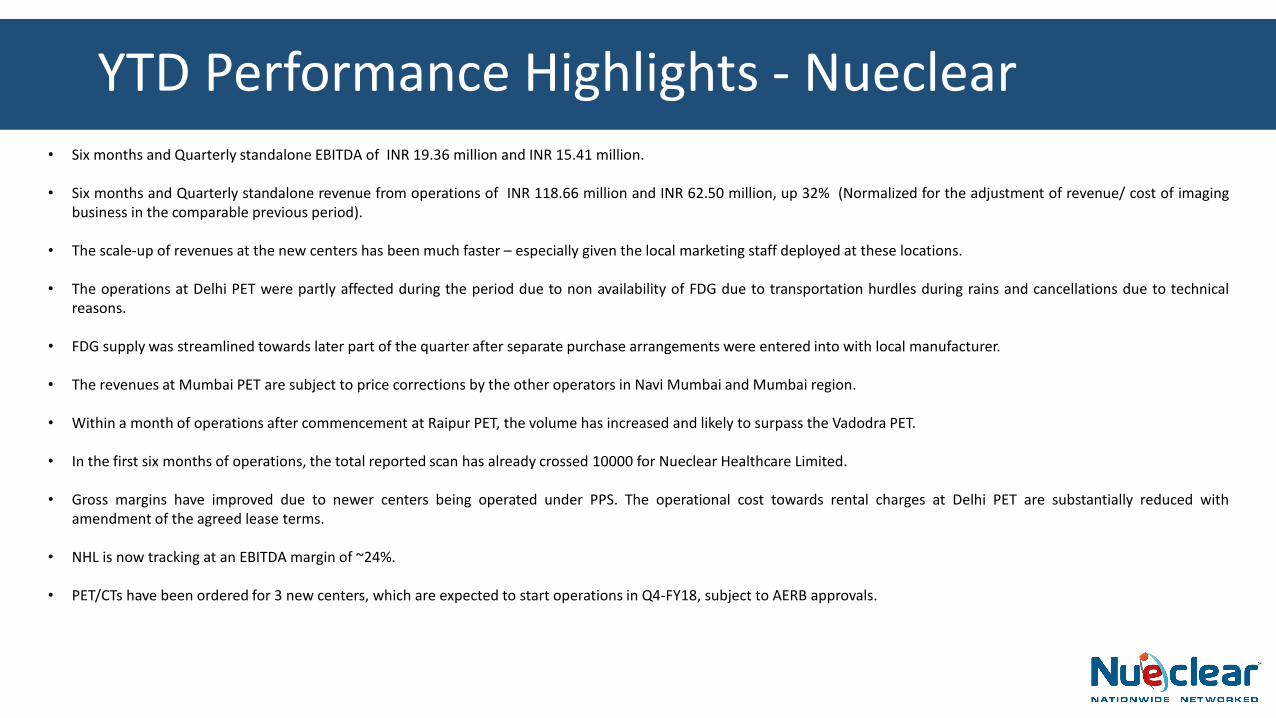
YTD Performance Highlights - Nueclear• Six months and Quarterly standalone EBITDA of INR 19.36 million and INR 15.41 million.
• Six months and Quarterly standalone revenue from operations of INR 118.66 million and INR 62.50 million, up 32% (Normalized for the adjustment of revenue/ cost of imagingbusiness in the comparable previous period).
• The scale-up of revenues at the new centers has been much faster – especially given the local marketing staff deployed at these locations.
• The operations at Delhi PET were partly affected during the period due to non availability of FDG due to transportation hurdles during rains and cancellations due to technicalreasons.
• FDG supply was streamlined towards later part of the quarter after separate purchase arrangements were entered into with local manufacturer.
• The revenues at Mumbai PET are subject to price corrections by the other operators in Navi Mumbai and Mumbai region.
• Within a month of operations after commencement at Raipur PET, the volume has increased and likely to surpass the Vadodra PET.
• In the first six months of operations, the total reported scan has already crossed 10000 for Nueclear Healthcare Limited.
• Gross margins have improved due to newer centers being operated under PPS. The operational cost towards rental charges at Delhi PET are substantially reduced withamendment of the agreed lease terms.
• NHL is now tracking at an EBITDA margin of ~24%.
• PET/CTs have been ordered for 3 new centers, which are expected to start operations in Q4-FY18, subject to AERB approvals.

Key Financial Trends - Nueclear
42.3 47.4 46.8 47.6
56.2
62.5
Q1 Q2 Q3 Q4
Revenue (INR mn)
FY17 FY18
4.3
1.8 0.3
1.8
4.0
15.4
Q1 Q2 Q3 Q4
EBITDA (INR mn)
FY17 FY18
10%
4%1%
4%7%
25%
Q1-FY17 Q2-FY17 Q3-FY17 Q4-FY17 Q1-FY18 Q2-FY18
EBITDA Margin

Center Level and Operating MetricsNueclear Healthcare Limited
(Rs. in million, except number of scans)
Particulars Year to DateYear-on-Year
Growth (%)3 months ended
Year-on-Year Growth (%)
September 30, 2017
September 30, 2016
September 30, 2017
September 30, 2016
Revenue PETCT wise 110.91 79.75 39% 57.85 42.27 37%
Delhi 35.67 35.27 1% 17.94 18.60 -4%
Mumbai 36.50 33.25 10% 18.32 17.37 5%
Hyderabad 14.07 10.35 36% 7.29 5.42 35%
Surat 15.16 0.88 0% 8.21 0.88 -
Vadodra 6.30 - - 2.21 - -
Raipur 3.22 - - 3.18 - -
Number of scans PETCT wise 11455 9,187 25% 5,751 4,825 19%
Delhi 3,932 4,406 -11% 1,842 2,305 -20%
Mumbai 3,805 3,622 5% 1,838 1,891 -3%
Hyderabad 1,464 1,110 32% 739 580 27%
Surat 1,291 49 - 692 49 -
Vadodra 762 - - 441 - -
Raipur 201 - - 199 - -
Gross margins/ total revenue (%) 81.6% 81.7% - 62.9% 0.7% -
Employee benefits expense/ total revenue (%) 10.4% 9.1% - 10.1% 9.1% -
Other expenses/ total revenue (%) 54.9% 66.1% - 49.4% 69.7% -
EBITDA margins/ total revenue (%) 16.3% 6.6% 24.7% 4.2%
Current ratio * 2.1 1.5 2.1 1.5

Thank You


![FY17 results presentation - Thyrocare on... · FY17 results presentation Page | 1 Thyrocare Technologies Limited [Stock Code NSE/ BSE - THYROCARE] May 09, 2017 Registered Office :](https://static.fdocuments.net/doc/165x107/5f07dd6b7e708231d41f2358/fy17-results-presentation-on-fy17-results-presentation-page-1-thyrocare.jpg)