Thunderstorm distribution and frequency in Australia. Met. Mag. 51 (2002) 145-154 Thunderstorm...
20
Aust. Met. Mag. 51 (2002) 145-154 Thunderstorm distribution and frequency in Australia Y.Kuleshov, G. de Hoedt, W.Wright and A.Brewster National Climate Centre, Bureau of Meteorology, Melbourne, Australia (Manuscript received April 2001; revised February 2002) Abstract A recently updated Average Annual Thunder Day Map for Australia is presented. On the basis of this map, the distribution of thunderstorms over Australia is analysed in terms of the factors required for storm development. Thunderstorms are most frequent over the northern half of the country, and generally decrease southward, with lowest frequencies in southeast Tasmania. A secondary maximum is also apparent in southeast Queensland and over central and eastern New South Wales, extending into the northeastern Victorian highlands. Thunderstorm frequency does not, in general, appear to vary in any consistent way with rainfall. There appears to be no evidence of any widespread temporal trend in thunderstorm frequency. 1. Introduction Thunderstorms are spectacular but hazardous weather phenomena which, together with tropical cyclones and bushfires, top the list of concerns in the Bureau of Meteorology’s Severe Weather Warning Services Program. Insurance-related claims arising from thunderstorms (wind, hail and flash flood damage) from 1967 to 1999 amount to about $A5 billion (Insurance Council of Australia, 2000). The Sydney hailstorm of 14 April 1999 inflicted over $A1.7 billion of insurance losses, and was but one of a series of severe hailstorms to bombard Sydney and other parts of the eastern seaboard over the past 100 years. There have been 650 registered fatalities in Australia in the period 1803-1992 caused by lightning strikes (Coates, 1996). Protection of people and property from thunderstorms is therefore of great concern. The Bureau of Meteorology was invited by Standards Australia (Committee EL/24 – Protection Against Lightning) to participate in revision of the standard for Lightning Protection (AS 1768-2002/NZS/AS 1768-2002 Lightning Protection, 2002). The Committee’s attention was particularly focussed on overhauling the risk assessment procedure which, of course, depends heavily on lightning incidence. Recently, high quality lightning data has become available from a variety of sources (described below), but as yet there is an insufficient long period of data on which to base reliable averages. For this reason, lightning activity continues for the present to be represented by thunderstorm frequency, which is routinely recorded at meteorological observation sites. Thunderstorm occurrence at a particular location is usually expressed as the number of days in a calendar year when thunder was heard, averaged over several years. The Bureau of Meteorology last produced an Average Annual Thunder Day Map for Australia in 1967, based on the period 1954 - 1963, and it is the purpose of this paper to present and discuss an updated map. Corresponding author address: Y.Kuleshov, National Climate Centre, Bureau of Meteorology, GPO Box 1289K, Melbourne, Vic. 3001, Australia E-mail: [email protected]
Transcript of Thunderstorm distribution and frequency in Australia. Met. Mag. 51 (2002) 145-154 Thunderstorm...
Aust. Met. Mag. 51 (2002) 145-154
Thunderstorm distribution and frequency in Australia
Y.Kuleshov, G. de Hoedt, W.Wright and A.Brewster National Climate Centre, Bureau of Meteorology, Melbourne, Australia
(Manuscript received April 2001; revised February 2002) Abstract A recently updated Average Annual Thunder Day Map for Australia is presented. On the basis of this map, the distribution of thunderstorms over Australia is analysed in terms of the factors required for storm development. Thunderstorms are most frequent over the northern half of the country, and generally decrease southward, with lowest frequencies in southeast Tasmania. A secondary maximum is also apparent in southeast Queensland and over central and eastern New South Wales, extending into the northeastern Victorian highlands. Thunderstorm frequency does not, in general, appear to vary in any consistent way with rainfall. There appears to be no evidence of any widespread temporal trend in thunderstorm frequency. 1. Introduction Thunderstorms are spectacular but hazardous weather phenomena which, together with tropical cyclones and bushfires, top the list of concerns in the Bureau of Meteorology’s Severe Weather Warning Services Program. Insurance-related claims arising from thunderstorms (wind, hail and flash flood damage) from 1967 to 1999 amount to about $A5 billion (Insurance Council of Australia, 2000). The Sydney hailstorm of 14 April 1999 inflicted over $A1.7 billion of insurance losses, and was but one of a series of severe hailstorms to bombard Sydney and other parts of the eastern seaboard over the past 100 years. There have been 650 registered fatalities in Australia in the period 1803-1992 caused by lightning strikes (Coates, 1996). Protection of people and property from thunderstorms is therefore of great concern. The Bureau of Meteorology was invited by Standards Australia (Committee EL/24 – Protection Against Lightning) to participate in revision of the standard for Lightning Protection (AS 1768-2002/NZS/AS 1768-2002 Lightning Protection, 2002). The Committee’s attention was particularly focussed on overhauling the risk assessment procedure which, of course, depends heavily on lightning incidence. Recently, high quality lightning data has become available from a variety of sources (described below), but as yet there is an insufficient long period of data on which to base reliable averages. For this reason, lightning activity continues for the present to be represented by thunderstorm frequency, which is routinely recorded at meteorological observation sites. Thunderstorm occurrence at a particular location is usually expressed as the number of days in a calendar year when thunder was heard, averaged over several years. The Bureau of Meteorology last produced an Average Annual Thunder Day Map for Australia in 1967, based on the period 1954 - 1963, and it is the purpose of this paper to present and discuss an updated map. Corresponding author address: Y.Kuleshov, National Climate Centre, Bureau of Meteorology, GPO Box 1289K, Melbourne, Vic. 3001, Australia E-mail: [email protected]

2. Data A number of possible methods were considered for developing a thunderstorm climatology. What follows is a summary of these different approaches. LPATS data Lightning Position and Tracking System (LPATS) data directly measures lightning flash location density, and as such is a highly desirable method. In this technique, the position of the strikes is determined from differences in the time of arrival of the radio frequency disturbance caused by the lightning flash at each of a network of sensors. The detection method is described in detail by Bent and Lyons (1984) and Cummins and Murphy (2000). LPATS data allows the production of a lightning ground flash density map (which shows the number of ground flashes per square km per year), the product most directly applicable to engineering calculations of lightning risk. Global Position and Tracking Systems Pty Ltd (GPATS) supplies the Bureau of Meteorology with lightning data to help it fulfil its various obligations under the terms of the Meteorology Act 1955, including the provision of weather forecasts, severe weather monitoring and warnings, and as support material for case studies and research documents. At present the archive currently contains just a few years of LPATS data, and this was regarded as insufficient to produce a reliable climatology (for which at least 10 years of data would be necessary). Lightning flash counter network Another possible option for the creation of a lightning climatology was to use the Bureau’s lightning flash counter network. The Bureau maintains this network in order to obtain regional estimates of ground flash density. The Australian network of about 40 stations provides monthly and annual data for each year, and also annual averages. Unfortunately, distribution over Australia is not even – the majority of sites are along the coast and very few are inland. Moreover, technical characteristics of counters are such that only lightning flashes in the vicinity of sites are detected, and accepted values of the effective range of the counter to cloud flashes and ground flashes are 20 and 30 km respectively (Mackerras, pers. comm.). Such a restricted spatial distribution creates difficulties in preparing a reliable lightning climatology map. There is an additional issue with conversion to ground flash density. This requires estimates to be made of the ratio of the frequency of occurrence of cloud flashes, Nc, to ground flashes, Ng, for each region. Values of Nc/Ng are estimated to vary widely, from 2 to 7 over the range of latitudes in Australia (Prentice and Mackerras, 1977; Mackerras and Darveniza, 1994). So even if conversion factors are established for particular locations, the extrapolation of results to nearby areas could give misleading results. For these reasons, it was decided not to include data from the lightning flash counter network into the analysis. Satellite remote sensing data Deriving a lightning ground flash density map from satellite remote sensing data was also considered. Data from satellite-borne NASA instruments – the Optical Transient Detector and Lightning Imaging Sensor – along with some products derived from
such data (for example lightning ground flash frequencies for the Australian capital cities, and a derived Average Lightning Ground Flash Density Map for Australia) were assessed (Kuleshov and de Hoedt, 2001). Advantages (studying global lightning patterns) and limitations of both instruments were considered. It was decided that the limitations of the systems (polar orbiting platforms cannot maintain a continuous watch on the Australian continent; efficiency of detection varies from 40% to 90%; only 3 to 5 years of records) made satellite data unsuitable for preparing a reliable climatology at this stage. However satellite remote sensing data were used for verification purposes, identifying areas of high, moderate and low lightning activity during preparation of the updated Average Annual Thunder Day Map. National Climate Centre (NCC) climatological records The Bureau’s climate sites provide a good coverage of the country, except in sparsely populated areas. Sufficient length of record of thunderstorm occurrence is held on computer media, and records are largely complete. On the other hand, analysis revealed some difficulties with the data, in particular, that under-reporting of thunderstorms was a problem, especially at co-operative stations which don’t do a full program of observations. After consideration of all possible options the decision was made to update the Average Annual Thunder Day Map of Australia on the basis of the NCC climatological records, subject to the screening procedures described below. It should be noted that, because of the tendency for under-reporting alluded to above, actual thunder-day frequency may be underestimated in some areas. 3. Data Set Preparation and Quality Control There are approximately 1,400 sites on the NCC data archive with thunder-day data. However, reliability of data for many sites appears doubtful, especially in the earlier years of record. An extensive examination of the sites was made within NCC, including, inter alia, comparisons with satellite remote sensing data and rainfall data, and inspection of time series of thunder days over the period 1960 – 1999. We also consulted extensively with the individual State-based Regional Offices of the Bureau of Meteorology, in order to obtain a local perspective on what were and were not, reliable sites. About 80% of sites were rejected during this quality control process. At a preliminary stage of this analysis, a map for the longer-term period 1970-99 (not shown) was produced. This showed lower values – in some areas, substantially lower values – than the eventual 1990-99 period map. As there were doubts about the data prior to 1988 due to changing observation practices (see Appendix), we believe that the recorded thunderstorm occurrence data prior to this time represents a significant underestimate of actual numbers. For this reason, we based our analysis on the period 1990-99, over which observation techniques were, although still not perfect (there was evidence of a general difference in quality between Bureau and non-Bureau stations), at least consistent. It is, however, recognised that the 1990s will not necessarily provide an adequate representation of thunderstorm frequency in some parts of the country. For instance, the long El Nino-related drought that affected rainfall over central and southeastern

Queensland, and northeastern New South Wales, in the period 1990-95, may have resulted in the analysed frequencies being artificially low in these areas. 4. Mapping and Analysis Figure 1 shows the geographical distribution of the thunder-day sites used in the analysis. For the 10-year period 1990-99, approximately 300 sites were deemed to be of sufficient quality to be used in the analysis. The analysis method used to produce a gridded field was the Barnes interpolation scheme (Koch et al., 1983). The Barnes technique is currently routinely used in the Bureau of Meteorology for the real-time analysis of rainfall and temperature for periods ranging from one day to three years (Jones and Weymouth, 1997). The analysis was performed at a spatial grid resolution of 0.25o x 0.25o and a 5 point binomial box smoother was applied to the interpolated grid. The interpolated grid was then imported into the Arc/Info GIS (geographic information system) and a line-smoothing algorithm was applied as part of the mapping process. 5. Nature and Distribution of Thunderstorms Figure 2 shows the annual average frequency of thunder-days over Australia for the period 1990-99. Clearly thunderstorms are most frequent over the northern half of the country, and generally decrease southward, with lowest frequencies in southeast Tasmania. A secondary maximum is also apparent in southeast Queensland and over central and eastern New South Wales, extending into the northeastern Victorian high country. To understand this distribution, it is important to note that thunderstorm development generally requires three factors: 1) An unstable atmosphere, with generally high surface temperatures and a strong
vertical lapse rate (i.e., temperature falls rapidly with height), which provides a favourable environment for the strong vertical atmospheric motions that produce thunderstorms.
2) A trigger for this vertical motion, such as low level convergence of airstreams, a frontal system, local differences in heating or orography.
3) High atmospheric moisture levels. High moisture levels, especially near the coast, affect the tropical north of Australia in the summer half of the year. Lower pressure lies across northern and central Australia, and gives rise to the vertical motion and low level convergence that favour thunderstorm development. The northern half of Australia is thus very favourable for thunderstorms in the warmer months October through March (see Figure 3), and especially in the far north, thunderstorms are frequent and often associated with heavy rainfall and intense lightning. The peak frequency is in the vicinity of Darwin, with over 80 thunder-days a year. In the remainder of the year dry, stable outflow from the subtropical high pressure belt, which normally lies over the continent, inhibits convective showers and storms.
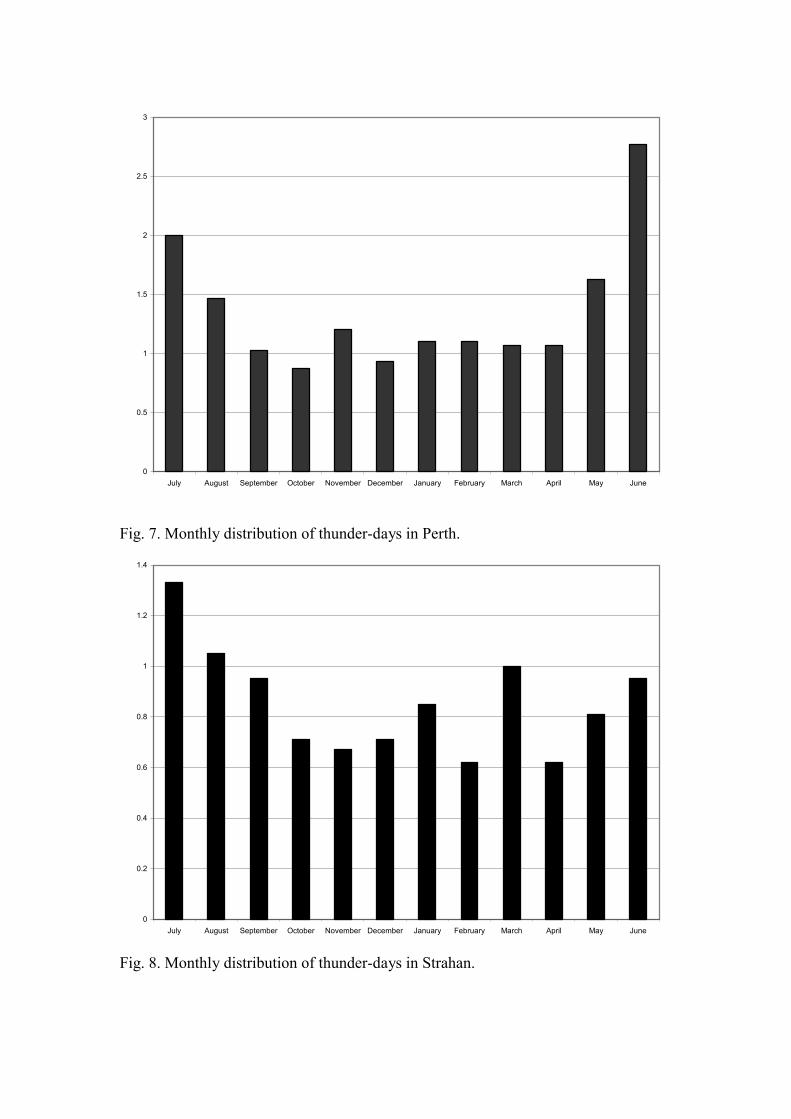
Frequencies generally decrease in the southern parts of the tropics and the adjacent desert areas of central Australia. This is because the air, though often very hot, is generally drier. The exception appears to be over inland western Australia where a wide area experiences over 30 thunder days a year. However, many of these would be so-called “dry” thunderstorms, with little or no rain, because low-level relative humidity tends to be low and acts to evaporate any falling precipitation. There is, also, some doubt about the actual frequency of storms in this area, because recording stations are very sparse (Fig. 1) – in the absence of any other recording stations, it is assumed that the values at the two isolated stations in inland Western Australia are broadly representative of activity over a broad area. Again thunderstorms are heavily concentrated in the summer half-year (Fig. 4). A curious aspect of the distribution is the relatively low frequency of storms (less than 25 days a year) along parts of the Queensland coast, especially in the very wet section between Cooktown to south of Innisfail. This is the wettest part of Australia, yet thunder-days are less frequent than in most remaining areas of the tropics. The reasons for this are not straightforward, but lie in the fact that most of the rainfall in this area comes from moist, southeasterly flow from the Coral Sea, which gives rise to frequent showers, but relatively few thunderstorms. The secondary thunderstorm maximum over the eastern States is again mainly a warmer half-year phenomenon (Fig. 5), and is generated by a combination of moisture from the Coral and Tasman Seas, and low level convergence into low pressure troughs, a frequent occurrence over the area in the summer half of the year. Orography also plays a part, with local maxima over the Great Dividing Range. Many of these thunderstorms are severe, with large hail, flash flooding, strong wind-squalls and even tornadoes, particularly in the late spring and summer months. This is because instability over this area is often accentuated by cold pools in the upper atmosphere originating from higher latitudes, and/or strong wind-shears. By contrast, tropical thunderstorms seldom produce large hail or tornadoes, although they do produce intense rainfall and sometimes locally severe wind squalls. Thunderstorms are less frequent in Victoria, Tasmania, and the southern parts of Western and Southern Australia, with less than 10 days a year in some areas. This is partly because of the relatively lower incidence at these latitudes of the warm, humid air masses favourable for storm development, but also because during the potentially favourable warmer months, the subtropical high pressure belt lies over or near this area, giving rise to stable conditions unconducive to thunderstorm development. There is a local maximum of activity over the high country of northeastern Victoria and the Snowy Mountains, which appears to be mainly an orographic effect. Thunderstorms are again most frequent in the warmer months, but some occur in association with active cold frontal systems in the winter-spring months (see, for instance, the histogram for Melbourne in Fig. 6). In contrast with most other parts of Australia, the histogram for Perth (Fig. 7) indicates a winter maximum in thunderstorm frequency. This reflects the prevalence at this time of active frontal systems, which produce a winter rainfall maximum along the southwest coast, whereas the summer months are generally hot and dry. A similar feature is apparent in western Tasmania (Fig. 8), with again a weak maximum in winter activity. By contrast, Hobart (Fig. 9), shielded by topography from the frontal
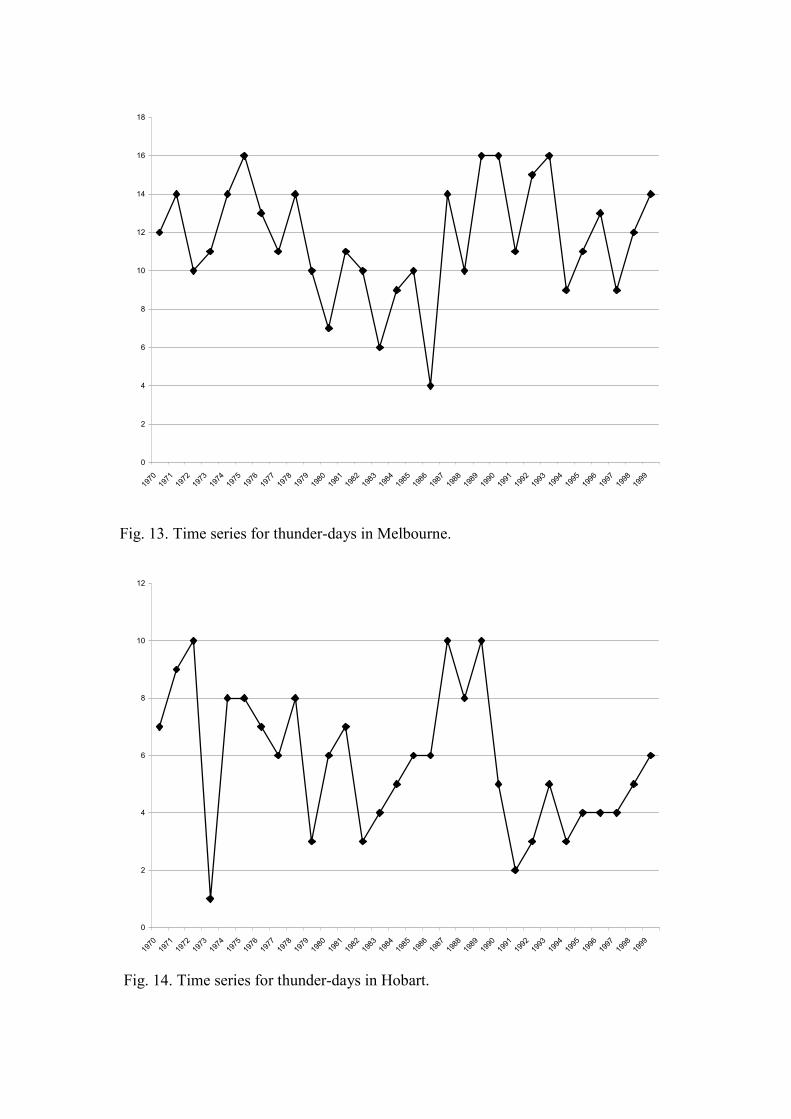
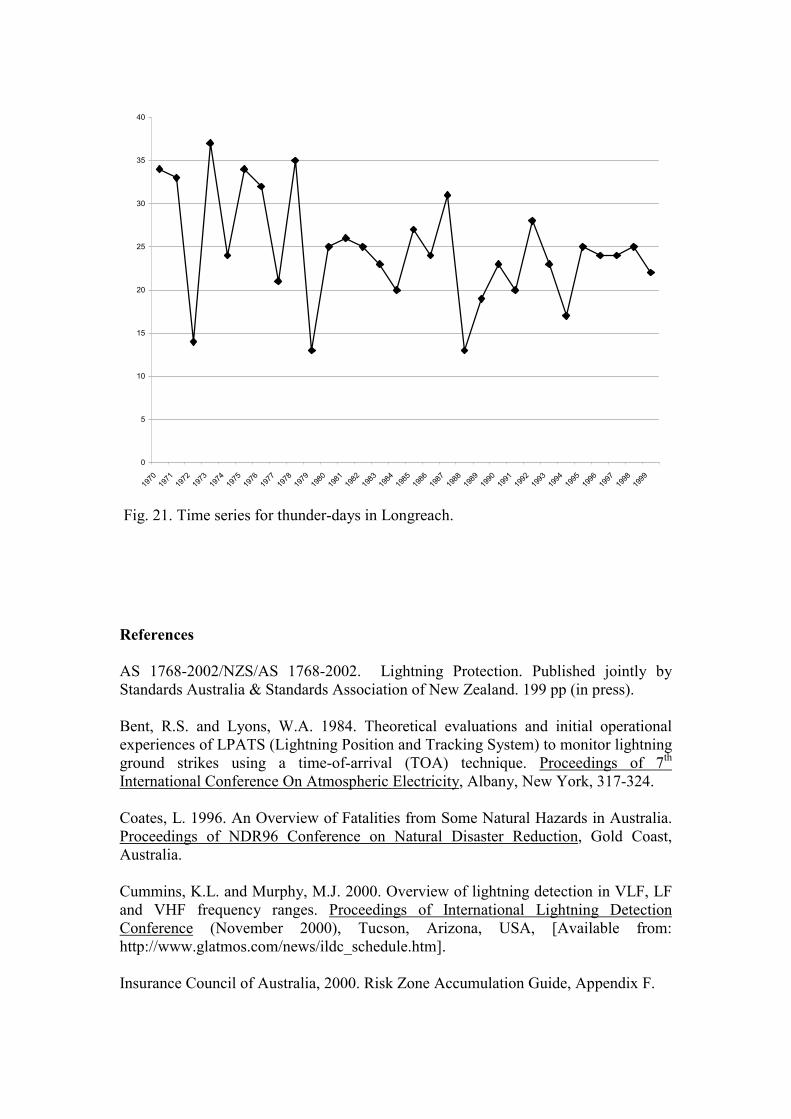
systems of the winter westerlies, shows a summer maximum. In fact thunderstorms in Hobart are rare in the cooler months, with an average of less than one thunder-day for the entire April-September period. Distribution with time: Figures 10 through 21 show time series plots of thunder-days at the capital cities from 1970-1999, along with Alice Springs, Halls Creek and Longreach. The latter stations are included to represent inland areas, and the intention is to provide a broadly representative sample of how thunderstorm frequency has changed with time over the past 30 years in different parts of the country. A comparison of thunder-day frequency graphs with what is known of rainfall variations over the period 1970-1999 indicates that, perhaps surprisingly, thunderstorm frequency does not, in general, appear to vary in any consistent way with rainfall. In particular, the 1970s - especially the period 1971-76 - is known to be easily the wettest decade of the 20th Century over much of Australia (Wright, 2001). Yet while the time-series for Elcho Island (Fig. 19) and Longreach (Fig. 21) indicate more frequent thunderstorms in the 1970s at those stations, there was no such tendency over much of the remainder of northern Australia (see plots for Darwin, Brisbane, Alice Springs and Halls Creek – Figs. 10, 11, 18 and 20). If anything, storms seemed to have been less frequent during this wet period than at some other times. On the other hand, in southeastern Australia thunderstorms were more frequent in Melbourne (Fig. 13) during the relatively wet summers of the 1970s and the early 1990s, and over Adelaide (Fig. 15) in the latter period. In Sydney, the 1980s appear to have been a period of reduced activity (Fig. 12), while in Hobart (Fig. 14) a peak in the late 1980s appears to have been followed by relatively low activity in the early 1990s. There also appears to be no consistent tendency for peaks and troughs in thunderstorm frequency to coincide with El Niño events (1972, 1977, 1982, 1987, 1991, 1994, 1997), or La Niña events (1971, 1973-75, 1981, 1988, 1996, 1998-99), though there is some evidence that thunderstorms tended to be less frequent over southeastern Australia (Sydney, Adelaide and Canberra – Fig. 12, 15 and 17) in the strong El Niño year of 1982, and over Perth (Fig. 16) in the moderate to strong El Niño year of 1994. There appears to be no evidence of any widespread trend in thunderstorm frequency. Summary and concluding remarks In this paper we have described the preparation of an updated map of thunderstorm incidence over Australia, including an analysis of the meteorological factors influencing the spatial distribution. We have also described seasonal trends, and – with less confidence – long-term fluctuations in thunderstorm behaviour. The data used in constructing the map were not ideal, in that
a) changing recording practices over the past 50 years has affected data homogeneity;
b) an apparent difference in quality exists between Bureau and non-Bureau stations (suggested by apparent “bullseyes”in the analysis);

c) there are large areas without data, especially over the inland; and d) because of concerns about the homogeneity of the data, the period used was
only 10 years. The last point applies particularly to much of Queensland and northern New South Wales, which suffered an extended El Nino drought from 1990-95, so that the 1990s might be unrepresentative of the longer term. Overall we believe that the map produced is an adequate representation of the general pattern of thunderstorm frequency in Australia (albeit with a tendency to underestimate actual frequency in some areas), but that caution should be used in attempting to interpolate to local areas. Ideally, such a map would be better produced from lightning data, since lightning data have obvious practical applications to many industries, and remote sensing techniques (such as GPATS) allow much greater coverage and density of observations of a phenomenon that by its nature can be very localized. Unfortunately, an insufficient period of data was available for this analysis. Moreover, to properly study long-term variations and trends in thunderstorm frequency, many years of quality data would be required. This is important, given the global concerns about potential climate change, and the need to dissociate these from the multi-decadal climate fluctuations that exist in other climate variables (Wright, 2001). Appendix At some time in the early 1960s (examination of the data points to 1963), reporting practices changed. Prior to the change, thunderstorms had to be within five miles of a station to be reported. Following the change, the hearing of thunder became the criterion – leading to an artificial increase in thunderstorm frequency. Prior to September 1987, except at Bureau of Meteorology stations, only the 9am and 3pm observations were archived electronically. Thus a station could have reported a thunderstorm in its current or past weather at another synoptic hour without it appearing in the current or past weather section of the 9am or 3pm observations. This gap should, in theory, not have caused problems, since thunderdays were counted in the “phenomena” section of the field book if any observation reported thunder. However it seems likely (on the basis of analyses comparing the 1990-99 and 1970-99 periods) that not all the storms were picked up. Further problems with the phenomena section occur because prior to 1964 (approx.) the “phenomena” section of the field book was marked “For office use only” and entries (of phenomena) were made during the manual fieldbook processing. At a later stage, this procedure was changed so that the observer made the entry in the “phenomena” section, and it appears that this change may on some occasion have resulted in neither party making the correct entry. Acknowledgments. We acknowledge with gratitude the contribution of Climate and Consultancy sections from the Bureau of Meteorology Regional Offices and of staff in the Bureau’s Data Management, Data Services, Climate Analyses and Consultative Services sections of

the National Climate Centre, as well as the Observations and Engineering Branch. We thank the NASA/Marshall Space Flight Centre, Global Hydrology and Climate Center, USA for providing OTD and LIS data and Professor M. Darveniza and Dr. D. Mackerras of the University of Queensland, Australia for providing data from Lighting Flash Counters and valuable discussions. In addition, we would like to specially acknowledge Robin Hicks of the Bureau of Meteorology’s Services Policy Branch who made an extensive survey of the quality of thunder day data held in the Bureau archives and provided us with invaluable information on thunder day reporting practices.
Recording stations used in the 1990 - 1999 (period) annual
thunder day analysis
GeraldtonMorawa
PERTH
Wagin
Albany
Carnarvon
Port Hedland
Three Rivers
Meekatharra
Wiluna
BroomeHalls Creek
Giles
Kalgoorlie-Boulder
Balladonia
Esperance
Elliston
Ceduna
ADELAIDE
Tarcoola
Marree
Alice Springs
Tennant Creek
Katherine
DARWINNhulunbuy
Weipa
KowanyamaCooktown
Cairns
Innisfail
Townsville
Mackay
Normanton
Mount Isa
Boulia
Tibooburra
Ivanhoe
Mildura
MELBOURNE
Sale
Moruya Heads
SYDNEY
Newcastle
Dubbo
BRISBANEBollon
Charleville
Rockhampton
Longreach
HOBARTStrathgordon
Elcho Is.
ARNHEM LAND
CORAL SEA
TASMAN SEA
WESTERN
AUSTRALIA
SOUTH
AUSTRALIA
NORTHERN
TERRITORY QUEENSLAND
VICTORIA
NEW SOUTH WALES
TASMANIA
GR
EAT
DIV
IDIN
G R
AN
GE
Fig. 1. Geographical distribution of the thunder-day sites used in the analysis.
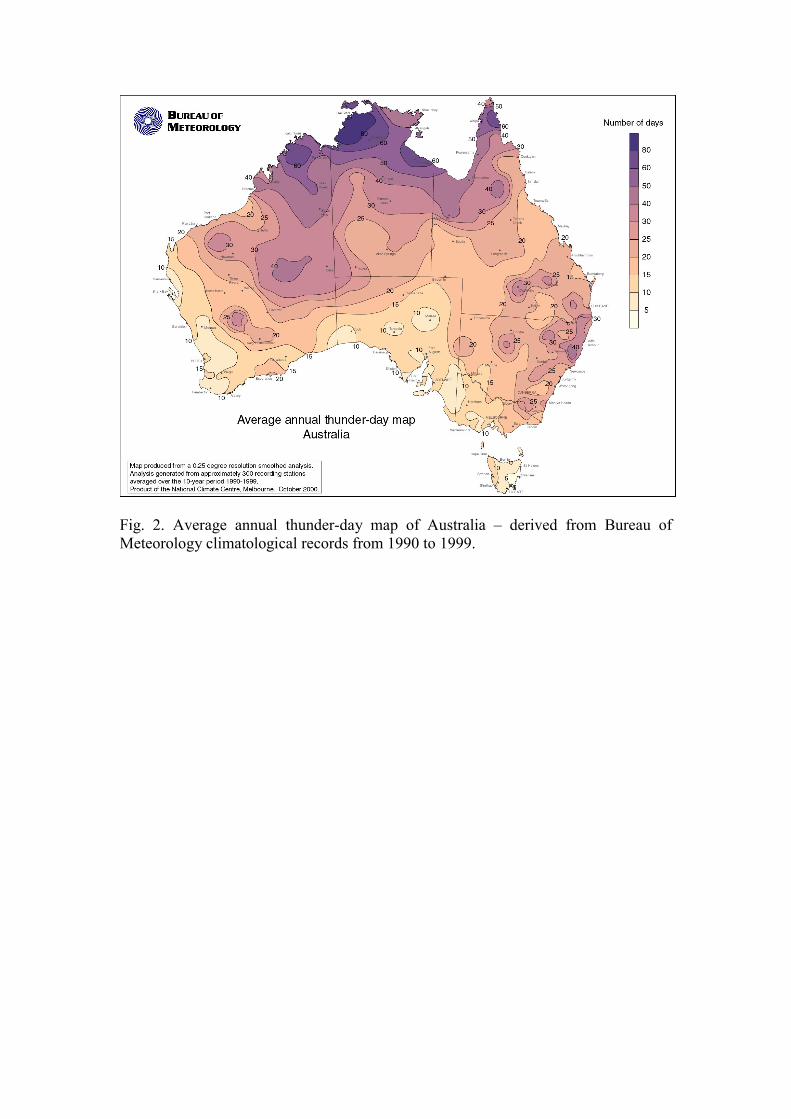
Fig. 2. Average annual thunder-day map of Australia – derived from Bureau of Meteorology climatological records from 1990 to 1999.

0
2
4
6
8
10
12
14
16
18
20
July August September October November December January February March April May June
Fig.3. Monthly distribution of thunder-days in Darwin.
0
1
2
3
4
5
6
July August September October November December January February March April May June
Fig. 4. Monthly distribution of thunder-days in Alice Springs.

0
0.5
1
1.5
2
2.5
3
3.5
4
4.5
July August September October November December January February March April May June
Fig. 5. Monthly distribution of thunder-days in Sydney.
0
0.5
1
1.5
2
2.5
July August September October November December January February March April May June
Fig. 6. Monthly distribution of thunder-days in Melbourne.
0
0.5
1
1.5
2
2.5
3
July August September October November December January February March April May June
Fig. 7. Monthly distribution of thunder-days in Perth.
0
0.2
0.4
0.6
0.8
1
1.2
1.4
July August September October November December January February March April May June
Fig. 8. Monthly distribution of thunder-days in Strahan.

0
0.2
0.4
0.6
0.8
1
1.2
1.4
July August September October November December January February March April May June
Fig. 9. Monthly distribution of thunder-days in Hobart.
0
20
40
60
80
100
120
140
1970
1971
1972
1973
1974
1975
1976
1977
1978
1979
1980
1981
1982
1983
1984
1985
1986
1987
1988
1989
1990
1991
1992
1993
1994
1995
1996
1997
1998
1999
Fig. 10. Time series for thunder-days in Darwin.

0
5
10
15
20
25
30
35
40
1970
1971
1972
1973
1974
1975
1976
1977
1978
1979
1980
1981
1982
1983
1984
1985
1986
1987
1988
1989
1990
1991
1992
1993
1994
1995
1996
1997
1998
1999
Fig. 11. Time series for thunder-days in Brisbane.
0
5
10
15
20
25
30
35
1970
1971
1972
1973
1974
1975
1976
1977
1978
1979
1980
1981
1982
1983
1984
1985
1986
1987
1988
1989
1990
1991
1992
1993
1994
1995
1996
1997
1998
1999
Fig. 12. Time series for thunder-days in Sydney.
0
2
4
6
8
10
12
14
16
18
1970
1971
1972
1973
1974
1975
1976
1977
1978
1979
1980
1981
1982
1983
1984
1985
1986
1987
1988
1989
1990
1991
1992
1993
1994
1995
1996
1997
1998
1999
Fig. 13. Time series for thunder-days in Melbourne.
0
2
4
6
8
10
12
1970
1971
1972
1973
1974
1975
1976
1977
1978
1979
1980
1981
1982
1983
1984
1985
1986
1987
1988
1989
1990
1991
1992
1993
1994
1995
1996
1997
1998
1999
Fig. 14. Time series for thunder-days in Hobart.

0
5
10
15
20
25
1970
1971
1972
1973
1974
1975
1976
1977
1978
1979
1980
1981
1982
1983
1984
1985
1986
1987
1988
1989
1990
1991
1992
1993
1994
1995
1996
1997
1998
1999
Fig. 15. Time series for thunder-days in Adelaide.
0
5
10
15
20
25
30
35
1970
1971
1972
1973
1974
1975
1976
1977
1978
1979
1980
1981
1982
1983
1984
1985
1986
1987
1988
1989
1990
1991
1992
1993
1994
1995
1996
1997
1998
1999
Fig. 16. Time series for thunder-days in Perth.

0
5
10
15
20
25
30
35
40
1970
1971
1972
1973
1974
1975
1976
1977
1978
1979
1980
1981
1982
1983
1984
1985
1986
1987
1988
1989
1990
1991
1992
1993
1994
1995
1996
1997
1998
1999
Fig. 17. Time series for thunder-days in Canberra.
0
5
10
15
20
25
30
35
40
1970
1971
1972
1973
1974
1975
1976
1977
1978
1979
1980
1981
1982
1983
1984
1985
1986
1987
1988
1989
1990
1991
1992
1993
1994
1995
1996
1997
1998
1999
Fig. 18. Time series for thunder-days in Alice Springs.

0
20
40
60
80
100
120
1970
1971
1972
1973
1974
1975
1976
1977
1978
1979
1980
1981
1982
1983
1984
1985
1986
1987
1988
1989
1990
1991
1992
1993
1994
1995
1996
1997
1998
1999
Fig. 19. Time series for thunder-days in Elcho Island.
0
10
20
30
40
50
60
70
80
1970
1971
1972
1973
1974
1975
1976
1977
1978
1979
1980
1981
1982
1983
1984
1985
1986
1987
1988
1989
1990
1991
1992
1993
1994
1995
1996
1997
1998
1999
Fig. 20. Time series for thunder-days in Halls Creek
0
5
10
15
20
25
30
35
40
1970
1971
1972
1973
1974
1975
1976
1977
1978
1979
1980
1981
1982
1983
1984
1985
1986
1987
1988
1989
1990
1991
1992
1993
1994
1995
1996
1997
1998
1999
Fig. 21. Time series for thunder-days in Longreach. References AS 1768-2002/NZS/AS 1768-2002. Lightning Protection. Published jointly by Standards Australia & Standards Association of New Zealand. 199 pp (in press). Bent, R.S. and Lyons, W.A. 1984. Theoretical evaluations and initial operational experiences of LPATS (Lightning Position and Tracking System) to monitor lightning ground strikes using a time-of-arrival (TOA) technique. Proceedings of 7th International Conference On Atmospheric Electricity, Albany, New York, 317-324. Coates, L. 1996. An Overview of Fatalities from Some Natural Hazards in Australia. Proceedings of NDR96 Conference on Natural Disaster Reduction, Gold Coast, Australia. Cummins, K.L. and Murphy, M.J. 2000. Overview of lightning detection in VLF, LF and VHF frequency ranges. Proceedings of International Lightning Detection Conference (November 2000), Tucson, Arizona, USA, [Available from: http://www.glatmos.com/news/ildc_schedule.htm]. Insurance Council of Australia, 2000. Risk Zone Accumulation Guide, Appendix F.

Jones, D. and Weymouth, G. 1997. An Australian Monthly Rainfall Dataset. Bureau of Meteorology Technical Report 70. Koch, S.E., DesJardins, M. and Kocin, P.J. 1983. An interactive Barnes objective map analysis scheme for use with satellite and conventional data. Jnl. Clim. Appl. Met., 22, 1487-1503. Kuleshov, Y. and de Hoedt, G. 2001. Measurements of Lightning by Optical Transient Detector. Analysis for Australian Region. Proceedings of the Australia Pacific Satellite Data Utilization and Exchange 3rd International Meeting (January 2001), Melbourne, Australia. Mackerras, D., and Darveniza, M. 1994. Latitudinal variation of lightning occurrence characteristics, J. Geophys. Res., 99, 10, 813-10,821. Prentice, S.A., and Mackerras, D. 1977. The ratio of cloud to cloud-ground lightning flashes in thunderstorms, J. Appl. Meteorol., 16, 545-550. Wright, W. 2001. A review of Australian climate in the 20th century. Proceedings of CLI-MANAGE Conference on Australian Climate Variability, Albury, NSW, 23-25 October 2000.