Three Simple Approaches for Estimating Births Averted Due ...
27
Three Simple Approaches for Estimating Births Averted Due to Contraception at the National Level Paper for the 2004 Annual Meeting of Population Association of America Session 161. Methodological Issues in Fertility Research Li Liu, Stan Becker, Amy Tsui, Saifuddin Ahmed The Johns Hopkins University
Transcript of Three Simple Approaches for Estimating Births Averted Due ...

Three Simple Approaches for Estimating Births Averted Due to
Contraception at the National Level
Paper for the 2004 Annual Meeting of Population Association of America
Session 161. Methodological Issues in Fertility Research
Li Liu, Stan Becker, Amy Tsui, Saifuddin Ahmed
The Johns Hopkins University

Three Simple Approaches for Estimating Births Averted Due to
Contraception at the National Level
Li Liu, Stan Becker, Amy Tsui, Saifuddin Ahmed
Abstract
Background: Estimates of births averted were generated frequently in the 1960s and 1970s to
assess family planning program effectiveness. However, such estimates have not been recently
available. This paper compares estimates of births averted from several approaches applied to
recent national data. Methodology: Three simple methods for estimating births averted are
presented. The first method is based on the relationship between the general fertility rate (GFR)
and contraceptive prevalence rate for all women (CPR(AW)). The second is based on the
relationship between total fertility rate (TFR) and CPR(AW), while the third method uses
Bongaarts’ proximate determinants model. Results: Estimates of births averted and the percent
change in births in the absence of contraception, based on the three methods, are fairly consistent.
Conclusion: The three methods provide reasonable estimates of births averted due to
contraceptive use by national populations.
Background
In the 1960s and 1970s methods for estimating and estimates of births averted were found
frequently in the literature on family planning program effectiveness (e.g. Mauldin, 1968; Prada-
Solas, 1975), but infrequently in recent years. Used primarily to measure the effectiveness of
contraceptive practice, estimates of pregnancies or births averted have enabled researchers and
family planning program managers to assess the impact of various contraceptive methods and

modes of service delivery. Practical applications of estimated births averted to calculate cost
savings can be found in state and national budgets in the U.S. and elsewhere (e.g.,
http://www.agi-usa.org/pubs/memo012604.pdf). The steady rise in contraceptive method use
globally implies that many unwanted pregnancies are being averted. At the same time there are
few or no studies with national estimates of births averted from contraception.
This paper compares estimates of births averted from several approaches applied to recent
national data. Previously published methods to calculate births averted are quite complicated
and are often tailored to specific contraceptive methods (e.g. Potter, 1969; Venkatacharya, 1971).
Three simple methods to estimate births averted due to contraceptive use are presented here and
estimates are made utilizing the latest data available from countries around the world. For the
purpose of comparisons, another indicator--percent increase in births in the absence of
contraception--is also used. Comparisons are made among the three methods.
A limitation of previous estimates of births averted is that virtually all have been based on data
for married women. For example, a recent analysis of the relationship between fertility and
contraceptive use was conducted using contraceptive prevalence of currently married/cohabiting
women (Ross, 1993). However, contraception is increasingly being used by individual women
and men outside of marriage. In fact, for some countries in Sub-Saharan Africa, a higher
proportion of women outside than inside marriage are using some form of contraception. Thus
modeling the relationship between contraception and the fertility level of currently married or
cohabiting women will underestimate the impact of contraceptive use. In this paper, we estimate

the contraceptive prevalence rate for all reproductive-aged women, in the process of estimating
births averted.
Methodology
Three simple methods of estimating births averted due to contraception are presented. The first
method is based on the observed linear relationship between the General Fertility Rate (GFR)
and contraceptive prevalence rate for all women (CPR(AW)). The second method is similarly
constructed using the observed linear relationship between the Total Fertility Rate (TFR) and
CPR(AW). The third method is based on Bongaarts’ proximate determinants model (Bongaarts,
1982). Note that for this method we utilize contraceptive prevalence rates for women who are in
a marriage or consensual union (CPR(CMW)), instead of CPR(AW), because this method has a
separate indicator for the effect of marriage.
Data sources
Data from 127 countries with population size above one million in 2002 were utilized for this
analysis. This represents 83% of all 153 countries with available contraceptive prevalence rates.
Twenty one countries with population less than one million were excluded*.
CPR(CMW), as well as the total fertility rates (TFR) for the most recent year were obtained from
the UN Population Division. The method-specific CPR, was obtained from the World
Contraception Use 2001 Data Sheet also of the United Nations. The TFR was adjusted to be in
the same age range as CPR(AW) for each country-- details are given in Appendix Table A1.
Also, if necessary, both the GFR and TFR were interpolated (or extrapolated) to obtain the

estimates for the same year as CPR(AW). The total number of births for each country is
calculated by multiplying the total population by the crude birth rate for the same year as the
CPR(AW). The total number of births for all 127 countries is also utilized for an overall
comparison. Age-specific fertility rates (ASFR) came from either the Demographic Yearbook,
the United Nations Population Division database or Demographic and Health Survey data. If
necessary, they were also interpolated to the same reference year as CPR(AW).
For the Bongaarts’ model, values of use-effectiveness of contraceptive methods were estimated
from failure rates given by Hatcher et al. (1994) for more developed countries (MDCs), and
borrowed directly from Bongaarts (1982) for less developed countries (LDCs). (See Appendix
Table A2).
Total contraceptive prevalence rates and prevalence by method for all reproductive-aged women
(CPR(AW) were obtained from DHS for countries if available. Data of CPR by marital status
were also available from the United Nations. Through these two sources 70 countries had
CPR(AW) available.
* Also Yugoslavia was excluded due to unavailability of other needed data. Another 4 countries (Finland, Belgium,
Norway and Belarus) were excluded because of irregular age groups for the contraceptive prevalence rates.

Estimation of CPR(AW)
CPR(AW) for other countries was estimated as follows. The 127 countries were divided into five
geographic groups: (1) Sub-Saharan Africa, (2) North Africa, (3) Asia, (4) Latin America,
Caribbean, Central America and South America, as well as (5) Europe, North America and
Oceania. CPR(CMW) is available for all 127 countries, so the ratio of CPR(AW)/CPR(CMW)
was calculated for countries with CPR(AW) also available within each of the five groups. Then
the means of the group-specific ratios were used to estimate the unknown CPR(AW) for county j
within that region. Specifically:
])(
)([*)()(
known
known
ijjCMWCPR
AWCPRMeanCMWCPRAWCPR = (1)
where, i indexes the region containing country j. Several assumptions underlie this method. First,
countries within each region are assumed to have the same CPR(AW)/CPR(CMW) ratios.
Second, the CPR(AW)/CPR(CMW) ratio does not change over time. With regard to the first
assumption, separate analyses showed that the CPR(AW)/CPR(CMW) ratios are nearly constant
within regions.
Calculation procedures of the three methods
1. Using GFR and CPR
First, the GFR was calculated from the crude birth rate, female population and total population:
CCBRGFR 49
15/= (2)
where C49
15 is the proportion of reproductive aged women in the population.
Then ordinary least squares (OLS) regression was conducted using CPR(AW) to predict GFR for
all 127 countries. Robust regression was used to underweight outliers or high influence points**.
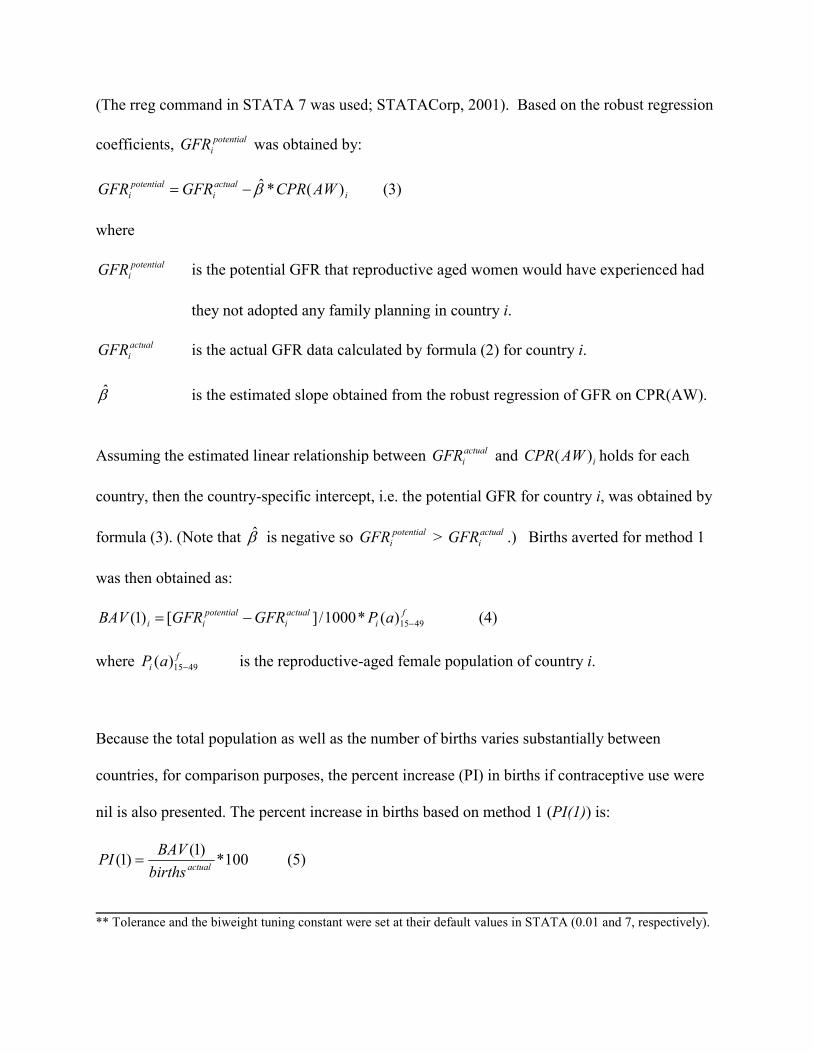
(The rreg command in STATA 7 was used; STATACorp, 2001). Based on the robust regression
coefficients, potential
iGFR was obtained by:
i
actual
i
potential
i AWCPRGFRGFR )(*β̂−= (3)
where
potential
iGFR is the potential GFR that reproductive aged women would have experienced had
they not adopted any family planning in country i.
actual
iGFR is the actual GFR data calculated by formula (2) for country i.
β̂ is the estimated slope obtained from the robust regression of GFR on CPR(AW).
Assuming the estimated linear relationship between actual
iGFR and iAWCPR )( holds for each
country, then the country-specific intercept, i.e. the potential GFR for country i, was obtained by
formula (3). (Note that β̂ is negative so potential
iGFR > actual
iGFR .) Births averted for method 1
was then obtained as:
f
i
actual
i
potential
ii aPGFRGFRBAV 4915)(*1000/][)1( −−= (4)
where f
i aP 4915)( − is the reproductive-aged female population of country i.
Because the total population as well as the number of births varies substantially between
countries, for comparison purposes, the percent increase (PI) in births if contraceptive use were
nil is also presented. The percent increase in births based on method 1 (PI(1)) is:
100*)1(
)1(actualbirths
BAVPI = (5)
____________________________________________________________________________________________
** Tolerance and the biweight tuning constant were set at their default values in STATA (0.01 and 7, respectively).

2. Using TFR and CPR
Similar OLS and robust regressions were conducted for TFR on CPR(AW). Then potentialTFR is
estimated by:
i
actual
i
potential
i AWCPRTFRTFR )(*β̂−= (6)
where,
potential
iTFR is the potential TFR that reproductive aged women would have experienced had
there been no family planning in country i.
actual
iTFR is the actual TFR for country i.
β̂ is the estimated slope obtained from the robust regression of TFR on CPR(AW).
Estimates of births averted were then obtained by two different methods. Births averted for
countries with age-specific fertility rates available (94 countries in total) was estimated by
method a; for those countries without ASFR available (33 countries in total), births averted was
calculated by method b. These two methods are:
a. For countries with ASFR available:
∑=
−=50
15
1000/]}[*)({)2(a
actualpotential ASFRASFRaPaBAV (7)
where,
P(a) is the number of women in age group a.
potentialASFR are the potential age-specific fertility rates women would have experienced had
there been no family planning. These are obtained by assuming the relative effect
of contraception is the same for all age groups, i.e.

actual
actual
potentialpotential ASFR
TFR
TFRASFR *= (8)
b. Countries without ASFR available. In this case only a more rough estimation is possible using
numbers of women in five-year age groups:
][*35
)](*1550
50[
)2(
5.47
5.17 actualpotentiala TFRTFR
aPa
bBAV −−
−
=∑= (9)
where, a is the mean age of each five-year age group (i.e. 17.5, 22.5 … and 47.5). In this formula,
the gap between potential TFR and actual TFR is multiplied by a weighted average of the
number of women in each age group with their remaining reproductive years as weights and then
divided by 35 to convert lifetime births averted into births averted in a year. The percent
increase in births (PI(2)) is obtained by a similar formula to formula (5).
3. Using Bongaarts intermediate fertility model
According to Bongaarts (1982), TFR is composed of four multiplicative elements which vary
between 0 and 1, and all multiplied by a hypothetical maximum fertility.
TFCCCCTFR ciam
actual ****= (10)
where, mC is the index of marriage, aC is the index of induced abortion, iC is the index of
postpartum infecundability, cC is the index of contraception, and TF is maximum fertility. cC
equals 1.0 in the absence of contraception and is set to 0.0 if all fecund women use 100%
effective contraception. The potential TFR without contraception would be:
TFCCCTFR iam
potential *1***= . To calculate cC , Bongaarts suggests using:
ueCc **08.11−= (11)
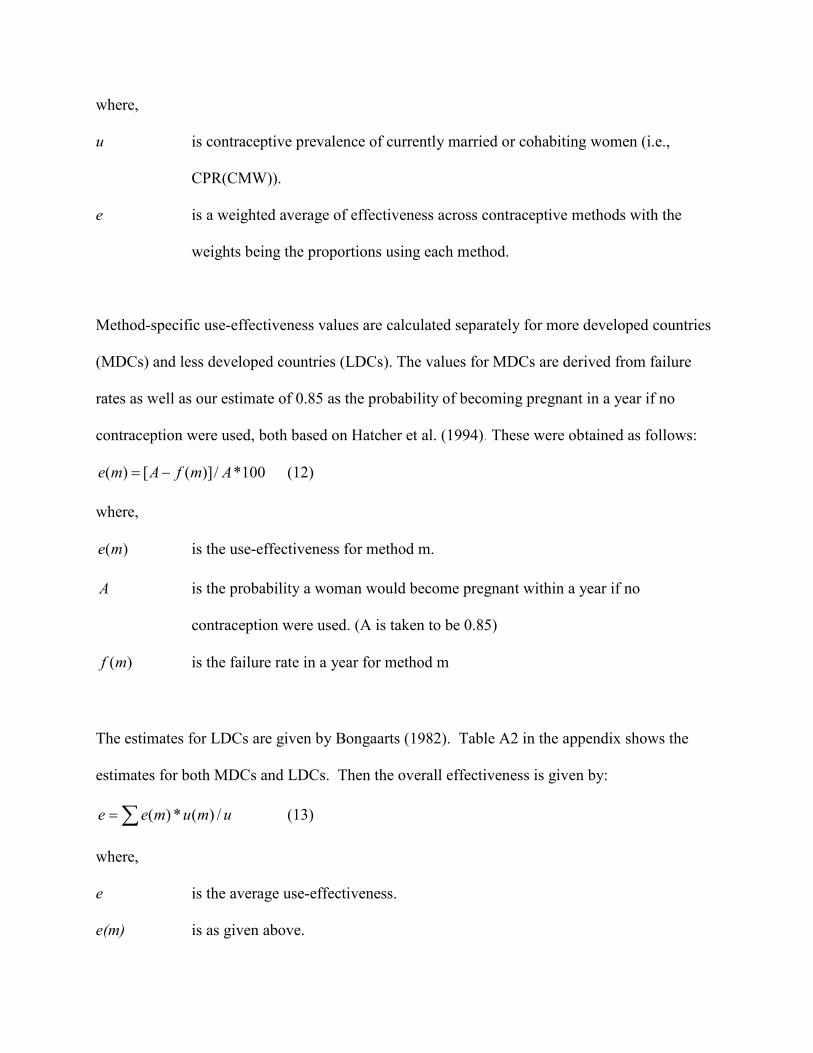
where,
u is contraceptive prevalence of currently married or cohabiting women (i.e.,
CPR(CMW)).
e is a weighted average of effectiveness across contraceptive methods with the
weights being the proportions using each method.
Method-specific use-effectiveness values are calculated separately for more developed countries
(MDCs) and less developed countries (LDCs). The values for MDCs are derived from failure
rates as well as our estimate of 0.85 as the probability of becoming pregnant in a year if no
contraception were used, both based on Hatcher et al. (1994). These were obtained as follows:
100*/)]([)( AmfAme −= (12)
where,
)(me is the use-effectiveness for method m.
A is the probability a woman would become pregnant within a year if no
contraception were used. (A is taken to be 0.85)
)(mf is the failure rate in a year for method m
The estimates for LDCs are given by Bongaarts (1982). Table A2 in the appendix shows the
estimates for both MDCs and LDCs. Then the overall effectiveness is given by:
∑= umumee /)(*)( (13)
where,
e is the average use-effectiveness.
e(m) is as given above.

u(m) is the proportion of women using method m, i.e., the method-specific
contraceptive prevalence.
u is the total proportion of women using contraception, i.e. CPR(CMW).
Then the percent increase in births (PI(3)) if there were no contraceptive use is estimated by:
Cc
Cc
TFCcCiCaCm
TFCcCiCaCmTFCiCaCm
TFR
TFRTFRPI
actual
actualpotential −=
−=
−=
1
****
*****1***)3( (14)
and the births averted is obtained by:
actualbirthsPIBAV *)3()3( = (15)
The derivations and input data needed for the three methods are contrasted in Table 1. For
summary purposes, the medians of the estimates for each of the methods are calculated and
compared. In addition, the magnitude of the births averted due to contraception at the global
level is estimated by summing estimates across the 127 nations.
- Table 1 about here
Results
Figure 1 shows the robust regression fits to the data for GFR and TFR. The linear regression
equations fit the data quite well. Note however, that the residuals from the fitted values do vary
systematically in the two regressions with a tendency to be positive for low values of
contraceptive prevalence, slightly negative for middle values of prevalence and positive again for
high values of prevalence. Residual tests (not shown) confirmed the presence of this pattern.

This suggests that a non-linear equation might be superior; this will be explored in future
research.
- Figure 1 about here
Results for each country are given in Table 2. The percent increase in births demonstrates the
magnitude of the effect of contraceptive use and can be compared across countries and regions.
Figure 2 shows boxplots of these percentages for each of the methods. The three methods
produce a similar range of estimates of the percent change in births in the absence of
contraception. The medians for the three methods (80%, 75% and 91%), are quite close to each
other. (The means were 135%, 110% and 136%). Estimates of the percent increase in births are
clearly right-skewed. Outliers are mostly countries with high contraceptive prevalence and low
fertility. The number of births averted calculated by Bongaarts’ intermediate fertility model is
consistently greater than the estimates based on GFR and TFR in 53 countries out of 127.
Comparing the estimates for each method by country to the mean of the three estimates, the GFR
method gives estimates on average (median) 4% above the average, while the TFR method gives
estimates on average 4% below the average, and Bongaarts method gives estimates on average
1% above the mean (not shown). Among the 55 countries where the estimated increase in births
is less than 80% in the absence of contraception by all three methods, 33 are in the Sub-Saharan
region.
- Table 2 and Figure 2 about here

Based on the average of the results from GFR and TFR methods which are more conservative
(lower estimates), for 127 major countries around the world there would have been
approximately 123% more births or 155,528,000 additional births in a recent year if there had
been no contraceptive use (The median year for the calculation of births averted across all 127
countries is 1996). The results from analyses based on CPR(CMW) (not shown) are fairly close
to the results derived from CPR(AW). The mean difference of the estimated percent increase in
births with the two robust GFR regressions is 17%.
Another way to look at the results is to see how close the estimates are for the three methods via
correlation analyses. The correlation coefficients for the three estimates of percent increase in
births are given in Table 3. Births averted calculated by the three methods have reasonable
agreement, judged by these correlation coefficients.
- Table 3 about here
Discussion
Three simple methods have been presented to estimate births averted due to contraception at the
national level. The estimated numbers of births averted and percent increase in births using these
three methods based on the GFR, TFR and Bongaarts proximate determinants’ model are fairly
consistent. The medians of the percent increases in births estimated by the three methods are
close to each other.

The difference between the GFR and TFR models and the Bongaarts’ model is worth noting. The
births averted estimates based on GFR and TFR take into account contraceptive use outside of
marriage. In Bongaarts’ model, we use CPR(CMW), the contraceptive prevalence of
married/cohabiting women, to estimate births averted. Since contraceptive use within marriage is
virtually always higher than that outside marriage around the world, the number of births averted
estimated using Bongaarts’ model are higher than estimates based on GFR and TFR, which used
CPR(AW) in the regression equation.
The effect of using CPR(AW) rather than CPR(CMW) in the first two estimation methods is not
as great as we expected. Nonetheless, basing the estimates of births averted on contraceptive use
by all, rather than only married, reproductive-aged women is conceptually preferred . Besides
this wider definition of contraceptive use applied in this paper, the simplicity of the three
methods is an additional strength of this study. Compared to papers in the 1960s and 1970s the
methods presented here are based on simple algebra with basic demographic formulas and utilize
easily accessible data. Choices among the methods could be made according to the availability of
data, as well as the purpose of specific studies. The GFR method is conceptually simple, the
data utilized are relatively easy to access, and the births averted calculation is straightforward
and the results are quite consistent with those of the other two methods so we recommend this
method in general.
There are two assumptions underlying the estimation of CPR(AW) from CPR(CMW) where
CPR(AW) was not available. The first assumption, that women have identical region-specific
CPR(AW)/CPR(CMW) ratios, has been validated by our data. But the second assumption, that

the CPR(AW)/CPR(CMW) ratio does not change over time, is likely to be a rough
approximation. In this vein, it would be interesting to examine the time trend for the ratio
between the prevalence of contraceptive use among the married and unmarried.
In addition, there are about 15 countries with CPR(CMW) for different years as compared to
CPR(AW). This affects the comparison of the estimates using Bongaarts model with the
estimates from the other two methods. However, in approximately half of these fifteen, the
reference year for CPR(CMW) was earlier and in about half it was later than the reference year
for CPR(AW) so we expect only minor effects from these differences.
As couples’ fertility preferences shift downward, their achievement through contraceptive
practice can be facilitated by organized family planning efforts. The estimates from this study
show that contraceptive practice may have helped avert more unwanted births in a year than the
number that actually occurred. Many of the averted births, if not prevented, would likely have
resulted in unsafe abortions and maternal deaths. Simplified methods to estimate births averted
put helpful evaluation tools and information at the disposal of those managing reproductive
health programs and deciding on the allocation of resources. This research is the first phase of a
study that will estimate abortions and maternal deaths averted through contraception.

References
Bongaarts, John. 1982. “The Fertility-Inhibiting Effects of the Intermediate Fertility Variables.”
Studies in Family Planning. 13:6/7, pp179-89.
Hatcher, Robert A. et al. 1994. Contraceptive Technology, 16th revised edition, Chapter 5.
Ardent Media, New York.
Lee, Ronald. 2003. “The Demographic Transition: Three Centuries of Fundamental Change.”
Journal of Economic Perspectives. 17:4, pp. 167-90.
Mauldin, W.P. 1968. “Births averted by family planning programs” Studies in Family Planning
1(33):1-7.
Potter, R. 1969. Estimating births averted in a family planning program” pp. 413-434 In Fertility
and Family Planning: A World View. Ed S.J. Behrman et al. Ann Arbor: Univ. of Michigan
Press.
Prada-Salas, E. 1975. “Estimate of births averted in the Profamilia Program” Studies in Family
Planning 6(5):121-125.
Ross, John A. et al. 1993. Findings from Two Decades of Family Planning Research. Chapter 1.
Population Council, New York.

StataCorp. 2001. Stata Reference Manual Release 7. College Station, Texas.
Venkatacharya, K. 1971. “A model to estimate births averted due to IUCDs and sterilizations”
Demography 8(4):491-505.

Tab
le 1
. D
eta
ils
of
thre
e m
eth
od
s fo
r es
tim
ati
on
of
bir
ths
aver
ted
an
d p
ercen
t in
crea
se i
n b
irth
s if
th
ere
wer
e n
o c
on
trace
pti
on
Met
hod
It
em
1.
GF
R r
egres
sion
2. T
FR
reg
res
sion
3
. B
on
gaart
s m
od
el
Data
utilized
CPR(CMW), CPR(AW),
f
ia
P49
15)
(−, CBR, total
population.
CPR(CMW), CPR(AW), TFR, ASFR (where available),
f
ia
P49
15)
(−, CBR, total population.
CPR(CMW) by method,
failure rates by method,
CBR, total population.
Estimation
technique
Ordinary least square regression (OLS) and robust
regression
OLS and robust regression
ci
am
CC
CC
TFR
**
*=
Preliminary
calculation
CC
BR
GFR
49
15/
=
i
act
ual
i
pote
ntial
iAW
CPR
GFR
GFR
)(
*β̂
−=
i
act
ual
i
pote
ntial
iAW
CPR
TFR
TFR
)(
*β̂
−=
act
ual
act
ual
pote
ntial
pote
ntial
ASFR
TFR
TFR
ASFR
*=
∑=
um
um
ee
/)
(*)
(
ue
Cc
**
08
.1
1−
=
Equation
for BAV
f
i
act
ual
i
pote
ntial
ii
aP
GFR
GFR
BAV
49
15)
(*
1000
/][
)1(−
−=
∑ =
−=
50 15
1000
/]}
[*)
({
)2(
a
act
ual
pote
ntial
ASFR
ASFR
aP
aBAV
][*
35
)](
*15
5050
[
)2(
5.47
5.17
act
ual
pote
ntial
aTFR
TFR
aP
a
bBAV
−−−
=∑ =
act
ual
bir
ths
PI
BAV
*)3(
)3(=
Equation of
% increase
in births
100
*)1(
)1(act
ual
bir
ths
BAV
PI
=
100
*)2(
)2(
act
ual
bir
ths
BAV
PI
=
CcCc
PI
−=1
)3(

050
100
150
200
250
0 20 40 60 80CPR(AW)
GFR
02
46
8
0 20 40 60 80CPR(AW)
TFR
for 127 countries and robust regression fits
Figure 1. Observed relationship between GFR vs. CPR(AW) and TFR vs. CPR(AW)
GFR = 208.99 – 2.55 * CPR(AW)
TFR = 6.71 – 0.08 * CPR(AW)

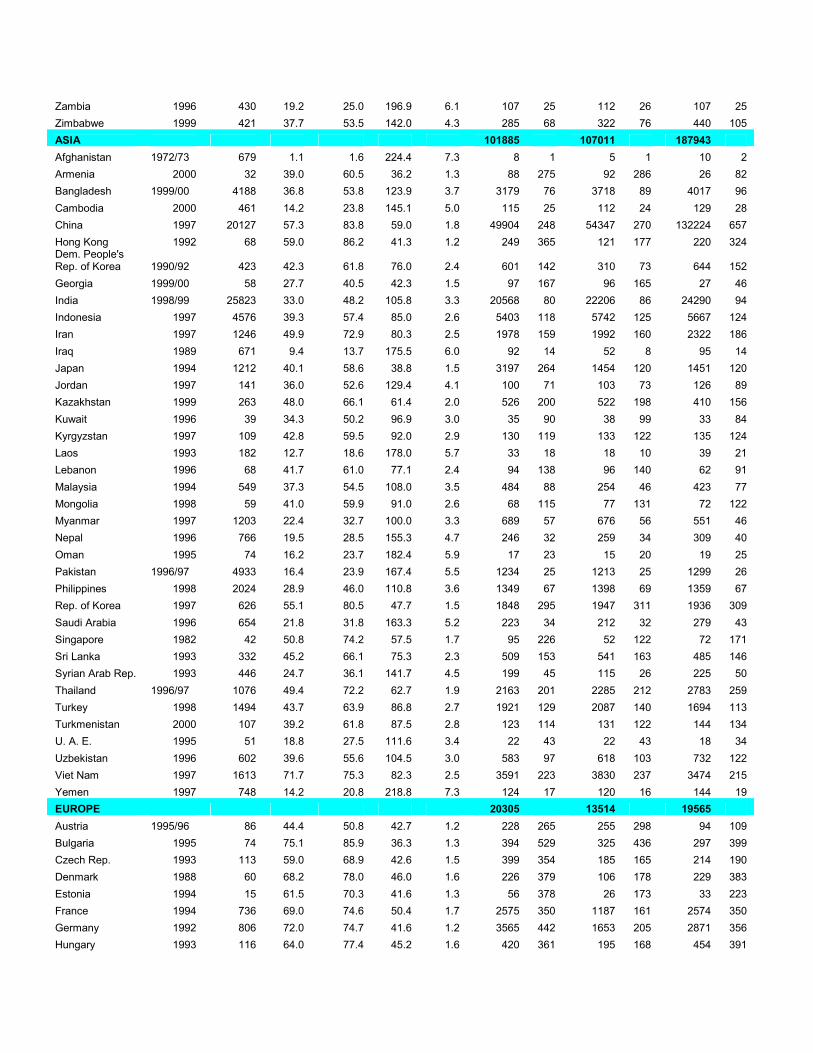
Table 2. Input data (births, CPR(AW), GFR and TFR) and estimates of births averted and percent increase in births in the absence of contraceptive use, estimated by three methods, by region and country*
Method Input data
GFR TFR Bongaarts Region and Country
Year** Births (1,000)
CPR (AW)
CPR (CMW) GFR
TFR (adj.) # of BAV
% inc. # of BAV
% inc. # of BAV
% inc.
AFRICA 9316 9263 9196
Algeria 1995 728 35.8 56.9 105.7 3.5 630 87 544 75 799 110
Benin 2001 268 17.8 16.4 178.6 5.8 68 25 62 23 33 13
Botswana 1988 47 29.7 33.0 157.8 5.0 23 48 23 48 23 48
Burkina Faso 1998/99 556 12.0 11.9 215.4 6.8 79 14 83 15 54 10
Burundi 1987 247 6.4 8.7 200.5 6.8 20 8 20 8 15 6
Cameroon 1998 538 24.0 19.3 161.9 5.0 204 38 217 40 91 17
C.A.R. 1994/95 136 14.1 14.8 171.7 5.5 28 21 29 21 15 11
Chad 1996/97 342 3.9 4.1 215.0 6.7 16 5 17 5 11 3
Côte d'Ivoire 1998/99 563 20.7 15.0 160.1 5.1 186 33 195 35 79 14 Dem. Rep. of the Congo 1991 1887 7.0 7.7 220.3 6.7 153 8 86 5 106 6
Egypt 2000 1813 38.4 56.1 105.3 3.4 1689 93 1758 97 2221 123
Eritrea 1995 136 5.9 5.0 185.7 6.0 11 8 11 8 6 5
Ethiopia 2000 2849 5.9 8.1 193.2 6.3 222 8 229 8 228 8
Gabon 2000 41 35.6 32.7 138.2 4.2 27 66 31 75 13 31
Gambia 1990 40 9.7 11.8 182.8 5.8 5 14 3 7 4 11
Ghana 1998 632 18.0 22.0 135.9 4.5 214 34 214 34 138 22
Guinea 1999 354 7.6 6.2 193.4 6.1 36 10 38 11 20 6
Kenya 1998 1009 29.9 39.0 142.4 4.5 541 54 572 57 572 57
Lesotho 1991/92 56 19.1 23.2 141.6 4.8 19 34 11 19 15 27
Liberia 1986 108 8.4 6.4 222.1 6.9 10 10 10 10 7 6
Libya 1995 113 27.2 39.7 98.5 3.7 80 71 63 56 61 54
Madagascar 1997 645 16.0 19.4 193.0 6.1 137 21 140 22 122 19
Malawi 2000 523 25.0 30.6 201.7 6.2 166 32 179 34 214 41
Mali 2001 613 8.4 6.7 229.0 7.0 57 9 53 9 34 6
Mauritania 2001 115 4.8 3.3 179.4 5.8 8 7 3 3 2 3
Mauritius 1991 22 55.0 74.7 74.0 2.2 41 190 21 98 36 166
Morocco 1992 687 22.9 50.3 97.4 3.6 413 60 343 50 593 87
Mozambique 1997 718 6.0 5.6 174.6 5.9 63 9 61 9 41 6
Namibia 1992 62 23.3 28.9 170.4 5.6 21 35 20 33 24 38
Niger 1998 557 7.6 8.2 261.1 8.0 41 7 44 8 38 7
Nigeria 1999 4546 15.7 15.3 181.0 5.7 1007 22 1064 23 652 14
Rwanda 1992 269 13.8 13.2 198.0 6.7 48 18 61 23 40 11
Senegal 1997 337 10.8 12.9 166.3 5.4 56 17 55 16 40 12
South Africa 1998 1037 50.1 56.3 90.1 2.8 1472 142 1556 150 1392 134
Sudan 1992/93 1000 6.8 8.3 157.0 5.3 111 11 61 6 84 8
Swaziland 1988 34 17.0 19.9 182.5 6.2 8 24 5 14 8 23
Togo 1998 172 25.3 23.5 173.9 5.7 64 37 64 37 33 19
Tunisia 1994 194 41.0 60.0 86.6 2.8 234 121 151 78 262 135
Uganda 2000/01 1230 20.1 14.8 239.8 7.1 263 21 239 19 138 14
Tanzania 1999 1402 22.3 24.2 177.9 5.5 449 32 491 35 384 27
Zambia 1996 430 19.2 25.0 196.9 6.1 107 25 112 26 107 25
Zimbabwe 1999 421 37.7 53.5 142.0 4.3 285 68 322 76 440 105
ASIA 101885 107011 187943
Afghanistan 1972/73 679 1.1 1.6 224.4 7.3 8 1 5 1 10 2
Armenia 2000 32 39.0 60.5 36.2 1.3 88 275 92 286 26 82
Bangladesh 1999/00 4188 36.8 53.8 123.9 3.7 3179 76 3718 89 4017 96
Cambodia 2000 461 14.2 23.8 145.1 5.0 115 25 112 24 129 28
China 1997 20127 57.3 83.8 59.0 1.8 49904 248 54347 270 132224 657
Hong Kong 1992 68 59.0 86.2 41.3 1.2 249 365 121 177 220 324 Dem. People's Rep. of Korea 1990/92 423 42.3 61.8 76.0 2.4 601 142 310 73 644 152
Georgia 1999/00 58 27.7 40.5 42.3 1.5 97 167 96 165 27 46
India 1998/99 25823 33.0 48.2 105.8 3.3 20568 80 22206 86 24290 94
Indonesia 1997 4576 39.3 57.4 85.0 2.6 5403 118 5742 125 5667 124
Iran 1997 1246 49.9 72.9 80.3 2.5 1978 159 1992 160 2322 186
Iraq 1989 671 9.4 13.7 175.5 6.0 92 14 52 8 95 14
Japan 1994 1212 40.1 58.6 38.8 1.5 3197 264 1454 120 1451 120
Jordan 1997 141 36.0 52.6 129.4 4.1 100 71 103 73 126 89
Kazakhstan 1999 263 48.0 66.1 61.4 2.0 526 200 522 198 410 156
Kuwait 1996 39 34.3 50.2 96.9 3.0 35 90 38 99 33 84
Kyrgyzstan 1997 109 42.8 59.5 92.0 2.9 130 119 133 122 135 124
Laos 1993 182 12.7 18.6 178.0 5.7 33 18 18 10 39 21
Lebanon 1996 68 41.7 61.0 77.1 2.4 94 138 96 140 62 91
Malaysia 1994 549 37.3 54.5 108.0 3.5 484 88 254 46 423 77
Mongolia 1998 59 41.0 59.9 91.0 2.6 68 115 77 131 72 122
Myanmar 1997 1203 22.4 32.7 100.0 3.3 689 57 676 56 551 46
Nepal 1996 766 19.5 28.5 155.3 4.7 246 32 259 34 309 40
Oman 1995 74 16.2 23.7 182.4 5.9 17 23 15 20 19 25
Pakistan 1996/97 4933 16.4 23.9 167.4 5.5 1234 25 1213 25 1299 26
Philippines 1998 2024 28.9 46.0 110.8 3.6 1349 67 1398 69 1359 67
Rep. of Korea 1997 626 55.1 80.5 47.7 1.5 1848 295 1947 311 1936 309
Saudi Arabia 1996 654 21.8 31.8 163.3 5.2 223 34 212 32 279 43
Singapore 1982 42 50.8 74.2 57.5 1.7 95 226 52 122 72 171
Sri Lanka 1993 332 45.2 66.1 75.3 2.3 509 153 541 163 485 146
Syrian Arab Rep. 1993 446 24.7 36.1 141.7 4.5 199 45 115 26 225 50
Thailand 1996/97 1076 49.4 72.2 62.7 1.9 2163 201 2285 212 2783 259
Turkey 1998 1494 43.7 63.9 86.8 2.7 1921 129 2087 140 1694 113
Turkmenistan 2000 107 39.2 61.8 87.5 2.8 123 114 131 122 144 134
U. A. E. 1995 51 18.8 27.5 111.6 3.4 22 43 22 43 18 34
Uzbekistan 1996 602 39.6 55.6 104.5 3.0 583 97 618 103 732 122
Viet Nam 1997 1613 71.7 75.3 82.3 2.5 3591 223 3830 237 3474 215
Yemen 1997 748 14.2 20.8 218.8 7.3 124 17 120 16 144 19
EUROPE 20305 13514 19565
Austria 1995/96 86 44.4 50.8 42.7 1.2 228 265 255 298 94 109
Bulgaria 1995 74 75.1 85.9 36.3 1.3 394 529 325 436 297 399
Czech Rep. 1993 113 59.0 68.9 42.6 1.5 399 354 185 165 214 190
Denmark 1988 60 68.2 78.0 46.0 1.6 226 379 106 178 229 383
Estonia 1994 15 61.5 70.3 41.6 1.3 56 378 26 173 33 223
France 1994 736 69.0 74.6 50.4 1.7 2575 350 1187 161 2574 350
Germany 1992 806 72.0 74.7 41.6 1.2 3565 442 1653 205 2871 356
Hungary 1993 116 64.0 77.4 45.2 1.6 420 361 195 168 454 391

Italy 1996 531 52.6 60.2 37.0 1.1 1927 363 2159 406 720 136
Latvia 1995 23 42.0 48.0 38.8 1.3 65 276 54 231 21 91
Lithuania 1994/95 41 51.2 58.5 46.7 1.5 116 280 104 252 49 119
Netherlands 1993 195 74.0 78.5 48.5 1.6 760 390 350 179 909 466
Poland 1991 525 43.2 49.4 55.4 1.7 1048 199 496 94 411 78
Portugal 1979/80 161 58.0 66.3 65.8 2.2 363 225 182 113 251 156
Rep. of Moldova 1997 52 64.4 73.7 44.8 1.5 190 367 177 344 136 263
Romania 1993 256 41.0 63.8 40.2 1.4 668 260 558 218 330 141
Slovakia 1991 75 64.7 74.0 56.3 1.9 220 294 107 142 156 208
Spain 1995 384 70.7 80.9 37.0 1.2 1879 489 1836 478 2715 706
Sweden 1981 95 68.2 78.0 49.4 1.6 334 353 160 169 312 329
Switzerland 1994/95 79 71.7 82.0 44.9 1.3 320 408 347 442 441 562
Ukraine 1999 434 59.0 67.5 33.9 1.2 1932 445 1842 424 741 171
United Kingdom 1993 750 72.0 82.0 52.6 1.8 2621 350 1210 161 5607 748
LATIN AMERICA AND THE CARIBBEAN 12587 12705 22334
Bolivia 1998 255 31.4 48.3 132.4 4.2 154 61 161 63 171 67
Brazil 1996 3438 55.4 76.7 77.1 2.4 6315 184 6477 188 11001 320
Colombia 2000 973 52.8 76.9 84.7 2.7 1549 159 1656 170 2617 269
Costa Rica 1992/93 80 53.0 75.0 95.2 2.9 114 142 60 75 177 221
Cuba 1987 180 47.9 70.0 62.5 1.8 352 196 187 104 422 235
Dominican Rep. 1999 198 48.8 63.7 92.8 2.8 266 134 277 140 359 182
Ecuador 1987 296 29.0 65.8 129.2 4.0 170 57 188 63 502 166
El Salvador 1985 152 32.3 59.7 137.4 4.1 91 60 108 71 242 148
Guatemala 1998/99 394 26.6 38.2 154.0 4.8 174 44 190 48 226 57
Haiti 2000 247 19.4 28.1 124.9 4.1 98 40 100 41 84 34
Honduras 1996 198 32.0 50.0 146.4 4.3 111 56 118 59 179 90
Jamaica 1997 55 50.0 65.9 83.2 2.5 84 154 91 166 86 157
Mexico 1987 2301 33.9 66.5 119.8 3.6 1664 72 1742 76 4323 185
Nicaragua 1997/98 166 40.8 60.3 143.0 4.2 121 73 137 82 256 154
Panama 1984 60 39.8 58.2 115.5 3.3 53 88 30 49 84 141
Paraguay 1990 148 32.7 57.4 149.8 4.7 83 56 94 64 200 124
Peru 2000 634 44.0 64.2 95.1 3.0 750 118 772 122 823 126
Puerto Rico 1995/96 60 53.1 77.7 61.1 2.1 134 222 127 211 192 317 Trinidad and Tobago 1987 28 37.4 52.7 90.5 2.8 30 106 35 127 24 85
Venezuela 1977 468 33.7 49.3 145.9 4.4 276 59 156 33 365 78
NOTHERN AMERICA 11368 11513 15791
Canada 1984 373 68.0 74.7 54.4 1.6 1193 320 1264 338 1271 364
U. S. A. 1990 4063 59.0 76.4 60.2 2.0 10175 250 10249 252 14520 355
OCEANIA 976 612 1220
Australia 1986 242 72.0 76.1 58.7 1.7 757 313 379 157 965 399
New Zealand 1995 57 65.5 74.9 60.0 1.8 159 279 172 301 200 351 Papua New Guinea 1996 176 20.0 25.9 150.0 4.7 60 34 62 35 55 31
Total births (Births averted) (1,000) 126095 (156437) (154619) (256050)
NOTE:
* 127 countries with over 1 million population in 2002 and available data.
** There are 15 countries which have different reference year in the Bongaarts method than the GFR and TFR methods. See Appendix Table A3 for details.

0200
400
600
800
GFR_reg TFR_reg Bongaarts
Percent increase
for 127 countries, by method of estimation
Figure 2. Boxplots of estimates of percent increase in births in the absence of contraception
Bulgaria
Spain
Italy
UK
Spain
China
Hungary

Table 3. Correlation coefficients between three estimates of percent increase in births in the
absence of contraception (PI) for 127 countries
Correlation coefficients Estimate using
GFR
Estimate using
TFR
Estimate using
Bongaarts’
model
PI in GFR 1.00 0.89 0.72
PI in TFR 1.00 0.68
PI in Bongaarts’ model 1.00

Appendix Table A1. TFR adjusted into the same age range as CPR, details
Age range of CPR # of
Countries
Countries (if
frequency ≤ 4) Adjustment method
15-49 91 None needed
15-44 17
20-49 7 (1)
18-49 4 Latvia, Lithuania,
Spain, Canada (2)
20-44 2 Sweden, France
20-39 1 Germany (3)
10-49 1 Bangladesh
16-49 1 United Kingdom
<50 1 Kuwait
None; considered as 15-49
18-41 1 Hungary
18-42 1 Netherlands (3); considered as 18-49
There are 11 different age ranges for CPR.
(1) For countries with CPR for age groups (15, 44) or (20-49), TFR were adjusted based on
Demographic and Health Survey data. TFR 15-44
and TFR 20-49
from DHS were used to get
the mean of 4915
4415
−
−
TFR
TFR and
4915
4920
−
−
TFR
TFR, which were used to adjust available TFR
15-49 to
TFR 15-44
or TFR 20-49
where needed.
(2) For countries with CPR for age groups (18-49), data of TFR 15-49 and TFR 20-49 were
obtained from the Demographic Yearbook and the United Nations (200x) World
Population Monitoring 2000. Then TFR 17.5-49
was calculated as the average of TFR 15-49
and TFR 20-49
. (We equated TFR 18-49
with TFR 17.5-49
.)
(3) For countries with CPR for age groups (20-44) and (20-39), age-specific fertility rate or
age-specific live births and female population of the specific year from the Demographic
Yearbook were used to calculate the corresponding TFR.

Appendix Table A2. Estimates of contraceptive effectiveness by methods and national
development level*
LDCs MDCs METHOD
(From Bongaarts) (Derived)
Sterilization (female) 100 99.53
Sterilization (male) 100 99.82
Pill 90 99.65
Injectables 95 99.65
IUD 95 98.86
Condom 70 85.88
Vaginal barrier methods 70 78.82
Other modern methods 70 99.89
Rhythm 60 76.47
Withdrawal 60 77.65
Other traditional methods 50 50.00
* National development level is defined according to UN Population Division. The more developed regions
comprise all regions of Europe and Northern America, Australia/New Zealand and Japan. The less developed regions comprise all regions of Africa, Asia (excluding Japan) and Latin America and the Caribbean, as well as the
regions of Melanesia, Micronesia and Polynesia.
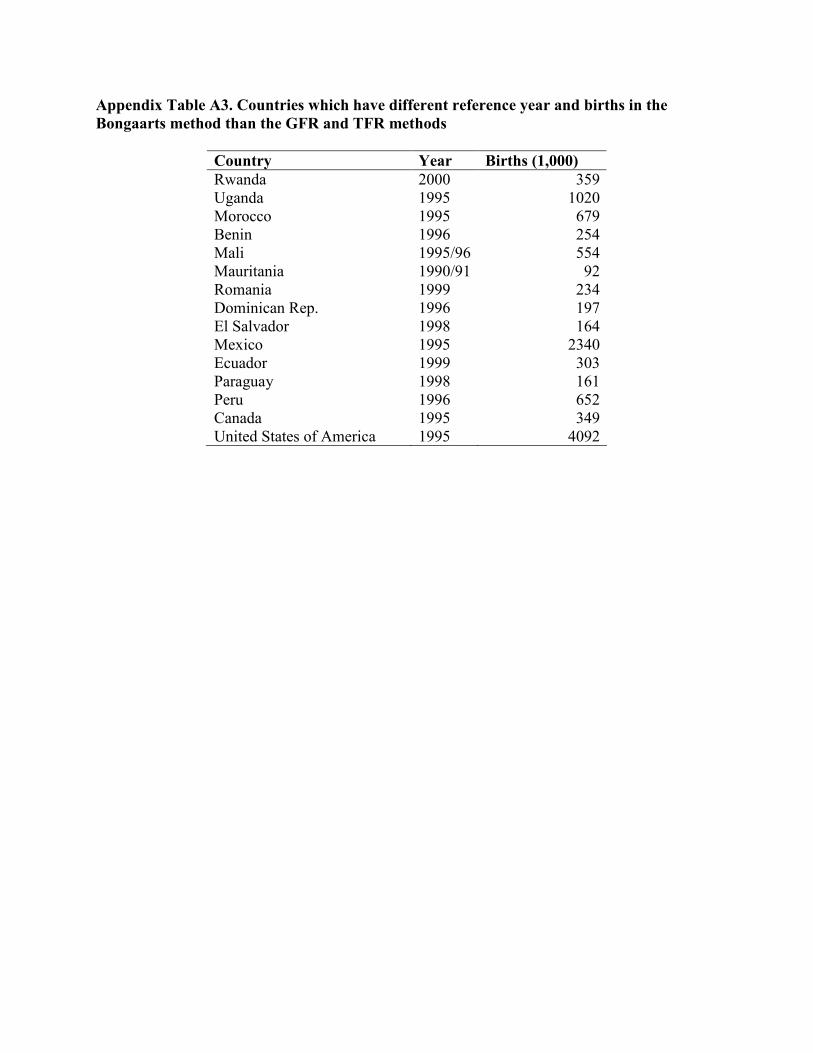
Appendix Table A3. Countries which have different reference year and births in the
Bongaarts method than the GFR and TFR methods
Country Year Births (1,000)
Rwanda 2000 359
Uganda 1995 1020
Morocco 1995 679
Benin 1996 254
Mali 1995/96 554
Mauritania 1990/91 92
Romania 1999 234
Dominican Rep. 1996 197
El Salvador 1998 164
Mexico 1995 2340
Ecuador 1999 303
Paraguay 1998 161
Peru 1996 652
Canada 1995 349
United States of America 1995 4092