Three Sets of Case Studies Suggest Logic and Consistency ... · Three Sets of Case Studies Suggest...
7
Available online at www.sciencedirect.com journal homepage: www.elsevier.com/locate/jval Three Sets of Case Studies Suggest Logic and Consistency Challenges with Value Frameworks Joshua T. Cohen, PhD*, Jordan E. Anderson, BA, Peter J. Neumann, ScD Center for the Evaluation of Value and Risk in Health, Tufts Medical Center, Boston, MA, USA ABSTRACT Objective: To assess the logic and consistency of three prominent value frameworks. Methods: We reviewed the value frameworks from three organizations: the Memorial Sloan Kettering Cancer Center (DrugAbacus), the American Society of Clinical Oncologists, and the Institute for Clinical and Economic Review. For each framework, we developed case studies to explore the degree to which the frameworks have face validity in the sense that they are consistent with four important principles: value should be proportional to a therapy’s benefit; components of value should matter to framework users (patients and payers); attribute weights should reflect user preferen- ces; and value estimates used to inform therapy prices should reflect per-person benefit. Results: All three frameworks can aid decision making by elucidating factors not explicitly addressed by conventional evaluation techniques (in particular, cost-effectiveness analyses). Our case studies identified four challenges: 1) value is not always proportional to benefit; 2) value reflects factors that may not be relevant to framework users (patients or payers); 3) attribute weights do not necessarily reflect user preferences or relate to value in ways that are transparent; and 4) value does not reflect per-person benefit. Conclusions: Although the value frameworks we reviewed capture value in a way that is important to various audiences, they are not always logical or consistent. Because these frameworks may have a growing influence on therapy access, it is imperative that analytic challenges be further explored. Keywords: cost-effectiveness analysis, healthcare costs, oncology treatments, value frameworks. Copyright & 2017, International Society for Pharmacoeconomics and Outcomes Research (ISPOR). Published by Elsevier Inc. Introduction Any algorithm used to evaluate the value of medical therapies has limitations. A single number or set of numbers cannot capture all information pertaining to the myriad benefits, risks, and costs of a wide range of treatments. Nevertheless, algorithms used in “value frameworks,” such as those being developed and promulgated by a range of professio- nal societies and other organizations in the United States, can be designed to better reflect outcomes of interest to stakeholders, and to account for the preferences of the patients and other agents such as payers. This study uses concrete examples—case studies—to explore the extent to which three well-known value frameworks achieve these goals. These and other frameworks are a response to the important needs of payers, clinicians, and patients to systematically evaluate and in some cases compare therapies. The frameworks seek to expand upon traditional evaluation methodologies (e.g., cost per quality-adjusted life-year [QALY] ratios) by more explicitly accounting for the preferences of framework “users,” and by reporting results in a user-friendly manner. Also, it bears empha- sizing that developing value frameworks is challenging. It is easier to criticize frameworks than to construct them. Nonetheless, it is important to explore whether notable frameworks have face validity, that is, do they align with an externally logical and credible characterization of value? To address this question, we constructed a series of case studies. Methods Value Frameworks We focused on three value frameworks: DrugAbacus (from the Memorial Sloan Kettering Cancer Center), the American Society of Clinical Oncologists (ASCO) framework, and the Institute for Clinical and Economic Review (ICER) framework. DrugAbacus [1] aims to “determine appropriate prices for cancer drugs based on what experts tend to list as possible components of a drug’s value.” It derives an “appropriate” price for a drug on the basis of its incremental survival benefit and the value of each added survival year, as designated by the user (Fig. 1). The algorithm underlying DrugAbacus (as of August 2016) then scales this price by a series of factors, each of which reflects a characteristic, as specified by the framework’s authors (e.g., the drug’s toxicity, novelty, and cost of development) and a “prefer- ence weight” selected by the user. Each factor’s preference weight represents that factor’s maximum impact on price. For example, 1098-3015$36.00 – see front matter Copyright & 2017, International Society for Pharmacoeconomics and Outcomes Research (ISPOR). Published by Elsevier Inc. http://dx.doi.org/10.1016/j.jval.2016.11.012 E-mail: [email protected]. * Address correspondence to: Joshua T. Cohen, Center for the Evaluation of Value and Risk in Health, Tufts Medical Center, 35 Kneeland Street, Boston, MA 02111. VALUE IN HEALTH 20 (2017) 193 – 199
-
Upload
phungnguyet -
Category
Documents
-
view
214 -
download
0
Transcript of Three Sets of Case Studies Suggest Logic and Consistency ... · Three Sets of Case Studies Suggest...
Avai lable onl ine at www.sc iencedirect .com
journal homepage: www.elsevier .com/ locate / jva l
Three Sets of Case Studies Suggest Logic and ConsistencyChallenges with Value FrameworksJoshua T. Cohen, PhD*, Jordan E. Anderson, BA, Peter J. Neumann, ScD
Center for the Evaluation of Value and Risk in Health, Tufts Medical Center, Boston, MA, USA
A B S T R A C T
Objective: To assess the logic and consistency of three prominentvalue frameworks. Methods: We reviewed the value frameworksfrom three organizations: the Memorial Sloan Kettering Cancer Center(DrugAbacus), the American Society of Clinical Oncologists, and theInstitute for Clinical and Economic Review. For each framework, wedeveloped case studies to explore the degree to which the frameworkshave face validity in the sense that they are consistent with fourimportant principles: value should be proportional to a therapy’sbenefit; components of value should matter to framework users(patients and payers); attribute weights should reflect user preferen-ces; and value estimates used to inform therapy prices should reflectper-person benefit. Results: All three frameworks can aid decisionmaking by elucidating factors not explicitly addressed by conventionalevaluation techniques (in particular, cost-effectiveness analyses).
Our case studies identified four challenges: 1) value is not alwaysproportional to benefit; 2) value reflects factors that may not berelevant to framework users (patients or payers); 3) attribute weightsdo not necessarily reflect user preferences or relate to value in waysthat are transparent; and 4) value does not reflect per-person benefit.Conclusions: Although the value frameworks we reviewed capturevalue in a way that is important to various audiences, they are notalways logical or consistent. Because these frameworks may have agrowing influence on therapy access, it is imperative that analyticchallenges be further explored.Keywords: cost-effectiveness analysis, healthcare costs, oncologytreatments, value frameworks.
Copyright & 2017, International Society for Pharmacoeconomics andOutcomes Research (ISPOR). Published by Elsevier Inc.
Introduction
Any algorithm used to evaluate the value of medical therapieshas limitations. A single number or set of numbers cannotcapture all information pertaining to the myriad benefits, risks,and costs of a wide range of treatments.
Nevertheless, algorithms used in “value frameworks,” such asthose being developed and promulgated by a range of professio-nal societies and other organizations in the United States, can bedesigned to better reflect outcomes of interest to stakeholders,and to account for the preferences of the patients and otheragents such as payers. This study uses concrete examples—casestudies—to explore the extent to which three well-known valueframeworks achieve these goals.
These and other frameworks are a response to the importantneeds of payers, clinicians, and patients to systematically evaluateand in some cases compare therapies. The frameworks seek toexpand upon traditional evaluation methodologies (e.g., cost perquality-adjusted life-year [QALY] ratios) by more explicitlyaccounting for the preferences of framework “users,” and byreporting results in a user-friendly manner. Also, it bears empha-sizing that developing value frameworks is challenging. It is easierto criticize frameworks than to construct them. Nonetheless, it isimportant to explore whether notable frameworks have face
validity, that is, do they align with an externally logical andcredible characterization of value? To address this question, weconstructed a series of case studies.
Methods
Value Frameworks
We focused on three value frameworks: DrugAbacus (from theMemorial Sloan Kettering Cancer Center), the American Societyof Clinical Oncologists (ASCO) framework, and the Institute forClinical and Economic Review (ICER) framework.
DrugAbacus [1] aims to “determine appropriate prices forcancer drugs based on what experts tend to list as possiblecomponents of a drug’s value.” It derives an “appropriate” pricefor a drug on the basis of its incremental survival benefit and thevalue of each added survival year, as designated by the user(Fig. 1). The algorithm underlying DrugAbacus (as of August 2016)then scales this price by a series of factors, each of which reflects acharacteristic, as specified by the framework’s authors (e.g., thedrug’s toxicity, novelty, and cost of development) and a “prefer-ence weight” selected by the user. Each factor’s preference weightrepresents that factor’s maximum impact on price. For example,
1098-3015$36.00 – see front matter Copyright & 2017, International Society for Pharmacoeconomics and Outcomes Research (ISPOR).
Published by Elsevier Inc.
http://dx.doi.org/10.1016/j.jval.2016.11.012
E-mail: [email protected].
* Address correspondence to: Joshua T. Cohen, Center for the Evaluation of Value and Risk in Health, Tufts Medical Center, 35 KneelandStreet, Boston, MA 02111.
V A L U E I N H E A L T H 2 0 ( 2 0 1 7 ) 1 9 3 – 1 9 9
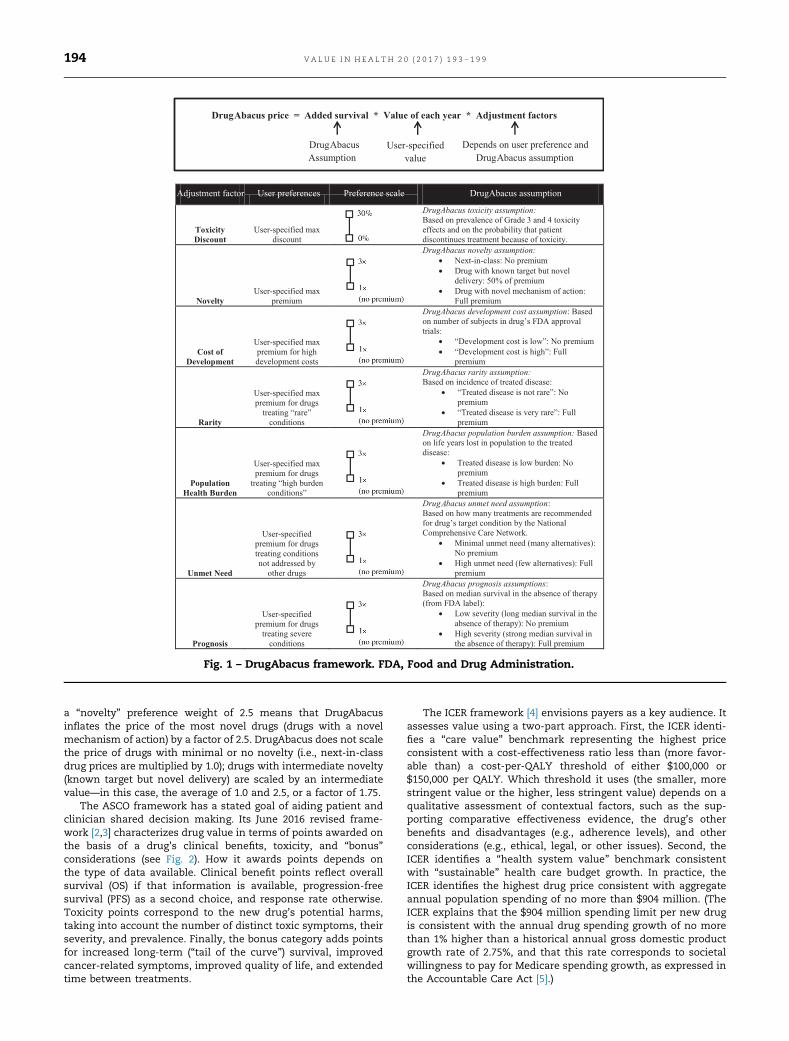
a “novelty” preference weight of 2.5 means that DrugAbacusinflates the price of the most novel drugs (drugs with a novelmechanism of action) by a factor of 2.5. DrugAbacus does not scalethe price of drugs with minimal or no novelty (i.e., next-in-classdrug prices are multiplied by 1.0); drugs with intermediate novelty(known target but novel delivery) are scaled by an intermediatevalue—in this case, the average of 1.0 and 2.5, or a factor of 1.75.
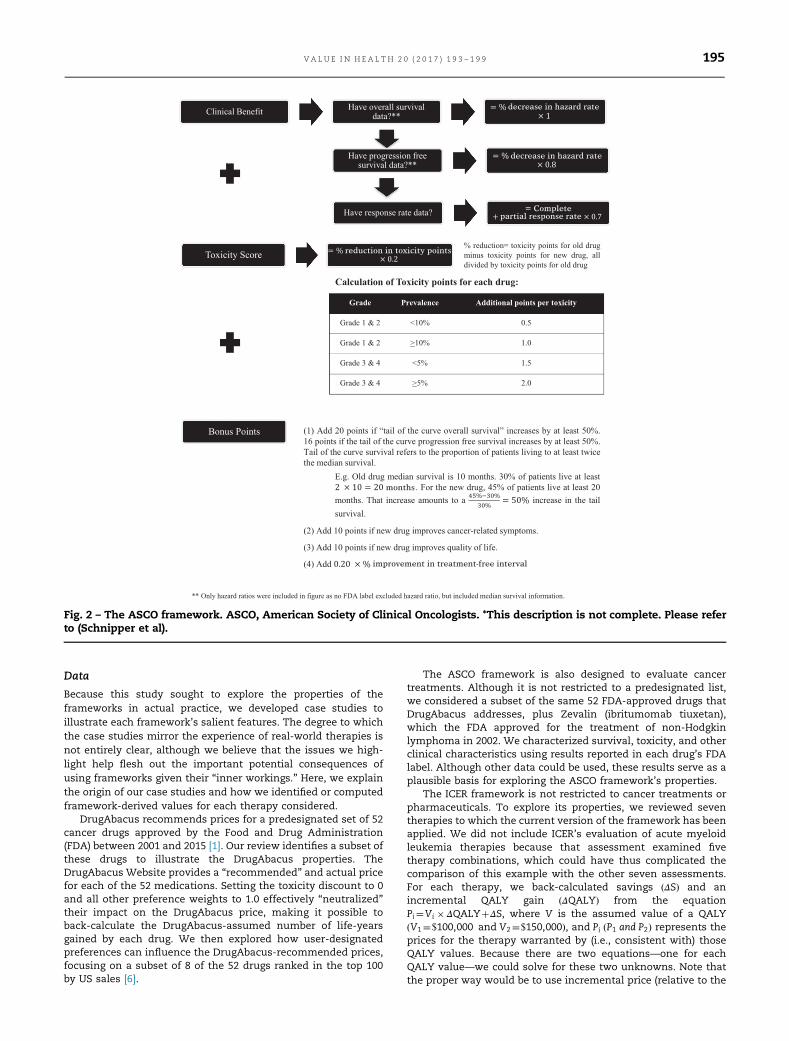
The ASCO framework has a stated goal of aiding patient andclinician shared decision making. Its June 2016 revised frame-work [2,3] characterizes drug value in terms of points awarded onthe basis of a drug’s clinical benefits, toxicity, and “bonus”considerations (see Fig. 2). How it awards points depends onthe type of data available. Clinical benefit points reflect overallsurvival (OS) if that information is available, progression-freesurvival (PFS) as a second choice, and response rate otherwise.Toxicity points correspond to the new drug’s potential harms,taking into account the number of distinct toxic symptoms, theirseverity, and prevalence. Finally, the bonus category adds pointsfor increased long-term (“tail of the curve”) survival, improvedcancer-related symptoms, improved quality of life, and extendedtime between treatments.
The ICER framework [4] envisions payers as a key audience. Itassesses value using a two-part approach. First, the ICER identi-fies a “care value” benchmark representing the highest priceconsistent with a cost-effectiveness ratio less than (more favor-able than) a cost-per-QALY threshold of either $100,000 or$150,000 per QALY. Which threshold it uses (the smaller, morestringent value or the higher, less stringent value) depends on aqualitative assessment of contextual factors, such as the sup-porting comparative effectiveness evidence, the drug’s otherbenefits and disadvantages (e.g., adherence levels), and otherconsiderations (e.g., ethical, legal, or other issues). Second, theICER identifies a “health system value” benchmark consistentwith “sustainable” health care budget growth. In practice, theICER identifies the highest drug price consistent with aggregateannual population spending of no more than $904 million. (TheICER explains that the $904 million spending limit per new drugis consistent with the annual drug spending growth of no morethan 1% higher than a historical annual gross domestic productgrowth rate of 2.75%, and that this rate corresponds to societalwillingness to pay for Medicare spending growth, as expressed inthe Accountable Care Act [5].)
Adjustment factor User preferences Preference scale DrugAbacus assumption
Fig. 1 – DrugAbacus framework. FDA, Food and Drug Administration.
V A L U E I N H E A L T H 2 0 ( 2 0 1 7 ) 1 9 3 – 1 9 9194
Data
Because this study sought to explore the properties of theframeworks in actual practice, we developed case studies toillustrate each framework’s salient features. The degree to whichthe case studies mirror the experience of real-world therapies isnot entirely clear, although we believe that the issues we high-light help flesh out the important potential consequences ofusing frameworks given their “inner workings.” Here, we explainthe origin of our case studies and how we identified or computedframework-derived values for each therapy considered.
DrugAbacus recommends prices for a predesignated set of 52cancer drugs approved by the Food and Drug Administration(FDA) between 2001 and 2015 [1]. Our review identifies a subset ofthese drugs to illustrate the DrugAbacus properties. TheDrugAbacus Website provides a “recommended” and actual pricefor each of the 52 medications. Setting the toxicity discount to 0and all other preference weights to 1.0 effectively “neutralized”their impact on the DrugAbacus price, making it possible toback-calculate the DrugAbacus-assumed number of life-yearsgained by each drug. We then explored how user-designatedpreferences can influence the DrugAbacus-recommended prices,focusing on a subset of 8 of the 52 drugs ranked in the top 100by US sales [6].
The ASCO framework is also designed to evaluate cancertreatments. Although it is not restricted to a predesignated list,we considered a subset of the same 52 FDA-approved drugs thatDrugAbacus addresses, plus Zevalin (ibritumomab tiuxetan),which the FDA approved for the treatment of non-Hodgkinlymphoma in 2002. We characterized survival, toxicity, and otherclinical characteristics using results reported in each drug’s FDAlabel. Although other data could be used, these results serve as aplausible basis for exploring the ASCO framework’s properties.
The ICER framework is not restricted to cancer treatments orpharmaceuticals. To explore its properties, we reviewed seventherapies to which the current version of the framework has beenapplied. We did not include ICER’s evaluation of acute myeloidleukemia therapies because that assessment examined fivetherapy combinations, which could have thus complicated thecomparison of this example with the other seven assessments.For each therapy, we back-calculated savings ΔSð Þ and anincremental QALY gain ΔQALYð Þ from the equationPi¼Vi � ΔQALYþΔS, where V is the assumed value of a QALYV1¼$100,000 and V2¼$150,000ð Þ, and Pi P1 and P2ð Þ represents theprices for the therapy warranted by (i.e., consistent with) thoseQALY values. Because there are two equations—one for eachQALY value—we could solve for these two unknowns. Note thatthe proper way would be to use incremental price (relative to the
decrease in hazard rate
decrease in hazard rate
partial response rate
reduction in toxicity points
months
improvement in treatment-free interval
Complete
Fig. 2 – The ASCO framework. ASCO, American Society of Clinical Oncologists. *This description is not complete. Please referto (Schnipper et al).
V A L U E I N H E A L T H 2 0 ( 2 0 1 7 ) 1 9 3 – 1 9 9 195
therapy being replaced), but because we do not readily haveaccess to these values, we use absolute price as a proxy. Thisassumption is reasonable if the price of the therapy beingreplaced is small relative to the price of the drug being evaluated.
Value Criteria
We define a therapy’s value as the per-person price correspond-ing to the therapy’s average per-person benefits. We evaluateeach framework in terms of its adherence to four principles,which we posit reflect logical, reasonable, and credible tenets.
First, value should be proportional to benefit, all else being equal.For example, extending life by 8 months has twice the value ofextending life by 4 months. Proportionality is consistent withboth cost-effectiveness and cost-benefit analyses, methodswidely used to assess the value of health-promoting measures.This principle is also consistent with the idea that “a life-year is alife-year,” regardless of how it is accrued or who receives it.Hence, two therapies that confer the same survival duration gainshould have the same value.
Second, value should reflect attributes that matter to users (patientsor payers), that is, value should reflect elements patients or payerswould in principle be willing to pay for. For example, survivalgains, quality of life, health care cost offsets, and productivityarguably satisfy this criterion. Nevertheless, a drug’s researchand development (R&D) costs, for example, do not. Higherresearch costs facilitate discovery of treatments with thesequalities, and may be something that the government appropri-ately subsidizes (e.g., because of positive externalities), but,per se, higher R&D costs are not part of value.
Third, the relative weight placed on therapy attributes should reflectuser preferences, and should do so transparently. Specifically, in casesin which frameworks allow users to designate weights quantify-ing their preferences, the relationship between the weights, theattributes, and the value should be transparent. For example, if auser can place a weight on survival, it must be clear how thatweight will influence estimated value in the context of a specificsurvival gain. Otherwise, user weight assignments will not bemeaningful.
Finally, when used to inform per-person prices for a drug ortherapy, value should reflect per-person benefit. That is, treatmentvalue for one person should correspond to the benefit accruedwhen one person is treated; it should not depend on the size ofthe treatable population.
Results
We describe the most salient instances in which each frameworkwas inconsistent with a principle.
DrugAbacus
Table 1 lists the medications and associated data used in ourDrugAbacus case studies.
Value attributes are not always patient-centered and/or do notalways reflect per-patient benefit: A distinguishing feature of theDrugAbacus framework is its inclusion of adjustment factors thatdepend on user-assigned preference weights. Some of thesefactors are indeed patient-centered (e.g., the toxicity discountfactor), but four are not (although users may set values to 1indicating that these factors are not important) including the 1)developmental cost premium, 2) rarity premium (not pertinent toper-patient value), 3) population burden premium (not pertinentto per-patient value), and 4) novelty premium (although it ispotentially a proxy for incremental benefit, the unmet needpremium already addresses this attribute).
Table 1 explores the impact of these four factors (which arenot patient-centered) by comparing adjusted prices that accountfor them with the corresponding unadjusted prices that reflectonly survival benefit (which is patient-centered). It lists thesedrugs from the largest to the smallest unadjusted monthly pricereflecting survival benefit only (the second column). In contrast,adjusted prices (the last column) are not in sequence. For example,Gleevec’s unadjusted price ranks sixth, but its adjusted price isthe highest. The correlation coefficient for the adjusted andunadjusted prices is 0.50. Including all 52 drugs in the DrugAba-cus data set, the corresponding correlation coefficient is 0.79. Theshift in sequence means that non–patient-centered factors cansubstantially influence DrugAbacus’ value estimates.
Preference weights are not transparent: Because some of theDrugAbacus adjustment factors have a clear interpretation, userscan meaningfully assign preference weights. For example, asdetailed in Table 1, if the user designates a weight of 3.0 to thenovelty factor, DrugAbacus scales Gleevec’s price by 3.0, Erbitux’sprice by a factor of 2.0, and Tarceva’s price not at all (by a factor of1.0). The DrugAbacus documentation explains that these adjust-ments reflect the conclusion that Gleevec has a novel mecha-nism, Erbitux has a known target but novel delivery, and thatTarceva is not novel. Whether these assumptions are valid isanother question; the point is that a user can understand whathis or her preference weight selection means for the price ofdrugs with these well-defined novelty characteristics (novelmechanism, novel delivery, or not novel).
Other adjustment factors are not always as clear. For example,to account for “population burden,” DrugAbacus scales Tarceva’sprice by 3.0 but Velcade’s price by only 1.4 (see Table 1). Althoughthat difference implies that Tarceva targets a disease with alarger population burden than does Velcade, it is not possible todetermine precisely how “value” (the DrugAbacus adjusted price)depends on quantified population burden. Hence, the usercannot assign a meaningful preference weight to this adjustmentfactor.
ASCO Framework
The ASCO framework quantifies drug value in terms of pointsawarded for clinical benefits, toxicity characteristics, and otherbonus categories. Table 2 presents information used in the ASCOframework for seven cancer drugs. Case studies compareawarded points across drugs, illustrating three limitations.
Value is not proportional to benefit (1): For three drugs—Abrax-ane, Kadcyla, and Ixempra—we consider the clinical benefitpoints awarded and compare those point scores with the corre-sponding survival benefits. Recall from Figure 2 that the ASCOframework awards clinical benefit points on the basis of OS if thatinformation is available, as it is for these three drugs.
The OS hazard ratio (HR) for Abraxane is 0.72, implying thatAbraxane’s hazard rate is 28% less than its comparator’s. Thatreduction yields a score of 100 � 28%¼28 points. Kadcyla’sclinical benefit score is 32 points, whereas Ixempra’s is 10 points.
Now consider how those point scores compare with themedian OS for these three drugs. Abraxane and Kadcyla havesimilar clinical benefit point scores (28 and 32 points, respec-tively) that differ by approximately 15%, but the incrementalmedian OS for these two drugs (at 1.8 and 5.8 months, respec-tively) differ by a factor of 3. In contrast, Abraxane and Ixemprahave very different clinical benefit point scores (28 and 10 points,respectively) but the same incremental median OS (1.8 months).
Value is not proportional to benefit (2): Recall from Figure 2 thatwhen drugs lack OS data, the ASCO framework uses PFS infor-mation to compute the clinical benefit score. Now considerGilotrif and Velcade. Velcade lacks OS information for multiplemyeloma and mantle cell lymphoma, and so the ASCO
V A L U E I N H E A L T H 2 0 ( 2 0 1 7 ) 1 9 3 – 1 9 9196
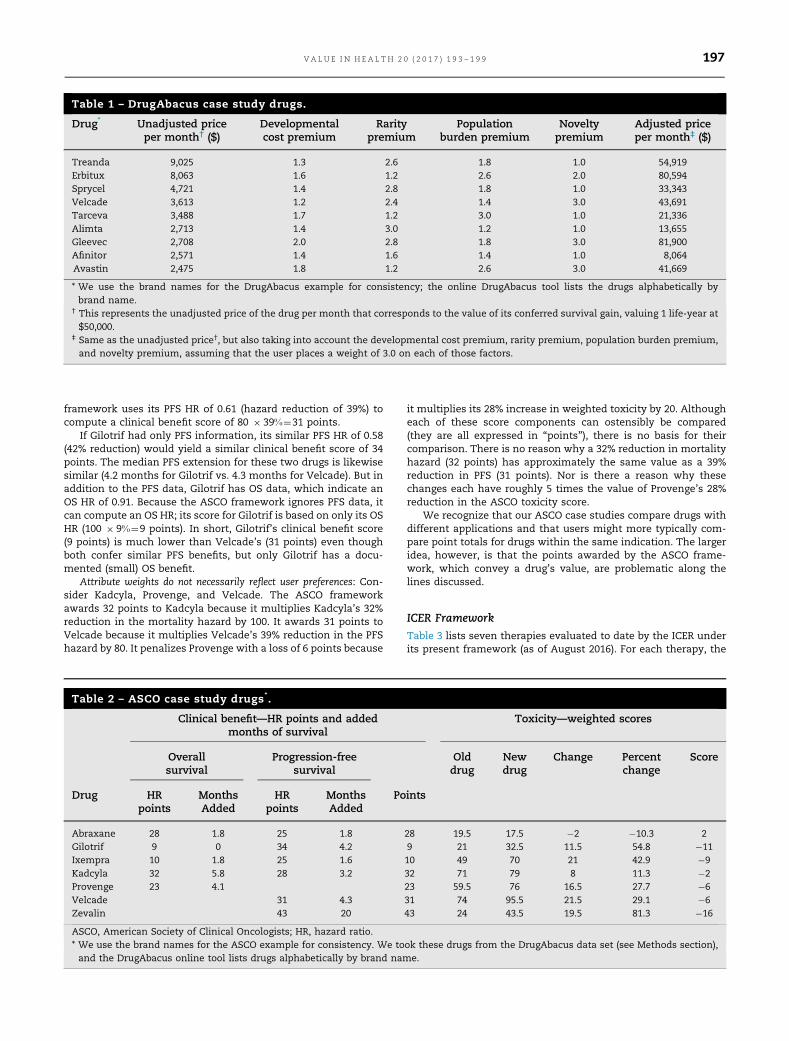
framework uses its PFS HR of 0.61 (hazard reduction of 39%) tocompute a clinical benefit score of 80 � 39%¼31 points.
If Gilotrif had only PFS information, its similar PFS HR of 0.58(42% reduction) would yield a similar clinical benefit score of 34points. The median PFS extension for these two drugs is likewisesimilar (4.2 months for Gilotrif vs. 4.3 months for Velcade). But inaddition to the PFS data, Gilotrif has OS data, which indicate anOS HR of 0.91. Because the ASCO framework ignores PFS data, itcan compute an OS HR; its score for Gilotrif is based on only its OSHR (100 � 9%¼9 points). In short, Gilotrif’s clinical benefit score(9 points) is much lower than Velcade’s (31 points) even thoughboth confer similar PFS benefits, but only Gilotrif has a docu-mented (small) OS benefit.
Attribute weights do not necessarily reflect user preferences: Con-sider Kadcyla, Provenge, and Velcade. The ASCO frameworkawards 32 points to Kadcyla because it multiplies Kadcyla’s 32%reduction in the mortality hazard by 100. It awards 31 points toVelcade because it multiplies Velcade’s 39% reduction in the PFShazard by 80. It penalizes Provenge with a loss of 6 points because
it multiplies its 28% increase in weighted toxicity by 20. Althougheach of these score components can ostensibly be compared(they are all expressed in “points”), there is no basis for theircomparison. There is no reason why a 32% reduction in mortalityhazard (32 points) has approximately the same value as a 39%reduction in PFS (31 points). Nor is there a reason why thesechanges each have roughly 5 times the value of Provenge’s 28%reduction in the ASCO toxicity score.
We recognize that our ASCO case studies compare drugs withdifferent applications and that users might more typically com-pare point totals for drugs within the same indication. The largeridea, however, is that the points awarded by the ASCO frame-work, which convey a drug’s value, are problematic along thelines discussed.
ICER Framework
Table 3 lists seven therapies evaluated to date by the ICER underits present framework (as of August 2016). For each therapy, the
Table 1 – DrugAbacus case study drugs.
Drug* Unadjusted priceper month† ($)
Developmentalcost premium
Raritypremium
Populationburden premium
Noveltypremium
Adjusted priceper month‡ ($)
Treanda 9,025 1.3 2.6 1.8 1.0 54,919Erbitux 8,063 1.6 1.2 2.6 2.0 80,594Sprycel 4,721 1.4 2.8 1.8 1.0 33,343Velcade 3,613 1.2 2.4 1.4 3.0 43,691Tarceva 3,488 1.7 1.2 3.0 1.0 21,336Alimta 2,713 1.4 3.0 1.2 1.0 13,655Gleevec 2,708 2.0 2.8 1.8 3.0 81,900Afinitor 2,571 1.4 1.6 1.4 1.0 8,064Avastin 2,475 1.8 1.2 2.6 3.0 41,669
* We use the brand names for the DrugAbacus example for consistency; the online DrugAbacus tool lists the drugs alphabetically bybrand name.
† This represents the unadjusted price of the drug per month that corresponds to the value of its conferred survival gain, valuing 1 life-year at$50,000.
‡ Same as the unadjusted price†, but also taking into account the developmental cost premium, rarity premium, population burden premium,and novelty premium, assuming that the user places a weight of 3.0 on each of those factors.
Table 2 – ASCO case study drugs*.
Clinical benefit—HR points and addedmonths of survival
Toxicity—weighted scores
Overallsurvival
Progression-freesurvival
Olddrug
Newdrug
Change Percentchange
Score
Drug HRpoints
MonthsAdded
HRpoints
MonthsAdded
Points
Abraxane 28 1.8 25 1.8 28 19.5 17.5 �2 �10.3 2Gilotrif 9 0 34 4.2 9 21 32.5 11.5 54.8 �11Ixempra 10 1.8 25 1.6 10 49 70 21 42.9 �9Kadcyla 32 5.8 28 3.2 32 71 79 8 11.3 �2Provenge 23 4.1 23 59.5 76 16.5 27.7 �6Velcade 31 4.3 31 74 95.5 21.5 29.1 �6Zevalin 43 20 43 24 43.5 19.5 81.3 �16
ASCO, American Society of Clinical Oncologists; HR, hazard ratio.* We use the brand names for the ASCO example for consistency. We took these drugs from the DrugAbacus data set (see Methods section),and the DrugAbacus online tool lists drugs alphabetically by brand name.
V A L U E I N H E A L T H 2 0 ( 2 0 1 7 ) 1 9 3 – 1 9 9 197
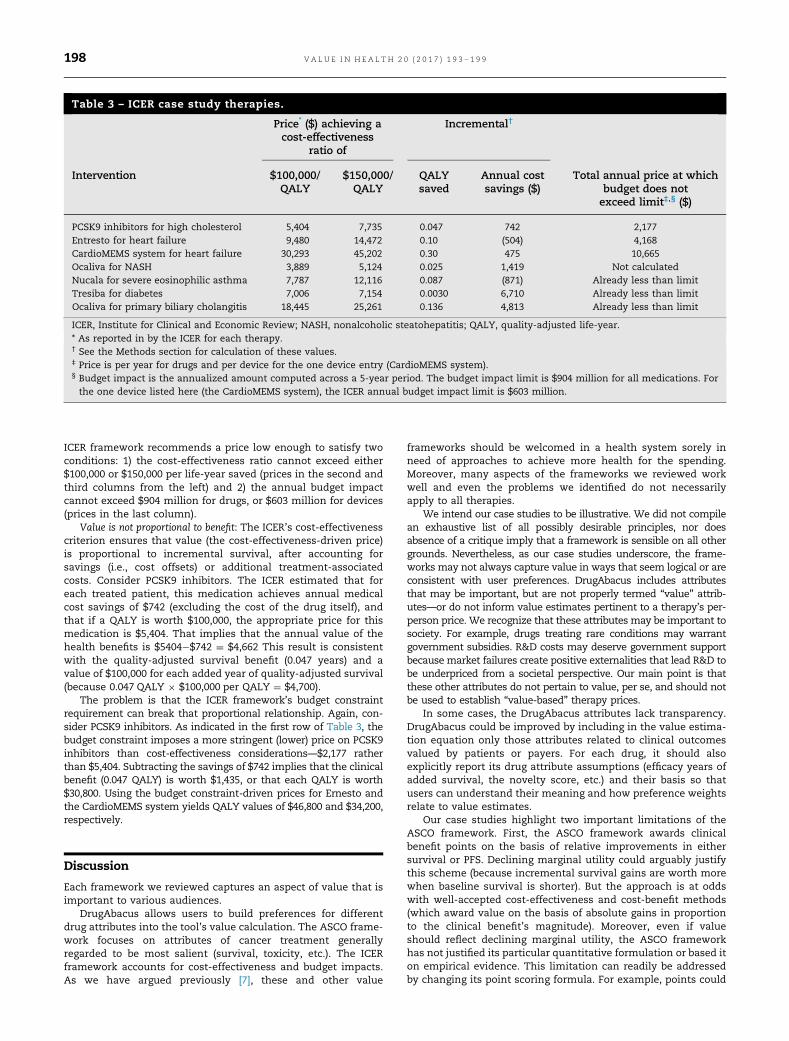
ICER framework recommends a price low enough to satisfy twoconditions: 1) the cost-effectiveness ratio cannot exceed either$100,000 or $150,000 per life-year saved (prices in the second andthird columns from the left) and 2) the annual budget impactcannot exceed $904 million for drugs, or $603 million for devices(prices in the last column).
Value is not proportional to benefit: The ICER’s cost-effectivenesscriterion ensures that value (the cost-effectiveness-driven price)is proportional to incremental survival, after accounting forsavings (i.e., cost offsets) or additional treatment-associatedcosts. Consider PCSK9 inhibitors. The ICER estimated that foreach treated patient, this medication achieves annual medicalcost savings of $742 (excluding the cost of the drug itself), andthat if a QALY is worth $100,000, the appropriate price for thismedication is $5,404. That implies that the annual value of thehealth benefits is $5404�$742 ¼ $4,662 This result is consistentwith the quality-adjusted survival benefit (0.047 years) and avalue of $100,000 for each added year of quality-adjusted survival(because 0.047 QALY � $100,000 per QALY ¼ $4,700).
The problem is that the ICER framework’s budget constraintrequirement can break that proportional relationship. Again, con-sider PCSK9 inhibitors. As indicated in the first row of Table 3, thebudget constraint imposes a more stringent (lower) price on PCSK9inhibitors than cost-effectiveness considerations—$2,177 ratherthan $5,404. Subtracting the savings of $742 implies that the clinicalbenefit (0.047 QALY) is worth $1,435, or that each QALY is worth$30,800. Using the budget constraint-driven prices for Ernesto andthe CardioMEMS system yields QALY values of $46,800 and $34,200,respectively.
Discussion
Each framework we reviewed captures an aspect of value that isimportant to various audiences.
DrugAbacus allows users to build preferences for differentdrug attributes into the tool’s value calculation. The ASCO frame-work focuses on attributes of cancer treatment generallyregarded to be most salient (survival, toxicity, etc.). The ICERframework accounts for cost-effectiveness and budget impacts.As we have argued previously [7], these and other value
frameworks should be welcomed in a health system sorely inneed of approaches to achieve more health for the spending.Moreover, many aspects of the frameworks we reviewed workwell and even the problems we identified do not necessarilyapply to all therapies.
We intend our case studies to be illustrative. We did not compilean exhaustive list of all possibly desirable principles, nor doesabsence of a critique imply that a framework is sensible on all othergrounds. Nevertheless, as our case studies underscore, the frame-works may not always capture value in ways that seem logical or areconsistent with user preferences. DrugAbacus includes attributesthat may be important, but are not properly termed “value” attrib-utes—or do not inform value estimates pertinent to a therapy’s per-person price. We recognize that these attributes may be important tosociety. For example, drugs treating rare conditions may warrantgovernment subsidies. R&D costs may deserve government supportbecause market failures create positive externalities that lead R&D tobe underpriced from a societal perspective. Our main point is thatthese other attributes do not pertain to value, per se, and should notbe used to establish “value-based” therapy prices.
In some cases, the DrugAbacus attributes lack transparency.DrugAbacus could be improved by including in the value estima-tion equation only those attributes related to clinical outcomesvalued by patients or payers. For each drug, it should alsoexplicitly report its drug attribute assumptions (efficacy years ofadded survival, the novelty score, etc.) and their basis so thatusers can understand their meaning and how preference weightsrelate to value estimates.
Our case studies highlight two important limitations of theASCO framework. First, the ASCO framework awards clinicalbenefit points on the basis of relative improvements in eithersurvival or PFS. Declining marginal utility could arguably justifythis scheme (because incremental survival gains are worth morewhen baseline survival is shorter). But the approach is at oddswith well-accepted cost-effectiveness and cost-benefit methods(which award value on the basis of absolute gains in proportionto the clinical benefit’s magnitude). Moreover, even if valueshould reflect declining marginal utility, the ASCO frameworkhas not justified its particular quantitative formulation or based iton empirical evidence. This limitation can readily be addressedby changing its point scoring formula. For example, points could
Table 3 – ICER case study therapies.
Price* ($) achieving acost-effectiveness
ratio of
Incremental†
Intervention $100,000/QALY
$150,000/QALY
QALYsaved
Annual costsavings ($)
Total annual price at whichbudget does notexceed limit‡,§ ($)
PCSK9 inhibitors for high cholesterol 5,404 7,735 0.047 742 2,177Entresto for heart failure 9,480 14,472 0.10 (504) 4,168CardioMEMS system for heart failure 30,293 45,202 0.30 475 10,665Ocaliva for NASH 3,889 5,124 0.025 1,419 Not calculatedNucala for severe eosinophilic asthma 7,787 12,116 0.087 (871) Already less than limitTresiba for diabetes 7,006 7,154 0.0030 6,710 Already less than limitOcaliva for primary biliary cholangitis 18,445 25,261 0.136 4,813 Already less than limit
ICER, Institute for Clinical and Economic Review; NASH, nonalcoholic steatohepatitis; QALY, quality-adjusted life-year.* As reported in by the ICER for each therapy.† See the Methods section for calculation of these values.‡ Price is per year for drugs and per device for the one device entry (CardioMEMS system).§ Budget impact is the annualized amount computed across a 5-year period. The budget impact limit is $904 million for all medications. Forthe one device listed here (the CardioMEMS system), the ICER annual budget impact limit is $603 million.
V A L U E I N H E A L T H 2 0 ( 2 0 1 7 ) 1 9 3 – 1 9 9198

be awarded for each incremental month of survival. Alterna-tively, scoring could reflect baseline survival (presumably award-ing more points in cases in which baseline survival is theshortest). But scoring should not necessarily be tied to the ideathat value is proportional to percent survival gain, as is the casein the present version of the ASCO framework.
Second, the point scores the ASCO framework awards forvarious benefits (extended survival, reduced toxicity, etc.) arearbitrarily derived, on the basis of expert opinion rather thanempirical estimates of user preferences. ASCO should considerconducting user preference elicitation studies to measure thetrade-offs stakeholders are willing to make among the benefitsincorporated into the ASCO framework.
Finally, the budget constraint imposed by the ICER frameworkmay be relevant to payers, but it is not a legitimate attribute ofvalue. In our view, the ICER should continue to report budgetimpact, but its value-based price should not reflect that impact.Source of financial support: This study was supported by theNational Pharmaceutical Council and the PharmaceuticalResearchers and Manufacturers of America. The publication ofthe study results was not contingent on the sponsors’ approval orcensorship of the manuscript.
R E F E R E N C E S
[1] Memorial Sloan Kettering Cancer Center. DrugAbacus—evidence drivendrug pricing project. Available from: http://www.drugabacus.org/.[Accessed June 20, 2016].
[2] The ASCO Post. ASCO value framework update: a statement by Julie M.Vose, MD, MBA, FASCO. Available from: http://www.ascopost.com/News/41599. [Accessed September 16, 2016].
[3] Schnipper LE, Davidson NE, Wollins DS, et al. Updating the AmericanSociety of Clinical Oncology value framework: revisions and reflectionsin response to comments received. J Clin Oncol 2016;34:2925–34.
[4] Institute for Clinical and Economic Review. ICER value assessmentframework: 1.0 to 2.0. Available from: http://icer-review.org/wp-content/uploads/2016/02/Value-Assessment-Framework-slides-for-July-29-webinar-FINAL.pdf. [Accessed August 1, 2016].
[5] Institute for Clinical and Economic Review. ICER response to NationalPharmaceutical Council comments on ICER value assessment framework.Available from: http://icer-review.org/wp-content/uploads/2014/01/National-Pharmaceutical-Council-comments-on-ICER-Value-Framework-Assessment-with-ICER-responses-Final1.pdf. [Accessed August 10, 2016].
[6] Medscape Medical News. Top 100 selling drugs of 2013. 2014. Availablefrom: http://www.medscape.com/viewarticle/820011. [Accessed April 19,2016].
[7] Neumann PJ, Cohen JT. Measuring the value of prescription drugs.N Engl J Med 2015;373:2595–7.
V A L U E I N H E A L T H 2 0 ( 2 0 1 7 ) 1 9 3 – 1 9 9 199