Three Papers on PODS SNS Distribution, Vaccination Strategies, and POD Throughput Presented by Marty...
22
Three Papers on PODS SNS Distribution, Vaccination Strategies, and POD Throughput Presented by Marty O’Neill II
-
Upload
kellie-berry -
Category
Documents
-
view
213 -
download
0
Transcript of Three Papers on PODS SNS Distribution, Vaccination Strategies, and POD Throughput Presented by Marty...
Three Papers on PODSSNS Distribution, Vaccination Strategies, and POD
Throughput
Presented by Marty O’Neill II
Resource Allocation for Demand Surge Mitigation during Disaster
ResponseHina Arora, T.S. Raghu, & Ajay Vinze
The First Paper:
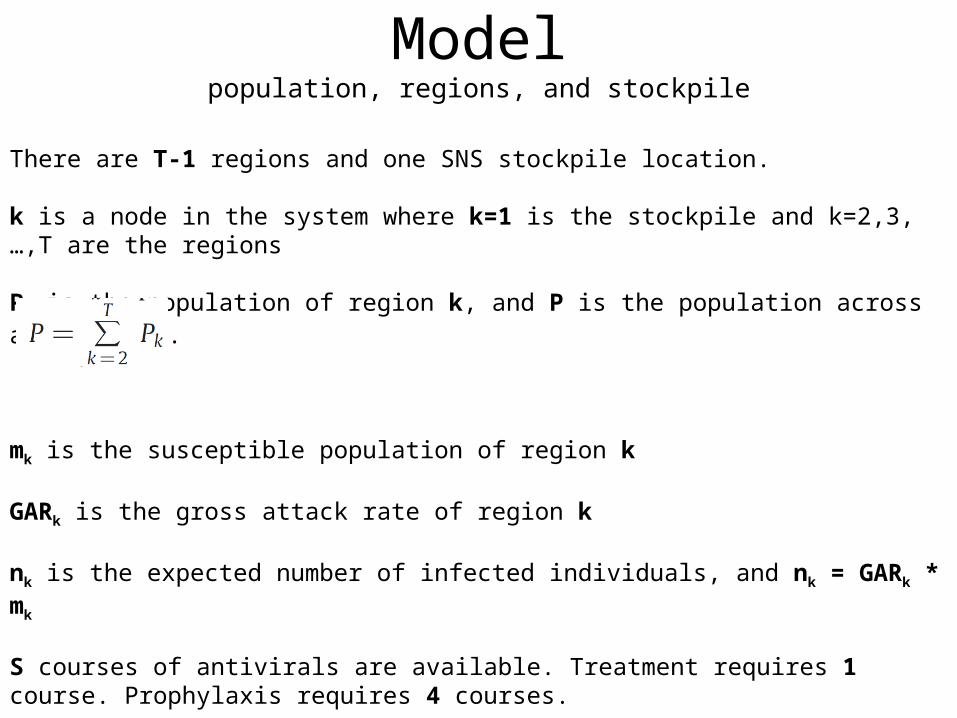
Modelpopulation, regions, and stockpile
There are T-1 regions and one SNS stockpile location.
k is a node in the system where k=1 is the stockpile and k=2,3,…,T are the regions
Pk is the population of region k, and P is the population across all regions.
mk is the susceptible population of region k
GARk is the gross attack rate of region k
nk is the expected number of infected individuals, and nk = GARk * mk
S courses of antivirals are available. Treatment requires 1 course. Prophylaxis requires 4 courses.
Sk is the maximum stockpile allocation for region k using CDC’s equitable allocation approachSk = (Pk / P) * S

Modelprophylaxis & outcomes
For each region k, pPxsk is the proportion of mk provided with prophylaxis treatment. This will consume a total of 4 * (pPxsk * mk) courses of antivirals from the stockpile.
Health outcomes w: wd – death wh – hospitalization wo – outpatient care wn – ill, but seek no medical care
Using The Economic Impact of Pandemic Influenza in the United States: Priorities for Intervention from EID by Meltzer, Cox, & Fukuda,
The number of expected health outcomes nw,k for each region k isnd,k = 0.00202 * nk
nh,k = 0.00791 * nk
no,k = 0.46276 * nk
nn,k = 0.52731 * nk
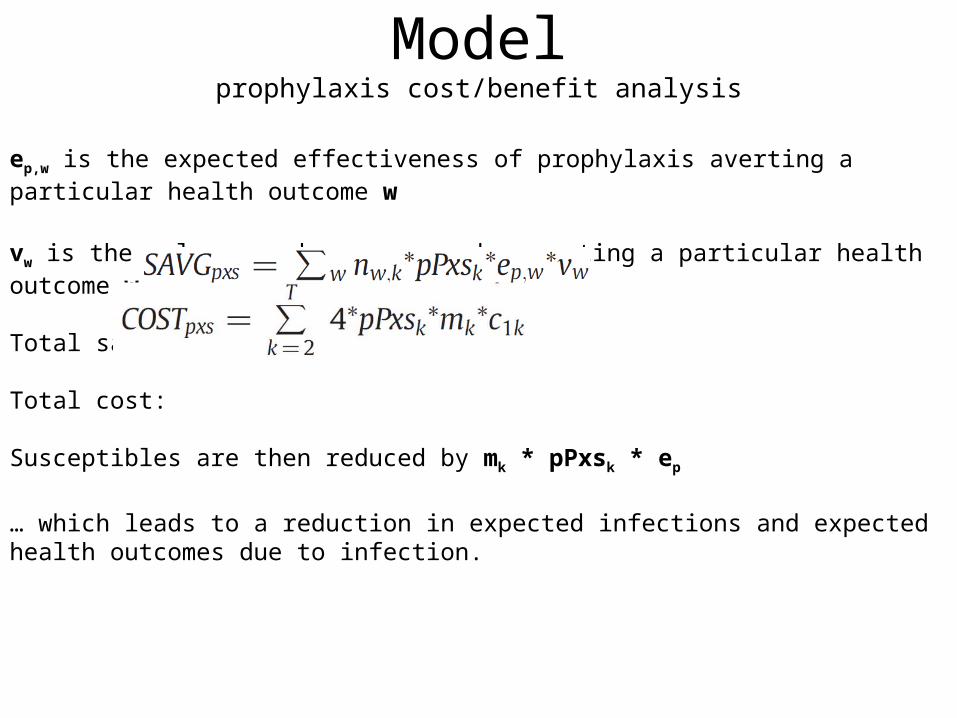
Modelprophylaxis cost/benefit analysis
ep,w is the expected effectiveness of prophylaxis averting a particular health outcome w
vw is the value saved per person by averting a particular health outcome w
Total savings:
Total cost:
Susceptibles are then reduced by mk * pPxsk * ep
… which leads to a reduction in expected infections and expected health outcomes due to infection.

Questions
How much of the CDC stockpile should be pre-allocated?• Current policy is 100%• 60, 80, & 100% were examined• Lower vs. higher GAR examined• When stockpile has enough to go around, all thee cases perform
equally well.
How does GAR impact cost and savings?
• Lower vs. higher GAR examined• When stockpile has enough to go around, all thee cases perform
equally well.
How does implementation of transshipment impact savings?• Transshippment vs. no transshipment

Proportion of max savings vs. Proportion of Total Infectedlower GAR (above) and higher GAR (below)
SNS
SNS

Comments
• Paper studied Influenza PODs, but with focus on possibility of exponentially growing pandemic
• How could their methodology of studying transshipping be applied to cost/benefit analysis of different mobile/temporary POD scenarios for Anthrax or Smallpox?
A Dynamic Network with Individual Mobility for Designing Vaccination
StrategiesLia Mao & Ling Bian
Focus is on Influenza vaccination
The Second Paper:

Modeled Social Network
Day time
Night time
daytime
(These are the same.)
Intercommunity travelersare assigned communitiescloser to each other usinga distance-decay function
Note: This is in geographic space.

Vaccination Methods Modeled
• Travel-based – target intercommunity travelers
• Contact-based – target individuals having larger numbers of direct contacts
• Random – individuals are randomly selected for vaccination
Vaccination is assumed to occur BEFORE outbreak begins.
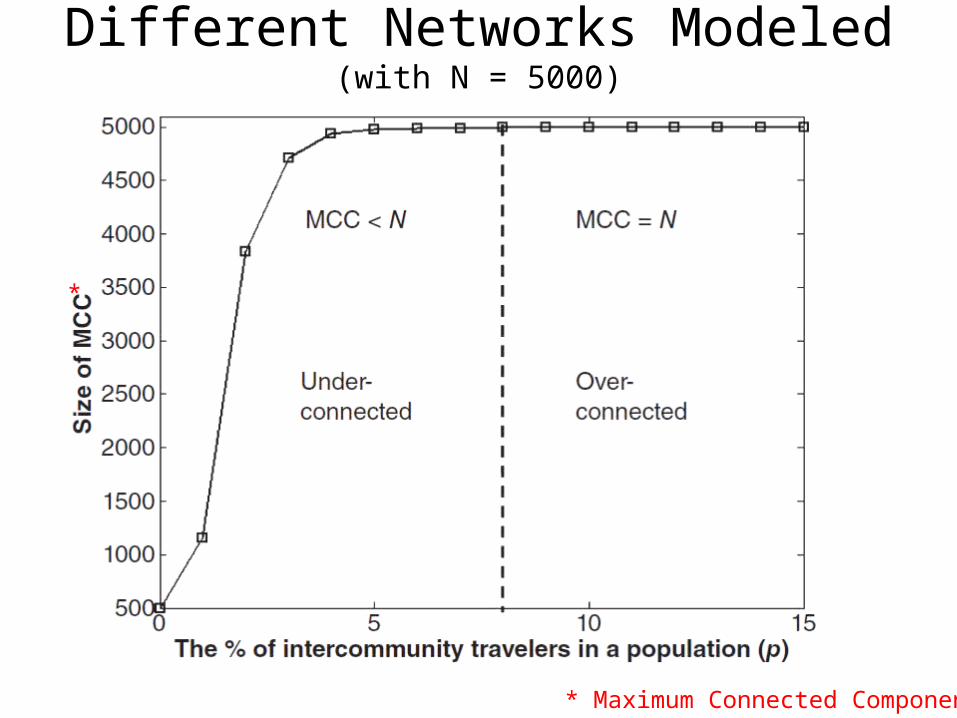
Different Networks Modeled(with N = 5000)
* Maximum Connected Component
*

Vaccination Results% Infected
Under-connected Network Over-connected Network

Vaccination ResultsSpatial Patterns
Travel-based Contact-based Random
Ove
r-co
nnec
ted
Und
er-c
onne
cted
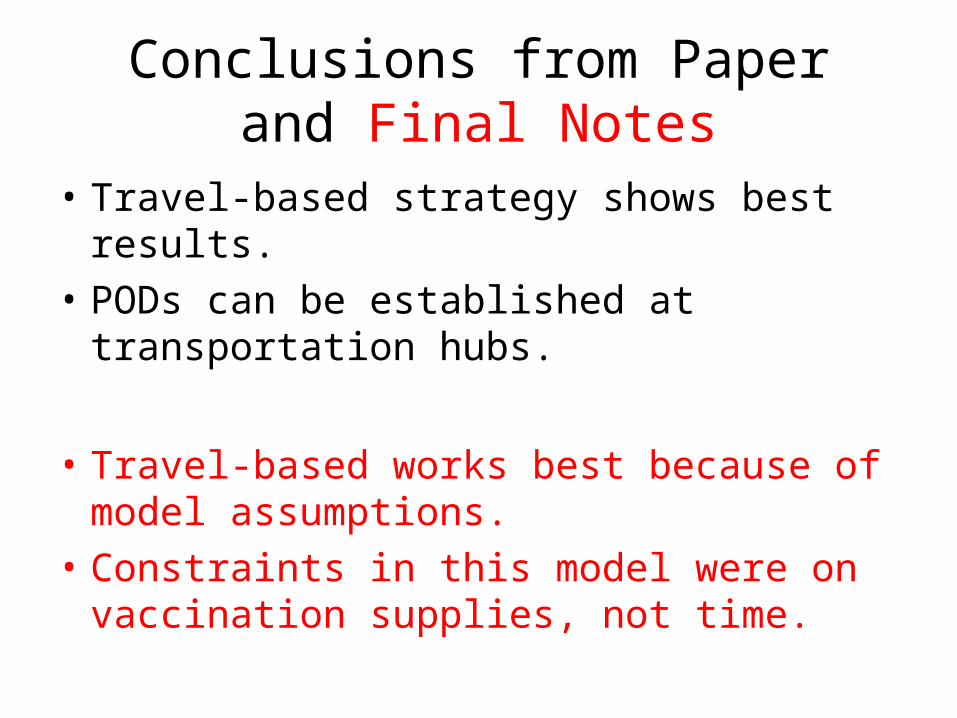
Conclusions from Paperand Final Notes
• Travel-based strategy shows best results.• PODs can be established at transportation
hubs.
• Travel-based works best because of model assumptions.
• Constraints in this model were on vaccination supplies, not time.

Modeling and Optimizing the Public-Health Infrastructure for Emergency
ResponseEva K. Lee, Chien-Hung Chen,
Ferdinand Pietz, & Bernard Benecke
Focus is on “mass dispensing of medical countermeasures for protection of the general population.”
Last (but not least)…The Third Paper:

Within a POD1. Assess client health status2. Assess client eligibility to receive service3. Assess implications of each case and refer for further
investigation if necessary4. Counsel clients regarding services and associated
risks5. Administer services6. Educate clients regarding adverse events7. Document services8. …
Example POD Flowchart
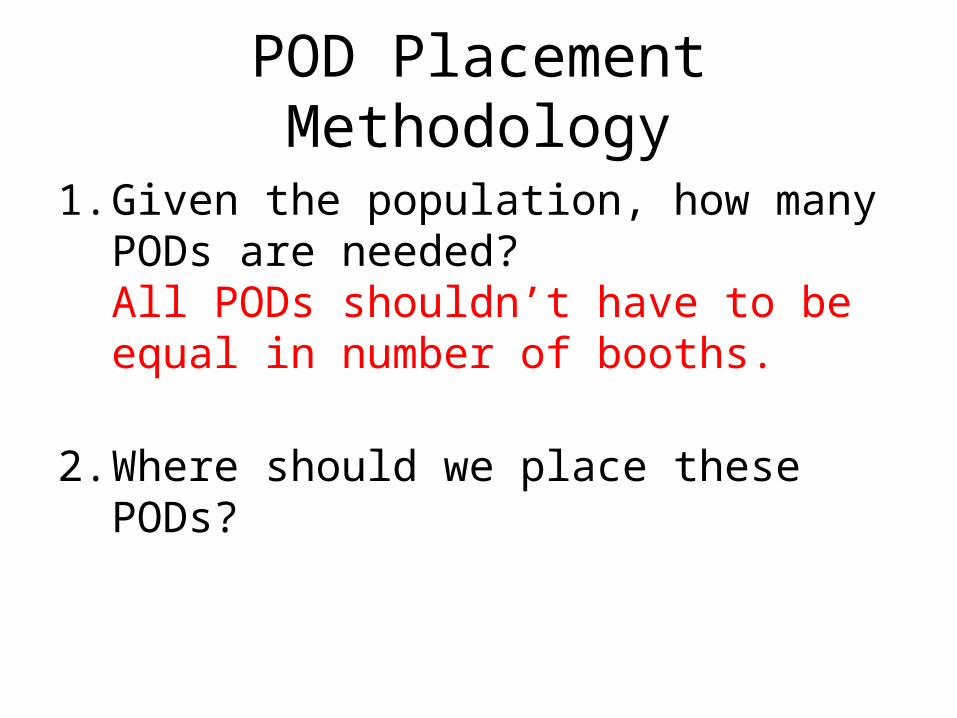
POD Placement Methodology
1. Given the population, how many PODs are needed?All PODs shouldn’t have to be equal in number of booths.
2. Where should we place these PODs?
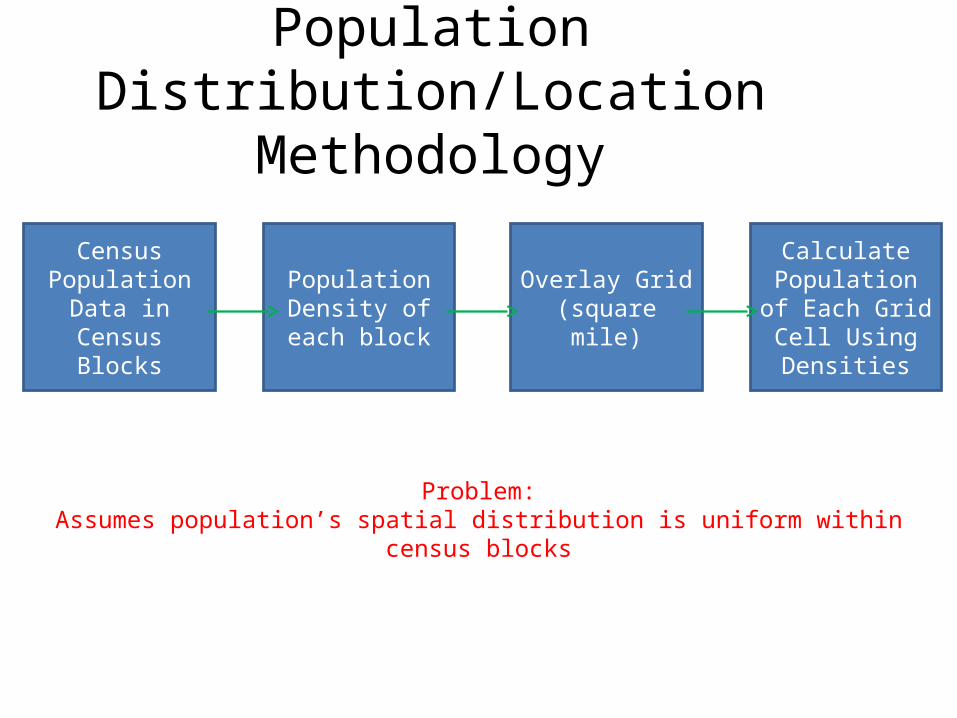
Population Distribution/Location Methodology
Census Population Data in Census Blocks
Population Density of each
block
Overlay Grid(square mile)
Calculate Population of Each Grid Cell
Using Densities
Problem:Assumes population’s spatial distribution is uniform within census blocks
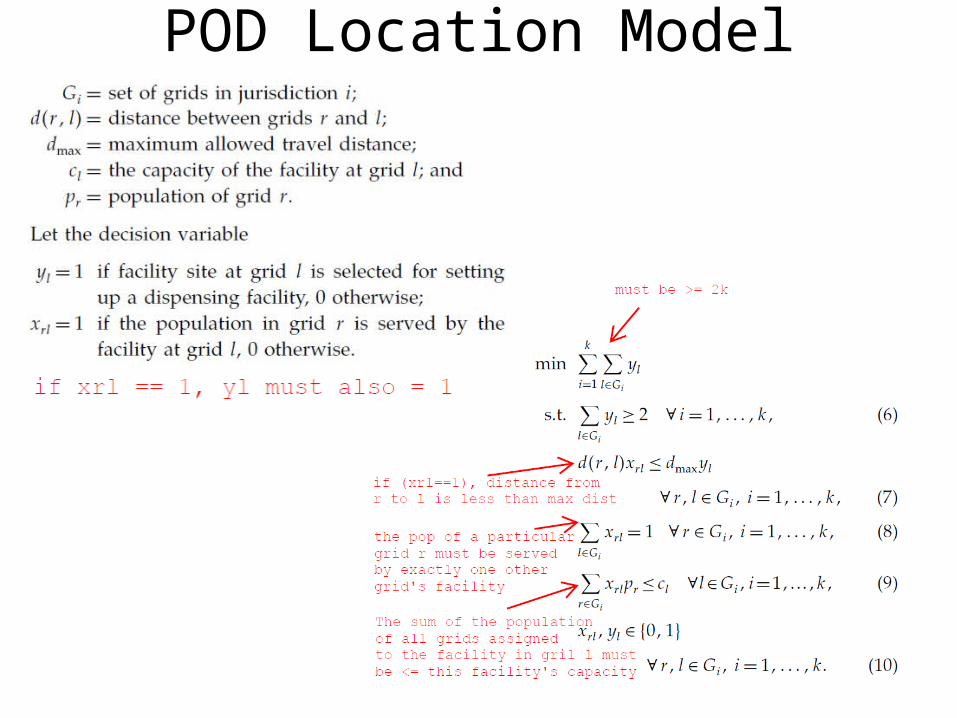
POD Location Model
Overall Comments
• Resource distribution, allocation, and reallocation are currently being studied for SNS distribution.
• Results of computational models underscore importance of successful mitigation through treatment.
• POD throughput analysis and optimization has been investigated. However, not enough attention has been paid to the geographic distribution of the population’s service requirements.