Three Methods of SNe Ia Classification for PS1 and DES
26
Three Methods of SNe Ia Classification for PS1 and DES Spectroscopic Photometric Rest, 2011 PS1 Papers: Scolnic, 2011 0 20 40 60 80 -50 0 50 100 150 flux [m 25 ] z=0.14 0 20 40 60 80 MJD - 55200 z=0.31 0 20 40 60 80 -10 -5 0 5 10 15 20 25 flux [m 25 ] z=0.62 g r i z SNACC Scolnic,Brout,Stafford, 2011 Dan Scolnic, Adam Riess, Steve Rodney, JHU
Transcript of Three Methods of SNe Ia Classification for PS1 and DES
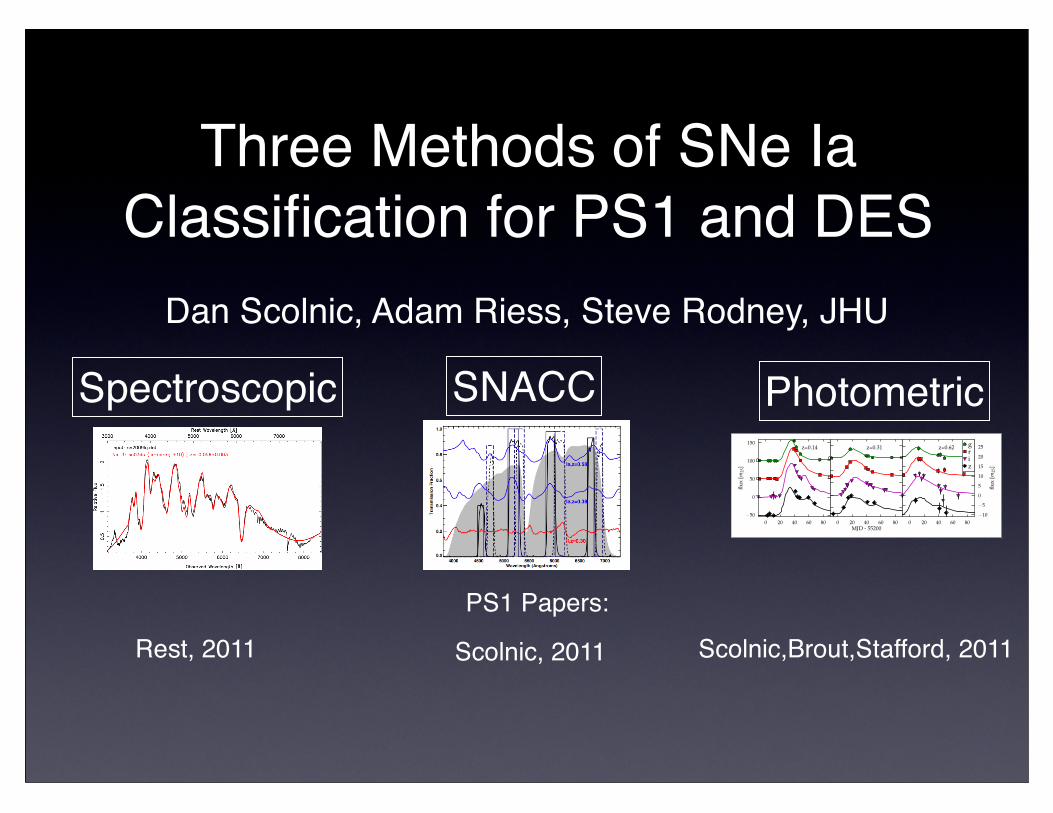
Three Methods of SNe Ia Classification for PS1 and DES
Spectroscopic Photometric
Rest, 2011
PS1 Papers:
Scolnic, 2011
0 20 40 60 80�50
0
50
100
150
flux
[m25
]
z=0.14
0 20 40 60 80MJD - 55200
z=0.31
0 20 40 60 80�10
�5
0
5
10
15
20
25
flux
[m25
]
z=0.62 griz
SNACC
Scolnic,Brout,Stafford, 2011
Dan Scolnic, Adam Riess, Steve Rodney, JHU

Three Methods of SNe Ia Classification for PS1 and DES
Spectroscopic Photometric
0 20 40 60 80�50
0
50
100
150
flux
[m25
]
z=0.14
0 20 40 60 80MJD - 55200
z=0.31
0 20 40 60 80�10
�5
0
5
10
15
20
25
flux
[m25
]
z=0.62 griz
SNACC
(R~1000)high R
(R~5)low R
The spectral resolution:R=λ / Δλ
(R~30)
Dan Scolnic, Adam Riess, Steve Rodney, JHU

• ~2300 likely SNe
• Spec: 10% of sample
- 200 SNe.
- 140 SNe Ia
- 110 useful for cosmology.
• MMT,GMOS,Magellan,APO
• Spec. sample has >S/N, good sampling...
• 1 hour per spectrum
Spectroscopic Follow-up Is Limited/Biased
For PS1:
3
SNe IISpec. PS1
SampleSpec. PS1
SNe Ia
SNe Ibc

• On pace to 300 SNe Ia, confirmed
• 0.05<z<0.65
• In future, will have own low-z sample
How to use Limited Spectroscopic Follow-up for Cosmology
4
• Spectra are expensive
• Consider TACs approval (Incremental progress hard to show)
• Representative vs. Specific Sample vs. Training
Hicken,2009
Rest,2011
For PS1:

How well does photometric classification work?
For PS1, we analyze 4 Sets:
PS1 Spec. Set: Selection Bias: > S/N, >rad. sep., >samp.PS1 Full Set: Everything. 2260 SNeSim. PS1 Spec. Set: SNANA Sim. Best Match SetSim. PS1 Full Set: Full SNANA Sim.
Methods: SOFT (Rodney), PSNID (Sako), SNLS Color Cuts (Bazin)
SNIa CC
122 39? ?
244 782000 1436
Using light curve quality cuts for all sets.


The Photometric Classification (w/wo z) of PS1 Spectroscopic Set has purity in
90s
Purity is very highRedshift Prior does not significantly help.
> S/N, better sampling, not representative of full set
PSNID SOFT
P>0.9,Χ2<1.6
Spec
. Typ
eSp
ec. T
ype
Spec
. Typ
e
Spec
. Typ
e
Spec
. Typ
eSp
ec. T
ype
Spec
. Typ
e
Spec
. Typ
e
Pur=0.92Eff=0.91
Pur=0.93Eff=0.97
Pur=0.99Eff=0.80
Pur=0.99Eff=0.85

The Photometric Classification (w/wo z) of PS1 Spectroscopic Set has
purity in 90s
Ideally, only boxes along diagonalWorst is if small boxes everywherePur=
NIa
NIa + NIa falsetrue
true
Eff=NIa
NIa total
true

The Photometric Classification (w/wo z) of PS1 Spectroscopic Set has purity in
90s
Purity is very highRedshift Prior does not significantly help.
> S/N, better sampling, not representative of full set
PSNID SOFT
P>0.9,Χ2<1.6
Spec
. Typ
eSp
ec. T
ype
Spec
. Typ
e
Spec
. Typ
e
Spec
. Typ
eSp
ec. T
ype
Spec
. Typ
e
Spec
. Typ
e
Pur=0.92Eff=0.91
Pur=0.93Eff=0.97
Pur=0.99Eff=0.80
Pur=0.99Eff=0.85

Spec
. Typ
e
Simulating spec. set reproduces phot. class. results, Purity=89%-93%
PSNID: Spec. PS1 Set PSNID: Sim. Spec. PS1 Set
Simulated comparable, slightly worse, than Real.Efficiency improves with host galaxy prior.
Spec
. Typ
eSp
ec. T
ype
Spec
. Typ
eSp
ec. T
ype
Spec
. Typ
eSp
ec. T
ype
Spec
. Typ
eSp
ec. T
ype
Pur=0.92Eff=0.91
Pur=0.93Eff=0.97
Pur=0.88Eff=0.97
Pur=0.89Eff=0.98
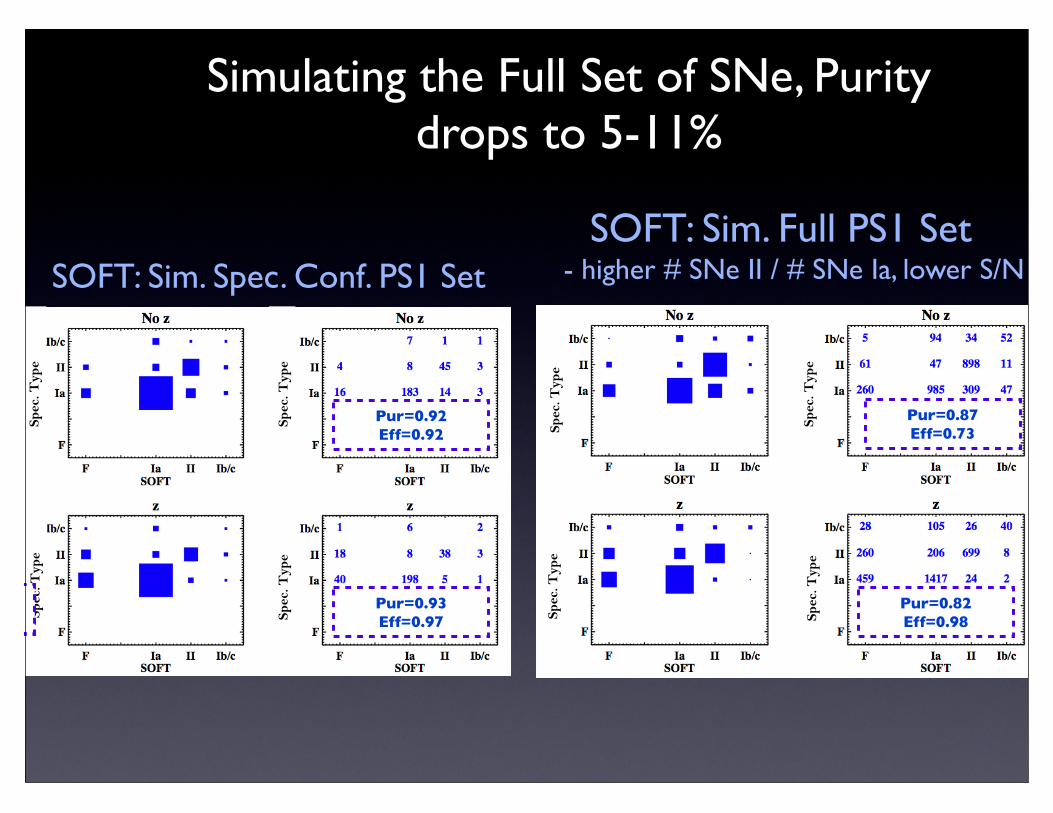
Simulating the Full Set of SNe, Purity drops to 5-11%
SOFT: Sim. Spec. Conf. PS1 SetSOFT: Sim. Full PS1 Set
- higher # SNe II / # SNe Ia, lower S/N
Spec
. Typ
eSp
ec. T
ype
Spec
. Typ
eSp
ec. T
ype
Spec
. Typ
eSp
ec. T
ype
Spec
. Typ
eSp
ec. T
ype
Pur=0.87Eff=0.73
Pur=0.82Eff=0.98
Pur=0.93Eff=0.97
Pur=0.82Eff=0.98Pur=0.82Eff=0.98
Pur=0.92Eff=0.92

We could extrapolate success of classifiers
PSNID(z)
PSNID(no-z)
SOFT(z)
SOFT(no-z)
PS1 Spec. 93%,97% 92%,91% 98%,85% 99%,80%
Sim PS1 Spec. 89%,98% 88%,97% 93%,97% 92%,92%
Sim Full PS1 83%,97% 83%,79% 82%,98% 87%,73%
(Purity,Eff)
to full PS1 set, however...

We See Lower Classifier Agreement in Reality
PSNID v. SOFT: Sim. Full PS1 Set
PSNID v. SOFT: Full PS1 Set
Simulations overestimate agreement of classifiersMore SNe II in Full PS1 Set or More non-SNe in Full PS1 set
Ia/CC Agree=0.72Ia/CC Agree=0.79
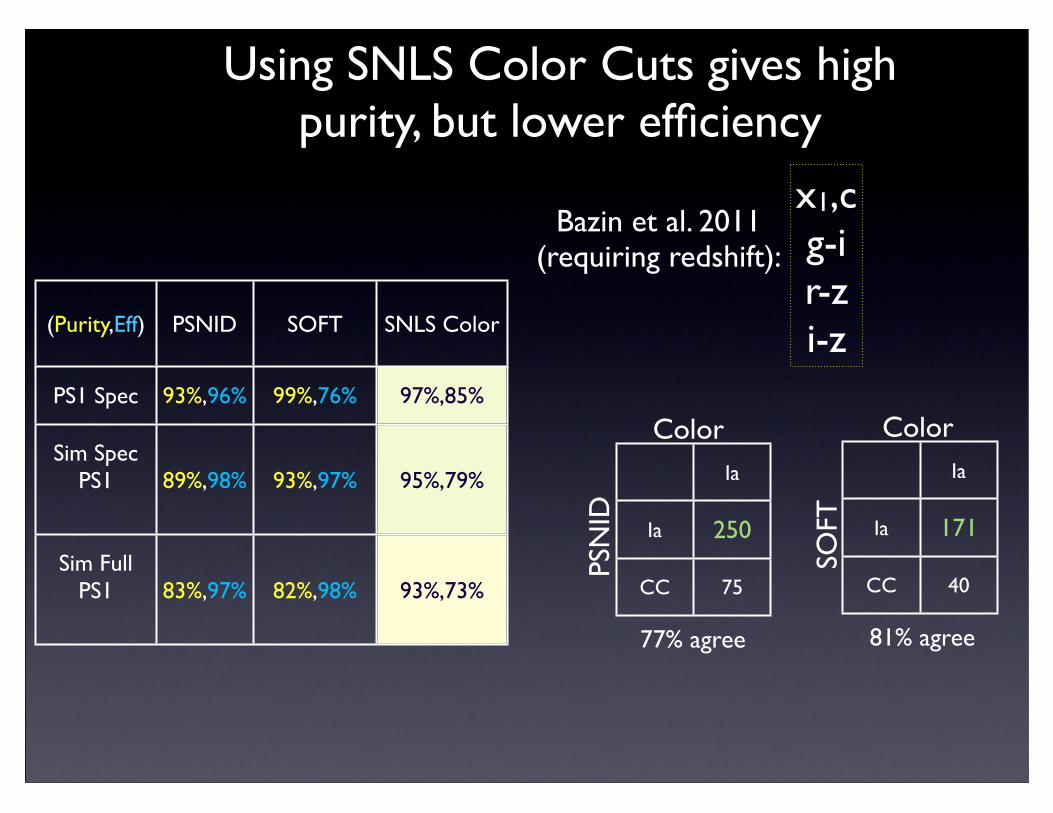
Using SNLS Color Cuts gives high purity, but lower efficiency
Ia
Ia 250
CC 75PS
NID
Color
77% agree
Ia
Ia 171
CC 40
SOFT
Color
81% agree
(Purity,Eff) PSNID SOFT SNLS Color
PS1 Spec 93%,96% 99%,76% 97%,85%
Sim Spec PS1 89%,98% 93%,97% 95%,79%
Sim Full PS1 83%,97% 82%,98% 93%,73%
Bazin et al. 2011(requiring redshift):
x1,cg-ir-zi-z

The goal is to use photometric sample of SNe Ia for cosmology
We can use Bayesian analysis, but...

Using SN Photometric Redshifts Degrades Cosmology
•σz/(1+z)=0.03
•σz ~0.04=>.17 mag error in μ. 3x more SNe needed with photo-zs than spec-zs for similar cosmology constraint
•>20% no clear host galaxy (McCrum,PS1,2011)
•Need closer to spectroscopic accuracy, i.e. host galaxy spec. z Degeneracy between fit z
and fit μ
μ(ph
ot)-μ
(sim
)μ(
phot
)-μ(s
pec)
z(phot)-z(sim)
z(phot)-z(sim)

Presenting An Intermediate R Solution: SNACC filters
Two SNACC Filters
g’+r’

Two SNACC Filters
g’+r’
Presenting An Intermediate R Solution: SNACC filters
Teeth align with spec. features

Two SNACC Filters
g’+r’
Redshift PeriodicityΔz=0.2
(Works 3 loops around)
Presenting An Intermediate R Solution: SNACC filters
Teeth align with spec. features

Two SNACC Filters
g’+r’
SNe II - No Correlation
Redshift PeriodicityΔz=0.2
(Works 3 loops around)
Presenting An Intermediate R Solution: SNACC filters
Teeth align with spec. features

PS1/Subaru SNACC observing Program
•2 ‘Comb Filters’ on SuprimeCam
•600 Angstrom equivalent width, 60% of broadband filter.
•4 minutes per image, high S/N
•Multiplex ~ 10 SNe Ia per 1 deg2
•165 SNe followed-up, 5.5 nights(limited by available targets)

SNACC Classifications are Better than Photometric, ~95%
(Purity,Eff) SNACC
Simulated 95%,99%
Confirmed 95%,83%
•SNACC 95% compared to Photometric ~83%•Low S/N degrades efficiency, not purity•With host galaxy spec-z, purity improves to 99%
For Spec. Verified Candidates:

SNACC provides High Precision Redshifts with breakable degeneracy.
•With photo-z, have accurate and precise redshift, σz~0.01, better than photometric•Can still use Bayesian analysis, infer accurate cosmology
SNACC+Phot-z (accurate + precise)
SNACC (precise, not
accurate)
Phot-z (accurate, not
precise)
zTrue-zMeas
%
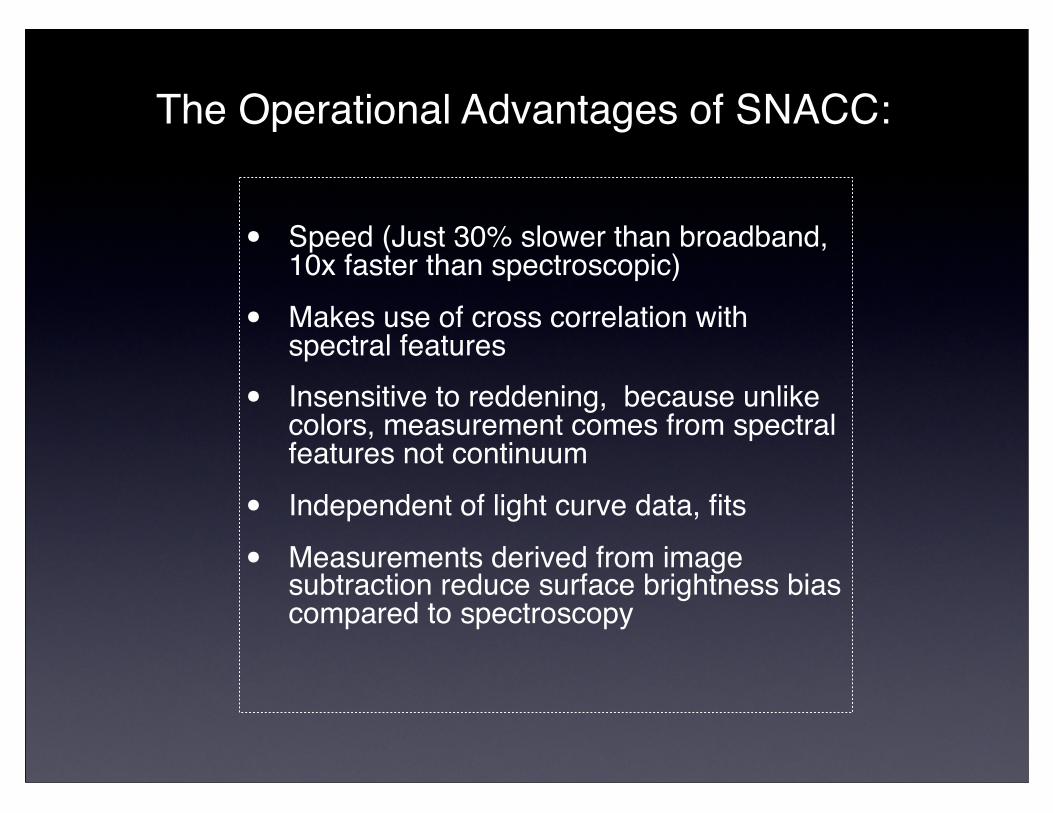
• Speed (Just 30% slower than broadband, 10x faster than spectroscopic)
• Makes use of cross correlation with spectral features
• Insensitive to reddening, because unlike colors, measurement comes from spectral features not continuum
• Independent of light curve data, fits
• Measurements derived from image subtraction reduce surface brightness bias compared to spectroscopy
The Operational Advantages of SNACC:

Possible SNACC Filter Use for DES
• ~1 observation per field per month catches most SNe. Need to sample in (-10 days,10 days)*(1+z)
• Observe whole field - unbiased sample
• 225 s x 2 filters=450s.450sx 5 fields=2250s.2250sx1 per month
~0.5 hour per month• Tuned to 0.3<z<0.8 (or 0.4 <
z<0.9 ...)
• Could be accomplished in small fraction of 10% public time

Summary
• Spectroscopic -Expensive, Need to choose between subsamples
• Photometric - Purities ~ mid 80s% for full set, need host galaxy redshifts
• SNACC - Hybrid, 95% purity, advantage if on DES
Should do all of the above.