
Three Game Changers - MDM · 1 2014 Distribution Software Council Conference June 12, 2014 Three...
81
1 2 20 0 1 14 4 D Di is st tr ri ib bu ut ti io on n S So of f t tw wa ar re e C Co ou un nc ci il l C Co on nf fe er re en nc ce e June 12, 2014 T Th hr re ee e G Ga am me e C Ch ha an ng ge er r s s Redefining Value & Competitive Advantage Thomas P. Gale President Gale Media [email protected] © 2014 by Gale Media, Inc. All rights reserved. Material may not be reproduced in whole or in part in any form whatsoever without permission from the publisher. To request permission to copy, republish, or quote material, please email [email protected] or call 303-443-5060.
Transcript of Three Game Changers - MDM · 1 2014 Distribution Software Council Conference June 12, 2014 Three...

1
22001144 DDiissttrriibbuuttiioonn SSooffttwwaarree CCoouunncciill CCoonnffeerreennccee June 12, 2014
TThhrreeee GGaammee CChhaannggeerrss Redefining Value & Competitive Advantage Thomas P. Gale President Gale Media [email protected]
© 2014 by Gale Media, Inc. All rights reserved. Material may not be reproduced in whole or in part in any form whatsoever without permission from the publisher. To request permission to copy, republish, or quote material, please email [email protected] or call 303-443-5060.

2
Agenda 2014 Distribution Software Council Conference June 12, 2014
8:00-8:45 Welcome & introductions Steve Epner, Jeff Gusdorf
8:45-9:45 Key industry shifts Tom Gale
9:45-10:00 Break
10:00-11:00 Shifts in value, e-commerce Jonathan Bein
11:00-12:00 Distribution Economic Trends Tom Gale
12:00-1:15 Lunch
1:15-2:30 Panel/Discussion
· Rob Kelley, Real Results Marketing
· Peter Neuberger, IDG Corporation
2:30-3:00 Summary comments Steve Epner
TThhrreeee GGaammee CChhaannggeerrss Redefining Value & Competitive Advantage

Download today’s presentation
wwwwww..mmddmm..ccoomm//DDSSCC
3

• Re-fragmented • More polarized • Convergence • Very few differentiating well • Big noise, little signal
• Clear value definition wins 4
Recurring themes & takeaways
If you don't know where you're going, you might not get there.
Yogi Berra

• 1 Inventory trends - VMI, vending • 2 Mobility trends - tablets • 3 HR trends - skills gap, training
• 4 E-commerce trends - multichannel • 5 Analytics trends • 6 Shifting role of sales
2014 Key Trends
© 2014 Gale Media, Inc. All Rights Reserved.

• How do we strengthen and deepen our value and core relationships to compete?
• What do we change?
• How do we differentiate from increasingly complex competition?
6
Key questions

7
Market research in wholesale distribution

8

9
Analytics • Analytics as a Service • Market profiles – North America • Target market dashboards • Sweet spot & purchase behavior • Customer lifecycle management
Customers • Global, regional, local distributors • Fortune 50/500 manufacturers • Consultants, private equity/financial
Applications • Grow revenue • Target markets/prospects • Resource allocation • Product management • Territory management • Network optimization • M&A analysis • Strategic planning
Market Share | Wallet Share | Account Potential
www.imidata.com
RReeaacchh yyoouurr ffuullll mmaarrkkeett ppootteennttiiaall
© 2014 Gale Media, Inc. All Rights Reserved.

• MDM Research Team – Interviews with distributors &
industry consultants – Ongoing MDM reader surveys – Public distributor reports
• 2014 Wholesale Distribution Industry Outlook Report
• 2014 Q1 Baird/MDM Survey
Sources
Industrial Research April 7, 2014
Industrial Distribution 1Q14 Distribution Survey In partnership with Modern Distribution Management David J. Manthey, CFA [email protected] 813.288.8503
Luke L. Junk, CFA [email protected] 414.298.5084
Please refer to Appendix: Important Disclosures and Analyst Certification
© 2014 Gale Media, Inc. All Rights Reserved.

11
0%
10%
20%
30%
<$10
mm
$10-
$25
mm
$26-
$50
mm
$51-
$100
mm
$101
-$25
0 m
m
$251
-$50
0 m
m
>$50
0 m
m
Perc
ent of R
esp
ond
ents
Distributor70%
Manu-facturer
24%
Other (typically Mfg Reps)
6%
Survey Participants
Source: Robert W. Baird & Co. Analysis Baird/MDM Distribution Survey │ 4
• We received responses from ~500 mostly independent distributors with approximately $100 billion in aggregate annual revenue.
• Respondents indicated selling a wide variety of products, primarily focused on Industrial Supply, Industrial Gases, Building Materials, and Wire & Cable.

12
TALENT
TECHNOLOGY
ANALYTICS
Three game changers
Why is 2014 different?
© 2014 Gale Media, Inc. All Rights Reserved.

• Competitive lines blur • Re-fragmentation • Expansion: product portfolio/geographic • Services gap widens • Customers drive multichannel • Data management
13
2014 key themes
Leverage & Differentiation
© 2014 Gale Media, Inc. All Rights Reserved.

• Four walls and the local market are no longer limits
• Drivers – Technology – Global competition – Entrepreneurs – Converging channels
• Retail outlets: Home Depot, Lowes, Staples
2014 key themes
© 2014 Gale Media, Inc. All Rights Reserved.

15
New models
© 2014 Gale Media, Inc. All Rights Reserved.

16
New models
© 2014 Gale Media, Inc. All Rights Reserved.
• Product technology converges channels • Accelerated channel convergence
– Distributors expanding product breadth – E-commerce & master distributors allow broader
reach, expand drop-ship capabilities
• Life is less simple now

What are we hearing?
2014 Outlook
© 2014 Gale Media, Inc. All Rights Reserved.

Source: MDM-NetSuite 2014 Industry Outlook Survey www.mdm.com/2014outlook
How will you grow in 2014?
© 2014 Gale Media, Inc. All Rights Reserved.

• Product expansion facilitating channel shifts • E-commerce & master distributors allow broader reach
and expands drop-ship capabilities
• “There are a lot of folks focusing on product expansion, this concept of endless aisle, different supply chain linkages so they can offer more through online portals.” Interline Brands President Ken Sweder
2014 Outlook
© 2014 Gale Media, Inc. All Rights Reserved.

• Safety & jan-san still big targets • “With a flat market, more nationals will continue to add
adjacent product categories, and safety has seemed like the most prime category.” – Mallory Safety & Supply President Tim Loy
• Interline Brands’ big push into jan-san: – Jan-san is a consumable and stable business – It complements end-markets distributor already serves – It offers opportunity to cross-sell to more customers
2014 Outlook
© 2014 Gale Media, Inc. All Rights Reserved.

• M&A stronger than ever • Strategic acquisitions
• Services gap widens
– inventory management services
2014 Outlook
© 2014 Gale Media, Inc. All Rights Reserved.

22
Inventory Trends
• Increasing demand for Vendor-Managed Inventory (VMI) services – Technology is driving this trend
• Vending demand continues to be strong – However, companies are re-evaluating their
vending programs and getting smarter about what they provide in their vending offerings
• Use of barcode-scanning technology to track inventory

• Fastenal, MSC, Grainger are all targeting vending and inventory management services as key growth drivers.
2014 Outlook
© 2014 Gale Media, Inc. All Rights Reserved.

0
5,000
10,000
15,000
20,000
25,000
30,000
35,000
1Q11 2Q11 3Q11 4Q11 1Q12 2Q12 3Q12 4Q12 1Q13 2Q13 3Q13
Cumulative Vending Machines Installed 1Q11-3Q13
32,248
2,659
Source: MDM analysis; Fastenal 3Q13 earnings report
2014 Outlook
© 2014 Gale Media, Inc. All Rights Reserved.

• “All the data and research that we have done, the customer cares most about having the right product when and where they need it, and there are some products that they want to understand who is using what so they can reduce it or they can limit the amount of products that they’re taking.” – Brian Norris, Grainger’s vice president for inventory management
2014 Outlook
© 2014 Gale Media, Inc. All Rights Reserved.

26
“It does not do to leave a dragon out of your plans if you live near him.”
J.R.R. Tolkein, The Hobbit
TECHNOLOGY

27
E-Commerce Trends
• Increasing number of companies adopting transactional sites
• No longer just transactional, however; now it’s all about “E-Business” – More than just being able to buy products
online; focus on providing a solid customer experience
– Offering services through online portal • Mobile technologies helping drive push for
e-commerce

28
Mobility Trends
• Increased use of tablets – Use in sales force for on-demand price quotes,
customer data – Use in warehouses for inventory management – Use in executive suites for financial snapshots,
KPI tracking

29

30
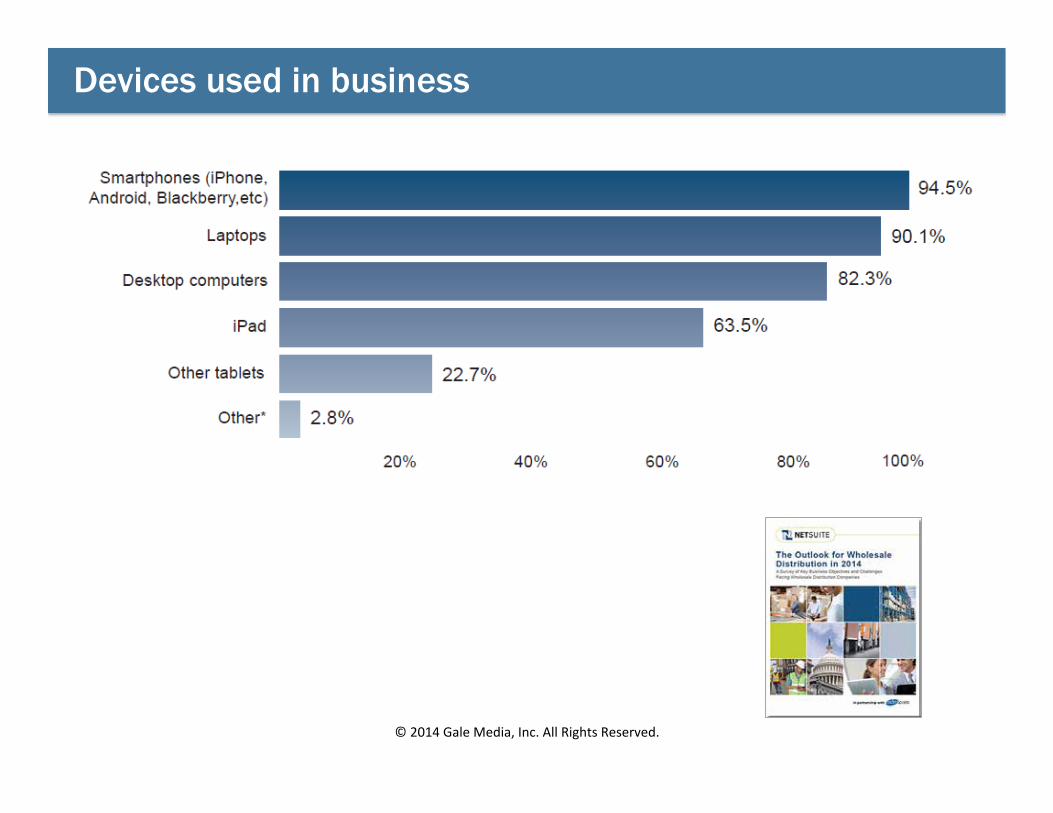
Devices used in business
© 2014 Gale Media, Inc. All Rights Reserved.

Technology plans in 2014
© 2014 Gale Media, Inc. All Rights Reserved.

September 2013 January 2014
Technology
© 2014 Gale Media, Inc. All Rights Reserved.
June 2014

• AmazonSupply – Aggressive push to grow number of SKUs &
product categories – When scale is achieved, what happens next?
• “Amazonization” of customer expectations – Functionality – Ease of ordering – Technical infrastructure – Speed of delivery
Technology
© 2014 Gale Media, Inc. All Rights Reserved.

• Slow build-out: smallparts.com in 2005 • Revenues = $150 million? • Not multi-channel service • Targeted segment of spot buys • No technical expertise • Evolving supplier relationships • Convenience, transparency
Technology: Beyond the hype

• Multichannel is Grainger’s priority – Web platform that can handle customer
interactions across: • Mobile, website & inventory management solutions • Start transaction on one and finish on another
Rewiring distribution
© 2014 Gale Media, Inc. All Rights Reserved.

• Online sales = $3B (30%) • Spanish site • More mobile – traffic more than doubled • 30% of mobile orders picked up at branch • Closed 70 branches • Print catalogs reduced 20% in 2014 • 300 IT/E-commerce hires planned
2013 Grainger digital by the numbers

38
Google, Amazon are accelerating
but not creating critical
competitive trends

TTHHIISS BBOOOOKK
Tells just what your storekeeper at home pays for everything he buys and will prevent him from overcharging you on anything you buy from him.
39
Pricing visibility, alternate channels have been around for more than 100 years!
Excerpt from 1900 Sears catalog cover:


41
The e-commerce race
30+% 9%
© 2014 Gale Media, Inc. All Rights Reserved.

Netsuite / IPad / Bakken Oil Boom • 6+ months for
building permits • Job sites are
remote/dispersed • High service levels
with accurate and immediate data
This distributor gained 6+ months competitive advantage running business out of pick-ups in
North Dakota on iPads and cloud platform © 2014 Gale Media, Inc. All Rights Reserved.
New models

43
ANALYTICS
Have you ever noticed that anyone driving slower than you is an idiot, and anyone going faster than you is a maniac?
George Carlin

44
Analytics Trends
• Focus on driving operational efficiency • High demand for real-time data • Companies “getting their house in order”;
evaluating current processes – Updating ERP, CRM systems – Integrating systems under one platform
• Dashboards for displaying data in high demand – Distributors have enough data from their analytics,
but are looking to get smarter about what they track

© 2014. Gale Media, Inc. All Rights Reserved. 45
1990 Quality – ISO 9000/Systems Contracting
Inventory management, KPIs 2000
2010
Operational efficiencies
Pricing, cost to serve, net profit
Predictive modeling
Strategic imperatives
State of analytics in distribution

State of analytics
WWhhaatt hhaappppeenneedd??
RREEPPOORRTTIINNGG
WWhhyy ddiidd iitt hhaappppeenn??
DDEETTEECCTTIIVVEE AANNAALLYYSSIISS
WWhhaatt’’ss hhaappppeenniinngg nnooww??
DDAASSHHBBOOAARRDDSS
WWhhaatt iiss lliikkeellyy ttoo hhaappppeenn??
PPRREEDDIICCTTIIVVEE AANNAALLYYTTIICCSS
WWhhaatt ccaann hhaappppeenn,, ggiivveenn
ccoommmmuunniittyy bbeehhaavviioorr??
BBIIGG DDAATTAA
Source: www.analyticsvidhya.com Low
High
CCOOMM
PPLLEEXX
IITTYY
BBUUSSIINNEESSSS VVAALLUUEE Low High
• Strong structured thinking • Business understanding • Problem solving
46 © 2014. Gale Media, Inc. All Rights Reserved.

MDM analytics survey insights: • Challenges: Skills, technology,
strategy • Choking on big data • Key differentiators
47
State of analytics in distribution
© 2014. Gale Media, Inc. All Rights Reserved.

What are the biggest impediments to your company’s adoption of analytics?
0%
5%
10%
15%
20%
25%
30%
35%
40%
Our technology infrastructure is
weak
We lack the correct talent to
use our data
We are inefficient at capturing and analyzing data
Our industry hasn’t really
employed analytics in a
significant way
Executives don't understand or
support the use of analytics
We don't know where to begin
Privacy issues
All survey results © 2014 by Gale Media, Inc. Material may not be reproduced in whole or in part in any form whatsoever without permission from the publisher. To request permission to copy, republish, or quote material, please call 303-443-5060.

49
Reactive Assumptions & biases drive decisions in vast majority of companies • Rear-view metrics allocate resources Proactive Analytics & judgment drive results in market leaders • Predictive analytics guide strategy
Competitive gap is widening
© 2014 Gale Media, Inc. All Rights Reserved.

50
“If we treated young folks new to the business today the same way that I was treated 35 years ago, we wouldn’t be able to keep any of them.”
Mike Rowlett, Womack Supply
TALENT
© 2014 Gale Media, Inc. All Rights Reserved.

51
Human Resource Trends
• “Skills gap” continues to persist – Ageing workforce + lack of interest from
“millennials” • Increased recruiting/collaboration with
universities – “Millenials” provide better understanding of new
technologies companies are using • Focus on training and devlopment
– Increasing use of technology to provide on-demand training tools, employee efficiency tracking
• Companies searching out employees, instead of vice versa

52
Shifting Role of Sales
• Sales personnel’s role shifting towards service, driving value-add – The days of the “walk into the office, shake
everyone’s hand” sales personnel is diminishing – Customers looking for sales associates who can
provide services beyond transactional
• Demand for cleaner, real-time analytics to support sales staff

53
22001144 DDiissttrriibbuuttiioonn SSooffttwwaarree CCoouunncciill CCoonnffeerreennccee June 12, 2014
DDiissttrriibbuuttiioonn EEccoonnoommiicc TTrreennddss
Thomas P. Gale President Gale Media [email protected]
© 2014 by Gale Media, Inc. All rights reserved. Material may not be reproduced in whole or in part in any form whatsoever without permission from the publisher. To request permission to copy, republish, or quote material, please email [email protected] or call 303-443-5060.

54
Industrial Research April 7, 2014
Industrial Distribution 1Q14 Distribution Survey In partnership with Modern Distribution Management David J. Manthey, CFA [email protected] 813.288.8503
Luke L. Junk, CFA [email protected] 414.298.5084
Please refer to Appendix: Important Disclosures and Analyst Certification

55
0%
10%
20%
30%
<$10
mm
$10-
$25
mm
$26-
$50
mm
$51-
$100
mm
$101
-$25
0 m
m
$251
-$50
0 m
m
>$50
0 m
m
Perc
ent of R
esp
ond
ents
Distributor70%
Manu-facturer
24%
Other (typically Mfg Reps)
6%
Survey Participants
Source: Robert W. Baird & Co. Analysis Baird/MDM Distribution Survey │ 4
• We received responses from ~500 mostly independent distributors with approximately $100 billion in aggregate annual revenue.
• Respondents indicated selling a wide variety of products, primarily focused on Industrial Supply, Industrial Gases, Building Materials, and Wire & Cable.

56
Overall Results
Source: Robert W. Baird & Co. Analysis Baird/MDM Distribution Survey │ 5
0%
2%
4%
6%
8%
4Q12 1Q13 2Q13 3Q13 4Q13 1Q14 2Q14 3Q14 4Q14
Y/Y
Cha
nge
-100bps
-50bps
bps
50bps
100bps
150bps
1Q12 2Q12 3Q12 4Q12 1Q13 2Q13 3Q13 4Q13 1Q14
Y/Y
Cha
nge
-1%
0%
1%
2%
3%
1Q12 2Q12 3Q12 4Q12 1Q13 2Q13 3Q13 4Q13 1Q14
Y/Y
Cha
nge
0%
2%
4%
6%
8%
10%
1Q12 2Q12 3Q12 4Q12 1Q13 2Q13 3Q13 4Q13 1Q14
Y/Y
Cha
nge
1Q14 Revenues +2.2%
1Q14 Gross Margins +60bps
1Q14 Pricing +1.1%
2Q14/2014 Revenue Outlook +4.1%/+4.9%

57
1Q14Revenue 1Q14 2Q14 2014 Robert W. Baird & Co.Growth Pricing Forecast Forecast Commentary
PVF - Water & Sewer 8.1% 7.1% 7.8% 7.7% Unfinished residential lots diminishing, necessitating new investmentSafety 6.9% 1.2% 1.4% 0.9% Competitive pressures persist, Staples adding safety specialists?HVAC 5.6% 2.5% 5.4% 5.4% Harsh winter weather a benefit in Sunbelt despite lost selling daysGases & Cylinder Rental 4.3% 2.2% 5.3% 4.1% Helium supply vastly improved ex-Air ProductsRental Equipment 3.0% 2.2% 7.3% 6.9% Feedback continues to suggest increased Spring turnaround activityFacilities Maintenance/Jan-San (MRO 2.9% 1.1% 3.2% 3.2% End market growth remains slow, but steadyHoses & Accessories 2.7% 1.1% 5.2% 6.7% Momentum beginning to accelerate following 3 straight flat quartersGeneral Industrial (MRO) 2.4% 0.6% 5.0% 5.4% Trends in March appear to be reacceleratingWelding Hardgoods 2.2% 2.0% 5.1% 5.6% Uptick in demand for bigger-ticket items a positive leading indicatorOverall 2.2% 1.1% 4.1% 4.9%PVF - Industrial & Energy 1.9% 1.0% 2.1% 2.8% 2014 revenue forecast essentially unchangedBuilding Materials 1.5% 1.5% 5.0% 4.7% Lumber prices flattish sequentially in 1Q14Plumbing 1.4% 6.5% 1.5% 6.5% Pent-up demand anticipated following harsh winter weatherElectrical 1.0% 0.3% 3.8% 5.5% Increased optimism for non-res construction and industrial capexPool & Spa 0.5% 0.4% 4.7% 7.2% Underlying industry trends remain broadly positiveCutting Tools 0.5% 0.9% 3.9% 4.4% Trends now tracking more in-line with General Industrial (MRO)Datacomm 0.5% 1.4% 4.2% 4.0% Datacomm trends appear to remain stuck in neutral for nowMechanical/Power Transmission 0.4% -0.7% 1.9% 4.4% First positive revenue reading since 4Q12Roofing -0.6% -0.1% 6.6% 7.8% Increased optimism for summer selling season, but pricing tentativeFasteners -1.1% -2.0% 2.5% 2.1% Pricing on imported product appears set to rise in 2Q14
Results by Product Category
Source: Robert W. Baird & Co. Analysis Baird/MDM Distribution Survey │ 6

58
Industrial Supply Key Themes
Source: Robert W. Baird & Co. Analysis Baird/MDM Distribution Survey │ 11
• Trends appear to be accelerating in March • “March is coming to life – there’s a catch-up going on.” • “March has taken off pretty strong. The activity level has really picked
up, even better than sales.” • “After bad weather to start the month of March, we saw it start picking
up again.”
• Pricing up modestly, no step-change in environment • “We took nominal price in 1Q14.” • “Continues to be competitive, national distributors are dipping into
small/medium markets.”
• Customer demands continue to rise • “Vending as a part of your service mix is there, and will continue to be.” • “More people are asking about vending/VMI every day.” • “Private labels brands have had a significant impact on margin.”

59 Source: Robert W. Baird & Co. Analysis Baird/MDM Distribution Survey │ 12
Industrial Supply Key Themes
• Staples making more noise than AmazonSupply • “Staples is making some noise in safety, they’ve hired 20-30 safety
specialists.” • “We’ve heard that Staples is trying to hire safety specialists, and
they’re not being cheap either.”
• E-commerce investment in focus, but also wariness • “We now have an IT department, and will be launching a new e-
commerce platform later this year.” • “E-commerce is still an area of heavy investment.” • “Ready availability of [online] price comparisons is challenging.”
• Fastener pricing to rise in 2014? • “The Taiwan government is making a major push on environmental
controls [driving costs higher], and China Steel is also trying to push through some kind of an increase.”

60
5.6%
-0.6%
0.5%
-5%
0%
5%
10%
15%
1Q12 2Q12 3Q12 4Q12 1Q13 2Q13 3Q13 4Q13 1Q14
Y/Y
Cha
nge
HVAC Roofing Pool & Spa
2.5%
-0.1%
0.4%
-1%
0%
1%
2%
3%
4%
1Q12 2Q12 3Q12 4Q12 1Q13 2Q13 3Q13 4Q13 1Q14
Y/Y
Cha
nge
HVAC Roofing Pool & Spa
0.5%
-1.6%-1.3%
-3%
-2%
-1%
0%
1%
2%
1Q12 2Q12 3Q12 4Q12 1Q13 2Q13 3Q13 4Q13 1Q14
Y/Y
Cha
nge
HVAC Roofing Pool & Spa
5.4%
7.8%
7.2%
-5%
0%
5%
10%
15%
4Q12 1Q13 2Q13 3Q13 4Q13 1Q14 2Q14 3Q14 4Q14
Y/Y
Cha
nge
HVAC Roofing Pool & Spa
Source: Robert W. Baird & Co. Analysis Baird/MDM Distribution Survey │ 18
Building Products Survey Results
Trends again diverge, HVAC relatively stronger
Weather weakness drives gross margin lower
Average pricing slightly positive, led by HVAC
2014 aggregate expectations above overall survey

61 Source: Robert W. Baird & Co. Analysis Baird/MDM Distribution Survey │ 19
BP: HVAC Key Themes
• Weather a net positive in Sunbelt • “We think the weather – especially the cold – was good for us. We were
up strong double-digits in both January and February.” • “We’ll finish 1Q up more than 20% – estimated half weather-driven,
half underlying growth.
• Industry optimism high for 2014 • “Business is up and people are pretty optimistic.” • “We are optimistic overall, and believe business could be up double-
digits even without favorable weather.”
• Efficiency trends again favorable • “We have seen more movement [upward in efficiency] in the last 5-6
months than in the last 3-4 years.”
• Modest pricing gains forecast • “Conditions are allowing for small price/margin increases.” • “Inventory is up in anticipation of price increases.”

62 Source: Robert W. Baird & Co. Analysis Baird/MDM Distribution Survey │ 22
BP: Facilities MRO Key Themes
• Sales efforts helping drive overall growth • “We are adding sales team members, increasing/improving services
available to our customers. Also continuing to increase inventory and delivery mechanisms to improve service levels.”
• “Targeted expansion of product lines and vendors.” • “[We are providing] training and education as a service to customers.”
• Slow end-market growth • “Stable to some growth.” • “Steady but cautious growth.”
• Here too, weather a headwind • “First quarter was down due to the weather.” • “Appears that distributors have slowed purchases in March due to
missed shipments/lower demand during the weather interruptions from January and February.”

63
Conclusion
Baird/MDM Distribution Survey │ 28
First-Quarter Survey Results
• Average revenue growth: +2.2% y/y
• Average pricing: +1.1% y/y
• Average 2Q14 revenue forecast: +4.1% y/y
• Average 2014 revenue forecast: +5.9% y/y
• Modest rebound in gross margin (1Q14 gross margin +60bps y/y).
• Expected increases in 2Q14 inventories consistent with seasonal patterns, implying a normal ramp into the summer selling season.
*For the first time this quarter, we asked a question about the competitive impact of online-only players. We intend to present this data in the near future in a time series fashion for the sake of comparison over time.

Source: MDM-NetSuite 2014 Industry Outlook Survey www.mdm.com/2014outlook
2014 Outlook
© 2014 Gale Media, Inc. All Rights Reserved.

Wholesale Distribution Economic Trends Report
65
• 19 WD sectors • 9th edition

WD Industry Summary $4.9 Trillion 2012 Industry Revenues + 4.8% 2013 Forecast Growth + 5.4% $1,023,900 Avg. Annual Rev/Employee + 3%
66

Summary of 2012 Performance by Sector
Major Sector (Largest to Smallest Sector Revenues) Actual Revenues (2012)
Real Revenues*
(2012)
Revenue Gap (Actual - Real)
Oil and Gas Products Wholesale Distributors 7.0% 6.2% 0.8%
Grocery and Foodservice Wholesale Distributors 6.1% 4.0% 2.1%
Pharmaceutical Wholesalers 0.1% -3.2% 3.3%
Motor Vehicles and Motor Vehicle Parts Wholesale Distributors 20.3% 18.3% 2.0%
Industrial Distributors 8.4% 5.5% 2.9%
Electrical and Electronics Wholesalers 1.8% 1.0% 0.8%
Miscellaneous Durable Goods Wholesale Distributors -8.5% -6.6% -1.8%
Other Consumer Products Wholesale Distributors 6.9% 3.9% 3.0%
Agricultural Products Wholesale Distributors 2.3% -3.3% 5.6%
Computer Equipment and Software Wholesale Distributors -1.0% 2.3% -3.3%
Commercial Equipment and Supplies Wholesale Distributors 4.5% 2.7% 1.8%
Metal Service Centers 3.9% 8.9% -5.0%
Apparel and Piece Goods Wholesale Distributors 5.9% 3.5% 2.4%
Beer, Wine and Liquor Wholesalers 5.1% 1.8% 3.3%
Chemicals and Plastics Wholesale Distributors 4.6% 4.9% -0.3%
Building Material and Construction Wholesale Distributors 14.5% 12.2% 2.3%
Hardware, Plumbing, and Heating Equipment/Supplies Wholesalers 6.8% 4.6% 2.2%
Office Product Wholesalers and Paper Merchants 0.8% 1.1% -0.3%
Furniture and Home Furnishing Wholesale Distributors 1.6% -0.9% 2.4%
Total 5.1% 3.7% 1.4% 67

% change from year ago
Wholesale Distribution Industry Real Revenue Growth, 2004 to Present (adjusted for inflation)
Source: 2013 MDM Wholesale Distribution Economic Trends Report

69

70

10
11 12
13
14
15
16
17
18
19
20
2000 2002 2004 2006 2008 2010 2012 2014 2016 2018 2020 2022
Thousands, Month-over-Month
Recession 18 Months
Recession 8 Months
GDP
Actual Projected
Source: Congressional Budget Office, Budget and Economic Outlook, Fiscal Years 2013 to 2023.
GDP and Potential GDP
PPootteennttiiaall GGDDPP
71

-10.0
-8.0
-6.0
-4.0
-2.0
0.0
2.0
4.0
6.0
8.0
10.0
1990 1992 1994 1996 1998 2000 2002 2004 2006 2008 2010 2012 2014
Percent Quarterly and Annualized Real GDP 1990-2014
Quarterly GDP
Annualized GDP 1990-1999
Annualized GDP 2000-2009
Sources: Bureau of Economic Analysis and February 2013 NABE Forecast.
Real GDP Growth
72

-20.0
-15.0
-10.0
-5.0
0.0
5.0
10.0
15.0
1993 1995 1997 1999 2001 2003 2005 2007 2009 2011 2013F
YoY Percent Change
Core Wholesale Distribution Revenue Growth
1993-2013
Note: Core excludes the agriculture and the oil and gas sectors.
73

-900
-700
-500
-300
-100
100
300
500
2000 2001 2002 2003 2004 2005 2006 2007 2008 2009 2010 2011 2012 2013 2014
Thousands, Month-over-Month
Recession 18 Months
Recession 8 Months
Sources: Bureau of Labor Statistics (Seasonally Adjusted), National Bureau of Economic Research, and NABE Outlook February 2013.
National Employment
74

Total Employment v. Construction
-35.0
-30.0
-25.0
-20.0
-15.0
-10.0
-5.0
0.0
0 6 12 18 24 30 36 42 48 54 60 66 72 78 84
Percent
Number of Months Since Peak
U.S. Employment Total
Construction
Source: Bureau of Labor Statistics. 75

ISM Indices
30
35
40
45
50
55
60
65
70
2003 2005 2007 2009 2011 2013
ISM Manufacturing Index
30
35
40
45
50
55
60
65
70
2001 2003 2005 2007 2009 2011 2013
ISM Non-Manufacturing Index
Source: Institute for Supply Management (ISM). 76

North American Industrial/Construction Distribution
77
$280 billion market size
Source: www.mdm.com/marketleaders; Industrial Market Information data
More complex, fragmented landscape

• 1 Inventory trends - VMI, vending • 2 Mobility trends - tablets • 3 HR trends - skills gap, training
• 4 E-commerce trends - multichannel • 5 Analytics trends • 6 Shifting role of sales
2014 Key Trends
© 2014 Gale Media, Inc. All Rights Reserved.

• Sign up for free industry daily report: [email protected]
• Ongoing trend analysis in MDM Premium – If you’re not a subscriber, join us at
www.mdm.com/subscribe
• Look for 2014 Distribution Trends Report, released with the 2014 MDM Market Leaders lists later in June
79
Resources

• Business Model Generation • On Innovation, by Terry Jones • The Little Black Book of Strategic Planning
for Distributors, by Brent Grover • Simplify Everything, Steve Epner
© 2014 Gale Media, Inc. All Rights Reserved. 80
Resources

Thomas P. Gale President Gale Media/Industrial Market Information Publisher, Modern Distribution Management 303-440-3857 [email protected] www.mdm.com @mdmnews www.imidata.com https://www.youtube.com/user/jenatmdm
Thank you