Three Essays on Revenue Management in Nonprofit Performing ...
108
Scuola Dottorale di Ateneo Graduate School Dottorato di ricerca in Management Ciclo XXIX Anno di discussione 2017 Three Essays on Revenue Management in Nonprofit Performing Arts Organizations SETTORE SCIENTIFICO DISCIPLINARE DI AFFERENZA: SECS-S/06 Tesi di Dottorato di Baldin Andrea, matricola 815183 Coordinatore del Dottorato Supervisore del Dottorando Prof.ssa Anna Comacchio Prof. Andrea Ellero Co-Supervisore del Dottorando Prof.ssa Daniela Favaretto
Transcript of Three Essays on Revenue Management in Nonprofit Performing ...

Scuola Dottorale di Ateneo Graduate School Dottorato di ricerca in Management Ciclo XXIX Anno di discussione 2017 Three Essays on Revenue Management in Nonprofit Performing Arts Organizations SETTORE SCIENTIFICO DISCIPLINARE DI AFFERENZA: SECS-S/06 Tesi di Dottorato di Baldin Andrea, matricola 815183 Coordinatore del Dottorato Supervisore del Dottorando Prof.ssa Anna Comacchio Prof. Andrea Ellero Co-Supervisore del Dottorando Prof.ssa Daniela Favaretto

c© Andrea Baldin, 2017. All rights reserved.

Three Essays on Revenue Management inNonprofit Performing Arts Organizations
Andrea Baldin
A thesis submitted to the Graduate School of Ca’ Foscari
University of Venice, in partial fulfillment of the requirements for
the degree of Doctor of Philosophy.
January 2017

Acknowledgements
First and foremost, I would like to express my gratitude to my two advisors: Andrea
Ellero and Daniela Favaretto. They have provided competent guidance and continuous
support for all my initiatives.
A special thanks to Trine Bille for her great support during my visiting period at
Copenhagen Business School and even after I left her Department. Collaborating with
her was really inspiring.
I would like to thank the members of the Programming, Strategic Analytics and
Sales Department of the Royal Danish Theatre for their interest in this dissertation
and for the data provided to me.
I gratefully acknowledge Elisabetta Lazzaro (Utrecht University) and Marilena
Vecco (Erasmus University Rotterdam) for their valuable comments to the manuscript
and their constructive suggestions.
Finally, I am grateful for financial support by the Department of Management at
Ca Foscari University of Venice.
iv

Contents
Introduction 1
1 Modelling preference heterogeneity for theater tickets: a discrete
choice modelling approach on Royal Danish Theater booking data 7
2 A DEA approach for selecting a bundle of tickets for performing
arts events 46
3 Multiobjective optimization model for pricing and seat allocation
problem in non profit performing arts organization 78
v

Introduction
The purpose of this dissertation is to demonstrate the effectiveness of Revenue Man-
agement (RM) techniques in nonprofit performing arts organizations, although such
organizations are characterized by multiple and conflicting objectives other than
revenue.
RM can be defined as a set of optimization strategies that match supply and
demand by acting on the prices and the availability capacity (Smith et al., 1992).
The aim of RM is to maximize the revenue by allocating the right capacity to the
right customers at the right price. Since its inception in the 1980’s, RM practices
have quickly developed in the transportation industry, and a considerable amount
of research has been accomplished in the past three decades looking at the issues
detectable in this industry. However, there are other sectors, including the per-
forming arts organizations, that offer a considerable number of RM-type problems
that have not yet been fully addressed. Indeed, theaters as providers of services
are endowed with the features that complies with Kimes’ (1989) preconditions for
a successfull application of RM: the capacity constraint, that makes the marginal
costs of providing the service to one more customer much smaller than the average
cost, unless capacity is full; the perishability of the product offered (i.e, once the
performance starts, an unfilled seat is worthless and the revenue is lost forever); high
fixed costs and low variable costs (once a performance has been staged, the cost of
an additional performance is relatively small).
A decidedly small amount of research have been conducted concerning RM in
nonprofit performing arts organization. One reason that may explain this lack in
attention is that RM is not a pervasive practice in most of these organizations.
Moreover, it can be argued that RM practices are in conflict with the nonprofit
nature of public-subsidized theatres (Lariviere, 2012). This contradiction can be
resolved by considering that nonprofit organizations engage also in for-profit activ-
ities, in order to generate excess revenue to subsidize activities more involved with
their mission (De Vericourt and Sousa Lobo, 2009). Following this perspective, it
can be claimed that RM is a tool for the achievement of a nonprofit performing arts
firm’s objectives. These are, according to literature (Hansmann, 1981; Luksetich
and Lande, 1995): the maximization of the budget to administer; the maximization
of the quality of the services provided and the maximization of the audience. For
example, an opera house can invest the revenue generated by a popular performance
(which is expected to be a high-demand event), in the production of other opera ac-
tivities that are artistically important but less lucrative, satisfying the quality goal.
Moreover, the price discrimination practice, which is an example of an RM tech-
1

nique, enables people who are supposed to be less able to pay, to attend a theatrical
production (audience maximizer goal).
Thus, contextualizing the theory and practice of RM in the field of nonprofit per-
forming arts offers an interesting and unique laboratory for the research, but faces
also specific challenges and requires a special attention. Apart from the multidi-
mensional nature of their objectives, it is necessary to consider other distinguishing
characteristics of this sector. Cultural institutions take the form of ”hybrid orga-
nizations” (Glynn, 2000) in which two identity elements - the normative artistry
and the utilitarian economics - coexist and may come into conflict with each other.
In this framework, managers of cultural organizations deal with five polarities, out-
lined by Lampel et al. (2000), that shape organizational practices1. Although the
dualism between economic and artistic/cultural imperatives is present in non profit
performing arts organizations, we believe that RM practices can work in such kind
of organizations as an aid to theatre managers in managing demand and taking
decision on variables (quantity and price) that must be quantified and that can
take different values according to the preference over the different goals to achieve.
Indeed, the same RM models applied in commercial sector can be adapted in non
profit sector in order to accomodate an utility function that falls along some con-
tinuum between conflicting objectives.
Another peculiar characteristic of these organizations, compared to traditional RM
industries, regards the nature of the product offered. Cultural goods are experiential
goods which value falls to a large extent outside the boundaries of purely economic
value. Their value is more related to abstract, subjective and experience-related
aspects of the product. Therefore, it is difficult to understand why people choose to
consume what they do (Caves, 2000). Similarly, for customer it is difficult to assess
the quality and the value of a cultural product before committing to consume it.
This leads to the demand uncertainty faced by performing arts organizations (the
so-called ”nobody knows” property). Given the difficulty of defining the notion of
quality, in this work we consider the quality as given, at least when we consider
it as an objective of the theatre. A different discourse should be made when the
quality is incorporated in the empirical analysis of consumer demand: as Throsby
(1990) notes, it is extremely hard to take into account the quality in its dimension
derived from a theory of aestheticism. However, some components of quality can
be observed in advance and used in the empirical analysis of demand: genre of the
production, popularity, period of creation and so on. Moreover, as we do in the
1This polarities are: artistic values versus mass entertainment, product differentiation versusmarket innovation, demand analysis versus market construction, vertical integration versus flexiblespecialization and individual inspiration versus creative system
2

first paper, a measure of quality, that is supposed to influence the demand, can
be incorporated through professional reviews (e.g. in the newspaper) and audience
evaluations (word of mouth mechanism).
The dissertation is composed of three papers, each of which examines a RM-type
problem topic that a nonprofit theatre may face. In conformity with the RM logic,
in these papers we consider the earned-revenue derived from the theatre activities,
without considering the other sources of revenue. This clarification allows to gener-
alize the results to other countries, even if the case studies (for the first and third
paper) are Danish, as the main difference between Europe and American non profit
performing arts organization derives by a different source of non-earned income (di-
rect subsidies by government for the former; private donations encouraged by tax
deduction for the latter; see Brooks, 2006).
Research on RM blends element of several disciplines such as marketing, oper-
ations management, operational research, microeconomics, behavioural economics
and industrial organization. Despite its multidisciplinary nature, the mainstream
RM literature is characterized by the usage of quantitative analytical methods. This
approach is justified by the problem-solving nature of RM as a discipline that fo-
cuses on how the demand-management decisions (price, quantity and structural de-
cisions) are scientifically made, through a ”technologically sophisitcated, detailed,
and intensely operational approach” (Van Ryzin and Talluri, 2005). As such, RM
leverages tools from statistics, econometrics and operational research literature in
order to model demand, estimate and forecast market response, and find solutions
to complex decision problems2. In compliance with the dominant practice, this
dissertation makes use of quantitative methods adopting tools from both microe-
conometrics (first paper) and operational research (second paper), also integrating
both of them (third paper).
The first paper investigates customers choice behaviour with respect to the pur-
chase of a theater ticket. In particular, it analyzes the extent to which the different
attributes that are source of price discrimination affect the choice of the ticket, and
how this effect differs among the theatregoers, assuming heterogeneity in prefer-
ences. To this purpose, two modelling approaches; multinomial logit (with socio-
demographic characteristics) and latent class are applied to a dataset for the period
2010-2013 from the sale system of the Royal Danish National Theatre. Final results
2This does not exclude the possibility to adopt a qualitative approach to RM issues: for exampleMitev (2009), using the Actor-Network Theory, analyzes the causes of the failure of a computerisedreservation system (RM technology) in the National French rail company. In this perspective, theauthor is interested in how the introduction of a RM system is translated and interpreted by theorganization and its end-users.
3

suggest that customers characteristics, in terms of age and frequency of theater at-
tendance, characterize different patterns of behavior in the choice of theater ticket.
Moreover, with the results of these models it is possible to estimate the willingness to
pay of each choice attribute and how it differs among customer categories, providing
so guidance to theatre managers in setting prices.
The second paper analyzes a structural-based RM problem. Assuming a theatre
proposes both highbrow and lowbrow events, this paper tackles the issue of iden-
tifying the most efficient subset of the events scheduled by a theatre to offer as a
subscription. The problem is formulated following the choice-based network RM
perspective (Liu and Van Ryzin, 2008), relying on its definition of efficient offer
set as the one that provides the most favourable trade-off between expected revenue
and capacity consumption. Based on this approach, an integrated model that makes
use of the super-efficiency data envelopment analysis (DEA) and a probabilistic ap-
proach is formulated. Indeed DEA seems to be a suitable tool in our context, given
the multi-objective nature of the non profit organizations; whereas the probabilistic
approach models the purchase decision on the basis of two random variables: avail-
able time and reservation price per perfomance. The results of different simulations
are presented considering a range of values for the theatre capacity and the discount
rate of the bundle. Moreover, an econometric analysis is carried out to obtain some
insights into what determines the efficiency level of a subscription.
The third paper develops a bi-objective optimization model that simultaneously
considers pricing and seat allocation, assuming that the theater wants to optimize
both attendance and revenue. The proposed model integrates the demand forecast
with a customer choice model, accounting for the difference in price sensitivity and
seating area preference. Finally the model is validated with booking data from the
Royal Danish Theatre during the period 2010-2016. Results obtained confirms the
existence of a trade-off among the two theater objectives, each of which correspond
to different pricing and allocation policies.
Overall, the three papers should demonstrate the potentiality of RM techniques
for assisting theater managers in their decision-making process for what concerns the
demand-management decisions problems:price, quantity and structural decisions.
We think that this dissertation has added value to literature by intersecting two area
of research that have interacted little with each other. Indeed, whereas RM literature
has devoted greater attention to issues detectable in for profit industries, the culture
economics literature has not give a great deal of attention to the potentiality of
RM techniques and its effects to both the demand side and the achievement of
the objectives of cultural organizations. The three papers presented here aim to
4

demonstrate that this interaction is possible, by analyzing three issues that, at
best of our knowledge, have never been considered in the literature of non profit
performing arts organizations. However, further research is needed in this direction,
especially in light of the fact that nowdays there is a tendency to reduce the public
funds allocated to cultural organizations, forcing the latter to increase their self-
earned income.3
References
• Brooks, A. C. (2006). Nonprofit firms in the performing arts. Handbook of the
Economics of Art and Culture, 1, 473-506.
• Caves, R. (2000). Economics of the creative industries. Cambridge, Mass: Har-
vard.
• De Vricourt, F., Lobo, M.S. (2009). Resource and revenue management in
nonprofit operations. Operations research, 57, 1114-1128.
• Glynn, M. A. (2000). When cymbals become symbols: Conflict over organiza-
tional identity within a symphony orchestra. Organization science, 11, 285-298.
• Hansmann, H. (1981). Nonprofit enterprise in the performing arts. The Bell
Journal of Economics, 341-361.
• Kimes, S. E. (1989). The basics of yield management. The Cornell Hotel and
Restaurant Administration Quarterly, 30, 14-19.
• Lampel, J., Lant, T., Shamsie, J. (2000). Balancing act: Learning from orga-
nizing practices in cultural industries. Organization science, 11, 263-269.
• Lariviere, M. (2012). Should a non-profit use revenue management techniques?.
Retrieved from https://operationsroom.wordpress.com/2012/10/25/should-a-
non-profit-use-revenue-management-techniques/
• Liu, Q., Van Ryzin, G. J (2008). On the choice-based linear programming model
for network revenue management. Manufacturing & Service Operations Manage-
ment, 10, 288-310.
• Luksetich, W. A., Lange, M. D. (1995). A simultaneous model of nonprofit
symphony orchestra behavior. Journal of Cultural Economics, 19, 49-68.
3The three papers are preliminary versions. Further comments received are going to be includedin view of future submission to journals.
5

• Mitev, N. (2009). In and out of actor-network theory: a necessary but insufficient
journey. Information Technology & People, 22, 9-25.
• Smith, B.C., Leimkuhler, J.F., Darrow, R.M. (1992). Yield management at
American airlines. Interfaces, 22, 8-31.
• Throsby, C. D. (1990). Perception of Quality in Demand for the Theatre. Journal
of cultural economics, 14, 65-82.
• Van Ryzin, G. J., Talluri, K. T. (2005). An introduction to revenue manage-
ment. Tutorials in operations research, 142-195.
6

Modelling preference heterogeneity for theatertickets: a discrete choice modelling approach on
Royal Danish Theater booking data
Andrea Baldin∗1 and Trine Bille†2
1Department of Management, Ca’ Foscari University of Venice, Cannaregio 873, 30121 Venice,Italy
2Department of Management, Politics and Philosophy, Copenhagen Business School,Porcelænshaven 18B, 3.floor, 2000 Frederiksberg, Denmark
AbstractThis paper analyzes the behavioral choice for theater tickets using a a
rich data set for 2010-2013 from the sale system of the Royal Danish Na-tional Theatre. A consumer who decides to attend a theater production facesmultiple sources of price variation that depends on: socio-economic charac-teristics, quality of the seat, day of the performance and timing of purchase.Except for the first case, factors of price differentiation involves a choice bythe consumer among different ticket alternatives. Two modelling approachesare proposed in order to model ticket purchases: multinomial logit (MNL)with socio-demographic characteristics, and latent class. These models allowus explicitly to take into account consumers’ preference heterogeneity with re-spect to the attributes associated with each ticket alternative In addition, thewillingness-to-pay (WTP) of choice attributes is estimated. Understandingtheater-goers’ choice behavior and WTP for the quality of seat and the day ofperformance is important to policy makers and theater managers in adoptingdifferent pricing and marketing strategies. Final results suggest that cus-tomers’ characteristics in terms of age, frequency of theater attendance andperiod of ticket purchase characterize different patterns of behavior in thechoice of theater ticket.
Keywords Theater demand - Discrete choice models - Price discrimination - Willingnessto pay
∗E-mail: [email protected]†E-mail: [email protected]
7

1 Introduction
During recent years, revenue management (RM) and price discrimination techniqueshave played an increasing role in the performing arts sector. Evidence shows howtheaters can charge different prices for the same production. This practice is driven,on the one hand, by the social duty consisting of allowing consumer segments whoare supposed to be less able to pay, to attend a theatrical production; and on theother hand, by the possibility of extracting part of the consumer’s surplus. An ex-ample of the first situation is exhibited in discount tickets offered to certain socialcategories (e.g. students, youth, senior citizens...). In the latter case, the theaterprovide consumers with incentives to discriminate among themselves by offering aschedule of different prices according to the quality of the seat. In this way, eachconsumers will choose the seat location in the venue according to reservation priceand preference. Another form of price discrimination is made explicit through avariation in prices, both in the full and in the discount ticket price, according tothe day of the performance: for example, a ticket for a Saturday night performanceis usually more expensive than a ticket for a weekday performance. This kind ofdifferentiation refers to the peak-load pricing issue that takes into account the ca-pacity constraint of the theater, increasing the price when the demand is high anddecreasing it when deman is low.The pricing strategies described above are perfectly coherent with the different ob-jectives that are pursued by a non-profit performing arts organization, as describedby Hansmann (1981): in enabling people with lower willingness to pay (WTP) toattend a performance, the theater satisfies the objective of maximizing the atten-dance, while the appropriation of consumers’ surplus fulfills the budget goal, gener-ating excess revenue to subsidize activities that can be less lucrative but artisticallyimportant (quality goal). After all, as Rosen and Rosenfield (1997) pointed out,price discrimination is observed in activities, such as the performing arts, where themarginal costs of providing the service to one more customer is smaller than theaverage cost: the additional cost to fill one more seat in a theater is in fact quitesmall.As attendees can choose among different ticket alternatives, it is crucial to under-stand their behavior in order to support pricing strategies. Using a unique sale sys-tem data set from the Royal Danish National Theatre during the period 2010/2011to 2012/2013, we aim to analyze which attributes affect the choice of theater ticket.Indeed, the Royal Danish Theatre provides a good example of discriminatory pric-ing. Taking advantage of this rich data set, this study adopts revealed preference(RP) design approach (i.e choice based on actual market behavior) as opposed to a
8

stated preference (SP) approach (i.e choice based on hypothetical scenarios). Bothapproaches are founded in the theory of consumer demand postulated by Lancaster(1966) and present advantages as well as disadvantages: in order to encompassenough variation in the level of attributes, RP requires a large amount of data,whereas SP is more flexible in its data requirements, providing new non-existingalternatives in the hypothetical scenarios presented to the respondents. However,the main drawback of SP is the risk of response bias under experimental conditionswhich, according to Carrier (2008), seem to be high for pricing applications. Giventhe details and wideness of our data set, we adopt an RP perspective in this study.From a methodological point of view, we compare two different approaches to dis-crete choice analysis: MNL with socio-demographic specification, and latent classmodels (LCM). Whereas the MNL model includes interaction terms with socio-demographic terms in order to account for heterogeneous preference, the LCM ap-proach allows the parameters of the utility function to vary across agents accordingto a probabilistic discrete distribution. As Green and Hensher (2003) pointed out,LCM is supported by strong statistical foundations and has a clear interpretationas it identifies different clusters of customers, each of which is characterized by aspecific value of the parameters. Therefore LCM is appealing from both a market-ing and a policy perspective as it distinguishes, along behavioral variables, distinctclasses of customers characterized by different price sensibilities and WTP. More-over, LCM overcomes the independence of irrilevant alternatives (IIA) restriction ofMNL, according to which the odds of choosing one alternative over another alter-native is not altered by the addition of a new alternative.The assumption of heterogeneity seems to be realistic in the theater sector: em-pirical studies on demand for the performing arts have shown ambiguous values ofprice elasticity, in some cases even a positive elasticity, configuring the theatricalexperience as a Veblen good (Laamanen, 2013). Indeed, many of these studies useaggregated data and the average price (revenue divided by attendance) to estimateprice elasticity. Studies that have accounted for different sources of price variation(as our data set allow us to do) produce different estimates of levels of price elas-ticity. Hence, the literature confirms how is heterogeneity among customers in theprice sensitivity.This paper aims to investigate this preference heterogeneity by analyzing the choiceof ticket theater. Unlike previous research on theater demand, we consider the widerange of prices available to customers. For this aim, we adopt a discrete choicemodeling approach and estimate the different WTP for the choice attributes. Thisapproach is widely used in the transportation industries (airline and railway in par-
9

ticular); to the best of our knowledge, Willis and Snowball (2009) and Grisolia andWillis (2011a, 2011b, 2012) are the only researchers to have applied discrete choicemodeling in the performing arts sector. They have investigated preference for thedifferent attributes of theatrical production (as venue, repertory classification, wordof mouth, type of play, author and review). In addition to the different attributesof theatrical production, we consider also the attributes that are sources of pricedifferentiation: seat category, attributes of the different performances for the sameproduction (day, premiere or not), consumer category. This is the main contributionof this study: providing a new segmentation of the theater demand. This may haveimportant implications for policy makers and theatre managers, as the identifica-tion of market segments with different WTP for a theatrical attribute is relevant topricing and marketing strategies.The structure of the paper can be outlined as follows: Section 2 reviews the lit-erature on demand for the performing arts and price discrimination in the theatersector; Section 3 offers a description of the Royal Danish Theatre and its price dis-crimination policy; Section 4 describes the models implemented; Section 5 describesthe data set and the variables used; and Section 6 shows the final result. Finally,Section 7 provides some conclusions and implications of our research.
2 Literature review
This study follows two main streams of literature. The first relates to the deter-minants of demand for the performing arts. Many studies have aimed to identifyelasticity with respect to price and/or income. This topic has been widely ana-lyzed over a long period, starting from Gapinski (1984): we refer to Seaman (2006)for a comprehensive review of the literature on performing arts demand. In addi-tion to price, other variables have been included as determinants of performing artsattendance, for example the price of substitutes (e.g. Colbert et al, 1998; Zieba2009), quality indicators (e.g. Throsby, 1990; Urrutiaguer, 2002), type of play (e.g.Abbe-Decarroux, 1994; Corning and Levi, 2002) and socio-economic variables suchas education level and availability of time (e.g. Werck and Heyndels, 2007; Swansonet al, 2008).The papers most related to ours are those that infer consumer heterogeneity throughattributes that underlie price discrimination. This implies the adoption of disaggre-gated data for price measure and demand. One of the classic segmentations is basedon whether the consumer is a subscriber or not. Felton (1994) analyzed the demandof 25 large US orchestras and estimates two different regressions: the first considers
10

only subscribers, whereas the second also includes the single ticket holders. Theauthor obtained a lower price elasticity for the subscribers (-0.24) than the totalattendance price elasticity (-0.85). Colbert et al. (1998), through a survey con-ducted among the audience of seven Canadian theaters, identified two segments ofconsumers in both the subscribers and non-subscribers groups according to theirsensitivity to price: (a) those who show a high price elasticity are rich in time andpoor in money; and (b) the reverse.Abbe-Decarroux (1994) estimated demand for a Geneva theater company, distin-guishing two kind of tickets: full-price tickets and reduced-price tickets, the latterfor students, seniors and unemployed. As expected, a higher price elasticity (-2.45)was found for the latter consumer group, whereas there was price inelasticity forthe former, full-price ticket group, for whom the price coefficient was not statisti-cally significant. Schimmelpfennig’s (1997) paper employed a non-parametric linearregression analysis to demand for the Royal Ballet Summer Season, a special eventorganized by the Royal Opera House, Covent Garden. The main characteristic ofthis paper is that it focused on the individual seat categories. Surprisingly, for boththe productions examined, the Orchestra Stalls showed a higher price elasticity thanthe cheapest seat category (denoted as Rear Amphitheater), which is supposed toserve low-income consumers.Corning and Levy (2002), instead of estimating different equations for subscribersand single-ticket holders, decided to model the effect of number of subscribers andprice of subscription on the demand for single tickets, including them as explanatoryvariables in the single full-priced tickets equation. An interesting result was thatsubscription sales had a weak effect on the demand for single tickets, hence the twodifferent segments had little overlap. A remarkable characteristic of their work wasthe inclusion of variables related to the time of performance (e.g matinee, evening,preview),which are shown to be highly correlated with scheduled price, and to sea-sonality effects (monthly dummy variables): the final results indicated a significantpositive effect for evening and weekend performances.Laamanen [2013] used eight years of sales system data of the Finnish National Operato estimate demand for opera for both premiere season and reprises. For demandfor the former the price elasticity is fairly small (-0.69), whereas the demand forreprises is highly elastic (-3.99). What distinguishes this paper from the previousone is not only the estimation method based on censored quantile regression, whichallows accounting for the capacity constraint, but also the disaggregation of ticketsales by area of seating and price category. In this way, the researcher was able toavoid bias estimation of price elasticity, which results when the average price ticket
11

and aggregated data are used in the demand estimation.From a methodological perspective, discrete choice models have already been usedin the cultural economics domain: in particular LCM were employed to explainheterogeneity in culture consumption (Chan and Goldthorpe, 2005) and cinemaattendance (Fernandez-Blanco et al., 2009). In the theater sector, discrete choicemodeling has been used in order to assess preference for theatrical attributes (asvenue, repertory classification, word of mouth, type of play, author and review) andto estimate the WTP for each attribute. In particular, Willis and Snowball (2009)and Grisolia and Willis (2011a, 2011b) used an SP discrete choice experiment usingMNL and mixed logit models; while Grisolia and Willis (2012) employ an LCM thatallows audience segmentation according to preferences for attributes of theatricalproductions (e.g. repertory classification, type of play, author, review). Their re-sults suggest a heterogeneous effect of such attributes on consumer choice.The second stream of literature relates to the application of RM and price discrim-ination techniques in performing arts organizations. As RM is an area of researchthat has wide application in in highly commercial industries (e.g. the airline andhotel industries) very little empirical research has been done in the cultural sec-tor. Most RM research in this area has focused on the price discrimination practiceimplemented by theaters. Huntington (1993) used a variant of the hedonic pricemodel to describe price differentiation by seat. This model implies that, if there areobservable differences between seats, a price discrimination policy can be adopted.Moreover, the author showed that the price discrimination policy leads to a greaterprofit than the unique price policy. From a theoretical perspective, Rosen andRosenfield (1997) described a model of price discrimination focusing on the issueon how the theater should sort and price seats in categories, in order to maximizerevenue. In the model proposed, the theaters have two qualities of seat (high andlow) and the seller knows the intensity of the aggregate demand for each categoryand its distribution. Leslie’s (2004) paper is considered one of the most importantpieces of research on pricing strategies in the performing arts field. The authoranalyzed the price discrimination policy for the Broadway show Seven Guitars, es-timating a structural econometric model based on individual consumer behaviour.Tereyagoglu et al. (2012) employed a competing hazard framework to model theticket sales, where the customers race against each other for the same ticket. Theaim of their work was to analyze how pricing and discount actions over time affectthe timing of customers’ purchasing, as well as the propensity of different categoriesof customers (subscribers and occasional buyers) to purchase a ticket.This review of the literature highlights the need to use disaggregated data over price
12

category and performance, in order to analyze consumer behavior towards the pricediscrimination policy. Given the structure of our data set, a discrete choice modelthat accounts for heterogeneous preference in an RP setting seems to be the mostsuitable approach.
3 The price discrimination policy of the RoyalDanish Theater
The Royal Danish Theater was founded in 1748 and is the Danish national theater. Ithas three main stages in Copenhagen. The Old Stage from 1874, a new Royal OperaHouse from 2005 and a new Royal Playhouse from 2008. The Opera House and thePlayhouse have a main stage and smaller stages for experimental productions. TheRoyal Danish Theater is one of the few theaters in the world offering opera, balletand theater performances as well as classical concerts. Before the two new houseswere built, the Old Stage offered opera, ballet and theatre performances. Now theOld Stage is the house where ballet is performed.The price discrimination policy by seat tier has been refined in recent years. In2010 the Opera House and the Old Stage offered 5 different price zones, whereasnow the price variation involves 8 different seat categories. Figure 1 shows the pricediscrimination by seat categoria related to the Opera House in 2016. A differentpolicy is adopted concerning the New Playhouse where discrimination by quality ofseat (up to the maximum of 5 price zones in the theater) is applied to only a fewproductions. 1
Besides by price zones, each ticket sold is characterized by the price type, which isconnected to the characteristics of the buyers that influence the price charged. Inthis study we have excluded some price types, such as the categories for which theticket is free (press, sponsor, guests, attendant for disable, employees) and groupsales. Moreover, we have excluded performances with a flat price, where the price isfixed regardless of seat choice2, rush tickets (discounted by 50%) and those ticketsthat are discounted as the result of an advertising campaign. The logic behindthis selection lies in the fact that these types of tickets either do not show a trade-off between price and seat tier, or do not give the customers the opportunity of acomplete choice of seat category and/or day of performance. Table 1 shows the pricetypes considered in our model.
1Clearly, our sample of productions includes only those for which price discrimination by seatquality is applied.
2E.g. such performances as open dress rehearsals and previews before the opening night
13

Figure 1: Price discrimination of the Opera House seats
Price type Price type group Price type category Discount (%)
1 Standard Standard Standard 02 Youtha/Student Social awareness Discount 503 Senior citizenb Social awareness Discount 504 Theater card (Loyalty card) Loyalty Discount 105 Theater discount Loyalty Discount 206 Subscription Choose your own - youth Subscription Choose your own Subscription 607 Subscription Fixed - youth / student Subscription Fixed Subscription 658 Subscription Choose your own Subscription Choose your own Subscription 109 Subscription Fixed Subscription fixed Subscription 15
a Under 25 years b Only for retirees
Table 1: Price type used by Royal Danish Theatre
Apart from the standard ticket, price types can be roughly divided into two cate-gories: discount and subscription. Discounts can be applied to young people, stu-dents and senior citizens for social awareness purposes and also to those who signup for a loyalty program. In the latter case, customers buy a loyalty card, whichentitles them to some benefits, including a discount on the ticket price of the theaterperformance.The Royal Danish Theater applies two kinds of subscriptions: a fixed subscription,in which the bundle of productions included is predetermined by the theater, and”choose your own” subscription, which allows the customer to choose the produc-tions they want to see. In the latter case, subscribers commit to purchasing a pre-set
14

quantity of tickets and, during the season, they freely choose the content of theirbundle. In general terms, subscribers benefit from a discount with respect to thestandard ticket price: this is an example of second-degree price discrimination, ac-cording to which the unit price varies depending on the quantity demanded.Figure 2 shows how the sales of tickets are distributed among the different pricetypes.
Figure 2: Percentage of ticket sold by price type
The low percentage of senior tickets is surprising. Indeed, many senior customersare subscribers, thus it is not convenient for the theater to offer a discount for seniorcustomers for all of the productions. Senior customers are entitled to a discount of50% only for some productions decided by the theater management. Given this, inour model these senior customers are representative of retiree customers who attendthe theater only occasionally.After deciding to attend a production, each consumer decides the day and the seatquality. Each day/seat combination has a different price that can be discountedaccording to Table 1.
4 Methodology
We consider a situation in which the consumer, after deciding which productionto attend, evaluates a finite number of ticket alternatives, each of which differsby the quality of seat and day of performance (premiere, saturday evening and soon)3. Such combinations of seat and day of performance constitute the choice set
3Some studies in the transportation industry would suggest the ticket decision is a decision madeat the lower nest, while the mode decision is made at the upper nest (Whelan et al., 2008). Similarly,we could consider the decision on which production to attend as an upper nest decision. This kindof decision is the approach adopted by Grisolia and Willis (2011a, 2011b, 2012). However, thisstudy is based on confirmed booking data, so we assume that the production decision has alreadybeen made.
15

C. According to the random utility theory, the utility of alternative j received bythe consumer i is given by:
Uij = Vij + εij (1)
The utility is partitioned in two components: the deterministic (or systematic)utility Vij that is observed by the analyst, and a residual term εij, which includesunobserved effects. It is assumed that the deterministic part is a linear function ofthe observed attributes of each alternative, so that the utility function of alternativej can be written as:
Uij = β′Xij + εij (2)
where Xij is a vector of values representing attributes of the alternative j and β′ isa vector of the corresponding parameters to be estimated.Hence, the probability that the individual i chooses the alternative j is given by:
Pij = P (Vij +εij ≥ Vik+εik ∀k 6= j) = P ((Vij−Vik)+εij ≥ εik) k 6= j,∀k ∈ C (3)
We impose that the errors are independent and identically random variables dis-tributed (i.i.d.) according to a Gumbel distribution. As the difference between twoGumbel variables is a logit random variable, the expression (3) takes the followingform (McFadden, 1974):
Pij = exp(β′Xj)∑k∈C exp(β′Xk) (4)
The coefficients of (4) are estimated by maximizing the likelihood function. Thecontribution to the likelihood for the individual i is given by:
Pi =∏j∈C
Pyij
ij (5)
where yij is a dummy variable equal to 1 if individual i makes choice j, 0 otherwise.Taking the log of both sides we obtain:
lnPi =∑j∈C
yijlnPij (6)
which leads to the overall log-likelihood function for the sample:
lnL(β) =n∑
i=1
(∑j∈C
yijlnPij
)(7)
16

In the conditional logit and MNL models, parameters β are assumed to be fixedamong the population: this implies the same preference structure among customers,as the marginal utility of the attributes is the same in the population of theater-goers.This assumption seems unrealistic in the performing arts sector. Heterogeneity, canbe efficiently addressed including in the model both socio-demographic characteris-tics and choice situation variables. Indeed, as discrete choice models work on thedifference in utility, these variables that do not vary with the ticket alternative canenter the model in two ways: first, by interacting them with attributes of the al-ternative; and second, by including them in J − 1 alternatives. In this way, thesevariables are able to affect the difference in utility.In our application, we include as consumer characteristic variables the informationderived by the type of ticket sold in terms of the discount that identifies consumertypes (student, seniors, subscriber and so on), the period in which the ticket hasbeen sold and whether the customer is inhabitant in Denmark or not. Moreover,the characteristics of the production are also used as variables to accomodate het-erogenetiy among the population. Such variables indeed do not vary across ticketalternatives and are supposed to reflect consumer characteristics. Different produc-tions, in terms of genre, newness, and whether highbrow or lowbrow, attract differentconsumers in terms of social class (see Sintas and Alvarez, 2005) and consequentlyare likely to affect the marginal utility of ticket attributes.In our data set we have customers - as the subscribers - who repeat the choice morethan once. Given the assumption of i.i.d. of the error component, it is not possiblein MNL to account for correlation within individual preferences. However, we at-tempt to overcome this restriction by including variables related to the production:indeed, even if these variables are choice invariant, they can vary across the repeatedchocies made by the same individuals. In such a way we consider the choices madeby the same customers as choices made by different individuals that differ from eachother by the values of the production variables.Another way to incorporate preference heterogeneity is by using LCM. The logicunderlying LCM is that the population can be sorted into S classes, such thatindividuals within the same class have homogeneous preference. Therefore, each pa-rameter β takes s different values with corresponding probabilities. The probabilitythat alternative j will be chosen by a randomly selected individual i is given by:
Pij =S∑
s=1Pij|s ·Mi(s) (8)
17

where Mi(s) is the probability that the individual i belongs to class s. In other terms,(5) is a sort of weighted average of different MNL models (as many as the numberof classes), with the weights represented by the size of each class in the population.The analyst doesn’t know to which class an individual belongs, however the likeli-hood of the individuals belonging to a class can be inferred through a probabilisticassignment process called membership function, which includes individual-specificvariables. An MNL specification is a convenient form for the class membershipmodel. Hence, the probability of individual i to belong to the latent class s is givenby:
Pis = exp(η′sZi)∑S
s=1 exp(η′sZi)
∀s 6= S; ηS = 0 (9)
where Zi is a vector of the values of the individual-specific variable for the individuali while ηs is the corresponding parameter for class s to be estimated. Notice thatfor one latent class (the last one, S) the parameters are normalized to 0 to secureidentification of the model (Greene and Hensher, 2003).Including the membership function in (8) we obtain the probability of choosingalternative j by individual i:
Pij =s∑
S=1
[exp(η′
sZi)∑Ss=1 exp(η′
sZi)
]·[
exp(β′sXj)
exp(∑k∈C β′sXk)
](10)
One feature of the LCM is noteworthy: with the presence of the membership func-tion, the probability of selecting one alternative over another contains argumentsthat include the systematic utilities of the other alternatives available. Hence, un-like MNL, the IIA assumption can be relaxed (Boxall and Adamowicz, 2002). Theparameters of the LCM are estimated maximizing the overall log-likelihood functionfor the sample:
lnL(β, η) =N∑
i=1ln
[S∑
s=1Mis
∏j∈C
P yiji|s
](11)
In estimating (11), the number of classes S is taken as given. Its determinationis usually done through statistical criteria, such as Bayesian information criterion(BIC) and Akaike information criterion (AIC), which are used as a guide to deter-mine the number of classes (e.g. Kamakura and Russel, 1989; Roeder et al., 1999;Wedel and Kamakura, 2000]. These tests are calculated as follows:
AIC = −2LL+ 2K
BIC = −2LL+ Ln(N)K
18

where LL is the value of the log-likelihood function, K the number of parametersand N the sample size. This tests are calculated for models with different numbersof classes. The final number of classes selected is the one for which the value of thetest is the smallest.
5 Data set and variables
Our database consists of the ticket sales by the Royal Danish Theatre during theperiod 2010/2011 to 2012/2013. A total of 250 170 bookings records are included inthe dataset, which involved 23 productions and 377 performances4. For each ticketreservation we have the following information, which allows us to identify the choicemade and customer’s characteristics: buyer’s name and address, time and date ofthe purchase, price paid, price zone and price type.The independent variables that enter in the model as choice attributes are:
• Price (in DKK5)
• Seat category: a dummy variable for each seat category, ranked from 1 (thecheapest) to 5 (the most expensive)
• Wkend: takes value 1 when the performance is either a weekend matinee or isrun on Friday/Saturday evening or in a public holiday day
• Wkday: takes value 1 when the performance is run during weekdays.
Seat1 and Wkday are used as baselines in order to guarantee identification of themodel.The Price and Seat category variables aim to capture the trade-off behavior betweencheap seats with low visibility and/or acoustics, and more expensive high-qualityseats. As the number of seat categories changed through the period under exam-ination, we aggregated productions with more than five price zones into five seatcategories.6
Table 2 provides an example of how the eight seat price categories of the productionTannhauser have been aggregated. The baseline is the production Boris Godunov.Given a seat category and a customer category, Price can change also over time
4For the complete list of productions see the Appendix51DKK ≈ 0.13e6The rule of thumb followed is to consider as a baseline a production of the same genre in which
the theatre was divided in 5 price zones: each new zone is associated with the baseline that has thesmallest difference in price of a standard ticket. The price of the new seat categories is calculatedas the average of the price of the original categories that were been aggregated to assemble thenew categories.
19

Seat Price Seat Price New Seat New pricecategory category category7
1 115 1 125 1 (1,2) 1602 375 2 195 2 (3,4) 3453 565 3 295 3 (5) 5254 715 4 395 4 (6,7) 7205 895 5 525 5 (8) 895
6 6457 7958 895
Table 2: Aggregation of seat categories
adapting it to the expected demand. As a matter of fact, if the demand for the firstperformances of a production is low, then the price for the following performanceswill be reduced. Conversely, price for the following performances will be raised ifthe expected demand increases. However, this fact does not affect the results othe model because for each customer we have information on the price charged inthat moment for each seat category. Hence, our dataset includes the real choice setavailable in the moment in which the customer decides to buy a ticket.The other two alternative variables reflect the choice of the day of performance.As Corning and Levi (2002) have shown, these variables affect performance-leveldemand. We have choosen only two variables to characterize the day of the perfor-mance: we have excluded a dummy indicating whether or not the performance isthe opening performance, because no price discrimination is applied for such perfor-mances. Moreover, the weekend variable includes both the Friday/Saturday eveningperformance and the Sunday matinee. Indeed, from the data set we can observethat Sunday matinees constitute a small fraction of all the performances and theyare not available for all productions. Moreover, we note that, essentially, Sundaymatinee and Friday/Saturday night prices are homogeneous across productions.In addition, in our model we have also included choice-invariant variables. These arerelated to customer characteristics, which are inferable by the ticket type purchasedand the characteristics of the production. Concerning the first set we have:
• Young: takes value 1 when the customer is a student or a young person
• Seniors: takes value 1 when the customer is a senior citizen
• Loyalty: takes value 1 when the customer has bought a loyalty card
• Subscriber : takes value 1 when the customer is a subscriber
• Foreign: takes value 1 when the customer does not live in Denmark
20

• Period: a dummy variable for each period before the performance in whichthe ticket has been sold.
Essentialy, the variables used as customers’ characteristics (except for Foreign) arethose on the basis of which the theatre manager can implement a price discrimi-nation. In this sense, the variables chosen are intended for the purpose of guidingtheatre managers. A note concerning the last variable: we considered for each ob-servation how many days before the performance the ticket was sold. Then weevaluated the distribution of these days among the observations and identified fourquartiles, each representing a period in the sale horizon. Tickets were sold in one offour quartiles or periods before the performance: (1) 233 or more days beforehand;(2) from 64 to 232 days beforehand; (3) from 20 to 63 days beforehand; and (4)up to 19 days beforehand. These dummy variables were used in the MNL model,whereas the LCM model used continuous variables denoting how many days beforethe performance the ticket was sold.We used the following variables for the production attributes, taken from Bille etal. (2015):
• Opera, ballet, play: dummy variables that capture the genre of the productionand the customer’s taste
• Newness: two dummy variables that measure the degree of newness/innovationin the performance
• New DKT : it takes value 1 when the production is run for the first time atthe Royal Danish Theater
• Review: three dummy variable, for bad, average and good newspaper reviewsof the performance
• Audience evaluation: three dummy variables, for bad, average and good audi-ence evaluation of the performance
All these variables are included in the MNL model, whereas in the LCM we haveincluded only the variables related to the genre of the production.Some remarks about the production attribute variables: in Bille (2015), data for theaudiences’ evaluation of the productions were collected every season. Every season,a questionnaire was sent to the audiences of 5 operas, 5 plays and 5 ballets. Foreach production approximately 110 questionnaires were sent out, summing up toabout 1650 questionnaires each season. During all the seasons the response rate hasbeen around 52% (ranging from 49% to 60%). The quality of the performance was
21

Level Variable Description Type
Alternatives Price Price in DKK ContinuousSeat Seat category (5 level) DummyWkend Friday/Saturday evening, Sunday mattinee DummyWkday Weekdays Dummy
Customer Young Under 25 years /Student DummySenior Retirees DummySubscribers Subscribers DummyLoyalty Customers with a loyalty card DummyForeign Equal 1 if customer does not live in Denmark DummyPeriod 4 Periods of purchasing (only MNL) DummyDays No. of days before the performance the ticket has been sold (only LCM) Continuous
Production Genre Opera, Ballet and Play DummyNewness Degree of newness/innovation, 2 levels (only MNL) DummyNew DKT First time in Denmark (only MNL) DummyReview Newspaper review, 3 level (only MNL) DummyEvaluation Audience evaluation, 3 level (only MNL) Dummy
Table 3: Variables used in MNL and LC models
measured on a scale from 1 to 5 (where 1 is low quality and 5 high quality). Datafor the professional reviewers’ evaluations of the productions were collected everyseason as well. Similarly, reviews of the Royal Theater productions in all the ma-jor Danish newspaper (9 newspapers) were collected. Two independent researchersread all the reviews and rated the quality of the productions based on the reviewers’opinion. In this way the quality was indexed on a scale from 1 to 5, and in the caseof inconsistent evaluations the two researchers agreed on the final index.Based on these measures, we identified three categories for the audience’s and thereviewer’s evaluation variables: bad, average and good.The degree of newness in the productions was assessed by an expert in theaterscience. A Mozart opera can be performed in a very traditional way or in an exper-imental or groundbreaking way, as can a brand new production. Newness refers tothe impression of something new regards the direction, the manuscript, the actors,the stage design, the costumes, the music and so on. This variable takes two levels:traditional or innovative. Table 3 sumarizes the variables used in our models.
As already described, the combination of seating area and day of performancedefine the customer’s choice set. One of the main difficulties in the model set-upis identification of the choice set of each booking. Indeed, the seat categories avail-able for an individual depend on the choices made by individuals who have alreadybought a ticket. Because no performance had totally sold out, we do not have infor-mation on whether, at some stage of the sale period, a single region of the theaterhad sold out or, on the contrary, tickets for that zone were available at the time ofthe performance. However, we can observe that, in general, tickets for all the seatcategories were still being sold in the last few days before the performance. Hence,
22

we assume that for each individual the choice set includes all the seat categories.This assumption seems realistic as the theater management has confirmed how, inmost cases, there are available seats for all the price zones just before the beginningof the performance. The only exception was for the senior category, for which insome cases, the theater management chose not to make all the price zones available.Clearly, in estimating the model we take into account the situations in which thiscategory has a reduced choice set.The identification of the choice set by day of performance is easier: for each pro-duction we considered the last Friday/Saturday evening and weekday performance.Assuming this is the chronological order, all the bookings made after the last ticketsold of the last Friday/Saturday evening performance will have a reduced choice setas it will not include the weekday performance.Table 4 illustrates how the choice set generation process works for the productionCosı fan tutte. In the context of this example, all bookings made after (a) face5 alternatives instead of 10 (assuming that all the price zones of the theater areavailable).
Date and time of performance Dummy variable = 1 Date last ticket sold
11-10-2011 19:30 Wkday -14-10-2011 19:30 Wkend -16-10-2011 15:00 Wkend -25-10-2011 19:30 Wkday -27-10-2011 19:30 Wkday -30-10-2011 15:00 Wkend -02-11-2011 19:30 Wkday -06-11-2011 15:00 Wkend10-11-2011 19:30 Wkday -19-11-2011 19:30 Wkend 17-11-2011 10:38 (a)21-11-2011 19:30 Wkday -
Table 4: Choice set generation process
6 Model estimation results
6.1 MNL model
The MNL model is estimated with Biogeme (Bierlaire, 2003)8 and the results areshown in Table 5. The MNL logit model is linear in the parameters specification,including the characteristics of the alternatives and their interaction terms, in orderto accomodate taste variations due to customers’ and performances’ characteristics.
8Biogeme is a free software specifically designed for discrete choice models. It can be downloadedfrom http://biogeme.epfl.ch/home.html)
23

Models with different interaction terms are estimated and compared using the non-nested hypothesis test developed by Horowitz (1982).Table 5 displays the significant coefficient9 of the MNL specification that has showna better-fitting model. The variables play, seat1, period1, wkday, review bad andevaluation bad are used as base variables to allow for identification of the model. Inthe final specification we allow the price sensitivity to take a different value accord-ing to the production characteristics and the period in which customer bought theticket; whereas the marginal utility of the seat and wkend variables interact withthe foreign variable and the different customers’ categories.
The price coefficient is negative, as expected. However, the heterogenetiy of theprice sensibility for the theatrical experience is revealed through the coefficients ofthe interaction terms. In particular, the interaction with the period of purchasingreveals a pattern: the price coefficient increases as we consider bookings made longbefore the day of the performance, reaching a positive value in the first period of thetime horizon (in the first period a coefficient of -0.00203+0.00216 = 0.00013). Forthis portion of consumers, the theatrical experience is configured as a Veblen good.Typically, the earlier ticket buyers are subscribers (Drake et al., 2008; Tereyagogluet al., 2012) who, as empirical evidence has shown, are less responsive to ticketprice changes (Felton, 1994). As Corning and Levy (2002) noticed, single-ticketpurchasers have a higher opportunity cost of time compared to subscribers, so theyprefer to preserve themselves for ”flop”: this can be done by buying the ticket at alater stage, after a period in which crucial information for the purchasing decisionhas been acquired. Moreover, this finding is consistent with the study by Swansonet al. (2008), in which the authors show that there is an association between themotivation to attend a theatrical performance and how far in advance ticket pur-chase decision is made: the stronger is the motivation, the further in advance theattendance to the performance is planned. Furthermore, as Drake et al. (2008)claimed, there is a direct relationship between the demand rate and the inventorylevel: the seats that are already sold at a given price are more valuable than the onesthat remain, as typically the latter are further away from the stage. Also, within thesame seat tiers there are seats that guarantee a better viewing of the performance10.Figure 3 depicts the total sale of subscription and standard tickets in relation to thetime before the performance. We consider the beginning of the time horizon to be62 weeks before the show. For subscribers, the sale pattern reaches different peaks
9All variables are significant except the interaction terms between Price and Ballet and betweenWkday and Loyalty
10An exception occurs when the customer intentionally delays the ticket purchase when it isexpected that the theater uses a discount policy for tickets sold very close to the performance.
24

Coefficient t-stat
Price -0.00203 -17.07Price-Period1 0.00216 38.90Price-Period2 0.00139 36.37Price-Period3 0.000360 10.22Price-Aud. Evaluation average −0.000142∗∗ -1.93Price-Aud. Evaluation good 0.000858 16.81Price-New DKT 0.000918 21.64Price-Newness1 -0.00106 -16.96Price-Newness2 -0.00128 -21.70Price-Opera -0.000574 -14.39Price-Review average 0.000377 8.85Price-Review good 0.000517 9.64
Seat 2 0.648 36.90Seat 2 - Foreign 0.0913∗ 2.26Seat 2 - Loyalty 0.530 2.98Seat 2 - Senior 0.543 3.67Seat 2 - Subscriber 0.898 26.92Seat 2 - Young -0.222 -9.33
Seat 3 1.35 53.13Seat 3 - Foreign −0.0782∗ -2.04Seat 3 - Loyalty 0.306∗∗ 1.80Seat 3 - Senior 1.84 14.16Seat 3 - Subscriber 1.03 31.38Seat 3 - Young -0.622 -24.94
Seat 4 1.80 52.78Seat 4 - Foreign 0.151 4.17Seat 4 - Loyalty 0.534 3.27Seat 4 - Senior 1.52 11.66Seat 4 - Subscriber 1.28 38.12Seat 4 - Young -1.29 -46.38
Seat 5 1.94 43.94Seat 5 - Foreign 0.454 12.71Seat 5 - Loyalty 0.448 2.74Seat 5 - Senior 1.49 11.36Seat 5 - Subscriber 1.40 39.08Seat 5 - Young -1.48 -46.38
Wkend 0.214 36.74Wkend - Foreign 0.357 19.41Wkend - Senior -0.751 -30.91Wkend - Subscriber -0.192 -21.14Wkend - Young -0.143 -11.55
No. of observations 250 170ρ2 0.083Adjusted ρ2 0.083Null log-likelihood - 573738.544Final log-likelihood -526059.818∗∗p = .10 ∗p = .05For all the others variables p = .001
Table 5: Estimation of MNL model
25

until around 30 weeks before the performance, after which it decreases monotoni-cally. In contrast, for standard ticket buyers, from the beginning of the sale periodthe pattern increases monotonically increasing and reaches a peack one week beforethe performance.
Figure 4 shows the cumulative distribution over time for the sales of each seat
Figure 3: Total sales of subscription and standard tickets over time
category, considering the 60 weeks before the date of the performance. From Figure4 it seems that the most valuable seats are sold in the beginning of the sale period,while, as we approach the date of the performance, there is an increase in lowerquality seat sales. This pattern has been also found by Tereyagoglu et al. (2012)and can be explained by the finding that customers with higher valuation of theperformance tend to buy the ticket in earlier periods, whereas customers with lowervaluation tend to buy the ticket in later periods. According to Figure 4, when weconsider 50% of total sales, that figure is achieved for the fifth seat category within16 weeks before the performance, within 12 weeks for the fourth category, within8 weeks for the third category, within 6 weeks for the second category and withinonly 4 weeks for the cheapest seat category. Concerning the interactions with theproduction characteristic, the price coefficient for opera is slightly smaller than forthe play genre, while the interaction with ballet is not significant. Moreover, theprice coefficient decreases as the degree of newness/innovation increases, showingthat the audience prefer traditional and less risky productions than the more ex-perimental. The quality of the production as reported by reviews has a positiveimpact on the customer’s utility as well as, to a greater extent, those productionsthat are performed for the first time at the Royal Theatre. Surprisingly, the effectof audience evaluation does not monotonically increase: the average evaluation co-efficient is negative where the bad evaluation is the baseline, although in terms ofsignificance, the interaction with average evaluation produces the lowest absolute
26

Figure 4: Cumulative distribution over time of each seat category
value of the t− test (-1.93)With regard to the seat quality, the coefficients reflect an expected pattern for thestandard ticket buyers (which coefficient is the one without interaction terms), se-nior, subscribers and customers affiliated with a loyalty program: an increase of thequality of the seat leads to a greater utility. In particular, among these categories,for senior and subscribers this pattern is more evident, followed by loyalty andstandard. Also, foreigner customers (87% of whom are standard ticket buyers),show a similar tendency, with a larger coefficient than Danish standard ticket buy-ers.An explanation for the highest marginal utility of the Senior and Subscribers cate-gories can be interpreted in the light of the well known theory of rational addictiondeveloped by Stigler and Becker (1997): the consumption of cultural goods (a the-ater production in our case) increases the consumers’ future capacity to appreciateit, through the ”learning by doing” process. Hence, previous exposure to the culturalgoods to leads to a growth in consumption and therefore to an increasing WTP. Inthis sense subscribers and seniors are the type of customers who have accumu-lated consumption capital through their past consumption: the former because asubscription implies high frequency of theater attendance, the latter because of theage component. These customers, more than others, pay attention to seats thatprovide a better quality of theatrical experience from both the acoustic and visualperspectives.The young category has the lowest value of marginal utility and does not increasemonotonically with respect to seat quality, the largest value corresponding with thethird seat category. Therefore, it seems likely that this category would not considerbuying expensive seats and would pay little attention to the seat quality.
27

Figure 5 shows more graphically for each category the relationship between the util-ity function and the level of the seat attribute. As Figure 5 seems to suggest, except
Figure 5: Quality of seat in relation to the utility function
for young customers, the relationship between quality of seat and customers’ utilityis approximately increasing and concave, meaning that as the level of seat qualityincreases, the difference in utility gets smaller and smaller.Finally, we notice that, with the exception of senior, weekend performances are pre-ferred over weekday performances, particularly by the foreigners standard ticketbuyers, followed by Danish standard ticket buyers, young and subscribers. Thisresult is probably due to to a greater flow of tourists in the city of Copenhagenduring the weekend. The negative value for senior (0.213-0.510 = 0.297) can beexplained by considering that this category is rich in time and therefore prefers thecheaper weekday alternatives. However, compared to the seat attributes, the day ofthe performance has a lower impact on explaining the choice of ticket.
6.2 Latent class estimation
In the LCM we aim to identify distinct groups of theatergoers according to theirbehavior with respect to the type of ticket purchased. We initially assess the num-ber of classes in the LCM by BIC and AIC. These statistics indicate whether thecomplexity of the model, that is the number of parameters to be estimated, can becompensated by an improvement in the value of the log-likelihood. Table 6 sum-marizes the statistics for models with one, two, three and four classes. The resultsshow that as the number of classes increases, the model fits the data better. Byfurther increasing the number of classes, we obtain the optimal model with sevenclasses. However, as the number of segments increases to more than four classes,
28

No. of classes Log-likelihood value AIC BIC
1 -540535,3380 1081082,6759 1081145,25532 -530590,2024 1061224,4048 1061453,86253 -524502,4273 1049080,8545 1049477,19064 -521576,2680 1043260,5359 1043823,7503
Table 6: Criteria for determining the optimal number of classes
we obtain some small segment sizes that make the parameter estimated unstable.For this reason, and also for an easier interpretation of the model, we adopt thefour-class solution.The explanatory variables of the choice model are price, seat and wkend, with seat1and wkday set to 0 as base variables. We include the membership function in or-der to assign individuals to classes according to their characteristics and the choicesituation. The variables employed for the membership function include the dummyvariables related to the customer ticket’s category and genre of the production.Moreover, we include a variable indicating how many days before the performancethe ticket was bought: compared to the MNL model, where this is used as a cate-gorical variable in 4 levels to be interacted with price, we use days as a continuousvariable in the membership function that contributes to the class assignment of in-dividuals.Table 7 reports the results derived from the LCM, which was estimated using thesoftware Latent Gold Choice (Vermunt and Magidson, 2005). Given that the mag-nitude of the coefficients of the choice model cannot be compared between differentclasses due to scale parameter [Carrier, 2008; Hetrakul and Cirillo, 2013], the dif-ferent behavior of the classes is compared by their WTP for the choice attribute.As for the membership function, the coefficients indicate how much the variablesaccount for the belonging to that particular class: the variables are interpreted inrelation to Class 4 and normalized to zero for identification of the model.In Table 7 we report for each parameter the result of the Wald test. Largely em-
ployed in LCM, the Wald test is a test for the equality of effects between classes,indicating whether a variable is equal across classes and therefore, is class inde-pendent. In our model the null hypothesis is rejected for all the predictors andcovariates, indicating that all the variables chosen are useful in discriminating indi-viduals in classes. Classes are numbered in order of size.Class 1 accounts for 48.4% of the market and exhibits an expected pattern: the pricecoefficient is negative and individuals in this class increase their utility as the qual-ity of seat increases. Moreover, this class prefers weekend performances to weekday
29

Parameter Class 1 Class 2 Class 3 Class 4 Wald test p-value
Price -0.0039 -0.0001 -0.0003 -0.1091 1224.54 0.000(-30.32) (-0.29) (-2.13) (-11.45)
Seat2 10.7610 0.0614 0.1507 7.4508 55.6901 0.000(1.38) (0.69) (7.01) (1.18)
Seat3 11.8896 1.8220 0.1364 28.2045 522.1306 0.000(1.52) (18.84) (4.28) (11.74)
Seat4 12.8816 2.8707 -0.1115 27.6766 1055.6425 0.000(1.65) (29.70) (-2.36) (10.72)
Seat5 14.0908 2.2991 -2.5306 34.1273 478.3154 0.000(1.82) (18.25) (-4.43) (10.42)
Wkend 0.3495 -0.0941 0.1055 -0.4873 1691.2595 0.000(.30.32) (-0.29) (-2.13) (-11.45)
Membership functionStandard 3.5465 10.2095 2.6567 97.5406 0.000
(6.75) (1.98) (4.83)Subscribers 2.0865 9.6714 0.7470 154.7725 0.000
(3.99) (1.88) (1.37)Young 0,4906 -0.4604 1.0377 36.1000 0.000
(0.94) (-0.85) (1.91)Senior -20.0132 -1.2175 -18.6624 18.4787 0.000
(-3.31) (-18.66) (-3.12)Loyalty -3.4969 4.1490 -4.7088 32.0894 0.000
(-0.39) (0.41) (-0.53)Opera 1.7714 5.0029 2.8948 503.5944 0.000
(6.75) (1.98) (4.83)Ballet 5.4112 7.0468 6.3155 326.7014 0.000
(1.08) (1.41) (1.26)Play -9.7429 -4.8584 -8.3682 523.7187 0.000
(-1.76) (-0.88) (-1.51)Days 0.0059 0.0025 -0.0042 977.2111 0.000
(11.12) (4.82) (-7.77)
No. of observations 250170Adjusted ρ2 0.091
Table 7: Estimation of LCM
ones. This class shows a high WTP for a theater ticket, but not the highest amongthe classes.Instead, Class 2 is characterized by the largest WTP, as the price coefficient is neg-ative but very close to zero. This class prefers weekday performances and the mostexpensive seats; however, it exhibits the greatest marginal utility for the fourth seatcategory. This class contributes 24.4% of the market.Class 3 and Class 4 both exhibit low WTP compared to Class 1 and Class 2. How-ever, they differ from each other significantly in some aspects: Class 3 is slightlysmaller than Class 2, accounting for 24.1% of the market. The individuals of thisclass prefer weekend performance and the cheapest seats: the coefficient for the
30

fourth and fifth seat categories is even negative, as if customers of this class wouldnot consider buying expensive seats.Class 4 is clearly the smallest, accounting for only 3.1% of the total market. Com-pared to individuals in Class 2, individuals in Class 4 prefer weekday performancesand exhibit a stronger preference for the most expensive seats, even if its WTP forseat tiers is the lowest among all the classes.In terms of customers’ characteristics, the coefficients of the membership functionshow how Class 3 and Class 4 are strongly characterized by the age component:Class 3 can be considered representative of young customers as, compared withother categories, young has it largest coefficient in this class. This result confirmsthe low willingness of young customers to pay, which was found in the MNL modelresults. Class 4 comprises mainly by seniors customers: its coefficient is negative forall the other classes. However, considering that Class 4 is very small, we can deducethat a significant share of seniors are included in Class 2, given that in Class 1 andClass 3 its coefficients are decisively negative.Standard and subscribers consistently show a positive coefficient, suggesting thatthese categories are distributed across the Class 1, Class 2 and Class 3; whereas thecoefficient for the customers engaged in a loyalty program has a zvalue close to zeroin all three classes that prevent us from making considerations.The assignment of individuals to classes based on the maximum posterior probabil-ity can help us in understanding the class composition. In fact, once the parametersof the model are estimated, they can be used to calculate the conditional individual’sprobability of membership in each class by means of Bayes’ theorem:
P (s | j, η) = P (j | s, η) · P (s | η)∑Ss=1 P (j | s) ·Mis
(12)
Equation (12) give us the probability that the individual belongs to class s condi-tional on the choice made and his/her characteristics (which parameters are esti-mated). On the numerator we have the estimated choice probability for the choicemade, given the class s, multiplied by the prior estimated class probability. On thedenominator we find the probability to choose the alternative j expressed, in thespirit of latent class, as a sum of MNL moderated by the size of each class. Indeed,the denominator is equal to expression (8) and (10).Each individual is assigned to the latent class s, which provides the maximum valueof (12). Based on this procedure, we can see how the categories are distributedacross classes, as Figure 6 shows. Although in the MNL model the customers’ be-havior is distinguished according to price category, in the LCM we can also observe
31

Figure 6: Distribution of customers across classes
some forms of heterogeneity within category, even if some patterns resulting fromMNL are supported. The fact that almost all young customers (62.3%) are classifiedin Class 3 confirms their low WTP, the low utility gained by high quality seats and apreference for the weekend performances. However, a non-negligible share of youngcustomers (28.7%) are found in Class 1. Probably, given the high value of WTP forClass 1, such customers are young subscribers. We should also consider the fact thatin some cases the youth subscription makes it feasible for families to subscribe andinclude their children. In this case, the choice of these young customers depends onthe one made by the family components that are subscribers.Subscribers and Loyalty groups, which represent frequent theater attenders, areconcentrated mainly in the Class 1 and Class 2 (in particular Class 1), confirmingthat these categories are characterized by high WTP and a preference for the mostexpensive seats.Almost half (47.9%) of Standard ticket buyers, representative of infrequent theaterattendance, are classified in Class 1; but significant shares are found also in Class2 (22.6%) and Class 3 (28.7%). Hence, there is a sort of heterogeneity within thiscategory, even if the majority are included in the two classes with the highest WTP.Senior customers are clearly split into Class 2 and Class 4, which are antitheticalto each other from the WTP perspective, but similar in their preference for week-day performances. The latter aspect confirms the results of the MNL model. Themajority (61.2%) of Senior customers fall in Class 2, confirming that this categoryhas the greatest WTP. However, 38.7% of senior customers are found in the Class4, which has the lowest willingness to pay. Both classes exhibit a preference forseats with high quality, but whereas in Class 2 we find that the fourth seat categoryhas the highest coefficient, in Class 4 both the third and the fifth seat categoriesare preferred to the fourth. This different pattern can explain the MNL result inwhich, for this category, the marginal utility of the seat attribute does not increase
32

monotonically with respect to its quality.
Concerning production genre, we notice a positive value of the coefficient for operaand ballet and a negative value of the coefficient for play, which suggests, by impli-cation, that individuals of Class 4 are play attendants.In Figure 7, the classification procedure is made on the basis of the productiongenre. In this way, we can verify whether or not customers’ behavior is homoge-neous across different types of theatrical productions. From Figure 7, we can observe
Figure 7: Distribution of latent classes across type of production
that people who attend Opera performances can be clustered into the four latentclasses with about the same proportion resulting from the LCM. Hence, about half(51.2%) of the opera’s customers belong to Class 1 and the other half are sharedmore or less equally by the Class 2 (24.8%) and Class 3 (23.2%). A high amount ofBallet customers belong to Class 1 (56.4%), but the remarkable aspect is that Class3 individuals (30.2%) are more than twice as many as those in Class 2 (13.2%).Plays present a particular pattern: indeed, almost all of the individuals in Class4 attend plays, that accounting for 13% of the total attendance of this productiongenre. However, their presence is counterbalanced by a large number (47.3%) in theclass with the highest WTP.Moreover, in plays we find, compared to other genres, a higher heterogeneity interms of WTP, given the significant presence of Class 2 and Class 4 individuals.From this point of view, Ballet seems to be the most homogeneous genre as itsshare of Class 2 ticket buyers is low, whereas the presence of Class 3 individuals issubstantial.
Finally, looking at the coefficients for the variable day, the negative coefficient inClass 3 suggests that the members of this class prefer to buy theater tickets in a
33

period close to the date of the performance. The opposite holds for Class 1 andClass 2, for which the coefficients are positive. In Figure 8 we classify individualsby the purchase period, measured as days before the performance. What appears
Figure 8: Distribution of latent class by purchase period
evident from Figure 8 is the opposite trend by classes with different WTP. At thebeginning of the sale period, a large share of the tickets (97.8%) are sold to cus-tomers of Class 1 and Class 2, confirming the positive relationship between WTPand early ticket purchase. As we approach the day of the performance, the shareof these two classes (in particular Class 1 as suggested by the magnitude of thedays coefficient) decreases: within 14 days of the performance, 32.7% and 22% ofthe tickets sold are bought by customers that are classified in Class 1 and Class 2,respectively. Conversely, classes characterized by low WTP tend to purchase theatertickets in the latest stage of the sale period. This finding is more evident for Class3. Indeed, the trend of Class 4 is quite stable from the middle of the sale periodto the last days before the performance. Instead, the rate of individuals of Class 3who buy a ticket increases as we approach to the day of performance: in the last14 days, the relative majority (40.6 %) of customers who buy a ticket belong to thisclass.In summary, the analysis suggests a typology of four classes.Class 1 accounts for 48.4% of the market. This segment embraces theatergoers whohave a high WTP for a theater ticket and gain a greater utility as the quality ofthe seat increases. They are early buyers and prefer weekend performances. Thissegment forms the majority of ticket buyers for opera and ballet productions, butnot for plays. Individuals of this class are mainly standard ticket buyers, subscribersand customers enrolled in a loyalty program.Class 2 accounts for 24.4% of the market and represents customers with the highestWTP. Like Class 1, this segment prefers the most expensive seats and tends to buy
34

tickets in the early stage of the sale period. However, they prefer weekday perfor-mances and represents the majority of ticket buyers for plays. A big share of seniorcustomers belong to Class 2 which also includes standard ticket buyers, subscribersand customers enrolled in a loyalty program.Class 3 accounts for 24.1% of the market. It represents mainly young customersand standard ticket buyers with low WTP. Members of this segment prefer thecheapest seats and do not consider buying expensive seats. They prefer weekendperformances and tend to buy the ticket in the latest stages of the sale period. Thisclass is represented in all performances genres, but particularly ballet productions.Class 4, with 3.1% of the market, is very small. It has the lowest WTP, and attendsmainly plays. Like Class 2, it prefers the most expensive seats and weekday perfor-mances. Members of this class are used to buying tickets starting from the middleof the sale period, and are almost entirely senior customers.Table 8 summarizes the main characteristics of the four classes identifed by the LCM.It is interesting to compare the classes obtained in this model with the one resulting
1 2 3 4
Share 48.4 % 24.4 % 24.1 % 3.1 %WTP High Highest Low LowestSeat Expensive Expensive Cheap ExpensiveDay Weekend Weekday Weekend WeekdayGenre Opera and Ballet Play Opera, Ballet and Play PlayPurchase period Early buyer Early buyer Late buyer Mid-late buyerComposition Standard,Subscribers,Loyalty Senior and Subscribers Young, Standard Senior
Table 8: Summary of latent classes
from Grisolia and Willis’ (2012) model. Even though those authors considered a dif-ferent set of theatre production attributes (price, review, word of mouth, repertoryclassification, author, review), by using the membership function we can find somesimilarities. Grisolia and Willis (2012) identified three classes of theatergoers: theirClass 3 denoted as the intellectual class, and formed of mature and high-frequencyattendees with the largest WTP, seems to confirm the characteristics of our Class2. Indeed, in our case senior (mature) people and subscribers (high-frequency at-tendees) are also characterized by the highest WTP. Grisolia and Willis’ (2012)Class 2 can be associated with our Class 3: both classes are composed of youngpeople, occasional attendee 11 who exhibit a low WTP. A different discourse canbe made for Grisolia and Willis’ (2012) Class 1 which, in their model, comprisesaffluent people who attend theater occasionally. In this case, we find no correspon-dence with our Class 1 because we do not have information about customers’ income
11From Figure 6 we can see that a significant share of standard ticket buyers are included inClass 3, while it is not the same for subscribers and loyalty.
35

and, moreover, our Class 1 is comprises both subscribers and standard ticket buyers.
6.3 Statistical test to compare models
We can compare our models in terms of goodness of fit. In general terms, for bothmodels the likelihood ratio test12 indicates that these models are better than thenull model, in which all parameters are set to zero. As can be seen from theirlog-likelihood values and ρ squared, LCM performs better than MNL. As these twomodels are non-nested, we use the Horowitz test t0 compare model fits of MNL andLCM. The null hypothesis of the test is that the model with the lower adjustedrho-squared is preferred. The decision rule for which the null hypothesis is rejectedis given by:
φ[−(−2(ρ2H − ρ2
L) · LL(0) + (KH −KL))1/2] < α
where φ is the standard normal cumulative distribution function, ρ2H and ρ2
L arerespectively the larger and the smaller values of adjusted rho-squared; KH and KL
are the number of parameters in the model with the larger and smaller values of ρsquared; and α is the significance level.The null hypothesis is rejected, supporting the argument for which the LCM modelfits the data better.
6.4 Willingness-to-pay measures
Measuring the WTP for the change in level of attributes is very important in orderto adopt an appropriate pricing strategy. In the MNL framework, the WTP of anattribute k is given by the ratio of the coefficient of the attribute (βk) and the pricecoefficient βp:
WTPk = βk
βp
(13)
However, (13) provides a point estimate, while it is known that the parameters in(13) have a confidence interval and that they distribute asymptotically normal. Asolution proposed in the literature is to calculate the confidence interval of the ratiousing the Delta method, which allows accurate determination of the standard errorof the ratio of two estimators (Daly et al., 2012).In particular, the standard error of the ratio between two estimated parameters can
12This test is given by: LR = −2 ∗ (LL(β) − LL(0)) where LL(β)) is the log-likelihood at theestimated parameters while LL(0) is the log likelihood for the null model. LR is always positive,and distributed chi-squared with degrees of freedom equal to the number of parameters.
36

be measured by the following (Bliemer and Rose, 2013):
SE(βk/βp) =
√√√√ 1β2
p
·[SE(βk)2 − 2βk
βp
· COV (βk, βp)+(βk
βp
)2
· SE(βp)2
](14)
Table 9 reports for each customer category the WTP (in Danish krone) and itsconfidence interval obtained with the MNL model, for switching from the first seatcategory to a higher quality seat and for switching from a weekday to a weekendperformance. Apart from the standard ticket buyers, for the other customer cate-gories it is taken into account that the coefficient attribute is obtained as the sumof the seat category coefficient and the coefficient of the interaction term. Hence, incalculating (13), the standard error of the sum of the two estimated parameters isconsidered. Given that price coefficients vary according to the production’s charac-teristics, for simplicity we consider in Table 9 a ballet performance with bad reviewand evaluation; and that the customer buys the ticket in the last booking period.Clearly we don’t report those attributes for which either the WTP is either negative(e.g. in the case of weekend performances for seniors), or the attribute coefficient isnot significant (e.g weekend performances for loyalty customers).Using the LC model, the WTP is obtained in a similar manner to MNL given that
within each class the parameters are logit.Table 10 shows the WTP for each latent class. We do not report the WTP forattributes that has a negative coefficient. From the LCM model, WTP in Class 1and Class 2 is not statistically significant (with the exception of weekend perfor-mances for Class 1). For these attributes, we report the point estimate and not theconfidence interval.
In general, the WTP values seem large. There can be various reason for this.Firstly, it might be that the customer pay little attention to price when they selectthe ticket as the result of high inelasticity of theater demand (Zieba, 2009; Grisoliaand Willis, 2016).Secondly, the models are based on an RP data set; hence, we deal with individualswho have already decided to buy a theater ticket. The purchase in itself implies thatthe WTP is higher than the ticket price (otherwise the individual would not buythe ticket). Conversely, an SP experiment would include the no-purchase option.In any case, it should be pointed out that the choice of which seat category to buydepends on the difference between WTP and the ticket price: for example, lookingat the Standard ticket buyers in Table 9, the difference between WTP for the Seat5and Seat4 categories is 70DKK. This implies that when the difference in the ticketprice between these two seat categories is greater than 70 DKK, the customer will
37

Category Attribute WTP (DKK) Standard error t-ratio 95% confidence interval
Standard Seat 2 319 15.22 20.96 289.17 348.83Seat 3 665 30.40 21.87 605.42 724.58Seat 4 887 39.33 22.55 809.91 964.09Seat 5 956 39.44 24.24 878.70 1033.30Wkend 105 6.53 16.08 92.20 117.80
Subscribers Seat 2 762 42.82 17.79 678.07 845.93Seat 3 1172 62.26 18.82 1049.97 1294.03Seat 4 1517 78.81 19.25 1362.53 1671.47Seat 5 1645 82.65 19.90 1483.01 1806.99Wkend 11 3.55 3.10 4.04 17.96
Senior Seat 2 587 78.87 7.44 432.41 741.58Seat 3 1571 108.41 14.49 1358.52 1783.48Seat 4 1635 108.22 15.11 1422.88 1847.11Seat 5 1690 108.72 15.54 1476.91 1903.09Wkend - - - -
Loyalty Seat 2 580 92.46 6.27 398.78 761.22Seat 3 816 92.63 8.81 634.45 997.55Seat 4 1150 97.74 11.76 958.43 1341.57Seat 5 1176 96.53 12.18 986.80 1365.20Wkend - - - -
Young Seat 2 210 13.88 15.13 182.80 237.20Seat 3 359 19.22 18.68 321.33 396.67Seat 4 251 13.17 19.06 225.19 276.81Seat 5 227 11.94 19.01 203.60 250.40Wkend 35 5.88 5.95 23.48 46.52
Foreigner Seat 2 364 25.36 14.35 314.29 413.71(standard ticket) Seat 3 626 33.33 18.78 560.67 691.33
Seat 4 961 48.13 19.97 866.67 1055.33Seat 5 1179 55.11 21.39 1070.98 1287.02Wkend 281 18.19 15.45 245.35 316.65
Table 9: WTP based on MNL for switching from Seat1 category and weekday performance
prefer to buy a Seat4 category ticket than a Seat5 category ticket.
7 Conclusions
In a period in which the public funds allocated to cultural organizations are decreas-ing and performing arts organizations are struggling to attract a broader audienceand to achieve a balance between revenue and losses, price discrimination strategyis emerging as a tool to achieve the organizations’ revenue and attendance targets.Indeed, offering a schedule of prices according to seat location in the venue, is a prac-tice that allows the theater to discriminate between customers according to theirWTP. This paper is a first attempt to develop a discrete choice model that analyzescustomers’ preference for the attributes connected to the type of tickets, in terms ofseat quality and day of performance.
38

Category Attribute WTP (DKK) Standard error t-ratio 95% confidence interval
Class 1 Seat 2 2759 1993.337 1.38 -Seat 3 3049 1993.316 1.52 -Seat 4 3303 1993.374 1.66 -Seat 5 3613 1993.37 1.81 -Wkend 89 2.7492 32.37 83.61 94.39
Class 2 Seat 2 614 1746.646 0.35 -Seat 3 18220 54062.16 0.34 -Seat 4 28707 85418.41 0.34 -Seat 5 22991 67957.04 0.34 -Wkend - - - -
Class 3 Seat 2 502 115.4725 4.35 275.67 728.32Seat 3 454 67.1648 6.76 322.36 585.64Seat 4 - - - -Seat 5 - - - -Wkend 351 124.0801 2.82 107.80 594.19
Class 4 Seat 2 68 56.87 1.19 -Seat 3 258 6.7481 38.23 244.77 271.22Seat 4 253 6.6976 37.77 239.87 266.13Seat 5 312 6.9706 44.76 224.27 399.73Wkend - - - -
Table 10: WTP based on LCM for switching from Seat 1 category and weekday performance
We have employed a data set that includes information on Royal Danish Theatrebookings in the period 2010-2013 with the aim of estimating three discrete choicemodels that explain ticket purchase behavior. Our analysis reveals some distin-guishable patterns that characterize heterogeneous behavior in the choice of theaterticket. This heterogeneity in preferences is strictly connected to customers’ char-acteristics in terms of age, theater attendance frequency and period of purchase.Actually, these customers’ characteristics are those that can be inferred from thebooking data.Our findings can provide guidance to policy makers and theater managers in settingprices. Indeed, price is one of the tools with which theater can achieve their aims ofincreasing both the theater audience and box office revenue. For example, a differentpricing policy should be adopted for young and senior customers, as they exhibit op-posite patterns in terms of preference and WTP. There is also room for the adoptionof dynamic pricing, as the customers who buy a ticket at the end of the sale periodare characterized by a higher price sensitivity. Our results also suggest differentiatethe pricing policy among production genres, given that the customer’s behavior isnot homogeneous among genres. Even if some of the above implications can beprovided by theater managers based on their experience, our quantitative analysisis needed for different reasons: first, it provides a scientific evidence of these infer-
39

ences. Second, discrete choice models allow us to measure the extent to which thedifferent ticket attributes affect the choice of a ticket: for example, we have seenthat seat category has a greater impact on explaining the choice of ticket than theday of the performance. Third, this approach provides some estimates of the WTPwhich not only are essential in setting price, but they can also be integrated in moresophisticated optimization models.Our interpretation of the final results presents a limit: indeed, we do not have ac-cess to other socio-economic characteristics, in particular customers’ income. Thisis quite relevant as the utility that each customer maximizes should be subject tothe budget (income) constraint. However, we should highlight two facts: first, atheater cannot implement a pricing discrimination policy based solely on the cus-tomers’ income. Secondly, this paper aims to investigate customer’s behavior basedon booking data, hence it is based on the information that theatre can normallyacquire considering that customers are not required to give information about theirincome.Future studies could explore customer behavior in more detail with respect to pricedifferentiation and consider other socio-economic characteristics, such as income,education and family composition. A further study on this topic is important, be-cause theater demand has some peculiar features compared to other industries thatadopt RM technique, such as the transportation industries: a multi-objective func-tion that is not limited solely to revenue; a cultural product with personal andsubjective value; a product that lacks standardization, and a risk component indemand because of the unknown characteristics of the cultural product before itsconsumption.
40

References
• Abbe-Decarroux, F. (1994). The perception of quality and the demand for ser-vices: empirical application to the performing arts. Journal of Economic Behavior& Organization, 23(1), 99-107.
• Bliemer, M. C., Rose, J. M. (2013). Confidence intervals of willingness-to-payfor random coefficient logit models. Transportation Research Part B: Methodolog-ical, 58, 199-214.
• Bierlaire, M. (2003). BIOGEME: A free package for the estimation of discretechoice models. Proceedings of the 3rd Swiss Transportation Research Conference,Ascona, Switzerland.
• Bille, T., Berle, J.B., Skot-Hansen, D. (2015). Theater Management - qual-ity indicators and demand. Paper presented at the The 13th International Con-ference on Arts & Cultural Management (AIMAC2015), June 29 Ð July 1, Aix-en-Provence / Marseilles, France.
• Boxall, P. C., Adamowicz, W. L. (2002). Understanding heterogeneous pref-erences in random utility models: a latent class approach. Environmental andresource economics, 23, 421-446.
• Carrier, E. (2008). Modeling the choice of an airline itinerary and fare productusing booking and seat availability data. (Doctoral dissertation), MassachusettsInstitute of Technology, Department of Civil and Environmental Engineering.
• Chan, T. W., Goldthorpe, J. H. (2005). The social stratification of theatre,dance and cinema attendance. Cultural Trends, 14, 193-212.
• Colbert, F., Beauregard, C., Vallee, L. (1998). The importance of ticketprices for theatre patrons. International Journal of Arts Management, 1, 8-15.
• Corning, J., Levy, A. (2002). Demand for live theater with market segmentationand seasonality. Journal of Cultural Economics, 26, 217-235.
• Daly, A., Hess, S., De Jong, G. (2012). Calculating errors for measures derivedfrom choice modelling estimates. Transportation Research Part B: Methodological,46, 333-341.
• Drake, M. J., Duran, S., Griffin, P. M., Swann, J. L. (2008). Optimal timingof switches between product sales for sports and entertainment tickets. NavalResearch Logistics, 55, 59-75.
41

• Felton, M.V. (1994). Evidence of the existence of the cost disease in the per-forming arts. Journal of Cultural Economics, 18, 301-312.
• Fernandez-Blanco, V., Orea, L., Prieto-Rodriguez, J. (2009). Analyzingconsumers heterogeneity and self-reported tastes: An approach consistent withthe consumerÕs decision making process. Journal of Economic Psychology, 30,622-633.
• Gapinski, J. H. (1984). The economics of performing Shakespeare. The AmericanEconomic Review, 74, 458-466.
• Greene, W.H., Hensher, D.A. (2003). A latent class model for discrete choiceanalysis: contrasts with mixed logit. Transportation Research B 37, 681-698.
• GrisolŠa, J. M., Willis, K. G. (2011a). An evening at the theatre: using choiceexperiments to model preferences for theatres and theatrical productions. AppliedEconomics, 43, 3987-3998.
• Grisolia, J. M., Willis, K. G. (2011b). Heterogeneity in willingness to pay fortheatre productions: individual specific willingness to pay estimates for theatres,shows and their attributes. Scottish Journal of Political Economy, 58, 378-395.
• Grisolia, J. M., Willis, K. G. (2012). A latent class model of theatre demand.Journal of Cultural Economics, 36, 113-139.
• GrisolŠa, J. M., Willis, K. G. (2016). Consumer choice of theatrical pro-ductions: a combined revealed preference-stated preference approach. EmpiricalEconomics, 50, 933-957.
• Hansmann, H. (1981). Nonprofit enterprise in the performing arts. The BellJournal of Economics, 341-361.
• Hetrakul, P., Cirillo, C. (2013). Accommodating taste heterogeneity in rail-way passenger choice models based on internet booking data. Journal of ChoiceModelling, 6, 1-16.
• Horowitz, J., 1982. An evaluation of the usefulness of two standard goodness-of fit indicators for comparing non-nested random utility models. TransportationResearch Record, 874, 19Ð25.
• Huntington, P. A. (1993). Ticket pricing policy and box office revenue. Journalof Cultural Economics, 17, 71-87.
42

• Kamakura, W. A., Russell, G. (1989). A probabilistic choice model for marketsegmentation and elasticity structure. Journal of Marketing Research, 26, 379-390.
• Laamanen J.P (2013). Estimating demand for opera using sales system data:the case of Finnish National Opera. Journal of Cultural Economics 37, 417-432.
• Lancaster K. J. (1966). A new approach to consumer theory. The Journal ofPolitical Economy.132-157.
• Leslie, P. (2004). Price discrimination in Broadway theater. RAND Journal ofEconomics, 35, 520-541.
• McFadden, D. (1974). The measurement of urban travel demand. Journal ofPublic Economics, 3, 303-328.
• Roeder, K., Lynch, K. G., Nagin, D. S. (1999). Modeling uncertainty in latentclass membership: A case study in criminology. Journal of the American StatisticalAssociation, 94, 766-776.
• Rosen, S., Rosenfield, A.M. (1997). Ticket Pricing 1. The Journal of Law andEconomics, 40, 351-376.
• Schimmelpfennig, J. (1997). Demand for ballet: a non-parametric analysis ofthe 1995 Royal Ballet summer season. Journal of Cultural Economics, 21, 119-127.
• Seaman, B. A. (2006). Empirical studies of demand for the performing arts.Handbook of the Economics of Art and Culture 1, 415-472.
• Sintas, J. L., çlvarez, E. G. (2005). Four characters on the stage playing threegames: performing arts consumption in Spain. Journal of Business Research, 58,1446-1455.
• Stigler, G. J., Becker, G. S. (1977). De gustibus non est disputandum. TheAmerican Economic Review, 67, 76-90.
• Swait, J. (1994). A structural equation model of latent segmentation and productchoice for cross-sectional revealed preference choice data. Journal of Retailing andConsumer Services, 1, 77-89.
• Swanson, S. R., Davis, C., Zhao, Y. (2008). Art for artÕs sake? An Examina-tion of motives for arts performance attendance. Nonprofit and Voluntary SectorQuarterly, 37, 300-323.
43

• Tereyagoglu, N., Fader, P., Veeraraghavan, S. (2012). Filling seats at atheater: Estimating the impact of posted prices and dynamic discounts. Workingpaper, University of Pennsylvania, Philadelphia.
• Throsby, D. (1990). Perception of quality in demand for the theatre. Journal ofCultural Economics, 14, 65-82.
• Urrutiaguer, D. (2002). Quality judgements and demand for French publictheatre. Journal of Cultural Economics 26, 185-202.
• Vermunt, J. K., Magidson, J. (2005). Technical guide for latent GOLD choice4.0. Basic and Advanced, Belmont Massachusetts. Statistical Innovations Inc.
• Wedel, M., Kamakura, W. A. (2000). Market segmentation: conceptual andmethodological foundations. Dordrecht: Kluwer.
• Werck, K., Heyndels, B. (2007). Programmatic choices and the demand fortheatre: The case of Flemish theatres. Journal of Cultural Economics, 31, 25-41.
• Whelan, G., Batley, R., Shires, J., Wardman, M. (2008). Optimal faresregulation for BritainÕs railways. Transportation Research Part E: Logistics andTransportation Review, 44, 807-819.
• Willis, K. G., Snowball, J. D. (2009). Investigating how the attributes of livetheatre productions influence consumption choices using conjoint analysis: the ex-ample of the National Arts Festival, South Africa. Journal of Cultural Economics,33, 167-183.
• Zieba, M. (2009). Full-income and price elasticities of demand for German publictheatre. Journal of Cultural Economics, 33, 85-108.
44

Appendix
Productions considered in the models
Title Season Genre
Et Folkesagn 2010/2011 BalletBoris Godunov 2010/2011 Opera
Madame Butterfly 2010/2011 OperaKvinden uden skygge 2010/2011 Opera
Balletaften 2010/2011 BalletBroadway for en aften 2011/2012 Ballet
Alceste 2011/2012 OperaEn skærsommernatsdrøm 2011/2012 Play
Cosı fan tutte 2011/2012 OperaKameliadamen 2011/2012 Ballet
Magen 2011/2012 PlayParsifal 2011/2012 Opera
Nøddeknækkeren 2011/2012 BalletDen Gerrige 2011/2012 Play
Albert Harring 2011/2012 OperaTannhauser 2012/2013 Opera
Den fiffige lille ræv 2012/2013 OperaRomeo & Juliet 2012/2013 Ballet
Madame Butterfly 2012/2013 OperaVildanden 2012/2013 Play
La Bayadere 2012/2013 BalletKollektivet 2012/2013 Play
La Ventana / Kermessen i Brugge 2012/2013 Ballet
45

A DEA approach for selecting a bundle of ticketsfor performing arts events
Andrea Baldin∗
Department of Management, Ca’ Foscari University of Venice, Cannaregio 873, 30121 Venice,Italy
Abstract
Most performing arts organizations offer their customers the choice of ei-ther buying event tickets individually or buying a bundle of tickets for twoor more events. During the selection of the bundle to be offered, the theatremanager faces several possible combinations of events. In this paper we tacklethe issue of identifying the most efficient subset of the events scheduled to offeras a bundle. We formulate this problem following the choice-based networkRevenue Management approach. Assuming the price as fixed on two types ofevents, lowbrow and highbrow, proposed by the theatre, the purchase decisionis modelled on the basis of two random variables: the available time and thereservation price per perfomance. The super-efficiency DEA model will beimplemented in order to find the most efficient combination of events to bebundled, defined as the one that offers the most favourable trade-off betweenexpected revenue, attendance, and capacity consumption. A regression of theDEA scores on managerial variables and bundle attributes will allow us toobtain some insights into what determines the efficiency level of a bundle.
Keywords Data envelopment analysis (DEA); Revenue Management; Bundling; Perform-ing arts institutions
∗E-mail: [email protected]
46

1 Introduction
One of the strategic decisions that performing arts organizations face is the selectionof event tickets to offer as a bundle. In the Revenue Management (RM) framework,this issue can be classified as a structural decision, as it refers to the mechanism touse for selling products, in our case, theatre tickets.Broadly speaking, bundling is the strategy of marketing two or more products and/orservices as a single package at a special price (Guiltinian, 1987). This is a pervasivepractice in the marketing of theatres, which is realized through subscription offers.The main rationale for bundling is its capacity to implicitly price discriminate. Letconsider this example, taken from Venkatesh and Mahajan (1993): the reservationprices for two events A and B are respectively $10 and $20. If the price of a singleticket is $19, the consumer will buy only the ticket for the performance B. If asubscription priced at $28 is offered, the consumer will purchase the bundle of events.In economic terms, a bundle allows transfering the consumer’s surplus (i.e. thedifference between the reservation price and the actual price paid) from the morehighly valued event to the less attractive one.The advantage of bundling is, therefore, its ability to segment the market, reducingthe variability in demand that derives from consumers’ heterogeneous preferences.In our case, bundling tickets allows increasing both the attendance and revenueof potentially low demand events when they are sold combined with high demandevents.There are other motivations behind selling bundles of tickets that are strictly con-nected with the theater context: to obtain in advance an amount of cash flow withwhich base future decisions; and to establish a loyal customer base. Subscribers area very important customer segment for a theatre, as they: 1) assure a certain levelof attendance for the theatre season, 2) are more likely to renew subscriptions inthe future (Duran et al., 2012); and to spread positive word of mouth that inducesother customers to buy tickets (Drake et al., 2008).From the demand side, the incentive for the customer to buy a bundle is givenby the savings derived from a lower unit price for a ticket and by non-monetarycompensation related to the symbolic dimension of a loyalty program (Johnson andGarbarino, 2001).Given the discussion above, it is fundamental for the theatre to determine the con-tent of the bundle. Most non-profit performing arts organizations offer not onlyevents that are very popular and whose tickets are easily sold, but also productionsthat have a low demand since they are difficult for the non-expert to appreciate.The reason behind this cultural policy lies in the need for the non-profit perform-
47

ing arts organizations to meet different and conflicting objectives, as illustrated byHansmann (1981): the popular events (referred to in the literature as ‘lowbrow’events) fulfill the attendance goal, i.e. to spread culture to as broad a segment ofthe population as possible; in contrast, the less popular events (referred to as ‘high-brow’ events) improve the tastes of a small number of connoisseurs and fulfill thequality goal.In this paper we study the most efficient bundle composition of a non-profit theatre,assuming that such an organization achieves its aims through a repertoire composedof highbrow and lowbrow titles.
Generally speaking, it is known that it is better to bundle high demand eventstogether with low demand events, than to bundle events with similar demands, be-cause the high demand events induce the customer to attend the low ones. On theother hand, bundling two high demand events may result in a decrease of potentialrevenue as the unit price for an event in a bundle is lower than the single ticket price;similarly, a bundle of low demand events would not be attractive for customers. Thisis just a generalization, as the best bundle composition depends on factors such asthe price of a single ticket, and of the bundled tickets, and the distribution of thereservation prices of the different events. Our aim is to identify a possible methodto identify the most efficient bundle composition.The novelty of this study is that we treat the bundle composition decision as anetwork RM problem. Network RM generally refers to a quantity-based problemin the airline industry, in which the firm has to manage the capacities of the con-necting flights in a network. In general, network RM deals with industries that sella product consisting of more than one resource. In our case, we treat each eventas a resource; the theatre offers products of one resource (single ticket) or multipleresources (bundle of tickets). This paper relies on Talluri and Van Ryzin (2004) andLiu and Van Ryzin (2008), which have introduced, in a consumer choice behavioursetting, the notion of an efficient offer set as that which offers the most favourabletrade-off between expected revenue and capacity consumption.
In order to model the consumer choice behaviour, we adapt the framework ofVenkatesh and Mahajan (1993) and Ansari et al. (1996), considering non-homogeneous(in terms of demand) events, in which the consumer decision making process is basedon two criteria: available time to attend the events and reservation price per per-fomance. In this way we will obtain the probability of choosing each bundle andconsequently its expected revenue per consumer, capacity consumption and atten-dance. These values will constitute the variables of the super-efficiency DEA modelthat will identify the most efficient offer set. DEA seems to be a suitable tool in our
48

context, given the multi-objective nature of the non-profit organization. To the bestof our knowledge, this is the first paper that tackles the issue of bundle selection inthe performing arts context, designing a new approach to this topic. The analysisso far provides a set of insights in what determines the efficiency level of a bun-dle, even if our model considers only two type of events and two different patternof reservation price. Indeed, a more realistic setting would require a significantlyhigher computationale effort.The remainder of this paper is organized as follows: Section 2 provides a briefliterature review. Section 3 describes the general model, including the notion of ef-ficiency, the super-efficiency DEA model, and the specification of the input/outputdata based on the multicriteria customer choice behaviour. Section 4 provides anumerical example. Section 5 presents some concluding remarks.
2 Literature review
A large amount of RM literature has investigated issues related in particular to theairline industry: such studies include the two-fare class problem (Littlewood, 1972),seat allocation for multiple classes (Belobaba, 1987), and the multi-leg (networkRM) problem (Talluri and Van Ryzin, 1998). There has been very little empiricalresearch in applying RM to performing arts organizations. Most of it has focusedon the price discrimination practice implemented by theatres. Huntington (1993)considers a variant of the hedonic pricing model to describe price differentiation byseat, and shows that the price discrimination policy leads to a greater profit thanthe unique price policy. Rosen and Rosenfield (1997) focus on the issue of how thetheatre should sort seats into categories, whereas Leslie (2004) analyzes the pricediscrimination policy for a particular Broadway show in order to estimate a struc-tural econometric model of price discrimination based on the individual consumerbehaviour. Tereyagoglu et al. (2012) employs a competing hazard framework tomodel the ticket sales, where the customers race against each other for the sameticket. Their aim is to analyze how pricing and discount actions over time affectthe timing of customers’ purchases as well as the propensity to purchase a ticket ofdifferent categories of customers (subscribers and occasional buyers).
A stream of the literature related to our paper is on bundling strategies, a topicbroadly studied from both the economics and marketing approaches. The first per-spective has a normative nature, providing stylized analytical models. In this areawe find the first studies on bundling, starting from Stigler (1963), who analyzes
49

the simple case of a monopolist that offers two products with perfectly negativelycorrelated price, to the seminal paper by Schmalensee (1984) in which the negativecorrelation of reservation price is relaxed. Subsequent studies have considered therole of competition (Matutes and Regibeau, 1992), bundles with more than twoproducts (Bakos and Brynjolfsson, 2000) and the role of complementary and sub-stitute products (Venkatesh and Kamakura, 2003).The marketing approach has contributed to bundling research in two ways: first,developing specific methods, such as conjoint analysis (Goldberg et al., 1984), thebalance model (Bradlow and Rao, 2000), mixed integer linear programming (Han-son and Martin, 1990), probabilistic modelling (Venkatesh and Mahajan, 1993),and combinatorial methods (Chung and Rao, 2003), in order to assist the decisionmakers in designing and pricing the bundle. Second, highlighting different issuesdirectly related with bundling, such as co-branding (Venkatesh and Mahajan, 1997)and product integration (Stremersch and Tellis, 2002). The existing literature onbundling is very rich: for a detailed review, we refer to Venkatesh and Mahajan(2009) and Rafiei et al. (2013). One of the main results of the literature is that, in afairly general setting, mixed bundling is likely to be the optimal strategy. However,in order to determine the optimal strategy, factors such as substitutability and com-plementarity, the distribution of the reservation prices, and their correlation, shouldbe considered.Focusing on the performing arts sector, the work most related with this study isthat of Venkatesh and Mahajan (1993): here the authors propose a probabilisticoptimization model to derive, for each of the three bundling strategies, the pricethat maximizes the organization’s profit, and evaluate which approach assures themaximum profit. The consumers’ decision making is determined by the availabletime to attend performances and the reservation price, assuming that the densityfunction of these two random variables follows a Weibull distribution whose param-eters are estimated empirically through a survey submitted to the customer. Thefinal results indicate that the mixed bundle strategy leads to the greatest profit.Ansari et al. (1996) extend Venkatesh and Mahajan’s (1993) model by consideringa non-profit performing arts organization whose objective function is the maximiza-tion of number of users, subject to a non-deficit constraint. The authors show thatalso for such organizations mixed bundling is the optimal strategy.Other papers have analyzed bundling strategy under an RM perspective. Drake etal. (2008), observing that most sports and entertainment organizations are used tooffering bundles of tickets first and put single-event tickets on sale at a later date,find the optimal timing decision for switching the product sale. The authors model
50

the demand as a linear Markovian process and generalize the model consideringproducts with different demand characteristics. Duran et al. (2012) extend Drake’set al. (2008) work, considering the dynamic switching time decision under a Poissondemand process.Yakõcõ et al. (2014), similarly to our study, consider the problem of the selection ofevent tickets to include in the bundle. In the case of a bundle of three or more events,the authors propose a heuristic approach to create the best bundle. Compared tous, the authors consider not only the demand as a guideline in bundling, but alsothe timing dimension of the event. However, the number of events to be included inthe bundle is pre-determined by the decision maker. Finally, it should be consideredthe study by Ferreira and Wu (2011) since it is the only work that adopt DataEnvelopment Analysis as a tool to make the bundle selection decision. In this studythe cost of the bundle and its price are used respectively as the input and the outputof the DEA model.This paper aims to contribute to the RM literature under different aspects: first,at best of our knowledge, this is the first paper that considers the bundle selectionproblems in the performing arts context, in which the organizations pursue differentobjectives in addition to revenue. Second, we propose a new approach to the bundingproblem adopting a network RM perspective and an integrated model that makeuse of a probabilistic approach and super-efficiency data envelopment analysis.
3 Model
3.1 The bundling problem
We consider a non-profit theatre that offers a portfolio of m events during its perfor-mance season. Let us assume that it is possible to distinguish between two groupsof events: high demand and low demand events. The theatre offers single ticketsfor each event but also offers a bundle of tickets. The problem considered here is todetermine a bundle composition that allows the organization to fulfill its objectives:revenue and attendance. We formulate this problem following the choice-based net-work revenue management approach (Liu and Van Ryzin, 2008).The problem is defined in terms of resources and products. The m events are theresources with which the organization can provide a set N of products which arethe single events and all the possible combinations of events that can be offered asbundles. Each product has an associated revenue, which corresponds to its sellingprice: we denote by p the price of the single ticket and pB the price of the bundle. Weassume that the price p is equal across performances. We further assume that there
51

is no form of price discrimination other than bundling. In other words, a unique priceis charged for each product without considering, for example, the quality of the seat,the customer segment, or the timing of the purchase. Moreover, even if the eventsdiffer in terms of demand, we assume that the theatre does not modify the ticketprice according to the popularity of the event. On the contrary, it applies uniformpricing. This assumption is not unrealistic at all. The argument put forward byOrbach and Einav (2007) and Choi et al. (2014) regarding price discrimination inthe context of movie theatres can be applied also to that of the performing arts: pricediscrimination based on popularity is seen by customers as unfair. Hence, in thepresence of events with different demand characteristics, price bundling is the mostaccepted way to differentiate the prices of different events (see Courty, 2000). Weassume that the organization selects a set S ⊆ N of products made up of all the singletickets for the events i and a single bundle of tickets, denoted by B, for k differentevents, with S = {1, . . . ,m,B}. S is referred to as the organization’s offer set. Giventhe offer set S, we denote by Pi(S), respectively, PB(S), the probability of buyingthe single ticket for the event i, respectively, the bundle B, which will be calculatedin Section 3.3. Changing the offer set S will also change the probability of buyingeither a single ticket or the bundle or neither of them. In fact, given that the modelincorporates the consumer choice behaviour, it is not assumed that the consumeris a bundle purchaser (i.e. subscriber) or a single ticket purchaser independently ofthe control applied by the seller (as in the traditional RM methods based on theindependent demand model); on the contrary, the choice of the consumer dependson the offer set available (Shen and Su, 2007).We denote by R(S) the expected revenue when S is offered:
R(S) =m∑i=1
Pi(S) · p+ PB(S) · pB (1)
The price of the bundle is always less than the sum of the single prices of the eventsin the bundle. Moreover, we assume that the unit price of the event in the bundle isdecreasing with respect to the cardinality k of the bundle. This assumption derivesfrom the principles of the second degree price discrimination, according to whichthe unit price varies depending on the quantity demanded. In our case, where allthe k events of the bundle are sold at the same price, we hypothesize that the pricepB of the bundle can be formulated as follows:
pB = k[p · (1− r)k−1], (2)
52

where r is the discount rate 1. Equation (2) allows us to have a formulation of pBthat is increasing and concave with respect to the size of the bundle k.Further, we denote by Qi(S) the probability of using one unit of capacity, i.e. a seatin the theatre, of the event i, given by
Qi(S) =
Pi(S) + PB(S), if i ∈ B,
Pi(S), if i /∈ B.
Hence Q(S) = (Q1(S), . . . , Qm(S))T is the vector (m× 1) of capacity consumptionprobabilities that considers both the single tickets and the bundle sold.Liu and Van Ryzin (2008) have shown that the efficient offer sets are the ones touse in the network RM problem. Their concept of efficient offer sets is the naturalextension of that introduced by Talluri and Van Ryzin (2004) for the choice basedsingle product RM model. The key concept is that the efficient sets are thosethat provide the most favorable trade-off between expected revenue and capacityconsumption. Recalling their definition, a set S is inefficient with respect to theother offer set, if there exists a convex combination of the alternative offer sets thatgenerate a greater expected revenue consuming the same (or less) capacity.More formally, denoting by α(S) the weights for the convex linear combination, ifthere exist α(S) and S ⊆ N , with α(S) ≥ 0 and ∑
S α(S) =1, such that (Talluriand Van Ryzin, 2004):
R(S) <∑S
α(S)R(S) (3)
andQ(S) ≥
∑S
α(S)Q(S), (4)
then the offer set S is inefficient.It can be shown that the above mentioned conditions of inefficiency are equivalentto those resulting from the dual output-oriented DEA (Data Envelopment Analysis)model with variable returns to scale (see Banker et al., 1984). Therefore, a measureof efficiency of the offer set (S) can be obtained by implementing the DEA technique(see Section 1.1). DEA is a multicriterial technique that seems to be particularlysuitable in the context of non-profit organizations, given that the maximization ofrevenue is not the unique objective. According to Hansmann’s (1981) seminal paper,performing arts organizations aim to maximize three objectives: revenue, quality andattendance. The first is measured as the expected revenue R(S) of the offer set. The
1In other words, the unit price of an event included in a bundle is discounted by [(1−r)k−1·100]%with respect to the full price single ticket
53

second objective is not considered in this study since the concept of quality and itsassessment with regard to cultural goods may raise some methodological challenges:indeed, their value is based on abstract, subjective, and experience-related aspectsthat make difficult to assess their quality (see Caves, 2000). Regarding the thirdobjective, we refer to Section 3.3 for a detailed formulation.Denoting by A(S) the attendance obtained with the offer set (S) and with Y (S) =(R(S), A(S)) the vector of the outcomes of the offer set T , then (5) becomes
Y (S) <∑S
α(S)Y (S) (5)
Apparently there is a linear relation between Q(S) and A(S). In reality, as will beshown in Section 3.3, A(S) also depends on the capacity of the theatre, showinghow the efficiency of the bundle also depends on the capacity constraint. Moreover,in calculating the total attendance, we should also consider the situation in whichthe subscriber does not attend all the events included in the bundle.
3.2 Data Envelopment Analysis
DEA is a mathematical optimization model formulated as a linear programmingproblem that measures the relative efficiency of decision making units (DMUs) thatuse different inputs in order to produce different outputs. In the DEA literature,a key assumption is the homogeneity of the DMUs. This means that each DMUuses the same input and output measures (variable in the amount from one DMUto another). In our case, each offer set can be considered as a DMU that convertsa rate of capacity consumption (the input vector Q(S)) into an amount of expectedrevenue and attendance (the output vector Y (S)).Adopting the notation of Section 3.1, the efficiency score of the offer set S can becalculated through the following linear programming model (Banker et al., 1984):
maxθ,α(S)
θS (6a)
subject to Q(S) ≥∑S
α(S)Q(S), (6b)
θSY (S) ≤∑S
α(S)Y (S), (6c)∑S
α(S) = 1. (6d)
Model (6a)–(6d) is formulated following the output orientation, meaning that θS is
54
a scalar ≥ 1 which indicates how much the offer set S should radially increase theiroutputs in order to reach the efficiency frontier. Hence, an efficiency measure θS = 1characterizes an efficient offer set, whereas a value of θS ≥ 1 indicates that the offerset is dominated by other ones.It can be easily verified that for an inefficient offer set S, i.e. θS ≥ 1, conditions (4)and (5) are satisfied. In contrast, if the offer set S is efficient, i.e. θS = 1, condition(5) is not satisfied, since we have an equality relation for at least one element of theoutput vector Y (S).Note that detecting the efficient offer sets via DEA does not violate the basic as-sumption implied by Liu and Van Ryzin (2008): in particular the main assumptionsof convexity of the production set imply concavity of the efficiency frontier (seeLemma 1 in Talluri and Van Ryzin, 2004 and p. 307 in Liu and Van Ryzin, 2008),which is also implied in the DEA methodology (see Charnes et al., 1978). Even ifTalluri and Van Ryzin (2004) and Liu and Van Ryzin (2008) propose a differentapproach to characterize the efficient offer sets, we believe that DEA seems to besuitable in our case for a couple of reasons:
• the multi-objective nature of the nonprofit organizations,
• the possibility of extending the model in order to rank the efficient offer sets.
In particular, the second aspect is crucial: the network RM literature has focusedon the airline industry, where different efficient offer sets are offered according to theremaining capacity. Performing arts organizations are less flexible in their supply ofproducts: the bundle of tickets is offered before the beginning of the season and itscomposition does not change during the selling period. Therefore, the organizationmust choose the ‘most efficient’ offer bundle from the efficient set.In order to identify such an offer, we employ an extension of the basic DEA model(6a–6d), referred to as the ‘Super-efficiency DEA’, introduced by Andersen and Pe-tersen (1993). This method has the desiderable feature of discriminating the efficientDMUs. Indeed, the standard DEA model assigns equal scores to all the efficient unitsthat lie on the efficiency frontier. In order to overcome this problem, the authorspropose to exclude from the reference set the DMU under evaluation. Hence, thesuper-efficiency DEA model that will be used in this paper can be expressed as
maxθ,α(S)
θS (7a)
subject to Q(S) ≥∑
SS 6=S
α(S)Q(S), (7b)
55

θSY (S) ≤∑
SS 6=S
α(S)Y (S), (7c)
∑S
S 6=S
α(S) = 1. (7d)
When an efficient DMU is eliminated from the reference set, the efficiency frontiercreated by the remaining DMUs will shrink. The effect of this is that the efficientunit eliminated will have a value of φ0 ≤ 1, indicating the maximum proportionaldecrease in the outputs that allows the DMU to mantain the ‘efficient’ status withrespect to the new frontier; whereas the score for the inefficient DMUs is unaffected.We have three cases: if φ0 < 1, the DMU is super-efficient, if φ0 = 1, the DMUis efficient, if φ0 > 1 the DMU is inefficient. Indeed, such DMUs are not able toproject onto the efficiency frontier derived by its exclusion, regardless of the rate ofdecrease of the output.
Some scholars (Lovell and Rouse, 2003; Chen, 2005; Cook et al., 2008; Lee et al.,2011; Cheng and Liang, 2011) have put effort into providing a numerical score forthose efficient DMUs for which the super-efficiency DEA model is infeasible. Inthis paper we adopt the approach proposed by Chen (2005) that characterizes thesuper-efficiency of the DMU for which the model (7a)–(7d) provides an infeasiblesolution, and has the advantage of allowing the employment of the conventionalDEA software.Therefore, the super-efficiency DEA model (7a)–(7d) is applied to all the offer sets.Such a model provides an efficiency score to all the offer sets for which the solutionis feasible. Concerning the other offer sets, the efficiency score is obtained throughthe following procedure (Chen, 2005): first, the inefficient DMUs are radially pro-jected onto the efficiency frontier through proportional input reduction, using theinput-oriented DEA model:
minβ,α(S)
βS (8a)
subject to βSQ(S) ≥∑S
α(S)Q(S), (8b)
Y (S) ≤∑S
α(S)Y (S), (8c)∑S
α(S) = 1. (8d)
In the second step, the super-efficiency model (7a)–(7d) is implemented replacing
56

QS with the efficient input values QS = βS · QS. We obtain a new super-efficiencyscore for the DMU for which the original super-efficiency model is infeasible. In casewe don’t obtain again a feasible solution, this DMU is efficient but not characterizedby an output surplus, and its score is set equal to 1.
3.3 Specification of Input/Output Data
To derive the choice probabilities of the different offer sets, essential for the construc-tion of the input and output data set, we rely on Venkatesh and Mahajan (1993)and Ansari et al. (1996). According to them, the consumer’s choice is affected bytwo dimensions: leisure time and price. The central role of these dimensions in theperforming arts sector is pointed out by Vogel (1990) and is empirically supportedby many econometric demand studies (for a summary see Seaman, 2006). Follow-ing Venkatesh and Mahajan (1993), the time and money dimensions are capturedby two variables: the number of performances a person is likely to attend, and hisreservation price. An important assumption is that the two variables are indepen-dent of each other, whereas it should be natural to think that there is an inverserelation between them, as a high cost of time (which implies a low level of leisuretime) is associated with a high income (hence a higher reservation price), and viceversa. However, Venkatesh and Mahajan (1993) claim it is possible that membersof a high income family may have a large amount of leisure time. On the otherhand, people with lower wage rates may have to work more hours, which results ina higher cost of time.We consider three random variables:
• X is the number of performances i (among m) a person can attend,
• Rh is the per performance reservation prices for the low demand events andRh is that for the high demand events.
Whereas Venkatesh and Mahajan (1993) assume that at market level, the reservationprice distributions are the same across performances, we made a simpler assumption:such distributions are the same across the type of performances at the individual- and not market - level. This means that for an individual, the reservation priceis the same for all the performances of the same type. In such a case, the person’smean reservation price, denoted by R, is no longer modelled as a random variablewhose parameters are to be estimated, as in Venkatesh and Mahajan (1993), butis obtained as the average of the per performance reservation prices of the events
57

included in the bundle. This implies that the reservation price of a bundle is equalto the sum of the reservation prices of the individual elements: this is the additivityassumption (Venkatesh and Mahajan, 2009) that in our case seems suitable, sincethe products are neither complements nor substitutes.Moreover we assume the theatre is a monopolist, so it does not compete with otherorganizations in attracting the customers.In our setting, the organization has scheduled m events. Among the m events thattake place, let a be the number of high demand events (for ease of exposition werefer to these as events of type h) and b the number of low demand events (referredto as events of type l), so that a+b = m. Considering the events of the same type asindistinguishable from the demand perspective, there are n=(a · b) +m− 2 possiblebundling combinations2. Each possible bundle contains k events, with 2 ≤ k ≤ m.As already said, each offer set S consists of single tickets for all the events and onepossible bundle. So the offer sets differ from each other in the combinations of eventsthat define the bundle j.We denote by a and b the number of events of type h and l included in the bundle,so that each bundle is denoted by the pair of numbers (a, b).Whereas Venkatesh and Mahajan (1993) consider the events homogeneous from thedemand side, in this regard we deal with two types of events. This leads to a differ-ent formulation of the probability of purchasing either one single ticket or a bundleof tickets. Denoting by R the mean reservation price, when the events are homo-geneous, a sufficient condition for buying the bundle is that the (pB/i) < ps andR > (pB/i), that is, the average price paid for each performance attended is less thanboth the price of the single ticket and the person’s mean reservation price. However,in our case, this is not sufficient. In fact, R can vary according to the compositionof the bundle and the customer’s preference for the type of event. Given this, thechoice decision on what to purchase is based on what maximizes the difference be-tween the reservation price and the ticket/bundle’s face value.
The market can be divided into 6 market segments. The segmentation is basedon
• The preference for the type of event
– Pr(Rh > Rl): portion of the market that prefers events of type h,
– Pr(Rh < Rl): portion of the market that prefers events of type l.2(a · b) is the number of possible bundles that contain both events of type h and l. In addition
to these, there are a − 1 bundles that contain only type h events and b − 1 bundles that containonly type l events
58

• The reservation price of the event of type h
– Pr(Rh > p): portion of the market that can buy a single ticket of h,
– Pr(Rh < p): portion of the market that never buys a single ticket of h.
• The reservation price of the event of type l
– Pr(Rl > p): portion of the market that can buy a single ticket of l,
– Pr(Rl < p): portion of the market that never buys a single ticket of l.
Table 1 illustrates the characteristics of each market segment.All market segments can potentially buy a bundle, but two of these will buy only
Market segment Market portion Purchase choice
1 Pr(Rl > p | Rh > Rl) · Pr(Rh > Rl) Bundle or single tickets of events h and l2 Pr(Rh > p | Rl > Rh) · Pr(Rl > Rh) Bundle or single tickets of events l and h3 Pr(Rh > p | Rl < p) · Pr(Rl < p) Bundle or single tickets of events h4 Pr(Rl > p | Rh < p) · Pr(Rh < p) Bundle or single tickets of event l5 Pr(Rh < p | Rl < Rh) · Pr(Rl < Rh) Bundle or no purchase6 Pr(Rl < p | Rh < Rl) · Pr(Rh < Rl) Bundle or no purchase
Table 1: Characteristics of the market segments
a bundle and not single tickets; whereas there are two market segments that, in ad-dition to the bundle, can buy also single tickets of high and low demand events; onemarket segment that potentially can buy single tickets of only high demand eventsand one market segment that can buy single tickets of only low demand events.Given this, the decision on what to purchase is based on the comparison between,on the one hand, the surplus obtained by the bundle (and eventually (i − k) sin-gle tickets (in case i > k)) and, on the other hand, the surplus derived from thepurchase of only single tickets. Distinguishing the market segments is crucial inthis comparison. Indeed, in calculating the surplus of the bundle, for customers forwhich i < k, the number of events to be considered inside the bundle depends onthe preference for the type of events. The surplus of several single tickets dependsnot only on the preference for the type of perfomance, but also on the reservationprice of the not preferred event.Given a bundle (a, b) of size k = a + b, let γs(i), respectively, φs(i), denote thesurplus derived when the consumer belonging to the market segment s = 1, 2, ...6purchases only single tickets, respectively, the bundle (and eventually single ticketsin addition to the bundle).Consider the first market segment (i.e. s = 1): customers for which i < a will attend
59

i events of type h and no events of type l; otherwise, if i > a, customers will attenda events of type h and i − a events of type l. Hence the customers of this marketsegment will attend min{a, i} events of type h and max{i − a, 0} events of type l.We obtain γ1(i) as
γ1(i) = Rh ·min{a, i}+Rl ·max{i− a, 0} − p · i
If customers of the first segment decide to buy the bundle, we have to distinguishseveral cases:
• if i ≤ a, customers will attend a events of type h,
• if a < i ≤ k, customers will attend a events of type h and i− a events of typel included in the bundle,
• if i > k, customers will attend all the events on the bundle and, moreover,they will buy single tickets for i− k events, broken down as follows:
– if (i − k) < (a − a), customers will attend (i − k) events of type h thatare not included in the bundle, and no events of type l;
– if (i − k) > (a − a), customers will attend (a − a) events of type h thatare not included in the bundle, and i− a− b events of type l.
Given this, we can derive φ1(i):
φ1(i) =Rh ·min{a, i}+Rl ·max{min{i, k} − a, 0} − pB +Rh ·min{(max{i− k}, 0), (a− a)}
+Rl ·max{(i− a− b), 0} − p · {max(i− k), 0}.
The third segment differs from the first one only as regards the impossibility ofbuying single tickets of events of type l. Hence γ3(i) and φ3(i) are easily obtainedfrom γ1(i) and φ1(i) not considering the purchase of single tickets for l events:
γ3(i) = Rh ·min{a, i} − p ·min{a, i};
φ3(i) = Rh ·min{a, i}+Rl ·max{min{i, k} − a, 0} − pB+Rh ·min{(max{i− k}, 0), (a− a)} − p ·min{(max{i− k}, 0), (a− a)}.
As regards customers belonging to the fifth market segment, we know that theydon’t buy single tickets because their surplus would be negative. Hence γ5(i) = 0;whereas φ5(i) can be easily obtained by φ3(i) not considering the purchase of single
60

tickets:φ5(i) = Rh ·min{a, i}+Rl ·max{min{i, k} − a, 0} − pB.
γ2(i), φ2(i), γ4(i), φ4(i), φ6(i) can be easily obtained from, respectively, γ1(i), φ1(i),γ3(i), φ3(i), φ5(i) by substituting Rh, Rl, a, a, b, b, respectively, with Rl, Rh, b, b,a, a.
Thus, given a bundle (a, b) of size k = a+b, a consumer belonging to market segments = 1, 2, 3, 4 buys a bundle of tickets if his surplus is greater than the one obtainedbuying several single tickets, i.e. if φs(i) ≥ γs(i), whereas if s = 5, 6, φs(i) has to bestrictly positive.3
We denote by Prs the probability that a customer belongs to the market segment s,with s = 1, 2...6; moreover we denote by T = s the event that the customer belongsto the market segment s. Now we can define the probabilty PrB of buying a bundleas
PB =6∑s=1
Prsn∑i=1
Pr(X = i) · Pr(φs(i) ≥ γs(i) | T = s). (9)
Concerning the probability of buying a single ticket for an event h and l, we haveto distinguish among events that belong to the bundle B and those which don’t.Individuals of market segments 1 and 3 buy a single ticket for an event h ∈ B
provided φs(i) < γs(i). Hence Pr(φs(i) < γs(i)) gives the probability of buyingat least one event of type h ∈ B. Assuming that all the events of the same typehave the same probability of being bought through a single ticket, the probabilityof buying a ticket for the specific event h (that can be or not be included in thebundle) for segments 1 and 3 is equal to min{1, i/a}.Also an individual of market segment s = 2 can buy a single ticket for an event hBif i > b. In this case, the probability that a specific event is attended is equal to(i− b)/a.Thus the probability that a single ticket for a specific event h ∈ B is sold is given
3There is a case for which it is advantageous to buy the bundle even if φs(i) < γs(i). Let usconsider for example market segments 1 and 3 and a bundle that contains both types of events. IfRh − Rl > p, Pb/a < p, i > a and a 6= a, then it turns out to be convenient to buy the bundleattending the a events included in it and replacing the events of type l included in the bundlewith events of type h outside the bundle. In calculating the probability of buying the bundle andsingle tickets, we should take into account this situation. However, these conditions are verifiedfor a large value of the discount rate r. In our numerical example, r is not so large, and so we canexclude the occurrence of this situation.
61

by
P (hB) =∑s=1,3
Prsn∑i=1·Pr(X = i) · Pr(φs(i) < γs(i) | T = s) ·min(1, i/a)
+n∑
i=b+1Pr(X = i) · Pr2 · Pr(φ2(i) < γ2(i) | T = 2) · (i− b)/a.
(10)
Concerning the tickets for events h /∈ B, in addition to (10), there must be consideredthe case in which the consumer buys the bundle (i.e. when φs(i) > γs(i)). Fors = 1, 3 the condition is that i > k and the probability of buying a single ticket fora specific event h /∈ B is equal to min{1, (i− k)/(a− a)}.For s = 2, a ticket for an event h /∈ B is purchased if i > k+(b−b) and the probabilityof buying a single ticket for a specific event h /∈ B is equal to (i−k−(b− b))/(a− a).Thus, when a 6= a, the probability that a single ticket for a specific event h /∈ B issold is given by
P (h6B) =P (hB) +∑s=1,3
Prs{n∑i=k
Pr(X = i) · Pr(φs(i) > γs(i) | T = s) ·min{1, (i− k)/(a− a)}
+n∑
i=k+(b−b)
Pr(X = i) · Pr2 · Pr(φ2(i) > γ2(i) | T = 2) · (i− k − (b− b))/(a− a).
(11)
Similarly, P (lB) and P (l6B) can be obtained from (10) and (11) substituting Pr1,Pr2, Pr3, ha, a, b, b respectively with Pr2, Pr1, Pr4, b, b, a, a.
The outputs of the DEA model are the expected revenue and the attendance. Foreach offer set, the expected revenue for an arrived customer is given by
R(S) = pB · PB + p · (P (hB) · a+ P (lB) · b+ P (h6B) · (a− a) + P (l6B) · (b− b)), (12)
where pB is given by (2).
In order to calculate the attendance, there should be taken into account not onlythe capacity of the theatre but also the fact that when i < k, a person who buysa bundle does not necessarily attend all the performances included in the bundle:indeed, customers will attend the i events inside the bundle according to his/herpreference. Taking for example the attendance of the events of type h that belongto the bundle: customers who prefer events of type h and at the same time buy abundle will not attend (a− i) events of type h ∈ B if a > i. Similarly, for those who
62

prefer events of type l and buy a bundle, there are (k− i) events of type h ∈ B notattended when b < i < k.We denote by Z the amount of seats not occupied for events h belonging to thebundle, by customers who have bought the bundle. For the first, third and fifthmarket segments, we have to consider the case in which a > i: in this situation,when s = 1, 3, φs(i) > γs(i) when pB/i < p, whereas φ5(i) > γ5(1) when Rh · i > pB.For the second, fourth and sixth market segments, we have to consider the case inwhich b < i < k. Hence Z is given by
Z =M · j{[a∑i=1
P (X = i) · (a− i)] · [(Pr1 + Pr3) · v + Pr5 · Prob(Rh · i > pb | T = 5)]
+∑
s=2,4,6Prs
k∑i=b
P (X = i) · (k − i) · Pr(φs(i) > γs(i) | T )},
(13)
with
j =
1 if a 6= 0,
0 otherwise;
v =
1 if (pB/i) < p,
0 otherwise.
Similarly, we define W as the amount of seats not occupied by customers who havebought the bundle for events l belonging to the bundle:
W =M · t · {[b∑i=1
P (X = i) · (b− i)] · [(Pr2 + Pr4) · v + Pr6 · Prob(Rl · i > pb | s = 6)]
+∑
s=1,3,5PrS[
k∑i=a
P (X = i) · (k − i) · Pr(φs(i) > γs(i) | s)}),
(14)
with
t =
1 if b 6= 0,
0 otherwise.
and v as defined in (13).
Given this, the total attendance is given by
63

A(S) =min{c, [M · P (h6B) + w ·max{0, (M · (P (hB) + PB)− c− Z)} · a/(a− a)]} · (a− a)+
min{c, [M · P (l6B) + u ·max{0, (M · (P (lB) + PB)− c− Y )} · b/(b− b)]} · (b− b)+
min{c · a,M · (P (hB) + PB) · a− Z}+min{c · b,M · (P (lB) + PB) · b− Y },(15)
with
w =
1 if a 6= a,
0 otherwise;
u =
1 if b 6= b,
0 otherwise.
where M is the market share and c the capacity of the theatre.Notice that for the attendance of events not included in the bundle, we have con-sidered the possibility that people who can attend an event included in the bun-dle through a single ticket, will switch to an event not included in the bundlecause of the selling out of events admitted to subscribers. For example, eventsof type h included in the bundle are sold out if M · (P (hB) + PB) − Z > c. Somax{0, (M · (P (hB)+PB)−Z− c)} · a represents the ‘excess’ of customers consider-ing all the events h ∈ B. In formulating (15) we assume that this ‘excess’ is equallyallocated among the (a− a) events of type h. A similar argument holds consideringthe events of type l.
4 Numerical example
In this section, we present a simulated numerical study of the model presented inSection 3.The following setting is used. We consider a theatre which offers 10 events, 5 lowbrowevents and 5 highbrow events. Hence we have m = 10, a = b = 5, n = 33. Theaim is to identify which among the possible 33 combinations of a bundle is the mostefficient.First of all, it is necessary to estimate the probability density function (pdf) of therandom variables X,Rl, Rh.Concerning the first one, as far as we know, Venkatesh and Mahajan (1993) is theonly study that has modelled the distribution of the number of performances aperson is likely to attend. Specifically, in their study this variable follows a Weibull
64
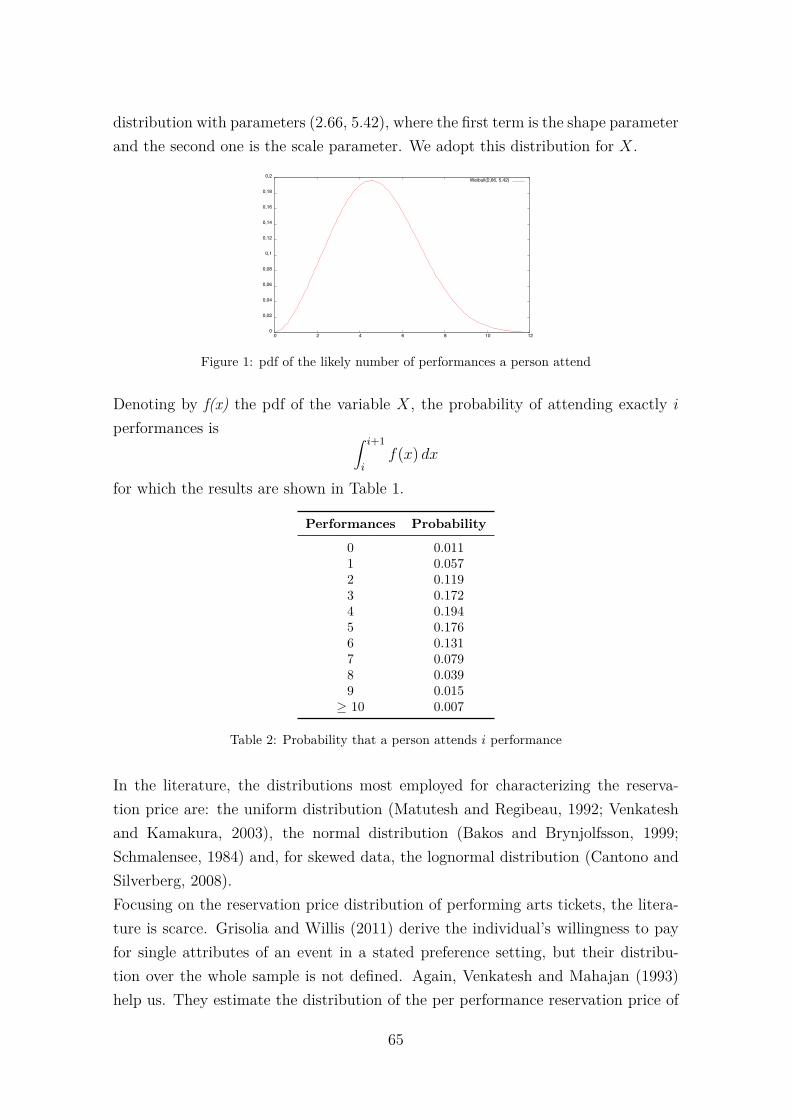
distribution with parameters (2.66, 5.42), where the first term is the shape parameterand the second one is the scale parameter. We adopt this distribution for X.
��
�����
�����
�����
�����
����
�����
�����
�����
�����
����
�� �� �� �� �� ��� ���
�� ��������������
Figure 1: pdf of the likely number of performances a person attend
Denoting by f(x) the pdf of the variable X, the probability of attending exactly i
performances is ∫ i+1
if(x) dx
for which the results are shown in Table 1.
Performances Probability
0 0.0111 0.0572 0.1193 0.1724 0.1945 0.1766 0.1317 0.0798 0.0399 0.015≥ 10 0.007
Table 2: Probability that a person attends i performance
In the literature, the distributions most employed for characterizing the reserva-tion price are: the uniform distribution (Matutesh and Regibeau, 1992; Venkateshand Kamakura, 2003), the normal distribution (Bakos and Brynjolfsson, 1999;Schmalensee, 1984) and, for skewed data, the lognormal distribution (Cantono andSilverberg, 2008).Focusing on the reservation price distribution of performing arts tickets, the litera-ture is scarce. Grisolia and Willis (2011) derive the individual’s willingness to payfor single attributes of an event in a stated preference setting, but their distribu-tion over the whole sample is not defined. Again, Venkatesh and Mahajan (1993)help us. They estimate the distribution of the per performance reservation price of
65

a serie of music/dance performances, that we classified as highbrow (low demand)events. The authors adopt a Weibull distribution because it is very flexible at ac-comodating a wide range of distributions. However, as our formulation involvesa linear combination of probability distributions, the Weibull distributions wouldmake problematic the estimation of the choice probabilities. Using their parametervalues of the distribution, we generate around 300 random numbers for the Weibulldistribution and test whether they can be approximated by a normal or log-normaldistribution. Starting with the per performance reservation price distribution (i.e.the random variable Rl), we generate a Weibull distribution with parameters (2.38,15.08). The data fits with a normal distribution with mean λRl = 12.72 and vari-ance σ2
Rl = 30.38, as the Jarque–Bera4 test confirmed5. We run the same data,transforming the data into their logarithms, in order to test whether the data followa log-normal distribution, but the Jarque–Bera test rejects the null hypothesis.Concerning the high demand events, we have hypothesized the parameters of thedistribution to be such that its mean is higher than that of the low demand events,and its variance is lower. Indeed a greater variance of the low demand events canfind a justification from the fact that consumers that are attracted by highbrowevents belong to the upper class with a greater availability of money, whereas thelower and middle social classes are more attracted by lowbrow events6. In such away we ensure that the values of the right tail of the distribution for the low de-mand events are greater than those of the lowbrow events. Therefore we assumethat Rh ∼ N(18, 5.7).Figure 2 plots the pdf of the per performance reservation price for both high andlow demand events. We assume that there is no correlation between the reservationprice of the high and low demand events: indeed, for the cluster of consumers thathas an omnivorous pattern of consumption (see Sintas and Alvarez, 2005) it can beargued that there is a positive correlation between the reservation prices of the highand low demand events. In contrast, consumers who have an univore consumptionpattern (such as the snobs or the popular consumers) are likely to show a negativecorrelation between the reservation prices of highbrow and lowbrow events. Giventhe simultaneous existence of these two contradictory patterns of consumption, weassume that at the market level there is no correlation between the reservation pricesof the high and low demand events.
4Our sample size is big enough to confirm the validity of the test, as Frain (2007) finds that thetest is lacking in power when the sample is smaller than 50
5The null hypothesis is that the data are from a normal distribution. The test statistic is 1.5330and this is smaller than the critical value, which is 5.7734.
6For a cluster analysis of the performing arts consumption, see Sintas and Alvarez (2005)
66

Figure 2: pdf of the performancewise reservation price for high and low demand events
The calculation of the probability of buying a bundle and/or single tickets deals withdifferent bivariate normal distributions. As an example, consider (10) with s = 3,in which we have Pr3 · Pr(φ3(i) < γ3(i) | s = 3). It can be written as
Pr(Rh > p,Rl < p, x ·Rh + y ·Rl < z), (16)
wherex = [min(a, i)+min[(max(i−k), 0), (a−a)]−min(a, i)]; y = [max(min(i, k)−a, 0)];z = pb + p ·min[(max(i− k), 0), (a− a)]− p ·min(a, i).We denote by Y the third variable, so that
V ∼ N(18 · x+ 12.72 · y, 5.7 · x2 + 30.38 · y2).
So F = (Rh, Rl, Y ) is the multivariate normal distribution we are interested in. Sinceits support lies in a 2-dimensional space, and Rh <
z−y·Rl
x, (16) can be obtained by
integrating over the probability density function of the bivariate normal 7
∫ p
−∞
∫ z−y·rl
x
p1{ z−y·rl
x≥p}fRh
(rh)fRl(rl) drhdrl, (17)
where 1{} is the indicator function, fRhand fRl
are respectively the density of Rh
and Rl.Once the probability of purchasing a single ticket and the bundle is calculated 8, theinput and the output values for the DEA model can be obtained.It is well known that the ability of DEA to discriminate between efficient and ineffi-cient DMUs depends on the relation between the number of inputs and outputs and
7This is for x > 0, otherwise the integration region changes8The probability values are obtained through the package ‘mvtnorm’ in the R software
67

the number of DMUs. In the literature there are different rules of thumb: Golanyand Roll [1989] suggest that the number of DMUs should be greater than 2 · (e+ f)where e and f are respectively the number of inputs and outputs used. Accordingto Dyson et al. [2001], instead, the number of DMUs should be greater than 2 · e · f .In order to further discriminate the DMUs, we have to exploit the unit invariantproperty of the DEA and the fact that our inputs are expressed with the same unitsof measurement to reduce the number of inputs from 10 to 2. As inputs, we use theaverage value of Q(S) for high demand and low demand events. This choice implies,for events of the same type, the same value judgments about the occupancy of thetheatre, which seems a reasonable assumption.We calculate the efficiency score considering three different values of the discountrate r (0.03; 0.04; 0.05) and three different values of the capacity of the theatre c(400; 600; 800), obtaining in all 9 situations.Table 3 shows the efficiency score of each (a, b) possible bundle 9 . The efficiencyscore reported is the reciprocal of the efficiency score obtained in the output-orientedapproach, so that the greater is the score, the more efficient is the DMU.The results shown in Table 3 shows that there is quite small variation in the DEAcoefficients. In relation to this, it may be concluded that a chenge in the bundlepolicy has a small impact in the expected revenue and attendance of the theatre,but actually the interpretation of the table reveals how the choice of the bundle canhave a significant impact on the theatre’s objective. For instance, let us consider thesituation in which r = 0.04 and c = 600. In this situation, the bundle (0,2) produces,ceteris paribus [(1 − (1/1.039)) · 100] = 3.75% more output (expected revenue andattendance) than the reference set in the efficient frontier. Assuming p = 15e andM = 1000, it results that, given the same capacity consumption, the bundle (0,2)increases the attendance of 139 people and the total revenue of 289e respect to theefficient frontier. Conversely, the bundle (5,0) produces [(1/0.945)−1)·100] = 5.82%less output than the reference set in the efficient frontier, meaning a loss in atten-dance of 210 people and a loss in total revenue of 158e.
As Table 3 shows, the super-efficiency scores for a DMU take different valuesaccording to which values of c and r are considered.In order to derive the possible relation between the score, capacity, discount rate,and composition of the bundle, a simple OLS regression is estimated. To this end,the use of the super-efficiency model has advantages over the traditional DEA scores.The latter, in fact, are censored at 1, forcing the adoption of a Tobit regression whichrequires the restricted assumption of normality of the underlying (uncensored) scores
9The efficiency scores are calculated using the ‘Benchmarking’ package in R
68

DMU r = 0.03 r = 0.03 r = 0.03 r = 0.04 r = 0.04 r = 0.04 r = 0.05 r = 0.05 r = 0.05c = 400 c = 600 c = 800 c = 400 c = 600 c = 800 c = 400 c = 600 c = 800
(1,1) 0.997 0.997 0.997 1.005 1.005 1.005 1.006 1.006 1.006(2,0) 1.037 1.004 1.004 0.990 0.995 1.000 0.988 0.990 1.000(3,0) 0.980 0.980 0.981 0.975 0.975 1.000 0.968 0.968 1.000(4,0) 0.968 0.968 0.983 0.957 0.957 1.000 0.945 0.945 1.000(5,0) 0.960 0.960 0.984 0.945 0.945 1.000 0.929 0.932 1.000(2,1) 0.999 0.999 0.999 1.002 1.003 1.003 1.002 1.004 1.004(3,1) 0.998 0.998 0.998 0.996 0.994 1.000 0.991 0.992 1.000(4,1) 0.993 0.992 0.998 0.985 0.983 1.003 0.973 0.978 1.004(5,1) 0.993 0.993 1.007 0.980 0.980 0.995 0.960 0.964 0.992(0,2) 0.991 0.990 0.990 1.060 1.039 1.000 1.019 1.039 1.000(1,2) 0.995 0.995 0.995 1.000 1.000 1.000 1.000 1.000 1.000(2,2) 0.998 0.997 0.997 1.000 1.001 1.000 1.000 0.998 0.997(3,2) 1.000 0.997 0.997 0.999 0.997 1.001 0.997 1.000 1.002(4,2) 1.003 1.000 1.002 0.999 0.995 1.004 0.992 0.990 1.001(5,2) 1.001 1.004 1.001 1.000 1.002 1.007 0.987 0.995 1.006(0,3) 0.992 0.986 0.986 1.002 1.000 1.000 1.001 1.000 1.000(1,3) 0.995 0.990 0.990 0.999 1.000 1.000 1.000 1.000 1.000(2,3) 0.998 0.994 0.992 1.000 1.002 1.000 1.000 1.007 1.000(3,3) 1.001 0.996 0.996 1.002 0.997 0.998 1.000 0.996 0.998(4,3) 0,996 0.995 0.995 1.001 0.995 0.998 0.998 0.996 1.000(5,3) 1.001 1.001 1.001 0.998 1.006 0.999 0.999 1.003 1.006(0,4) 0.997 0.982 0.982 1.003 1.000 1.000 1.004 1.000 1.000(1,4) 0.998 0.986 0.985 1.001 1.000 1.000 1.001 1.000 1.000(2,4) 1.001 0.993 0.990 1.001 0.996 0.996 1.001 0.993 0.991(3,4) 0.995 0.990 0.991 0.997 0.991 0.993 1.000 0.993 0.995(4,4) 0.993 0.992 0.992 0.993 0.994 0.991 0.998 0.993 0.994(5,4) 0.997 0.997 0.997 1.003 1.003 1.003 0.997 1.001 0.997(0,5) 1.009 0.979 0.979 1.012 1.000 1.000 1.014 1.000 1.000(1,5) 1.002 0.986 0.985 1.004 0.991 0.991 1.012 0.989 0.989(2,5) 0.995 0.987 0.987 0.998 0.988 0.990 1.000 0.990 0.989(3,5) 0.991 0.988 0.988 0.994 0.991 1.000 0.998 0.990 0.989(4,5) 0.986 0.986 0.987 0.993 0.990 1.000 0.993 0.991 0.989(5,5) 0.998 0.998 0.998 0.997 0.997 0.997 1.004 1.004 1.004
Efficient DMUs 9 4 5 16 14 23 17 14 22
Table 3: Efficiency score; in bold the three most efficient bundles for each situation.
69

(Nahra et al., 2009). In contrast, using as dependent variable the super-efficiencyscores, we can use the OLS regression that relaxes the assumption on the distribu-tion of the scores.To characterize the composition of the bundle, we use two variables: the first, calledsize, is an index that denotes the magnitude of the bundle and is defined as the ra-tio between the events included in the bundle and the total number of events. Thesecond, called popularity (pop), denotes the portion in the bundle of high demandevents with respect to low demand events. It is calculated in such a way 10:
Popularity = (a− b) + 510
We consider together all the 9 situations in order to verify the relation between theefficiency scores, the characteristics of the bundle, the capacity, and the discountrate.The RESET test suggests transforming all the independent variables into logarithms11, hence we estimated the following equation:
score =α + β1ln(popularity) + β2ln(size) + β3ln(c) · ln(popularity)
+ β4ln(r) · ln(popularity) + β5ln(c) · ln(size) + β6ln(r) · ln(size)
+ β7ln(popularity) · ln(size)
(18)
The bivariate correlation among the variables ln(c), ln(r), ln(popularity) and ln(score)are examined in order to detect co-linearity; however, the results don’t show signifi-cant correlation among variables. As there is evidence for heteroskedasticity (p-value< 0.10 for White’s test), we use the robust standard error estimates. We drop themain effect of c and r in the model because we know that the capacity and thediscount rate don’t affect the efficiency score in themselves but in their interactionwith the characteristics of the bundle.Table 4 shows the result of the OLS regression. Since (18) is a level-log equation,
10This index is inspired by the accounting literature on sustainability report: an index used toassess how sustainable is a firm is given by realvalue−minimum
maximum−minimum where real value is the differencebetween positive information and negative information argued by the financial report; minimumis the total number of indicators with a negative sign; maximum is the total number of indicatorswith a positive sign. As this index is used to indicate the quality of sustainability, our index isused to indicate the popularity of the bundle. In our case, 5 is used, as it is the maximum numberof possible low demand events that a bundle can include, and 10 is the maximum number of eventsa bundle can include. We prefer to use this index, instead of a simple difference between high andlow demand events, for a couple of reasons: first, this index is always positive and between 0 and1; second, being positive it can be easily integrated with the size to compose an unique index thatconsiders both the quantity of events in the bundle and its popularity
11As a consequence, the bundle (0,5) is dropped from the regression because its popularity scoreis equal to 0 and its logarithm tends to minus infinity
70

Independent variables coefficient Robust st. error
ln(popularity) −0.1241∗∗∗∗ 0.0244ln(size) 0.1116∗∗∗ 0.0416ln(c) · ln(popularity) 0.0131∗∗∗∗ 0.0030ln(r) · ln(popularity) −0.0143∗∗∗ 0.0046ln(c) · ln(size) −0.0127∗∗ 0.0057ln(r) · ln(size) 0.0070 0.0077ln(popularity) · ln(size) 0.0144∗∗∗ 0.0046constant 0.9966∗∗∗∗ 0.0027
R2 0.1707F -model 6.78∗∗∗
No. of observations 288∗p < .10 ∗∗p < .05 ∗∗∗p = .01 ∗∗∗∗p < .001
Table 4: Results of OLS
the marginal effects are interpreted in terms of semi-elasticity.For example, rearranging the derivative of the score with respect to the capacity, wehave
∂score
∂c· c1 = β2 · ln(pop) + β4ln(size), (19)
where the right hand side indicates the change in units of the efficiency score whenthe capacity increases by 1%.The coefficient estimations suggest that an increase in the capacity should be com-bined with an increase in the popularity of the bundle (β3 > 0). This is not surpris-ing: when the capacity is small, it is more likely that the theatre is sold out whenhigh demand events are proposed, even if they are not discounted through bundles.In contrast, when the capacity is large, it is more difficult to sell out high demandevents and, in this sense, including high demand events can help for this purpose.On the other hand, when the discount rate increase, it is suggested to decrease thepopularity of the bundle (β4 < 0). This result can be explained considering that ahigh discount rate should incentivate the attendance of low demand events: in facta high discount rate associated to high demand events may result in a decrease ofpotential revenue.Finally it should be noted that the coefficient of the interaction term between pop-ularity and size is positive (β7 > 0), indicating that an increase in popularity of thebundle yields an increase in the score only for bundles that include many events.As the coefficient associated with the popularity of bundle is negative (β1 < 0), wecan deduce that an increase in the number of popular events in the bundle shouldbe combined with the inclusion of low demand events in the bundle.
71
5 Conclusions
In this paper we analyze a structural-based RM problem for the performing artsorganization, related to the composition of a bundle of tickets to be offered. Thedecision problem consists in the determination of the most efficient bundle in termsof quantity and the ratio between high demand and low demand events. For thispurpose, we adopt a network RM approach [Liu and Van Ryzin, 2008] in definingthe efficient bundle and subsequently proposed a super-efficient DEA model in orderto detect the most efficient bundle among all the possible combinations of events.In order to derive the choice probability for each possible bundle, and so the in-puts and outputs of the DEA model, we model the purchase decision on the basisof two random variables: availability of time and reservation price per each typeof performance. In the numerical example presented, we consider 9 situations thatdiffer from each other in the capacity of the theatre and the discount rate of thebundle. Once the efficiency score has been obtained, we regress on the variablesthat characterize the bundles and subsequently on managerial variables (capacityand discount rate) in order to obtain some insights into what determines the effi-ciency level of a bundle. The results obtained can provide some recommendationsfor decision-makers. In particular, given a subscription, the theater manager canconsider the possibility to change the composition of the bundle to be offered to thecustomers in the following season, on the basis of these advices: if the discount rateof the bundle increases, the theater manager should promote a greater inclusion oflow demand events in the bundle, and viceversa. If the theater owns more than onestage, the theater manager should propose a bundle with a large share of popularevents for the theater with the largest capacity, whereas a subscription that includesa large share of low demand events should be associated with the smallest theater.This paper has as its main limitation the fact that we consider only two types ofevents, with the assumption that events of the same type have the same distri-bution of their reservation price. Future research should overcome this limitation,considering events that present a unique pattern of reservation price.
References
• Andersen, P., Petersen, N.C. (1993). A procedure for ranking efficient unitsin data envelopment analysis. Management Science 39, 1261–1264.
• Ansari, A., Siddarth, S., Weinberg, C.B. (1996). Pricing a bundle of productsor services: The case of nonprofits. Journal of Marketing Research 86–93.
72

• Bakos, Y., Brynjolfsson, E. (2000). Bundling and Competition on the Inter-net. Marketing Science 19(1), 63–82.
• Banker, R.D., Charnes, A., Cooper, W.W. (1984). Some models for estimat-ing technical and scale inefficiencies in data envelopment analysis. ManagementScience 30, 1078–1092.
• Belobaba, P. P. (1987). Survey paper—Airline yield management an overviewof seat inventory control. Transportation Science 21(2), 63–73.
• Bradlow, E. T., Rao, V. R. (2000). A hierarchical Bayes model for assortmentchoice. Journal of Marketing Research 37(2), 259–268.
• Cantono, S., Silverberg, G. (2009). A percolation model of eco-innovationdiffusion: The relationship between diffusion, learning economies and subsidies.Technological Forecasting and Social Change 76(4), 487–496.
• Charnes, A., Cooper, W.W., Rhodes, E. (1978). Measuring the efficiency ofdecision-making units. European Journal of Operational Research 2, 429–444.
• Chen, Y. (2005). Measuring super-efficiency in DEA in the presence of infeasi-bility. European Journal of Operational Research 161, 545–551.
• Chen, Y., Liang, L. (2011). Super-efficiency DEA in the presence of infeasibility:One model approach. European Journal of Operational Research 213(1), 359–360.
• Choi, C., Jeong, M., Mattila, A.S. (2014). Revenue management in the con-text of movie theaters: Is it fair? Journal of Revenue & Pricing management.
• Chung, J., Rao, V. R. (2003). A general choice model for bundles with multiple-category products: Application to market segmentation and optimal pricing forbundles. Journal of Marketing Research 40(2), 115–130.
• Cook, W.D., Liang, L., Zha, Y., Zhu, J. (2008). A modified super-efficiencyDEA model for infeasibility. Journal of the Operational Research Society 69, 276–281.
• Courty, P. (2000). An economic guide to ticket pricing in the entertainmentindustry. Recherches Čconomiques de Louvain/Louvain Economic Review 167–192.
• Drake, M.J., Duran, S., Griffin, P.M., Swann, J.L. (2008). Optimal timingof switches between product sales for sports and entertainment tickets. NavalResearch Logistics 55(1), 59–75.
73

• Duran, S., Swann, J.L., Yakõcõ, E. (2012). Dynamic switching times fromseason to single tickets in sports and entertainment. Optimization Letters 6(6),1185–1206.
• Dyson, R.G., Allen, R., Camanho, A.S., Podinovski, V.V., Sarrico, C.S.,Shale, E.A. (2001). Pitfalls and protocols in DEA. European Journal of Opera-tional Research 132(2), 245–259.
• Ferreira, K. D., Wu, D. D. (2011). An integrated product planning model forpricing and bundle selection using Markov decision processes and data envelopeanalysis. International Journal of Production Economics 134(1), 95–107.
• Frain, J.C. (2007). Small sample power of tests of normality when the alternativeis an α-stable distribution. Trinity Economics Papers No. 207.
• Golany, B., Roll, Y. (1989). An application procedure for DEA. Omega 17(3),237–250.
• Goldberg, S. M., Green, P. E., Wind, Y. (1984). Conjoint analysis of pricepremiums for hotel amenities. Journal of Business, 57(1), 111–132.
• Grisolia, J. M., Willis, K. G. (2011b). Heterogeneity In Willingness To PayFor Theatre Productions: Individual Specific Willingness To Pay Estimates ForTheatres, Shows And Their Attributes. Scottish Journal of Political Economy58(3), 378–395.
• Guiltinian, J.P. (1987). The price bundling of services: A normative framework.The Journal of Marketing 51(2), 74–85.
• Hansmann, H. (1981). Nonprofit enterprise in the performing arts. The BellJournal of Economics, 12(2), 341–361.
• Hanson, W., Martin, R. K. (1990). Optimal bundle pricing. Management Sci-ence 36(2), 155–174.
• Huntington, P. A. (1993). Ticket pricing policy and box office revenue. Journalof Cultural Economics 17(1), 71–87.
• Johnson, S.M., Garbarino, E. (2001). Customers of performing arts organi-zations: Are subscribers different from non-subscribers? International Journal ofNonprofit and Voluntary Sector Management 6, 61–77.
74

• Lee, H. S., Chu, C. W., Zhu, J. (2011). Super-efficiency DEA in the presence ofinfeasibility. European Journal of Operational Research 212(1), 141–147.
• Leslie, P. (2004). Price discrimination in Broadway theater. RAND Journal ofEconomics, 35(3), 520–541.
• Littlewood, K. (1972). Forecasting and control of passenger bookings. AGI-FORS Symposium Proceedings, 95Ð117.
• Liu, Q., Van Ryzin, G. J (2008). On the choice-based linear programming modelfor network revenue management. Manufacturing & Service Operations Manage-ment 10(2), 288–310.
• Lovell C.A.K, Rouse A.P.B. (2003). Equivalent standard DEA models to pro-vide super-efficiency scores. Journal of the Operational Research Society 54, 101–108.
• Matutes, C., Regibeau, P. (1992). Compatibility and bundling of complemen-tary goods in a duopoly. The Journal of Industrial Economics 37–54.
• Nahra, T. A., Mendez, D., Alexander, J. A. (2009). Employing super-efficiencyanalysis as an alternative to DEA: An application in outpatient substance abusetreatment. European Journal of Operational Research 196(3), 1097–1106.
• Orbach, B.Y., Einav, L. (2007). Uniform prices for differentiated goods: Thecase of the movie-theater industry. International Review of Law and Economics27(2), 129–153.
• Rosen, S., Rosenfield, A. M. (1997). Ticket Pricing 1. The Journal of Law andEconomics 40(2), 351–376.
• Rafiei, H., Rabbani, M., Razmi, J., Jolai, F. (2013). Product Bundle Pricingin the New Millennium: A Literature Review. International Journal of Advancesin Management Science.
• Schmalensee, R. (1984). Gaussian demand and commodity bundling. Journalof Business 57(1), S211–S230.
• Seaman, B.A. (2006). Empirical studies of demand for the performing arts. In V.Ginsburgh and D. Throsby (Eds.), Handbook of the Economics of Art and Culture,(Vol. 1, pp. 415–472). Amsterdam: Elsevier.
75

• Shen, Z. J. M., Su, X. (2007). Customer behavior modeling in revenue man-agement and auctions: A review and new research opportunities. Production andOperations Management 16(6), 713–728.
• Sintas, J. L.,çlvarez, E. G. (2005). Four characters on the stage playing threegames: Performing arts consumption in Spain. Journal of Business Research58(10), 1446–1455.
• Stigler, G. J. (1963). United States v. Loew’s Inc.: A note on block-booking.Sup. Ct. Rev., 152.
• Stremersch, S., Tellis, G. J. (2002). Strategic bundling of products and prices:A new synthesis for marketing. Journal of Marketing 66(1), 55–72.
• Talluri, K. T., and Van Ryzin, G. (1998). An analysis of bid-price controls fornetwork revenue management. Management Science 44(11 part 1), 1577–1593.
• Talluri, K. T., Van Ryzin, G. J (2004). Revenue management under a generaldiscrete choice model of consumer behaviour. Management Science 50(1), 15–33.
• Talluri, K. T., Van Ryzin, G. J (2006) The Theory and Practice of RevenueManagement, Kluwer Publisher, Dordrecht.
• Tereyagoglu, N., Fader, P., Veeraraghavan, S. (2012). Filling seats ata theater: Estimating the impact of posted prices and dynamic discounts. TheWharton School, University of Pennsylvania, Philadelphia, PA.
• Venkatesh, R., Kamakura, W. (2003). Optimal bundling and pricing under amonopoly: Contrasting complements and substitutes from independently valuedproducts. The Journal of Business 76(2), 211–231.
• Venkatesh, R., Mahajan, V. (1993). A probabilistic approach to pricing abundle of products or services. Journal of Marketing Research 3, 494–508.
• Venkatesh, R., Mahajan, V. (1997). Products with branded components: Anapproach for premium pricing and partner selection. Marketing Science 16(2),146–165.
• Venkatesh, R., Mahajan, V. (2009). The design and pricing of bundles: Areview of normative guidelines and practical approaches. In: Handbook of PricingResearch in Marketing 232.
76

• Vogel, H.L. (1990). Entertainment Industry Economics: A Guide for FinancialAnalysis. Cambridge University Press.
• Yakõcõ, E., Ězener, O. Ě., Duran, S. (2014). Selection of event tickets forbundling in sports and entertainment industry. Computers & Industrial Engi-neering 74, 257–269.
77

Multiobjective optimization model for pricing andseat allocation problem in non profit performing
arts organization
Andrea Baldin∗1, Trine Bille†2, Andrea Ellero‡3, and Daniela Favaretto§4
1,3,4Department of Management, Ca’ Foscari University of Venice, Cannaregio 873, 30121 Venice, Italy2Department of Management, Politics and Philosophy, Copenhagen Business School, Porcelænshaven
18B, 3.floor, 2000 Frederiksberg, Denmark
AbstractThe implementation of Revenue Management (RM) techniques in non
profit performing arts organizations presents new challenges compared toother sectors, such as transportion or hospitality industries, in which thesetechniques are more consolidated. Indeed, performing arts organizations arecharacterized by a multi-objective function that is not solely limited to rev-enue. On the one hand, theatres aim to increase revenue from box office asa consequence of the systematic reduction of public funds; on the other handthey pursue the objective to increase its attendance. A common practiceby theatres is to incentive the customers to discriminate among themselvesaccording to their reservation price, offering a schedule of different prices cor-responding to different seats in the venue. In this context, price and allocationof the theatre seating area are decision variables that allow theatre managersto manage these two conflicting goals pursued. In this paper we introducea multi-objective optimization model that jointly considers pricing and seatallocation. The framework proposed integrates a choice model estimated bymultinomial logit model and the demand forecast, taking into account the im-pact of heterogeneity among customer categories in both choice and demand.The proposed model is validated with booking data referring to the RoyalDanish Theatre during the period 2010-2015.
Keywords Multi-objective optimization; Pricing; Seat allocation; Multinomial logit model;Theatre demand
∗E-mail: [email protected]†E-mail: [email protected]‡E-mail: [email protected]§E-mail: [email protected]
78

1 Introduction
In the seminal article by Baumol and Bowen (1966) the authors claim how the-atres will be more and more dependent on subsidies, due to their productivity lag.However, the last decades’ tendency shows that public funds allocated to non profitperforming arts organizations in Western countries (Marco-Serrano, 2006) are de-creasing1. This fact has forced theatres to increase other sources of revenue, includ-ing box office revenue. In addition, such organizations pursue the aim to increasethe attendance, for a couple of reason: first, they feel the mission to spread cultureto as broad a segment of the populace as possible (Hansmann, 1981) legitimizingtheir social value; second, they prefer to avoid empty seats in the venue that canhave negative effect on the reputation of the theatre.In this context, managers of the performing arts organizations can implement Rev-enue Management (RM) techniques in order to balance between the rate of occu-pancy and the profitability of theatre. The most common among these techniquesis realized through market segmentation based on the price leverage, that leads todifferent pricing scheme. For istance, price reductions are offered to customers seg-ments, such as students and senior citizens, who are supposed to be less able to pay.Discounts are offered also to those customers - subscribers - who buy in advance abundle of tickets, assuring a long-term commitment toward the theatre. Due to het-erogeneity in price sensibility within the same customer segment, one usual practiceby theatre is to use a non-linear tariff system offering a schedule of different pricesaccording to the quality of the product. In this case, different prices are chargedaccording to the seat location in the venue in order to better capture consumers’willingness to pay. Indeed, this mechanism incentives customers to discriminatethemselves by choosing the seating area they prefer. So, beside the pricing strategy,also the seat allocation across these fare classes (i.e seating area) represents a deci-sion that may foster an orientation by the theater towards either the maximizationof the total attendance or the maximization of revenue. In the first case we expectthat theatre would increase the accessibility of the most expensive seating areas forall the customers: to do this, it is convenient to propose a scheme in which theprices of the different seating are closer downward. This mechanism will lead to anincrease of the size of the expensive seating area and, in addition, can favorite a cus-tomer buy-up behaviour (i.e buying a ticket for a more expensive fare class when the
1This framework holds also for our case study: the Royal Danish Theatre. According to theNational Danish Statistics (http://www.statbank.dk), the public subsidy to the Royal DanishTheatre decreases from 608 675 Danish crowns in the 2011/2012 season, to 573 900 Danish crownsin the 2014/2015 season.
79
ticket for the required seating area is not available). In the second case, we expectthat theatre would strengthen the self-discrimination operated by customers. Thus,the allocation policy will strongly depend on the type of customer that attends theperformance: if the performance attracts an audience group (as young customers)that is supposed to be highly price sensitive, the theatre would enlarge the cheapestseating area in order to prevent a loss in revenue. In the opposite case, the theaterwould take advantage of the inelastic demand by enlarging the expensive seatingarea.With respect to this pricing and allocation strategy, it becomes essential not onlythe demand forecasting, but also the understanding of the customers’ behavior withrespect to price discrimination by seating area. Since Talluri and Van Ryzin’s (2004)paper, discrete choice models have emerged as a standard approach in the RM lit-erature to incorporate the buy-up and buy-down behavior.This paper proposes an optimization model that jointly considers the pricing andallocation problem in the performing arts context. To this end, the demand fore-casting is integrated with a customer choice model. In order to accomodate forheterogeneity in preference over seating areas, we adopt a multinomial logit model(MNL) using customer’s characteristics and performance-production attributes asvariables to be interacted with the characteristics of the choice alternatives.We aim to contribute to the RM and theatre demand literature by demonstratingthat discrete choice and optimization models can effectively be employed to assisttheatre managers in both setting price and seating allocation. Indeed, theatres, asproviders of performing arts services, meet the requirements for the implementationof RM techniques, such as the capacity constraint and the perishability issue (i.e theticket value deteriorates as time goes on and it is null when the performance starts).However, as already said, subsidized theatres, compared to the dominant sector inRM literature like the transportation and hospitality industries, are organizationswhich pursue other objectives in addition to the revenue maximization. Therefore,we employ a bi-objective optimization model to study the optimal pricing and seatallocation with conflicting objectives related to revenue and total attendance.Our model has been implemented to a data set provided by the Royal Danish The-atre which refers to the period 2010-2015. A simulation is conducted consideringthree performances that differ from each other by characteristics that affect the de-mand.To the best of our knowledge, there are no studies in the RM literature that hasconsidered jointly the pricing and allocation problem in a context in which the orga-nization present an objective function that is not limited solely limited to revenue.
80

In this sense, we believe that this is the added value of this article, providing guid-ances to theatre managers in adapting the price and size of seating area accordingto the weight given to each objective to pursue.The remainder of the paper is organized as follows: Section 2 presents the relevantliterature on RM in the performing arts context; Section 3 describes the researchframework, whereas Sections 4 and 5 present respectively the demand estimationand the choice model. Section 6 describes the optimization model, whereas Section7 presents the results of our simulation. Finally Section 8 provides some conclusions.
2 Literature review
Opposed to a huge amount of RM research devoted to transportation industry, theissues related to pricing and allocation problems in performing arts organizationshave not received a great deal of attention. This disparity is due to different fac-tors: first, RM is not a pervasive practice in most of these organizations. Second,this kind of organizations is characterized by peculiar features, in primis the multi-dimensional nature of their objectives.The literature of cultural economics has been dealing with the objectives of perform-ing arts institutions. Since most performing arts institutions are nonprofit firms thistaps into a more general literature on the objectives of nonprofit firms (e.g. Hans-mann (1980) and Steinberg (1986)). Steinberg (1986) suggests that nonprofit firmsare either service maximizers or budget maximizers or something in between. How-ever, in the performing arts, the concept of service is not straight forward. Severalauthors (e.g. Throsby and Wither, 1979, Throsby, 1994, and Hansmann, 1981) havesuggested three different measures of output: 1) Quality, 2) Audience size and 3)Budget. Several empirical studies have shown that the performing arts are primarilyoutput maximizers (either quality or quantity), and less budget maximizers (see e.g.Luksetich and Lange, 1995; and Gapinski, 1985). For an overview of the literaturesee Brooks (2006). To our knowledge no studies have been made, dealing with theoptimization decisions in the performing arts, when the repertoire is planned (basedon quality decisions), and the theatre wants to make the optimal decision on howto maximize attendance as well as revenue, based on decision on prices and seatcategories.Most of the research related to the demand-management decision in the theatre sec-tor has focused on the price discrimination practice. Hansmann (1981) claims thatin the nonprofit performing arts sector, price discrimination is not effective due tothe difficulty to identify customers with inelastic demand. Therefore, according to
81
the author, the only form of discrimination that nonprofit enterprise can apply isby asking for a voluntary donation, in order to extract a part of consumer’s surplus.Seaman (1985) raises some doubts about Hansmann’s (1981) hypotheses: the authormeasures the degree of price discrimination (such as: the number of different pricescharged and the standard deviation of the prices charged) to a set of non profit per-forming art organization. He concludes that price discrimination varies significantlyacross art forms (opera, ballet, theater, symphony concert) and that the organiza-tions that discriminate more are characterized by a high ratio between fixed costand attendance. Huntington (1993) justifies the adoption of price discrimination byseating area, by referring to the Rosen’s (1974) utility model (i.e the hedonic pricemodel), as there are observable differences between different seats. Moreover, theauthor compares the box office revenue between theaters operating a single pricepolicy and those operating a discrimination pricing policy: he finds that the pricerange policy is statistically significant and positively correlated with the revenue ofthe theatre, controlling for seat capacity and the number of performances per year.Rosen and Rosenfield (1997) describe a model in which theater venue has two typesof seats: (high and low quality), and the theatre manager knows the distribution ofreservation price for both seat category. First, the authors solve the pricing prob-lem, given the quantity of seats for each category. Second, the authors solves theallocation problem, given the optimal pricing policy. Leslie (2004) considers theBroadway show ”Seven Guitars” and estimates a structural econometric model ofprice discrimination based on a individual consumer behavior model, that incorpo-rate all the types of price discrimination (by seating area and social category). Themodel allows him to perform different experiment using alternative pricing policies.Tereyagoglu et al. (2012) use the data from the ticket purchase transaction of theshows of a symphony orchestra in the northeast region of the US, in order to employa proportional hazard framework to analyze how pricing and discount actions overtime affect the timing of customers purchase.
3 Research framework
3.1 The Royal Danish Theater
The Royal Danish Theatre was founded in 1748 and is the Danish national theatre.It has three main Stages in Copenhagen. The Old Stage from 1874, a new RoyalOpera House from 2005 and a new Royal Playhouse from 2008. The Opera Houseand the Playhouse has a main stage and smaller stages for experimental productions.It is one of the few theaters in the world offering both opera, ballet and theatre per-
82

formances as well as classical concerts. Today The Old Stage is the house, whereballet is performed.The law of the Royal Danish Theatre states that it is the national theatre for thewhole country and the entire population. Besides, it has an obligation to producea broad repertoire of high artistic quality within ballet, opera and plays. It is obli-gated to continue the classical traditions as well as developing the performing arts innew and contemporary ways. A special concern is on productions of Danish origin.The Royal Danish Theatre is on the state budget under the Ministry of Culture, andhas a number of more specific obligations in agreement with the current Minister ofCulture. Included in these obligations are general cultural policy goals, like havingspecial productions for children and youth, and to keep prices to a level that makethe theatre accessible for all socio-economic groups.In 2015 the theatre had a total budget of 705,4 million DKK (94 million Euros), ofwhich 76 percent were public support from the Government. The theatre had 165,8million DKK (22 million Euros) in own earnings, of which 69 percent (15 millionEuros) was from ticket sales, the rest was income from sponsors etc.Due to its obligations as a national theatre, it has to decide its repertoire based on anumber of parameters, namely quality and variety, understood as a fairly large num-ber of different productions from the classical repertoire as well as new productions,developing the performing arts, and Danish as well as international production fromthe world repertoire. Besides, it has to decide the number of performances of eachproduction during the season and how they are scheduled on weekday and weekends.It will create a loss in earnings if a given production is played less than demandedby the audience as well as if a performance is played more times than demanded bythe audiences (empty seats). There are high fixed costs take a new producing onstage (due to rehearsal time, designing the staging etc.), but the costs to prolonga production with extra performances are small, and the marginal costs are lowerthan the marginal revenue (Bille Hansen, 1991).Finally, it has to decide its price policy, including price differentiation based on dif-ferent audience groups (like young, subscribers and senior) as well as seat categories,time of the performance, the type of the performance, the production costs etc.
3.2 Problem description
In this paper we assume that the repertoire decisions are already determined bythe theater, both with regard to the variety of productions and the number ofperformances of each production during a season. With this restriction the theatre
83

has to decide on the price and the allocation of seat categories for the individualperformances. It is assumed, that the theatre wants to optimize both attendanceand revenue, where the former finds an upper limit in the theatre capacity. Our bi-objective optimization model incorporates the demand forecast and the customers’seat choice model. The latter is estimated with a multinomial logit (MNL) modelthat predicts the probability to choose a particular seating area as a function ofprice and performance characteristics. From Baldin and Bille (2016) we know thatsome audience groups (especially young people) are quite price sensitive, while othergroups are very insensitive to price (e.g., subscribers). Therefore, we estimate onedemand forecast for each customer category; whereas the choice model accountsfor heterogeneity by including choice-invariant variables that accounts also for thecustomer category.The methodological procedure in this paper follows the study by Hetrakul and Cirillo(2014) that proposes, in a railway setting, an optimization model in which discretechoice models and demand function are integrated, in order to calculate the priceand fraction of the demand to be accepted for each origin-destination pair.
4 Demand forecast
4.1 Sample selection
The demand estimation is based on booking data from the sale system of the RoyalDanish Theater for the period 2010/2011 to 2014/2015. The sample is constitutedby 401 opera performances which took place during that period. We estimate ademand function for each customer category identified, with which we refer to theprice type applied by the theater in the price discrimination process across buy-ers. Hence, we assume that the market segmentation is solely based on the priceleverage. Among the numerous price type existing (including customers with a loy-alty card, employees, group sales, disabled...), we consider the three main customercategories that together account for nearly 80% of the total tickets sold: standardticket buyers (45.9%) who pay the full price for the ticket; young (under 25 years)-student customers (6.1%) for which tickets are discounted by 50%; and subscribers(26.1%). Regarding the subscribers categories, Royal Danish Theatre applies twotype of subscription: a fixed subscription, in which the bundle of events included ispredetermined by the theatre, and a “choose your own” subscription that allows thecustomers to choose the productions they want to see. In the first case, a discountof 15% is applied, whereas in the second case the discount drops to 10%. In orderto simplify the optimization model, we merge the two types of subscription, consid-
84

ering the average discount of 12.5%. In this category we include also the additionaltickets that a subscriber can purchase, besides his subscription. For example, whena subscriber buys a performance ticket of a production that it is not included in thesubscription, also this ticket is discounted by 10%.For the purpose of model simplicity, there are some remarkable categories that, giventheir low number of attendees per performance, are not considered. For example,tickets for senior customers, which are entitled to a discount of 50%, represents only2.5% of the tickets sold just because this discount is made available only for someperformances decided by theatre management. Indeed, as many senior customersare subscribers, it does not result convenient to offer this discount for all the perfor-mances. We exclude also the young/student subscribers, which accounts for 0.74%of the total theater market: their discount is 65% for a fixed subscription and 60%for a “choose your own” subscription.
4.2 Demand estimation
Following the literature, we adopt a double-log specification, which is the mostpopular functional form adopted in estimating theatre-attendance demand (Seaman,2006). For each category j, the following demand function is estimated:
ln(Dj) = αj + βjln(pj) + γ′jz + εj (1)
so as:Dj = exp(αj + βjln(pj) + γ′jz + εj) (2)
where, for given a performance, Dj is the number of tickets sold to category j, pj isthe average price of ticket deflated by CPI2 charged to category j: in particular, wetake the average price of the different seat categories offered by the theatres. z is avector of performance and production characteristics, while εj is an error term.Concerning the performances scheduling, we include three dummy variables to takeinto account the weekly seasonal effect: WKDAY denotes performances run duringweekdays (from Monday morning to Friday morning); WKEND indicates perfor-mances run during Friday and Saturday evening or during the evening before apublic holiday. Finally SUNDAY denotes performances that take place on Sundayor in a public holiday day. This latter group of performances are “matinee” asno evening performances take place on Sunday. Except on Sundays, in the otherdays of week performances can take place either on monday-afternoon or during theevening. We denote with EVE performances that take place during the evening.
2CPI data are collected by Statistics Denmark: http://www.dst.dk/en
85

In order to capture the seasonality effect, we construct month dummies variablesfor each month of the year, except for July and August when the theatre is closed.In addition, following Corning and Levi (2002) we include also REMAIN and TOT-PERF denoting respectively the number of remaining and total perfomances of agiven production. We find also a significant interaction between these two variables:indeed, this interaction term allows to weight the amount of remaining performance:for instance, the effect of the second to last performance changes when the total num-ber of performances are twenty or, for example, five.We also control for the production characteristics: to capture the popularity of anopera show, we introduce the variable POP measured as the number of times theproduction is performed worldwide during the same year it has been performed inthe Royal Danish Theatre 3. However, it should be considered that some Danishproduction (e.g Maskarade, Livlægens besøg) are popular in Denmark but not world-wide. To control for this aspect, we include the dummy DANISH, denoting Danishproductions. Moreover, the dummy variable NEWDKT controls for productionsthat take place for the first time at Royal Danish Theater.We also control for the year the production has been created by introducing threedummies: 1920-2015, 1850-1919, BEFORE 1850.As our analysis is based on performances running in 5 years, we include a time trendt variable. Finally, considering that the total capacity of the theatre can change dueto production requirements, we add the variable CAPACITY indicating the numberof the available seats for the show.In estimating the demand function for subscribers, we add a new variable SUB-YEAR as the log number of subscribers in the current season. Indeed subscriptionsare sold in advance and the number of subscribers is known to the theatre before theseason starts. However, for customers who buy a fixed subscription, it is unknowntheir distribution among performances, given a production.Table 1 provides a descriptive statistics of the data.We estimate (1) by OLS with robust standard-error. Although more sophisticatedmodels are available for a forecast analysis (Ainslie et al., 2005), not necessarily suchtechniques provide a significant improvement (Andrews et al., 2008; Eliashberg etal., 2009).We have also checked for multicollinearity issues that does not seem to arise.Table 2 shows the estimation results of the demand function for all the categoriesconsidered.
3We collect these data through ”Operabase”, a website designed to collect statistics aboutoperatic activity worldwide: http://operabase.com
86

Variable Mean SD Min Max
Price (standard ticket) 456.06 74.93 208.96 661.13Standard tickets sold 562.34 252.11 62 1117Young tickets sold 73.46 63.65 0 576Subscribers ticket sold 310.33 151.37 0 716REMAIN 7.49 5.38 1 30TOTPERF 14 6.07 6 30CAPACITY 1482.89 45.51 1297 1529POP 213.17 186.00 1 507SUNDAY 0.174 0.380 0 1WKEND 0.257 0.437 0 1WKDAY 0.568 0.496 0 1EVE 0.733 0.443 0 1JANUARY 0.157 0.364 0 1FEBRUARY 0.117 0.322 0 1MARCH 0.149 0.357 0 1APRIL 0.115 0.319 0 1MAY 0.147 0.355 0 1JUNE 0.047 0.2127 0 1SEPTEMBER 0.027 0.163 0 1OCTOBER 0.085 0.279 0 1NOVEMBER 0.125 0.331 0 1DECEMBER 0.030 0.171 0 11920-2015 0.160 0.366 0 11850-1919 0.486 0.500 0 1BEFORE 1850 0.354 0.479 0 1DANISH 0.027 0.163 0 1NEW DKT 0.651 0.477 0 1t 3.06 1.295 1 5401 observations
Table 1: Descriptive statistics of OLS variables
Results of the demand estimation reveal that price elasticity differs across customercategory. Young customers is the audience group most price sensitive: a 1 % increasein ticket price results in approximately 1.84 % decline in demand. Standard ticketbuyers are less price sensitive as the price elasticity is less than unity: a 1 % increasein ticket price results in approximately 0.49 % decline in demand. Consistent withprevious results in literature (Felton, 1994; Baldin and Bille, 2016), subscribers arethe least price sensitive: for our sample the price coefficient is even not statisticallysignificative. This result is not surprisingly as literature has shown in some caseseven a positive price elasticity in the demand for performing arts, configuring thetheatrical experience as a Veblen good (Laamanen, 2013).The results for the single ticket buyers show a strong explanatory power (R2 = 0.75)and almost all variables are statistically significant. In particular, Table 2 showsthat, for this type of customers, the demand is higher for Friday/Saturday eveningperformances. The number of times a title is rerun (TOTPERF), which is sup-
87

Variable Single tickets Young Subscribers
Intercept 2.3538∗∗ 6.7917∗∗∗∗ −0.1729(1.017) (1.986) (3.1428)
Log price −0.4904∗∗∗ −1.8440∗∗∗∗ −0.1315(0.1811) (0.3994) (0.7346)
SUNDAY 0.22741∗∗∗∗ −0.0459 0.2652(0.0654) (0.1321) (0.1980)
WKEND 0.4620∗∗∗∗ 0.0083 −0.0338(0.0357) (0.0644) (0.0926)
EVE −0.1205∗∗ −0.0220 0.1626(0.0596) (0.1106) (0.1838)
REMAIN −0.0575∗∗∗∗ −0.0483∗∗∗ −0.0122(0.0089) (0.0173) (0.0249)
TOTPERF 0.0365∗∗∗∗ −0.0081 −0.0472∗∗∗(0.0049) (0.0097) (0.0154)
REMAIN x TOTPERF 0.0020∗∗∗∗ 0.0018∗∗ 0.0013(0.0004) (0.0007 (0.0009)
JANUARY 0.2743∗ −0.0458 1.0828∗∗(0.1603) (0.2493) (0.5359)
FEBRUARY 0.3370∗∗ 0.1374 1.1611∗∗(0.1590) (0.2415) (0.5034)
MARCH 0.3383∗∗ −0.0316 1.2604∗∗(0.1568) (0.2350) (0.4980)
APRIL 0.4957∗∗∗ −0.0492 1.2728∗∗(0.1580) (0.2384) (0.5195)
MAY 0.5726∗∗∗∗ −0.1028 1.3395∗∗∗(0.1542) (0.2318) (0.5044)
JUNE 0.5192∗∗∗ −0.2148 1.1711∗∗(0.1631) (0.2764) (0.4956)
SEPTEMBER −0.2083 −0.9979∗∗∗ 1.5058∗∗∗(0.1949) (0.3619) (0.5473)
OCTOBER 0.0237 −0.3690 1.3119∗∗(0.1597) (0.2449) (0.5255)
NOVEMBER 0.0575 −0.2394 1.0168∗∗(0.1554) (0.2315) (0.5030)
POP 0.0007∗∗∗∗ 0.0022∗∗∗∗ −0.0013∗∗∗∗(0.0001) (0.0002) (0.0002)
1850-1919 0.6935∗∗∗∗ 0.1236 0.6683∗∗∗(0.0758) (0.1903) (0.2374)
BEFORE 1850 0.6385∗∗∗∗ 0.1108 0.8165∗∗∗∗(0.0743) (0.1851) (0.2292)
DANISH −0.1132 0.8734∗∗∗∗ −0.5989∗∗∗(0.0858) (0.1247) (0.1997)
NEWDKT −0.0648∗ 0.1970∗∗∗ −0.0524(0.0376) (0.0771) (0.0774)
CAPACITY 0.0037∗∗∗∗ 0.0045∗∗∗∗ 0.0008(0.0004) (0.0009) (0.0010)
t −0.0101 0.0606∗∗ 0.1007∗∗(0.0164) (0.0303) (0.0508)
SUBYEAR 0.5192∗∗∗∗(0.1348)
R-square 0.7512 0.4213 0.3830Model F-value 51.64∗∗∗∗ 13.22∗∗∗∗ 5.02∗∗∗∗No. of observations 401 401 401Robust st.error listed under coefficients∗∗∗∗p < 0.001 ∗∗∗p < 0.01 ∗∗p < 0.05 ∗p < 0.10
Table 2: Estimation results of demand functions
88

posed to be an indicator of the total expected demand for that production, has apositive impact on the demand for a single performance. Moreover, given the sameproduction, each performance has a 5.75 % higher demand than the previous, hold-ing fixed the number of times a performance is rerun. This is probably due to aword-of-mouth effect (Laamanen, 2013). Furthermore, we can deduce that singleticket buyers prefer traditional and less risky productions than the more experimen-tal ones: indeed the productions that take place for the first time at Royal DanishTheatre have a negative impact on demand; whereas popularity score has a positiveimpact, as well as those production composed before 1919.Results for young customers and subscribers have a lower explanatory power (R2
is respectively 0.42 and 0.38). For the former, there is a positive word-of-mouthand time trend effect. Furthermore, the Danish productions have a strong positiveeffect on demand, as well as the popularity of the production worldwide; but alsothe productions that take place for the first time at Royal Danish Theater seem tobe appealing to young customers.Concerning subscribers, we note a significant month-seasonality and time trend ef-fect. Contrary to single ticket buyers, subscribers seem to appreciate less conven-tional productions, as the coefficient associated with the popularity score is negative.On the other side, productions composed before 1850 seem to be preferred by thisaudience group.Table 3 compares the actual attendance with the values predicted by the demandfunctions. The prediction capability of the model is measured with different indica-tor, such as root mean squared error, mean absolute error, average error and Pearsoncorrelation between predicted and actual. In addition we perform the out of samplevalidation. We consider 74 performances run during season 2015/2016 that are notincluded in our sample. The demand functions for such performances are estimatedusing the coefficients obtained for our initial sample, and their final estimations arecompared with the actual attendance.Whereas the average errors is decidedly higher for the out of sample performancesthan the sample performances; the other measures are similar among the two groupsof performances.
89

Root mean Mean absolute Pearson Averagesquared errors errors correlation errors
2010/2011-2014/2015
Single tickets 148.33 114.55 0.78 12.76Young 52.09 28.36 0.68 9.92Subscribers 139.22 106.44 0.56 26.20
2015/2016
Single tickets 155.31 133.06 0.83 -86.11Young 53.52 30.69 0.56 12.11Subscribers 111.02 100.84 0.57 -33.58
Table 3: Predictive performance of the demand functions
5 Customer choice model
5.1 Sample selection
The choice model concerns the price discrimination across seating area. The theatrepolicy has been refined in the last years. In 2010 the OperaHouse offered 5 differentprice zones, 6 price zones in 2011 and 8 seating area from 2012 onwards (Figure 1).
Figure 1: Price zones at the Opera House
The subdivision is not physically evident: for example, zone “price A” includes both
90

stall seats and first balcony seats; whereas zones “price B” comprehend stall seats aswell as first and second balcony seats, and so forth. This allows the theatre managerto be quite flexible in the subdivision of the venue.Since the number of price zones changed through the period under examination, weaggregated productions with more than five price zones into five seat categories. Theprocedure adopted follows Baldin and Bille (2016), to which we refer for details.For logistic reason, it has not been possible to collect data for the choice modelestimation for the whole sample considered in the demand function. Our sampleconsists in 103322 bookings which involve 11 opera productions and 122 perfor-mances.
5.2 MNL estimation
After estimating the demand for each performance, in this section we propose achoice model for the seating area decision. To this aim, we adopt a multinomiallogit (MNL) approach. Hence, we assume that each customer chooses the seat thatmaximizes his utility. The independent variables that enter in the model as choice’sattributes are: price and a dummy variable for each seat category. These variablesaim to capture the tradeoff behavior between cheap seats with low visibility and/oracoustics and more expensive high quality seats. Moreover, in order to addressheterogeneity, we allow the price sensitivity and the marginal utility of the seatingareas to vary across customer categories. The price coefficient interacts also withvariables related to the performance characteristics.The utility of a customer that buys a ticket which refers to the seating area s, forthe performance i, can be formulated as:
Usj = Vsj + εsj (3)
with
Vsj = psj · (β1 + β2 · young + β3 · sub+ γ′z) + seats · (δ1 + δ2 · young + δ3 · sub) (4)
where young and sub are dummy variables denoting whether the customer is respec-tively a young customer or a subscriber. This implies that single ticket buyers aretreated as the base category. z is a vector of performance and production characteris-tics. In our estimation, such characteristics are represented by the dummy variablesSUNDAY and WEEKEND, already defined in the demand function. Moreover, we
91

used the number of times the production is performed worldwide during the sameyear, in order to define three dummy variables that denote the degree of popularityof the production: LowPopularity (for productions run less than 50 times world-wide) treated as base variable; MediumPopularity (for productions run between50 and 150 times worldwide) and HighPopularity (for productions run more than150 times worldwide). Finally seats is a dummy variable denoting whether the seatbelongs to area s or not.Assuming that the error components in (2) are independent and identically dis-tributed according to a Gumbel distribution, the probability of a customer belong-ing to category j purchasing a ticket of seating area s (among the 5 seating areas)is given by:
Pr(s | j) = exp[Vsj]∑5t=1 exp[Vtj]
(5)
Estimation results for the MNL model are displayed in Table 4.
Coefficient t-stat
Price -0.00129∗∗∗∗ −11.88Price-Young −0.0109∗∗∗∗ -26.32Price-Subscribers 0.00074∗∗∗∗ 3.87Price-Popularity Medium 0.00005 −1.03Price-Popularity high 0.00036∗∗∗∗ −1.93Price-Wkend 0.00004 0.91Price-Sunday 0.00023∗∗∗∗ 5.55
Seat 2 0.782∗∗∗∗ 28.93Seat 2 - Young 0.427∗∗∗∗ 7.09Seat 2 - Subscriber 1.51 22.84
Seat 3 1.37∗∗∗∗ 34.83Seat 3 - Young 0.474∗∗∗∗ 5.44Seat 3 - Subscriber 1.56∗∗∗∗ 18.78
Seat 4 1.87∗∗∗∗ 36.04Seat 4 - Young 1.12∗∗∗∗ 9.81Seat 4 - Subscriber 1.73∗∗∗∗ 16.92
Seat 5 1.95∗∗∗∗ 29.37Seat 5 - Young 1.56∗∗∗∗ 11.36Seat 5 - Subscriber 1.86∗∗∗∗ 14.58
No. of observations 103322ρ2 0.102Adjusted ρ2 0.102Null log-likelihood - 166290.344Final log-likelihood - 149291.813∗∗∗∗p < .001
Table 4: Estimation of multinomial logit model
As expected, young customers are highly price sensitive, followed by standard-ticketbuyers and subscribers. In addition, the price coefficient increases significantly when
92

we consider popular productions as well as, surprisingly, performances that takeplace on Sunday.With regard to the seat quality, the coefficients reflect an expected pattern: keepingthe price fixed, an increase of the quality of the seat leads to a greater utility. Thispattern holds for all the customer categories considered. Contrary to Baldin andBille (2016), we can not compare the marginal utility of the seat categories acrosscustomers categories because each category has its own price coefficient. However,in terms of willingness to pay (WTP), i.e the ratio between the coefficient of theattribute and the price coefficient, it results that this value is greater for subscribers,followed by standard-ticket buyers and young customers.
6 Optimization model
The optimization model we propose considers the two objectives of the theatre,i.e., to maximize revenue and attendance, in a constrained bi-objective maximiza-tion framework. It incorporates both the demand function and the customers’ seatchoices described in the previous section. The decision variables are the prices psj,for each seating area s and each customer category j. As these prices affect thedemand and the customers’ seat choice (as described by (formula...-.)), the optimalprices determine the optimal splitting into fare classes of the seats in the theatre.The expected revenue and attendance can be written as, respectively,
Revenue =3∑
j=1Dj(pj) ·
[ 5∑s=1
Pr(s | j) · psj
](6)
andAttendance =
3∑j=1
Dj(pj) ·[ 5∑
s=1Pr(s | j)
], (7)
where Dj is the number of tickets sold to category j, defined by the estimateddemand function (2); pj is the average price for a customer belonging to category j;Pr(s | j) is the probability of buying a ticket of seating area s, given the customercategory j, for the considered performance, as defined by (5). The maximum numberof seats that can be sold is bounded by the capacity of the theatre C:
3∑j=1
Dj(pj) ·[ 5∑
s=1Pr(s | j)
]≤ C . (8)
93
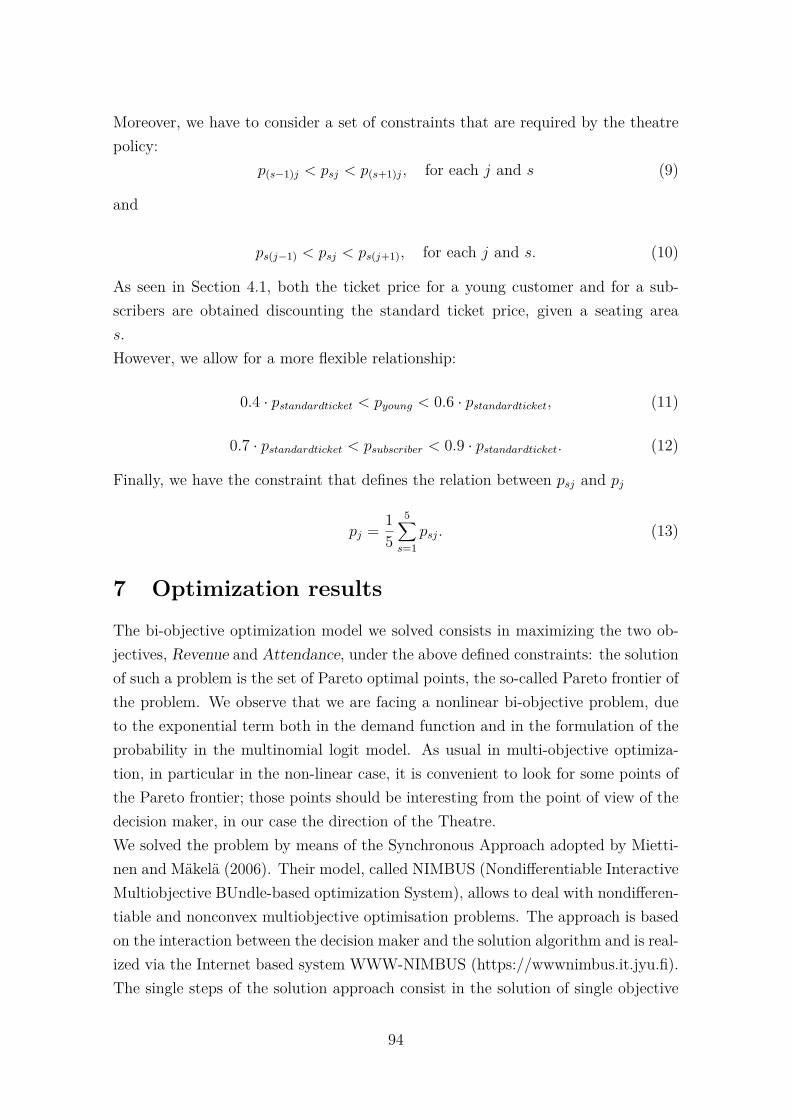
Moreover, we have to consider a set of constraints that are required by the theatrepolicy:
p(s−1)j < psj < p(s+1)j, for each j and s (9)
and
ps(j−1) < psj < ps(j+1), for each j and s. (10)
As seen in Section 4.1, both the ticket price for a young customer and for a sub-scribers are obtained discounting the standard ticket price, given a seating areas.However, we allow for a more flexible relationship:
0.4 · pstandardticket < pyoung < 0.6 · pstandardticket, (11)
0.7 · pstandardticket < psubscriber < 0.9 · pstandardticket. (12)
Finally, we have the constraint that defines the relation between psj and pj
pj = 15
5∑s=1
psj. (13)
7 Optimization results
The bi-objective optimization model we solved consists in maximizing the two ob-jectives, Revenue and Attendance, under the above defined constraints: the solutionof such a problem is the set of Pareto optimal points, the so-called Pareto frontier ofthe problem. We observe that we are facing a nonlinear bi-objective problem, dueto the exponential term both in the demand function and in the formulation of theprobability in the multinomial logit model. As usual in multi-objective optimiza-tion, in particular in the non-linear case, it is convenient to look for some points ofthe Pareto frontier; those points should be interesting from the point of view of thedecision maker, in our case the direction of the Theatre.We solved the problem by means of the Synchronous Approach adopted by Mietti-nen and Makela (2006). Their model, called NIMBUS (Nondifferentiable InteractiveMultiobjective BUndle-based optimization System), allows to deal with nondifferen-tiable and nonconvex multiobjective optimisation problems. The approach is basedon the interaction between the decision maker and the solution algorithm and is real-ized via the Internet based system WWW-NIMBUS (https://wwwnimbus.it.jyu.fi).The single steps of the solution approach consist in the solution of single objective
94

(sub)problems via classical subgradients methods (see, e.g., Clarke, 1983). Suc-cessive single optimisation subproblems are then solved under the guidance of thedecision maker: each successive solution is a Pareto optimal solution of the multi-objective problem. At each iteration the decision maker can indicate the preferredway to navigate the set of Pareto optimal solutions, choosing the objectives whichvalue should be improved and, at the same time, which objectives should pay thecost of such improvement. This way the most appropriate solutions from the deci-sion maker point of view are selected from the Pareto optimal solutions set. Thesoftware is free for the academic community and is operated directly on an Internetsite, requiring neither the download of any software nor huge computing capabilitiesof the client computer.As case studies we consider three performances that differ each other by charac-teristics that affect the demand, in order to verify how different levels of theateroccupancy require different pricing and allocation policies, in particular consideringthe peak-load pricing issue (i.e differentiating prices charged depending on peak andoff-peak periods). For purpose of better comparison between the actual pricing andallocation policies and those resulting from the optimization model, we have choosenthree performances that show a fitted value of the demand very close to the realdemand. The first performance is a high demand performance, namely a Saturdayevening performance of La Tosca that fills up to 91.05% capacity . The secondperformance analyzed is a low demand performance, Djævlene fra Loudun, run in aweekday: this performance fills less than half of the total capacity (41.98%). Thethird performance is a medium-popular production, namely Rusalka, with 67.86%of the total capacity filled.We are therefore able to compare the price4 and seat allocation results of the bi-objective optimization model with the actual results and those resulting from twosingle objective optimization models: one that maximizes only the Revenue and onethat maximizes only the total Attendance (see Tables 5-7).Some remarks about the implementation of the models: first, for a realistic com-parison with the actual data we have considered three performances whose fittedvalue of the demand is very close to the actual value. Second, for the purpose ofrealism we have imposed a lower and an upper bound to the 15 decision variables,equal respectively to the half and twice value of the actual price. Third, we subtractfrom the value of the capacity C the number of tickets sold to other categories notconsidered, which is considered as already known by the theatre manager.Table 5 considers the results obtained for a Saturday evening performance of La
4Price are expressed in Danish crown (DKK):1DKK ≈ 0.13e
95
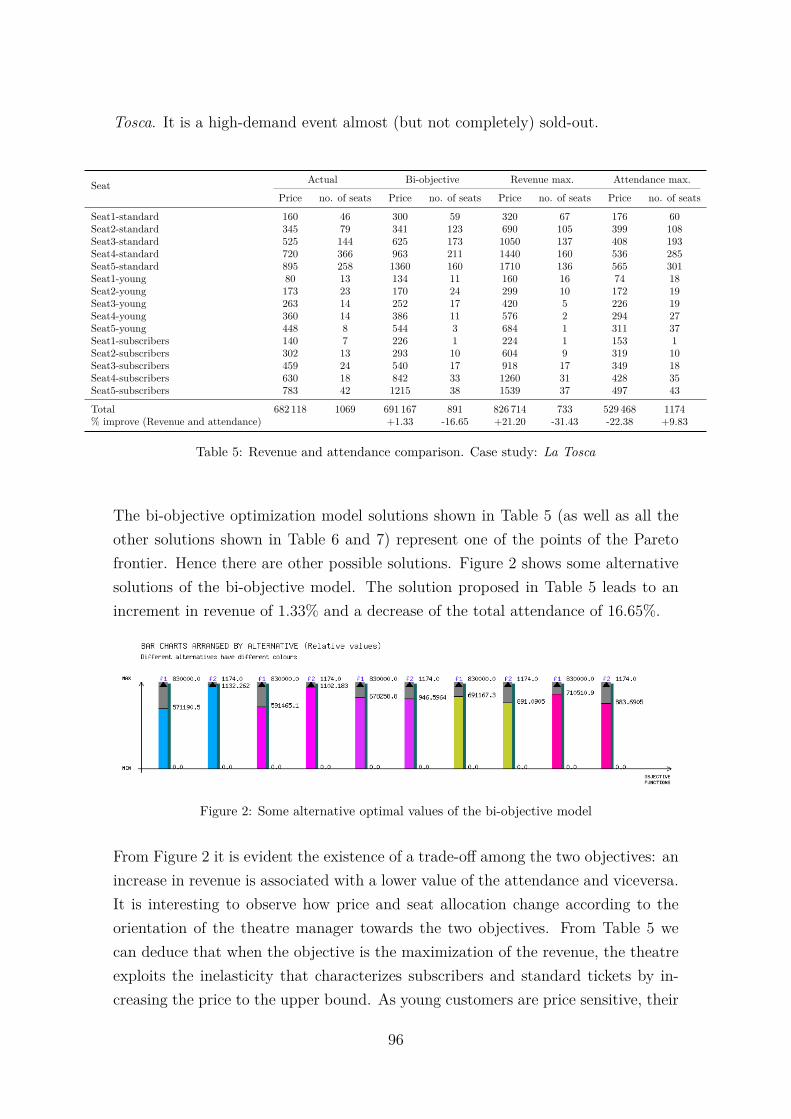
Tosca. It is a high-demand event almost (but not completely) sold-out.
Seat Actual Bi-objective Revenue max. Attendance max.
Price no. of seats Price no. of seats Price no. of seats Price no. of seats
Seat1-standard 160 46 300 59 320 67 176 60Seat2-standard 345 79 341 123 690 105 399 108Seat3-standard 525 144 625 173 1050 137 408 193Seat4-standard 720 366 963 211 1440 160 536 285Seat5-standard 895 258 1360 160 1710 136 565 301Seat1-young 80 13 134 11 160 16 74 18Seat2-young 173 23 170 24 299 10 172 19Seat3-young 263 14 252 17 420 5 226 19Seat4-young 360 14 386 11 576 2 294 27Seat5-young 448 8 544 3 684 1 311 37Seat1-subscribers 140 7 226 1 224 1 153 1Seat2-subscribers 302 13 293 10 604 9 319 10Seat3-subscribers 459 24 540 17 918 17 349 18Seat4-subscribers 630 18 842 33 1260 31 428 35Seat5-subscribers 783 42 1215 38 1539 37 497 43
Total 682 118 1069 691 167 891 826 714 733 529 468 1174% improve (Revenue and attendance) +1.33 -16.65 +21.20 -31.43 -22.38 +9.83
Table 5: Revenue and attendance comparison. Case study: La Tosca
The bi-objective optimization model solutions shown in Table 5 (as well as all theother solutions shown in Table 6 and 7) represent one of the points of the Paretofrontier. Hence there are other possible solutions. Figure 2 shows some alternativesolutions of the bi-objective model. The solution proposed in Table 5 leads to anincrement in revenue of 1.33% and a decrease of the total attendance of 16.65%.
Figure 2: Some alternative optimal values of the bi-objective model
From Figure 2 it is evident the existence of a trade-off among the two objectives: anincrease in revenue is associated with a lower value of the attendance and viceversa.It is interesting to observe how price and seat allocation change according to theorientation of the theatre manager towards the two objectives. From Table 5 wecan deduce that when the objective is the maximization of the revenue, the theatreexploits the inelasticity that characterizes subscribers and standard tickets by in-creasing the price to the upper bound. As young customers are price sensitive, their
96

price increases until the loss of young customers is not balanced by a higher revenueper seat. In the attendance maximization perspective, since the performance almostreaches the capacity constraint, the objective is achieved by lowering only the pricesof the most expensive seat category.In relation to the allocation policy, we notice that when the theater is “attendancemaximizer” customers are more likely to shift to a higher seat quality (buy-up be-haviour) as a consequence of a generalized price reduction. Viceversa, if the theateris “revenue maximizer” customers are more likely to buy a ticket for a cheap seatbecause they are not willing to pay more. This behaviour is evident when we referto price sensitive customers. On the contrary, price insensitive customers are not in-fluenced by the theatre policy in their choice of the seating area, which is confirmedin Figures 3 and 4 - respectively for young customers and subscriptions - showinghow the probability of buying a ticket of certain seating area changes according tothe theatre policy. Thus, the optimal pricing and allocation policy depends on thetype of customers the theatre is expected to accomodate.
Figure 3: Young customers’ choice probabilities
Table 6 considers the results obtained for a weekday performance of Djævlene fraLoudun. It is a low-demand event in which the theater is usually occupied approx-imately only a little bit more than a third of its capacity. One solution obtainedsolving the bi-objective model allows an increase in attendance of 13.26% and adecrease in revenue of 12.25%. Compared to the previous case, here the theater isforced to reduce prices to the lower bound when it aims to maximize attendance.Concerning the allocation policy, the pattern previously described is even more ev-ident as the price coefficient of the MNL model decreases when a no popular eventis considered. Hence, if the theatre is attendance (revenue) maximizer, it is sug-gested to increase(decrease) the size of the most expensive (cheapest) seating area,especially when it is expected to attract a price-insensitive audience group (as yung
97

Figure 4: Subscribers’ choice probabilities
Seat Actual Bi-objective Revenue max. Attendance max.
Price no. of seats Price no. of seats Price no. of seats Price no. of seats
Seat1-standard 160 41 110 12 320 8 80 13Seat2-standard 295 23 216 24 590 20 148 26Seat3-standard 425 29 366 36 850 26 213 44Seat4-standard 545 50 505 50 1090 31 307 66Seat5-standard 695 42 560 50 1352 24 348 69Seat1-young 80 16 47 9 160 6 40 9Seat2-young 148 11 91 17 277 4 74 21Seat3-young 213 1 148 16 340 4 107 26Seat4-young 273 9 202 27 436 4 137 58Seat5-young 348 3 226 33 541 2 174 62Seat1-subscribers 140 3 79 2 224 3 70 2Seat2-subscribers 258 11 162 23 516 23 129 22Seat3-subscribers 372 13 287 41 744 38 186 41Seat4-subscribers 551 86 443 74 981 67 276 79Seat5-subscribers 608 107 503 88 1216 72 304 97
Total 209 268 445 183 420 504 302 384 331 144 313 637% improve (Revenue and attendance) -12.35 +13.26 +44.50 -25.61 -31.04 +43.15
Table 6: Revenue and attendance comparison. Case study: Djævlene fra Loudun
customers).Table 7 considers the results obtained for a Sunday performance of Rusalka. Thisis an intermediate case compared to the previous two. This case is interesting asthe bi-optimization model provides a solution that dominates the current value ofthe objectives. Indeed, the solution proposed allows an increase in revenue of 1.90%and, at the same time, an increase in attendance of 1.83%.
8 Conclusions
This paper has proposed a model that simultaneously optimizes the pricing andseating-allocation policy of a theater. In particular, we present a bi-objective opti-mization model that integrates the demand forecast and a choice model, where the
98

Seat Actual Bi-objective Revenue max. Attendance max.
Price no. of seats Price no. of seats Price no. of seats Price no. of seats
Seat1-standard 160 43 172 35 320 40 84 39Seat2-standard 345 70 292 68 692 59 204 75Seat3-standard 525 72 619 88 1052 74 315 120Seat4-standard 720 150 740 129 1440 83 408 181Seat5-standard 895 109 782 134 1743 66 483 182Seat1-young 80 6 79 8 160 7 45 9Seat2-young 173 18 127 15 301 4 92 17Seat3-young 263 7 249 6 423 2 183 11Seat4-young 360 8 296 12 580 1 184 35Seat5-young 448 2 420 4 702 0 224 36Seat1-subscribers 140 19 149 5 224 5 71 5Seat2-subscribers 302 27 259 44 622 43 151 45Seat3-subscribers 459 35 542 76 920 74 266 82Seat4-subscribers 630 163 639 146 1260 134 322 160Seat5-subscribers 783 175 703 177 1568 152 397 194
Total 550 190 929 560 664 946 874 000 745 394 026 1191% improve (Revenue and attendance) +1.90 +1.83 +58.85 -19.91 -28.38 +28.20
Table 7: Revenue and attendance comparison. Case study: Rusalka
customer chooses one among different seating areas which differ each other in priceand quality. The multi-objective nature of our model reflects the multi-dimensionalnature of nonprofit performing arts organizations. In our case, the objectives weassume to be maximized are revenue and attendance. The approach adopted allowsalso to take into account heterogeneity in price sensitivity and choice behaviouracross different customer categories. The proposed model is applied to bookingdata provided by the Royal Danish Theater referring to the period 2010-2015. Moreprecisely we consider three different performances in order to explore the potential-ities of the model.From a management perspective, the model can provide to theatre managers in-sightful policy implications in terms of demand-management decision. The resultsobtained confirm the existence of a trade-off between the two theater objectives.When the theater is revenue maximizer, prices charged to price insensitive cus-tomers are raised, and the cheapest seating area is enlarged to prevent a loss ofrevenue. Viceversa, when the theater is audience maximizer, prices are set at lowerlevel, in particular the ones associated to the most expensive seating area. As aconsequence, it is recommended to increase the number of seats allocated to themost expensive area, in order to encourage a shift of consumer choices to higherquality seats. The allocation policy just described is particularly effective when aperformance is expected to attract customers with an elastic demand, since thesecustomers are more sensitive to price changes in their seat choice; and also when theperformance will probably not attract a large audience. Moreover, in one case thebi-objective model provides a solution that gives an improvement in both revenue
99

and attendance from the current situation.Overall, our examples clarify that both price and capacity allocation are leverageswith which a theatre can calibrate its objectives, even when revenue is not consideredas the main goal to pursue.
100

References
• Ainslie, A., Dreze, X., Zufryden, F. (2005). Modeling movie lifecycles andmarket share. Marketing Science, 24, 508-517.
• Andrews, R. L., Currim, I. S., Leeflang, P., Lim, J. (2008). Estimating theScan Pro model of store sales: HB, FM or just OLS? International Journal ofResearch in Marketing, 25, 22-33.
• Baldin, A., Bille, T. (2016). Modelling preference heterogeneity for theatertickets: a discrete choice modelling approach on Royal Danish Theater bookingdata., Paper presented at the 19th International Conference on CUltural Eco-nomics (ACEI 2016), Valladolid (Spain).
• Baumol, W. J., Bowen, W.G. (1966). Performing Arts: The EconomicsDilemma, Twentieth Century Fund, New York.
• Bille Hansen, T. (1991). Det Kgl. Teater - et kulturøkonomisk studie, AKFForlaget, Copenhagen.
• Brooks, A.C. (2006). Nonprofit firms in the performing arts, Handbook of theEconomics of Art and Culture, 1, 473-506.
• Clarke, F.H. (1983). Optimization and nonsmooth analysis, Wiley, New York.
• Corning, J., Levy, A. (2002). Demand for live theater with market segmentationand seasonality. Journal of Cultural Economics, 26, 217-235.
• Eliashberg, J., Hegie, Q.,Ho, J., Huisman, D., Miller, S. J., Swami, S.,Weinberg, C.B., Wierenga, B. (2009). Demand-driven scheduling of moviesin a multiplex. International Journal of Research in Marketing, 26, 75-88.
• Felton, M.V. (1994). Evidence of the existence of the cost disease in the per-forming arts. Journal of Cultural Economics, 18, 301-312.
• Gapinski, J.H. (1985). Do the nonprofit performing arts optimize? The moralform Shakespeare, Quarterly Review of Economics and Business, 25, 27-37.
• Hansmann, H. (1980): The role of nonprofit enterprise, Yale Law Journal,89,835-898
• Hansmann, H. (1981). Nonprofit enterprise in the performing arts.The Bell Jour-nal of Economics, 341-361.
101

• Hetrakul, P., Cirillo, C. (2014). A latent class choice based model systemfor railway optimal pricing and seat allocation. Transportation Research Part E:Logistics and Transportation Review, 61, 68-83.
• Huntington, P. A. (1993). Ticket pricing policy and box office revenue Journalof Cultural Economics, 17, 71-87.
• Laamanen, J.P. (2013). Estimating demand for opera using sales system data:the case of Finnish National Opera. Journal of Cultural Economics 37, 417-432.
• Leslie, P. (2004). Price discrimination in Broadway theater. RAND Journal ofEconomics, 520-541.
• Luksetich, W.A., Lange, W.A. (1995). A simultaneous model of nonprofitsymphony, Journal of Cultural Economcs, 19, 49-68
• Marco-Serrano, F. (2006). Monitoring managerial efficiency in the performingarts: A regional theatres network perspective. Annals of Operations Research,145, 167-181.
• Miettinen, K., Makela, M.M. (2006). Synchronous Approach in InteractiveMultiobjective Optimization. European Journal of Operational Research,170, 909-922
• Rosen, S. (1974). Hedonic prices and implicit markets: product differentiationin pure competition. The journal of political economy 82, 34-55.
• Rosen, S., Rosenfield, A. M. (1997). Ticket Pricing 1 The Journal of Law andEconomics. 40, 351-376.
• Seaman, B. A. (1985). Price discrimination in the arts. Managerial Economicsfor the Arts. Association for Cultural Economics, University of Akron, 47-60.
• Seaman, B. A. (2006). Empirical studies of demand for the performing arts.Handbook of the economics of art and culture, 1, 415-472.
• Steinberg, R. (1986). The revealed objective functions of nonprofit firms, RandJournal of Economics,17, 508-526.
• Talluri, K., Van Ryzin, G. (2004). Revenue management under a general dis-crete choice model of consumer behavior. Management Science, 50(1), 15-33.
102

• Tereyagoglu, N., Fader, P., Veeraraghavan, S. (2012). Filling seats at atheater: Estimating the impact of posted prices and dynamic discounts Workingpaper, University of Pennsylvania, Philadelphia.
• Throsby, D. (1994). The production and consumption of the arts: A view ofcultural economics, Journal of Economics Literature, 32, 1-29
• Throsby, D., Withers, G.A. (1979). The Economics of the Performing Arts,St. Martin’s Press, New York.
103