Three-dimensional nonlinear finite element analysis of ...The damaged plasticity model for concrete...
14
Three-dimensional nonlinear finite element analysis of concrete deep beam reinforced with GFRP bars Ibrahim M. Metwally Concrete Structures Research Inst., Housing & Building Research Centre, P.O. Box 1770, Cairo, Egypt Received 20 June 2014; revised 2 November 2014; accepted 19 February 2015 KEYWORDS Deep beam; GFRP bars; Finite element; ABAQUS Abstract The efficient use of FRP reinforcement in deep members has been hindered due to a lack of knowledge on the behavior of such members. Till now, most of researches have mainly focused on the flexural or shear behavior of shallow members longitudinally reinforced with FRP and most of them used testing at small scales. This paper presents numerical investigation of twelve large- scale concrete deep beams internally reinforced with GFRP bars without web reinforcement failed in shear which were experimentally tested and collected from literature. The collected specimens cover several parameters which usually influenced strength and behavior of deep beams as shear span/depth ratio, the reinforcement ratio, the effective depth, and the concrete strength. Concrete deep beams are generally analyzed using conventional methods such as empirical equa- tions or strut and tie models. These methods however do not take into account the redistribution of forces resulting from non-linear materials’ behaviors. To address this issue, non-linear finite ele- ment analysis that incorporates non-linear material behavior as ABAQUS package is used. It was found efficient in handling such analysis; the proposed simulation of the material in the present study is capable of predicting the real behavior of reinforced concrete deep beam reinforced with GFRP bars in terms of load–deflection behavior, failure load, failure mode, crack propagation, GFRP reinforcement strain, and concrete strain distribution, similar to the tested large scale deep beams. ª 2015 Production and hosting by Elsevier B.V. on behalf of Housing and Building National Research Center. This is an open access article under the CC BY-NC-ND license (http://creativecommons.org/licenses/ by-nc-nd/4.0/). Introduction Corrosion of steel reinforcement in concrete structures leads to cracking and spalling of concrete, resulting in costly mainte- nance and repair. An innovative solution to such a problem can be provided by using fiber-reinforced polymer (FRP) as an alternative to steel reinforcement. FRPs are corrosion-free materials and have recently shown a great potential for use in structural applications because of their high strength-to- weight ratio. Therefore, replacing the steel reinforcement with E-mail address: [email protected] Peer review under responsibility of Housing and Building National Research Center. Production and hosting by Elsevier HBRC Journal (2015) xxx, xxx–xxx Housing and Building National Research Center HBRC Journal http://ees.elsevier.com/hbrcj http://dx.doi.org/10.1016/j.hbrcj.2015.02.006 1687-4048 ª 2015 Production and hosting by Elsevier B.V. on behalf of Housing and Building National Research Center. This is an open access article under the CC BY-NC-ND license (http://creativecommons.org/licenses/by-nc-nd/4.0/). Please cite this article in press as: I.M. Metwally, Three-dimensional nonlinear finite element analysis of concrete deep beam reinforced with GFRP bars, HBRC Journal (2015), http://dx.doi.org/10.1016/j.hbrcj.2015.02.006
Transcript of Three-dimensional nonlinear finite element analysis of ...The damaged plasticity model for concrete...
HBRC Journal (2015) xxx, xxx–xxx
Housing and Building National Research Center
HBRC Journal
http://ees.elsevier.com/hbrcj
Three-dimensional nonlinear finite element analysis
of concrete deep beam reinforced with GFRP bars
E-mail address: [email protected]
Peer review under responsibility of Housing and Building National
Research Center.
Production and hosting by Elsevier
http://dx.doi.org/10.1016/j.hbrcj.2015.02.0061687-4048 ª 2015 Production and hosting by Elsevier B.V. on behalf of Housing and Building National Research Center.This is an open access article under the CC BY-NC-ND license (http://creativecommons.org/licenses/by-nc-nd/4.0/).
Please cite this article in press as: I.M. Metwally, Three-dimensional nonlinear finite element analysis of concrete deep beam reinforced with GFRP bars,Journal (2015), http://dx.doi.org/10.1016/j.hbrcj.2015.02.006
Ibrahim M. Metwally
Concrete Structures Research Inst., Housing & Building Research Centre, P.O. Box 1770, Cairo, Egypt
Received 20 June 2014; revised 2 November 2014; accepted 19 February 2015
KEYWORDS
Deep beam;
GFRP bars;
Finite element;
ABAQUS
Abstract The efficient use of FRP reinforcement in deep members has been hindered due to a lack
of knowledge on the behavior of such members. Till now, most of researches have mainly focused
on the flexural or shear behavior of shallow members longitudinally reinforced with FRP and most
of them used testing at small scales. This paper presents numerical investigation of twelve large-
scale concrete deep beams internally reinforced with GFRP bars without web reinforcement failed
in shear which were experimentally tested and collected from literature. The collected specimens
cover several parameters which usually influenced strength and behavior of deep beams as shear
span/depth ratio, the reinforcement ratio, the effective depth, and the concrete strength.
Concrete deep beams are generally analyzed using conventional methods such as empirical equa-
tions or strut and tie models. These methods however do not take into account the redistribution
of forces resulting from non-linear materials’ behaviors. To address this issue, non-linear finite ele-
ment analysis that incorporates non-linear material behavior as ABAQUS package is used. It was
found efficient in handling such analysis; the proposed simulation of the material in the present
study is capable of predicting the real behavior of reinforced concrete deep beam reinforced with
GFRP bars in terms of load–deflection behavior, failure load, failure mode, crack propagation,
GFRP reinforcement strain, and concrete strain distribution, similar to the tested large scale deep
beams.ª 2015 Production and hosting by Elsevier B.V. on behalf of Housing and Building National Research
Center. This is an open access article under theCCBY-NC-ND license (http://creativecommons.org/licenses/
by-nc-nd/4.0/).
Introduction
Corrosion of steel reinforcement in concrete structures leads tocracking and spalling of concrete, resulting in costly mainte-nance and repair. An innovative solution to such a problemcan be provided by using fiber-reinforced polymer (FRP) as
an alternative to steel reinforcement. FRPs are corrosion-freematerials and have recently shown a great potential for usein structural applications because of their high strength-to-
weight ratio. Therefore, replacing the steel reinforcement with
HBRC
2 I.M. Metwally
the non-corrosive FRP reinforcement eliminates the potentialof corrosion and the associated deterioration. Extensiveresearch programs have been conducted to investigate the
flexural and shear behavior of slender (shallow) concrete mem-bers reinforced with FRP reinforcement [1]. Very little experi-mental data and nearly no finite element analysis exist for
FRP-reinforced concrete deep beams. So, shear behavior ofthem has not been sufficiently understood.
The shear capacity of deep beams is a major issue in their
design. The behavior of reinforced concrete deep beams is dif-ferent from that of slender beams because of their relativelylarger magnitude of shearing and normal stresses. Unlike slen-der beams, deep beams transfer shear forces to supports
through compressive stresses rather than shear stresses.There are two kinds of cracks that typically develop in deepbeams: flexural cracks and diagonal cracks. Diagonal cracks
eliminate the inclined principal tensile stresses required forbeam action and lead to a redistribution of internal stressesso that the beam acts as a tied arch. The arch action is a func-
tion of a/d (shear span/depth) and the concrete compressivestrength, in addition to the properties of the longitudinalreinforcement. It is expected that the arch action in FRP rein-
forced concrete would be as significant as that in steel rein-forced concrete and that the shear strength of FRP-reinforced concrete beams having a/d less than 2.5 would behigher than that of beams having a/d of more than 2.5 [2].
The application of the reinforced concrete deep beams withinstructural engineering practice has risen substantially overthe last few decades. More specially, there has been an
increased practice of including deep beams in the design of tallbuildings, offshore structures, wall tanks and foundations.They differ from shallow beams in that they have a relatively
larger depth compared to the span length. As a result the straindistribution across the depth is non-linear and cannot bedescribed in terms of uni-axial stress strain characteristics [3].
Prediction of behavior of deep beams by design codes whichcontain empirical equations derived from experimental testshas some limitations. They are only suitable for the tests con-ditions they were derived from, and most importantly, they fail
to provide information on serviceability requirements such asstructural deformations and cracking. Likewise, the strut andtie model, although based on equilibrium solutions thus pro-
viding a safe design, does not take into account the non-linearmaterial behavior and hence also fails to provide informationon serviceability requirements. Cracking of concrete and
yielding of steel are essential features of the behavior of
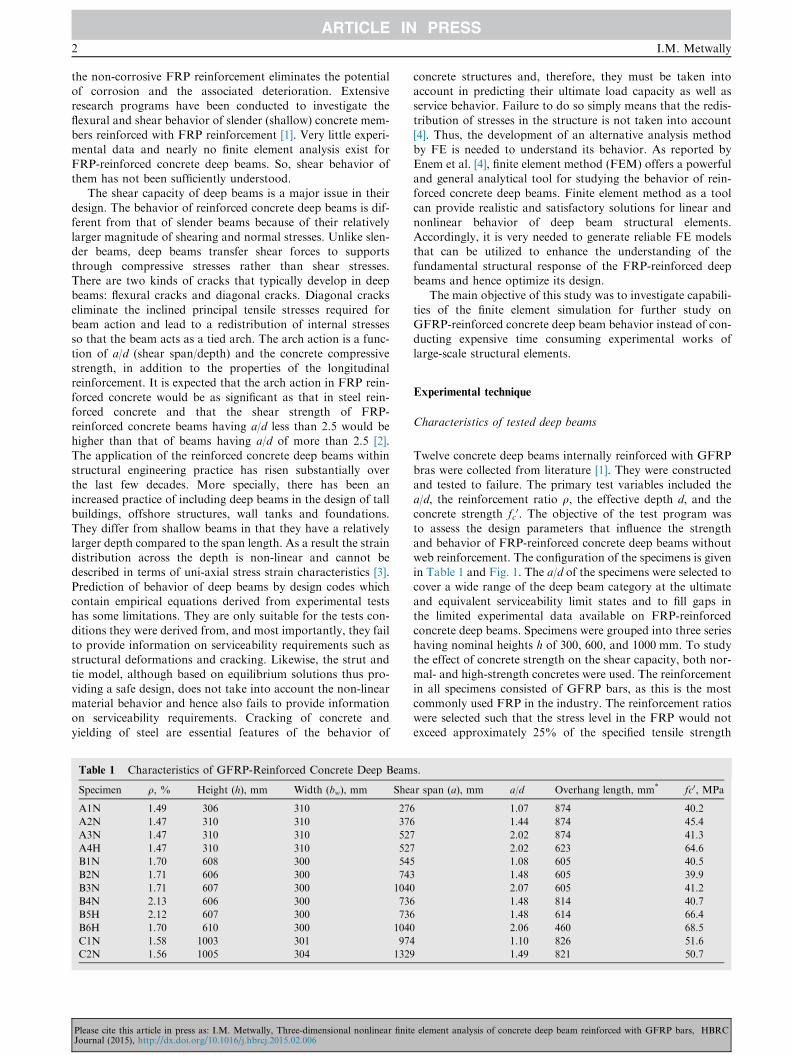
Table 1 Characteristics of GFRP-Reinforced Concrete Deep Beam
Specimen q, % Height (h), mm Width (bw), mm She
A1N 1.49 306 310 276
A2N 1.47 310 310 376
A3N 1.47 310 310 527
A4H 1.47 310 310 527
B1N 1.70 608 300 545
B2N 1.71 606 300 743
B3N 1.71 607 300 1040
B4N 2.13 606 300 736
B5H 2.12 607 300 736
B6H 1.70 610 300 1040
C1N 1.58 1003 301 974
C2N 1.56 1005 304 1329
Please cite this article in press as: I.M. Metwally, Three-dimensional nonlinear finitJournal (2015), http://dx.doi.org/10.1016/j.hbrcj.2015.02.006
concrete structures and, therefore, they must be taken intoaccount in predicting their ultimate load capacity as well asservice behavior. Failure to do so simply means that the redis-
tribution of stresses in the structure is not taken into account[4]. Thus, the development of an alternative analysis methodby FE is needed to understand its behavior. As reported by
Enem et al. [4], finite element method (FEM) offers a powerfuland general analytical tool for studying the behavior of rein-forced concrete deep beams. Finite element method as a tool
can provide realistic and satisfactory solutions for linear andnonlinear behavior of deep beam structural elements.Accordingly, it is very needed to generate reliable FE modelsthat can be utilized to enhance the understanding of the
fundamental structural response of the FRP-reinforced deepbeams and hence optimize its design.
The main objective of this study was to investigate capabili-
ties of the finite element simulation for further study onGFRP-reinforced concrete deep beam behavior instead of con-ducting expensive time consuming experimental works of
large-scale structural elements.
Experimental technique
Characteristics of tested deep beams
Twelve concrete deep beams internally reinforced with GFRPbras were collected from literature [1]. They were constructedand tested to failure. The primary test variables included the
a/d, the reinforcement ratio q, the effective depth d, and theconcrete strength fc
0. The objective of the test program wasto assess the design parameters that influence the strengthand behavior of FRP-reinforced concrete deep beams without
web reinforcement. The configuration of the specimens is givenin Table 1 and Fig. 1. The a/d of the specimens were selected tocover a wide range of the deep beam category at the ultimate
and equivalent serviceability limit states and to fill gaps inthe limited experimental data available on FRP-reinforcedconcrete deep beams. Specimens were grouped into three series
having nominal heights h of 300, 600, and 1000 mm. To studythe effect of concrete strength on the shear capacity, both nor-mal- and high-strength concretes were used. The reinforcementin all specimens consisted of GFRP bars, as this is the most
commonly used FRP in the industry. The reinforcement ratioswere selected such that the stress level in the FRP would notexceed approximately 25% of the specified tensile strength
s.
ar span (a), mm a/d Overhang length, mm* fc0, MPa
1.07 874 40.2
1.44 874 45.4
2.02 874 41.3
2.02 623 64.6
1.08 605 40.5
1.48 605 39.9
2.07 605 41.2
1.48 814 40.7
1.48 614 66.4
2.06 460 68.5
1.10 826 51.6
1.49 821 50.7
e element analysis of concrete deep beam reinforced with GFRP bars, HBRC
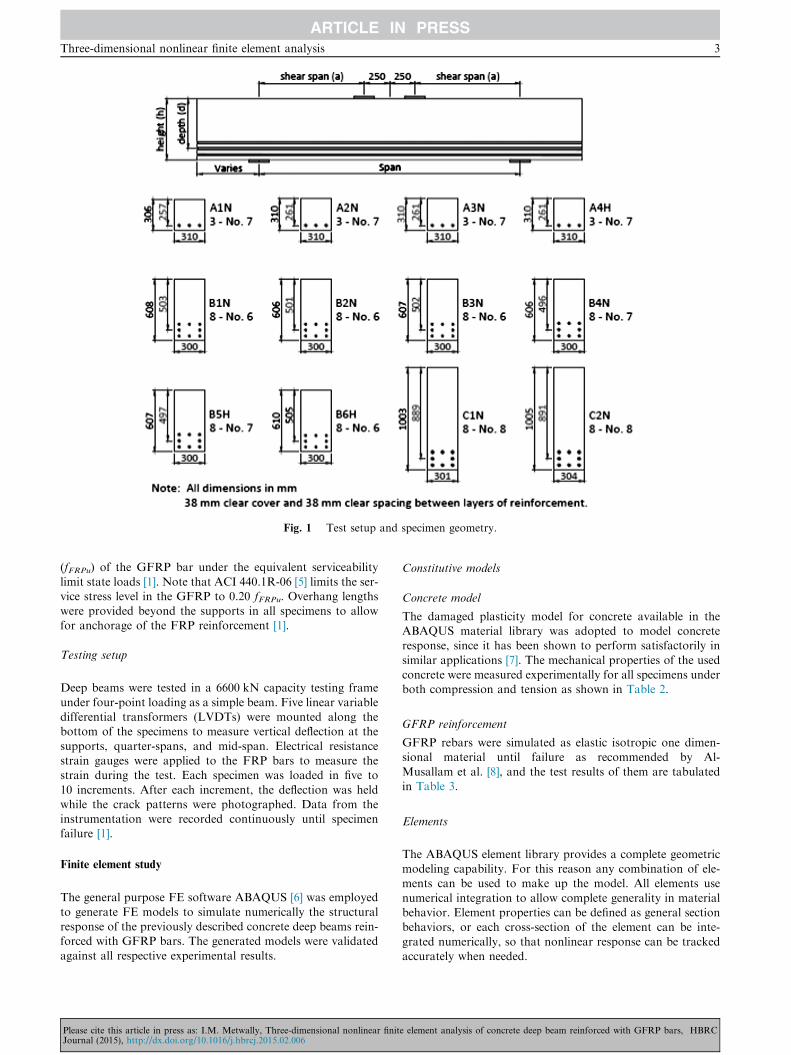
Fig. 1 Test setup and specimen geometry.
Three-dimensional nonlinear finite element analysis 3
(fFRPu) of the GFRP bar under the equivalent serviceability
limit state loads [1]. Note that ACI 440.1R-06 [5] limits the ser-vice stress level in the GFRP to 0.20 fFRPu. Overhang lengthswere provided beyond the supports in all specimens to allowfor anchorage of the FRP reinforcement [1].
Testing setup
Deep beams were tested in a 6600 kN capacity testing frame
under four-point loading as a simple beam. Five linear variabledifferential transformers (LVDTs) were mounted along thebottom of the specimens to measure vertical deflection at the
supports, quarter-spans, and mid-span. Electrical resistancestrain gauges were applied to the FRP bars to measure thestrain during the test. Each specimen was loaded in five to
10 increments. After each increment, the deflection was heldwhile the crack patterns were photographed. Data from theinstrumentation were recorded continuously until specimenfailure [1].
Finite element study
The general purpose FE software ABAQUS [6] was employed
to generate FE models to simulate numerically the structuralresponse of the previously described concrete deep beams rein-forced with GFRP bars. The generated models were validated
against all respective experimental results.
Please cite this article in press as: I.M. Metwally, Three-dimensional nonlinear finitJournal (2015), http://dx.doi.org/10.1016/j.hbrcj.2015.02.006
Constitutive models
Concrete model
The damaged plasticity model for concrete available in theABAQUS material library was adopted to model concreteresponse, since it has been shown to perform satisfactorily in
similar applications [7]. The mechanical properties of the usedconcrete were measured experimentally for all specimens underboth compression and tension as shown in Table 2.
GFRP reinforcement
GFRP rebars were simulated as elastic isotropic one dimen-sional material until failure as recommended by Al-
Musallam et al. [8], and the test results of them are tabulatedin Table 3.
Elements
The ABAQUS element library provides a complete geometricmodeling capability. For this reason any combination of ele-ments can be used to make up the model. All elements use
numerical integration to allow complete generality in materialbehavior. Element properties can be defined as general sectionbehaviors, or each cross-section of the element can be inte-
grated numerically, so that nonlinear response can be trackedaccurately when needed.
e element analysis of concrete deep beam reinforced with GFRP bars, HBRC
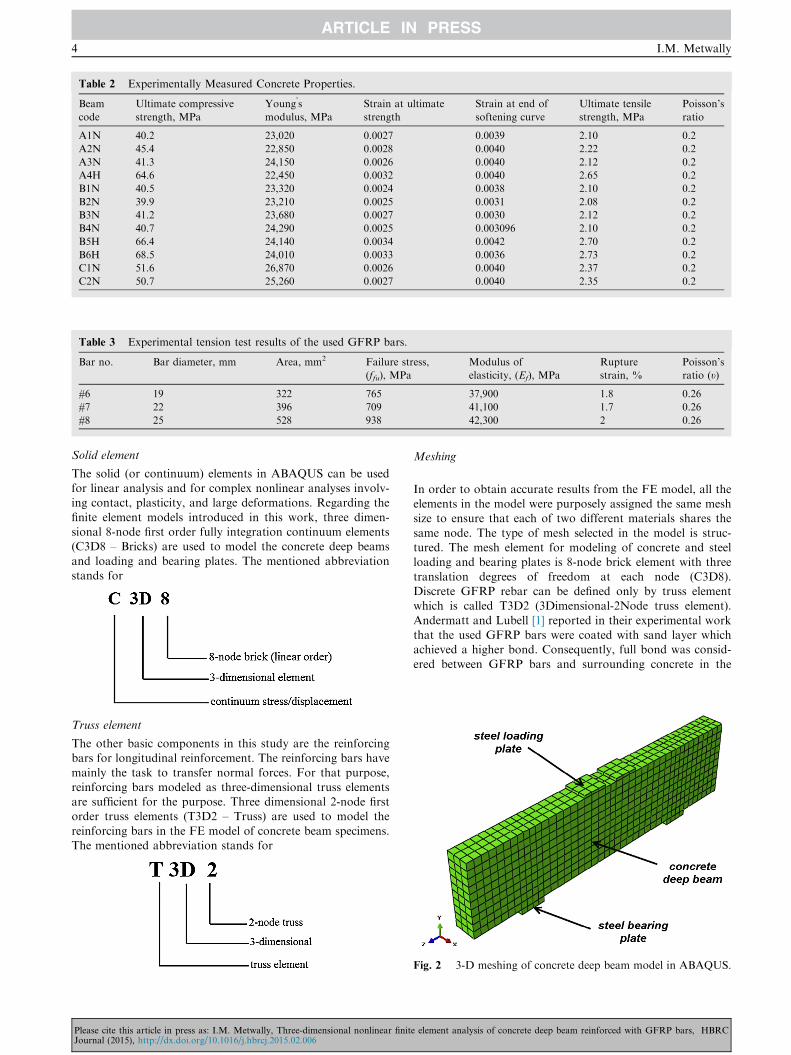
Table 2 Experimentally Measured Concrete Properties.
Beam
code
Ultimate compressive
strength, MPa
Young’s
modulus, MPa
Strain at ultimate
strength
Strain at end of
softening curve
Ultimate tensile
strength, MPa
Poisson’s
ratio
A1N 40.2 23,020 0.0027 0.0039 2.10 0.2
A2N 45.4 22,850 0.0028 0.0040 2.22 0.2
A3N 41.3 24,150 0.0026 0.0040 2.12 0.2
A4H 64.6 22,450 0.0032 0.0040 2.65 0.2
B1N 40.5 23,320 0.0024 0.0038 2.10 0.2
B2N 39.9 23,210 0.0025 0.0031 2.08 0.2
B3N 41.2 23,680 0.0027 0.0030 2.12 0.2
B4N 40.7 24,290 0.0025 0.003096 2.10 0.2
B5H 66.4 24,140 0.0034 0.0042 2.70 0.2
B6H 68.5 24,010 0.0033 0.0036 2.73 0.2
C1N 51.6 26,870 0.0026 0.0040 2.37 0.2
C2N 50.7 25,260 0.0027 0.0040 2.35 0.2
Table 3 Experimental tension test results of the used GFRP bars.
Bar no. Bar diameter, mm Area, mm2 Failure stress,
(ffu), MPa
Modulus of
elasticity, (Ef), MPa
Rupture
strain, %
Poisson’s
ratio (t)
#6 19 322 765 37,900 1.8 0.26
#7 22 396 709 41,100 1.7 0.26
#8 25 528 938 42,300 2 0.26
4 I.M. Metwally
Solid element
The solid (or continuum) elements in ABAQUS can be usedfor linear analysis and for complex nonlinear analyses involv-ing contact, plasticity, and large deformations. Regarding the
finite element models introduced in this work, three dimen-sional 8-node first order fully integration continuum elements(C3D8 – Bricks) are used to model the concrete deep beams
and loading and bearing plates. The mentioned abbreviationstands for
Fig. 2 3-D meshing of concrete deep beam model in ABAQUS.
Truss element
The other basic components in this study are the reinforcingbars for longitudinal reinforcement. The reinforcing bars have
mainly the task to transfer normal forces. For that purpose,reinforcing bars modeled as three-dimensional truss elementsare sufficient for the purpose. Three dimensional 2-node firstorder truss elements (T3D2 – Truss) are used to model the
reinforcing bars in the FE model of concrete beam specimens.The mentioned abbreviation stands for
Please cite this article in press as: I.M. Metwally, Three-dimensional nonlinear finitJournal (2015), http://dx.doi.org/10.1016/j.hbrcj.2015.02.006
Meshing
In order to obtain accurate results from the FE model, all theelements in the model were purposely assigned the same meshsize to ensure that each of two different materials shares the
same node. The type of mesh selected in the model is struc-tured. The mesh element for modeling of concrete and steelloading and bearing plates is 8-node brick element with three
translation degrees of freedom at each node (C3D8).Discrete GFRP rebar can be defined only by truss elementwhich is called T3D2 (3Dimensional-2Node truss element).
Andermatt and Lubell [1] reported in their experimental workthat the used GFRP bars were coated with sand layer whichachieved a higher bond. Consequently, full bond was consid-
ered between GFRP bars and surrounding concrete in the
e element analysis of concrete deep beam reinforced with GFRP bars, HBRC
Three-dimensional nonlinear finite element analysis 5
FE model. Fig. 2 shows the typical mesh of the FE model ofdeep beam specimens. Modeling and mesh generation aredeveloped using same techniques for all specimens.
Numerical analysis: verification of FE model
Load–deflection responses
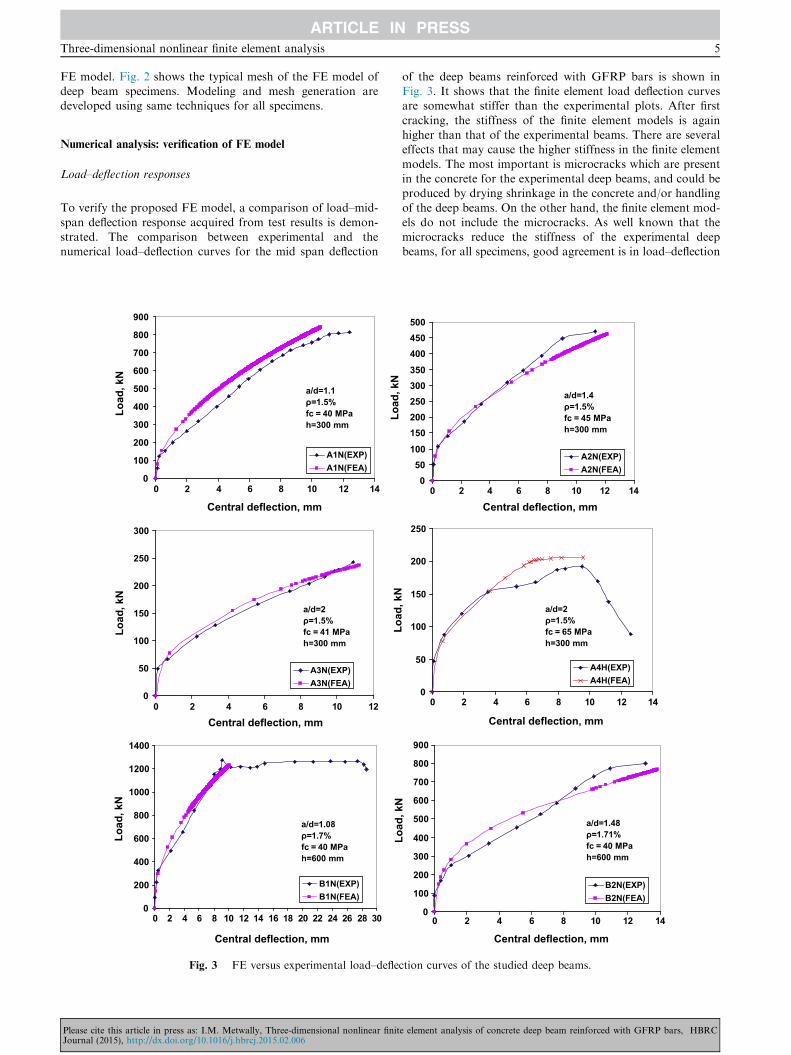
To verify the proposed FE model, a comparison of load–mid-
span deflection response acquired from test results is demon-strated. The comparison between experimental and thenumerical load–deflection curves for the mid span deflection
0
100
200
300
400
500
600
700
800
900
0 2 4 6 8 10 12 14
Central deflection, mm
Load
, kN
A1N(EXP)A1N(FEA)
a/d=1.1ρ=1.5%fc = 40 MPah=300 mm
Load
, kN
0
50
100
150
200
250
300
0 2 4 6 8 10 12
Central deflection, mm
Load
, kN
A3N(EXP)A3N(FEA)
a/d=2ρ=1.5%fc = 41 MPah=300 mm
0
200
400
600
800
1000
1200
1400
0 2 4 6 8 10 12 14 16 18 20 22 24 26 28 30
Central deflection, mm
Load
, kN
B1N(EXP)B1N(FEA)
a/d=1.08ρ=1.7%fc = 40 MPah=600 mm
Fig. 3 FE versus experimental load–deflec
Please cite this article in press as: I.M. Metwally, Three-dimensional nonlinear finitJournal (2015), http://dx.doi.org/10.1016/j.hbrcj.2015.02.006
of the deep beams reinforced with GFRP bars is shown inFig. 3. It shows that the finite element load deflection curvesare somewhat stiffer than the experimental plots. After first
cracking, the stiffness of the finite element models is againhigher than that of the experimental beams. There are severaleffects that may cause the higher stiffness in the finite element
models. The most important is microcracks which are presentin the concrete for the experimental deep beams, and could beproduced by drying shrinkage in the concrete and/or handling
of the deep beams. On the other hand, the finite element mod-els do not include the microcracks. As well known that themicrocracks reduce the stiffness of the experimental deepbeams, for all specimens, good agreement is in load–deflection
050
100
150200250300350
400450500
0 2 4 6 8 10 12 14
Central deflection, mm
A2N(EXP)A2N(FEA)
a/d=1.4ρ=1.5%fc = 45 MPah=300 mm
0
50
100
150
200
250
0 2 4 6 8 10 12 14
Central deflection, mm
Load
, kN
A4H(EXP)A4H(FEA)
a/d=2ρ=1.5%fc = 65 MPah=300 mm
0
100
200
300
400
500
600
700
800
900
0 2 4 6 8 10 12 14
Central deflection, mm
Load
, kN
B2N(EXP)B2N(FEA)
a/d=1.48ρ=1.71%fc = 40 MPah=600 mm
tion curves of the studied deep beams.
e element analysis of concrete deep beam reinforced with GFRP bars, HBRC
050
100150200250300350400450500
0 2 4 6 8 10 12 14 16 18Central deflection, mm
Load
, kN
B3N(EXP)B3N(FEA)
a/d=2.07ρ=1.71%fc = 40 MPah=600 mm
0
100
200
300
400
500
600
700
800
900
0 2 4 6 8 10 12 14 16Central deflection, mm
Load
, kN
B4N(EXP)B4N(FEA)
a/d=1.48ρ=2.13%fc = 40 MPah=600 mm
0
200
400
600
800
1000
1200
0 2 4 6 8 10 12 14 16Central deflection, mm
Load
, kN
B5H(EXP)B5H(FEA)
a/d=1.48ρ=2.12%fc = 67 MPah=600 mm
0
50
100
150
200
250
300
350
400
450
0 2 4 6 8 10 12 14Central deflection, mm
Load
, kN
B6H(EXP)B6H(FEA)
a/d=2.06ρ=1.7%fc = 67 MPah=600 mm
0200400600800
10001200140016001800200022002400
0 2 4 6 8 10 12 14 16 18 20 Central deflection, mm
Load
, kN
C1N(EXP)C1N(FEA)
a/d=1.10ρ=1.58%fc = 51 MPah=1000 mm
0
200
400
600
800
1000
1200
1400
0 2 4 6 8 10 12 14 16 18 20
Central deflection, mm
Load
, kN
C2N(EXP)C2N(FEA)
a/d=1.49ρ=1.56%fc = 51 MPah=1000 mm
Fig. 3 (continued)
6 I.M. Metwally
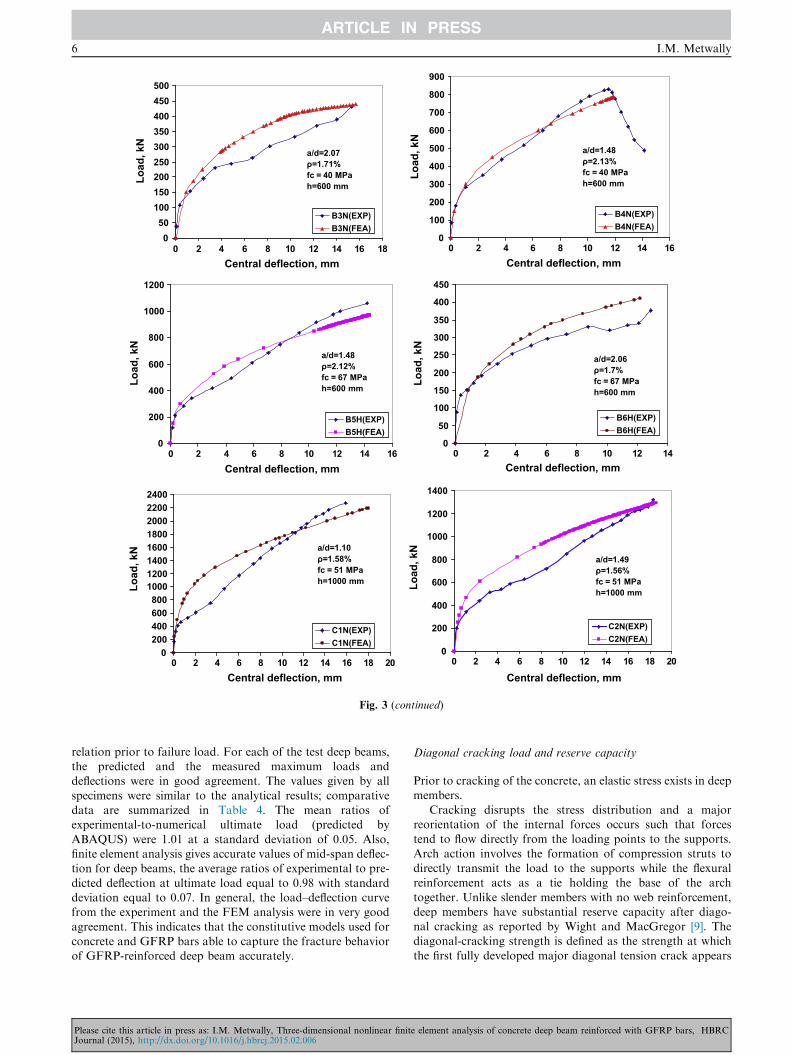
relation prior to failure load. For each of the test deep beams,the predicted and the measured maximum loads anddeflections were in good agreement. The values given by all
specimens were similar to the analytical results; comparativedata are summarized in Table 4. The mean ratios ofexperimental-to-numerical ultimate load (predicted by
ABAQUS) were 1.01 at a standard deviation of 0.05. Also,finite element analysis gives accurate values of mid-span deflec-tion for deep beams, the average ratios of experimental to pre-
dicted deflection at ultimate load equal to 0.98 with standarddeviation equal to 0.07. In general, the load–deflection curvefrom the experiment and the FEM analysis were in very goodagreement. This indicates that the constitutive models used for
concrete and GFRP bars able to capture the fracture behaviorof GFRP-reinforced deep beam accurately.
Please cite this article in press as: I.M. Metwally, Three-dimensional nonlinear finitJournal (2015), http://dx.doi.org/10.1016/j.hbrcj.2015.02.006
Diagonal cracking load and reserve capacity
Prior to cracking of the concrete, an elastic stress exists in deepmembers.
Cracking disrupts the stress distribution and a majorreorientation of the internal forces occurs such that forcestend to flow directly from the loading points to the supports.
Arch action involves the formation of compression struts todirectly transmit the load to the supports while the flexuralreinforcement acts as a tie holding the base of the arch
together. Unlike slender members with no web reinforcement,deep members have substantial reserve capacity after diago-nal cracking as reported by Wight and MacGregor [9]. Thediagonal-cracking strength is defined as the strength at which
the first fully developed major diagonal tension crack appears
e element analysis of concrete deep beam reinforced with GFRP bars, HBRC
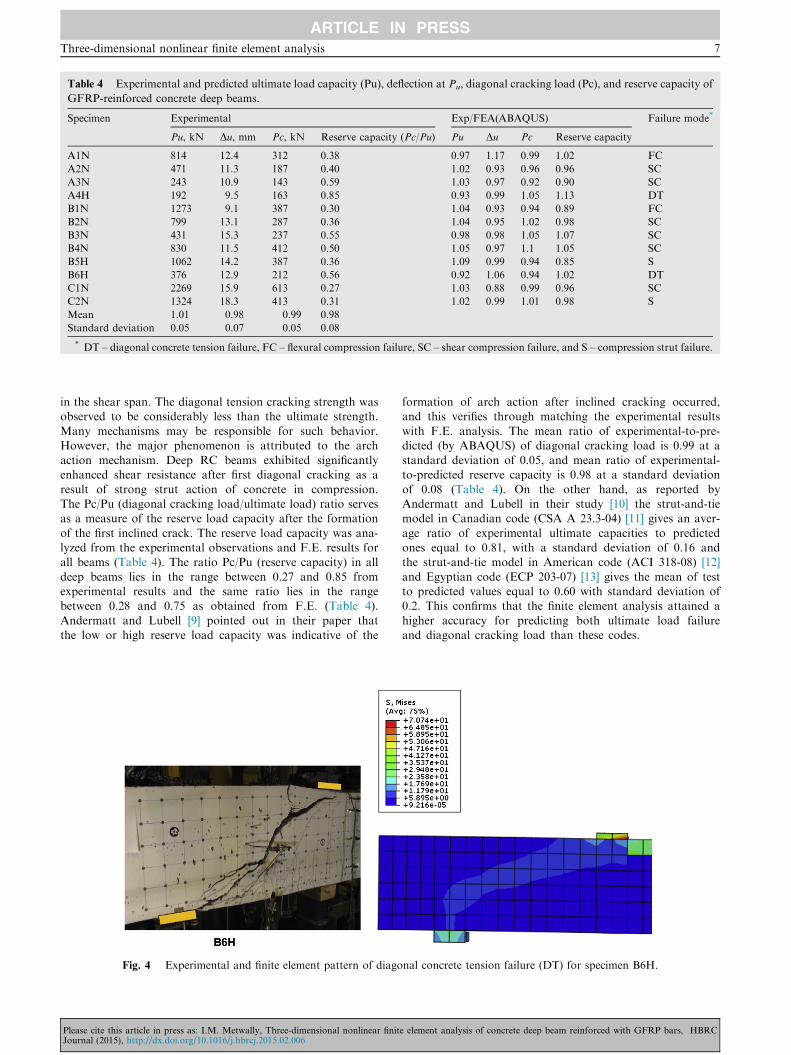
Table 4 Experimental and predicted ultimate load capacity (Pu), deflection at Pu, diagonal cracking load (Pc), and reserve capacity of
GFRP-reinforced concrete deep beams.
Specimen Experimental Exp/FEA(ABAQUS) Failure mode*
Pu, kN Du, mm Pc, kN Reserve capacity (Pc/Pu) Pu Du Pc Reserve capacity
A1N 814 12.4 312 0.38 0.97 1.17 0.99 1.02 FC
A2N 471 11.3 187 0.40 1.02 0.93 0.96 0.96 SC
A3N 243 10.9 143 0.59 1.03 0.97 0.92 0.90 SC
A4H 192 9.5 163 0.85 0.93 0.99 1.05 1.13 DT
B1N 1273 9.1 387 0.30 1.04 0.93 0.94 0.89 FC
B2N 799 13.1 287 0.36 1.04 0.95 1.02 0.98 SC
B3N 431 15.3 237 0.55 0.98 0.98 1.05 1.07 SC
B4N 830 11.5 412 0.50 1.05 0.97 1.1 1.05 SC
B5H 1062 14.2 387 0.36 1.09 0.99 0.94 0.85 S
B6H 376 12.9 212 0.56 0.92 1.06 0.94 1.02 DT
C1N 2269 15.9 613 0.27 1.03 0.88 0.99 0.96 SC
C2N 1324 18.3 413 0.31 1.02 0.99 1.01 0.98 S
Mean 1.01 0.98 0.99 0.98
Standard deviation 0.05 0.07 0.05 0.08
* DT – diagonal concrete tension failure, FC – flexural compression failure, SC – shear compression failure, and S – compression strut failure.
Three-dimensional nonlinear finite element analysis 7
in the shear span. The diagonal tension cracking strength wasobserved to be considerably less than the ultimate strength.
Many mechanisms may be responsible for such behavior.However, the major phenomenon is attributed to the archaction mechanism. Deep RC beams exhibited significantlyenhanced shear resistance after first diagonal cracking as a
result of strong strut action of concrete in compression.The Pc/Pu (diagonal cracking load/ultimate load) ratio servesas a measure of the reserve load capacity after the formation
of the first inclined crack. The reserve load capacity was ana-lyzed from the experimental observations and F.E. results forall beams (Table 4). The ratio Pc/Pu (reserve capacity) in all
deep beams lies in the range between 0.27 and 0.85 fromexperimental results and the same ratio lies in the rangebetween 0.28 and 0.75 as obtained from F.E. (Table 4).
Andermatt and Lubell [9] pointed out in their paper thatthe low or high reserve load capacity was indicative of the
Fig. 4 Experimental and finite element pattern of diago
Please cite this article in press as: I.M. Metwally, Three-dimensional nonlinear finitJournal (2015), http://dx.doi.org/10.1016/j.hbrcj.2015.02.006
formation of arch action after inclined cracking occurred,and this verifies through matching the experimental results
with F.E. analysis. The mean ratio of experimental-to-pre-dicted (by ABAQUS) of diagonal cracking load is 0.99 at astandard deviation of 0.05, and mean ratio of experimental-to-predicted reserve capacity is 0.98 at a standard deviation
of 0.08 (Table 4). On the other hand, as reported byAndermatt and Lubell in their study [10] the strut-and-tiemodel in Canadian code (CSA A 23.3-04) [11] gives an aver-
age ratio of experimental ultimate capacities to predictedones equal to 0.81, with a standard deviation of 0.16 andthe strut-and-tie model in American code (ACI 318-08) [12]
and Egyptian code (ECP 203-07) [13] gives the mean of testto predicted values equal to 0.60 with standard deviation of0.2. This confirms that the finite element analysis attained a
higher accuracy for predicting both ultimate load failureand diagonal cracking load than these codes.
nal concrete tension failure (DT) for specimen B6H.
e element analysis of concrete deep beam reinforced with GFRP bars, HBRC
8 I.M. Metwally
Failure mechanisms
Table 4 contains four types of failure mechanisms that wereobserved experimentally by Andermatt and Lubell [1]; these
types are
1. Diagonal concrete tension failure (DT) or splitting failure:
it occurred in specimens A4H and B6H. The diagonal crackformed in each shear span from the inside edge of the reac-tion plate toward the inside edge of the loading plate. The
diagonal crack extended above the diagonal line betweenthe centerlines of the loading and support plates as shownin Fig. 4.
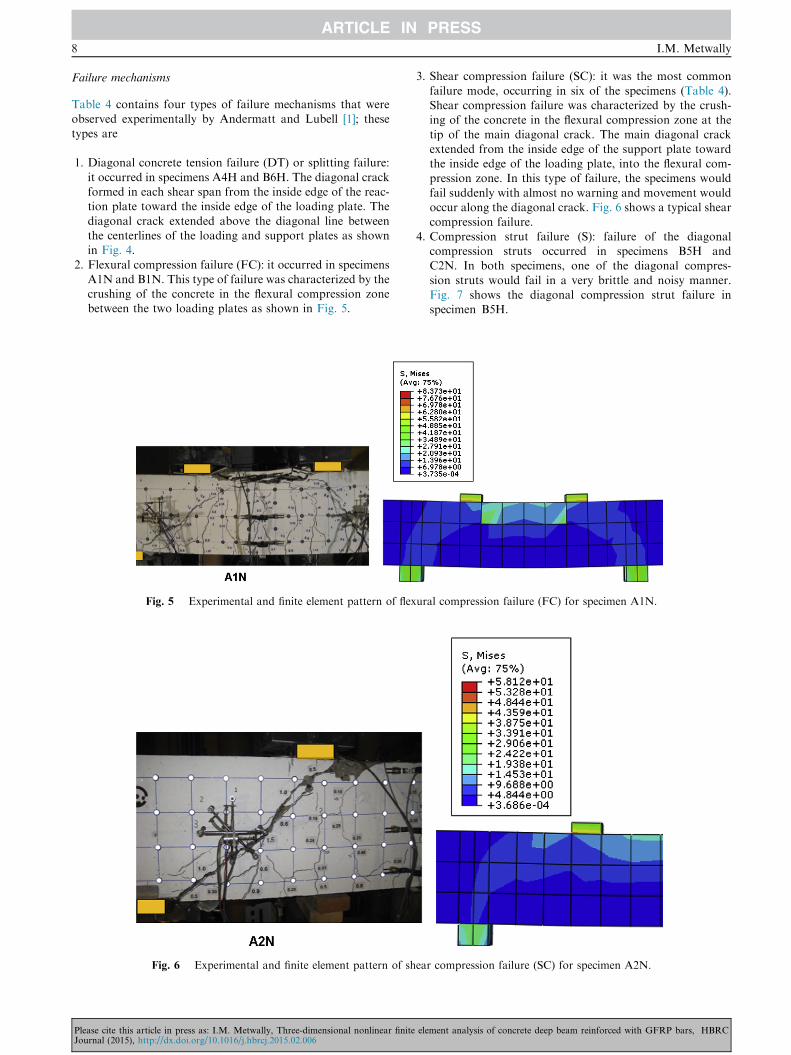
2. Flexural compression failure (FC): it occurred in specimensA1N and B1N. This type of failure was characterized by thecrushing of the concrete in the flexural compression zonebetween the two loading plates as shown in Fig. 5.
Fig. 5 Experimental and finite element pattern of fle
Fig. 6 Experimental and finite element pattern of s
Please cite this article in press as: I.M. Metwally, Three-dimensional nonlinear finitJournal (2015), http://dx.doi.org/10.1016/j.hbrcj.2015.02.006
3. Shear compression failure (SC): it was the most common
failure mode, occurring in six of the specimens (Table 4).Shear compression failure was characterized by the crush-ing of the concrete in the flexural compression zone at the
tip of the main diagonal crack. The main diagonal crackextended from the inside edge of the support plate towardthe inside edge of the loading plate, into the flexural com-pression zone. In this type of failure, the specimens would
fail suddenly with almost no warning and movement wouldoccur along the diagonal crack. Fig. 6 shows a typical shearcompression failure.
4. Compression strut failure (S): failure of the diagonalcompression struts occurred in specimens B5H andC2N. In both specimens, one of the diagonal compres-
sion struts would fail in a very brittle and noisy manner.Fig. 7 shows the diagonal compression strut failure inspecimen B5H.
xural compression failure (FC) for specimen A1N.
hear compression failure (SC) for specimen A2N.
e element analysis of concrete deep beam reinforced with GFRP bars, HBRC
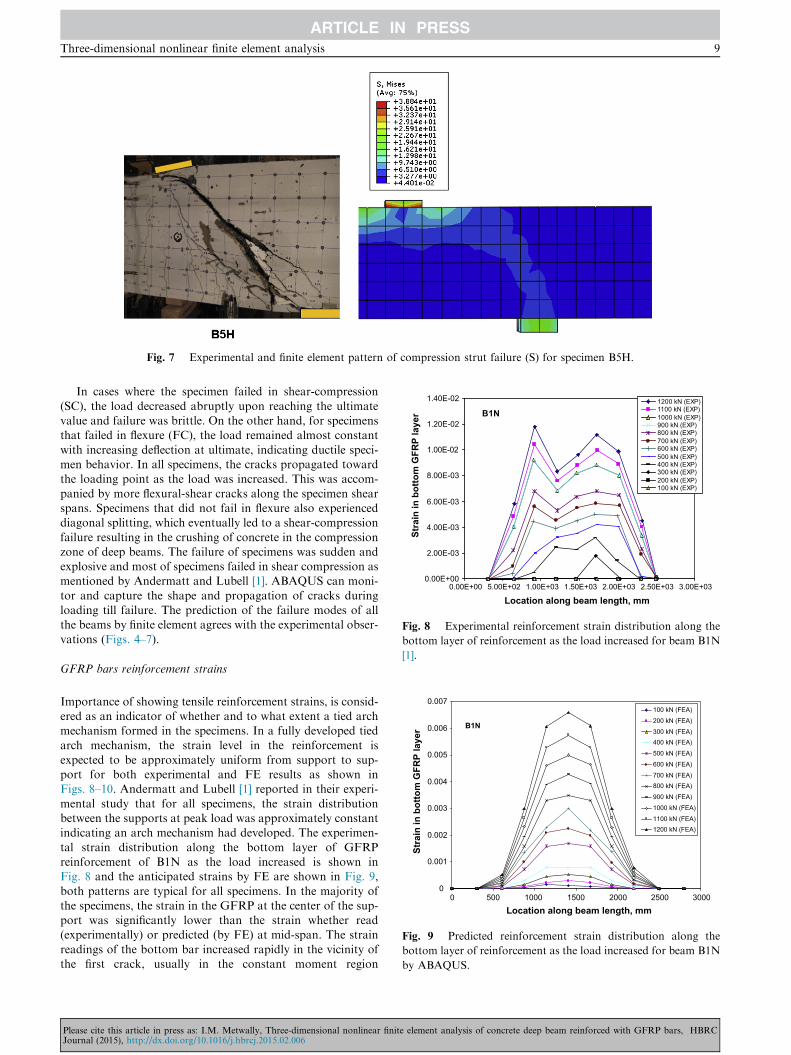
Fig. 7 Experimental and finite element pattern of compression strut failure (S) for specimen B5H.
0.00E+00
2.00E-03
4.00E-03
6.00E-03
8.00E-03
1.00E-02
1.20E-02
1.40E-02
0.00E+00 5.00E+02 1.00E+03 1.50E+03 2.00E+03 2.50E+03 3.00E+03
Location along beam length, mm
Stra
in in
bot
tom
GFR
P la
yer
1200 kN (EXP)1100 kN (EXP)1000 kN (EXP)900 kN (EXP)800 kN (EXP)700 kN (EXP)600 kN (EXP)500 kN (EXP)400 kN (EXP)300 kN (EXP)200 kN (EXP)100 kN (EXP)
B1N
Fig. 8 Experimental reinforcement strain distribution along the
bottom layer of reinforcement as the load increased for beam B1N
[1].
0
0.001
0.002
0.003
0.004
0.005
0.006
0.007
0 500 1000 1500 2000 2500 3000
Location along beam length, mm
Stra
in in
bot
tom
GFR
P la
yer
100 kN (FEA)
200 kN (FEA)
300 kN (FEA)400 kN (FEA)
500 kN (FEA)
600 kN (FEA)
700 kN (FEA)800 kN (FEA)
900 kN (FEA)
1000 kN (FEA)
1100 kN (FEA)1200 kN (FEA)
B1N
Fig. 9 Predicted reinforcement strain distribution along the
bottom layer of reinforcement as the load increased for beam B1N
by ABAQUS.
Three-dimensional nonlinear finite element analysis 9
In cases where the specimen failed in shear-compression
(SC), the load decreased abruptly upon reaching the ultimatevalue and failure was brittle. On the other hand, for specimensthat failed in flexure (FC), the load remained almost constant
with increasing deflection at ultimate, indicating ductile speci-men behavior. In all specimens, the cracks propagated towardthe loading point as the load was increased. This was accom-
panied by more flexural-shear cracks along the specimen shearspans. Specimens that did not fail in flexure also experienceddiagonal splitting, which eventually led to a shear-compression
failure resulting in the crushing of concrete in the compressionzone of deep beams. The failure of specimens was sudden andexplosive and most of specimens failed in shear compression asmentioned by Andermatt and Lubell [1]. ABAQUS can moni-
tor and capture the shape and propagation of cracks duringloading till failure. The prediction of the failure modes of allthe beams by finite element agrees with the experimental obser-
vations (Figs. 4–7).
GFRP bars reinforcement strains
Importance of showing tensile reinforcement strains, is consid-ered as an indicator of whether and to what extent a tied archmechanism formed in the specimens. In a fully developed tied
arch mechanism, the strain level in the reinforcement isexpected to be approximately uniform from support to sup-port for both experimental and FE results as shown inFigs. 8–10. Andermatt and Lubell [1] reported in their experi-
mental study that for all specimens, the strain distributionbetween the supports at peak load was approximately constantindicating an arch mechanism had developed. The experimen-
tal strain distribution along the bottom layer of GFRPreinforcement of B1N as the load increased is shown inFig. 8 and the anticipated strains by FE are shown in Fig. 9,
both patterns are typical for all specimens. In the majority ofthe specimens, the strain in the GFRP at the center of the sup-port was significantly lower than the strain whether read(experimentally) or predicted (by FE) at mid-span. The strain
readings of the bottom bar increased rapidly in the vicinity ofthe first crack, usually in the constant moment region
Please cite this article in press as: I.M. Metwally, Three-dimensional nonlinear finite element analysis of concrete deep beam reinforced with GFRP bars, HBRCJournal (2015), http://dx.doi.org/10.1016/j.hbrcj.2015.02.006
0
0.0005
0.001
0.0015
0.002
0.0025
0.003
0.0035
0.004
0.0045
0.005
0 500 1000 1500 2000 2500 3000
Location along beam length, mm
Stra
in in
top
GFR
P la
yer
100 kN (FEA)200 kN (FEA)300 kN (FEA)400 kN (FEA)500 kN(FEA)600 kN (FEA)700 kN (FEA)800 kN (FEA)900 kN (FEA)1000 kN (FEA)1100 kN (FEA)1200 kN (FEA)
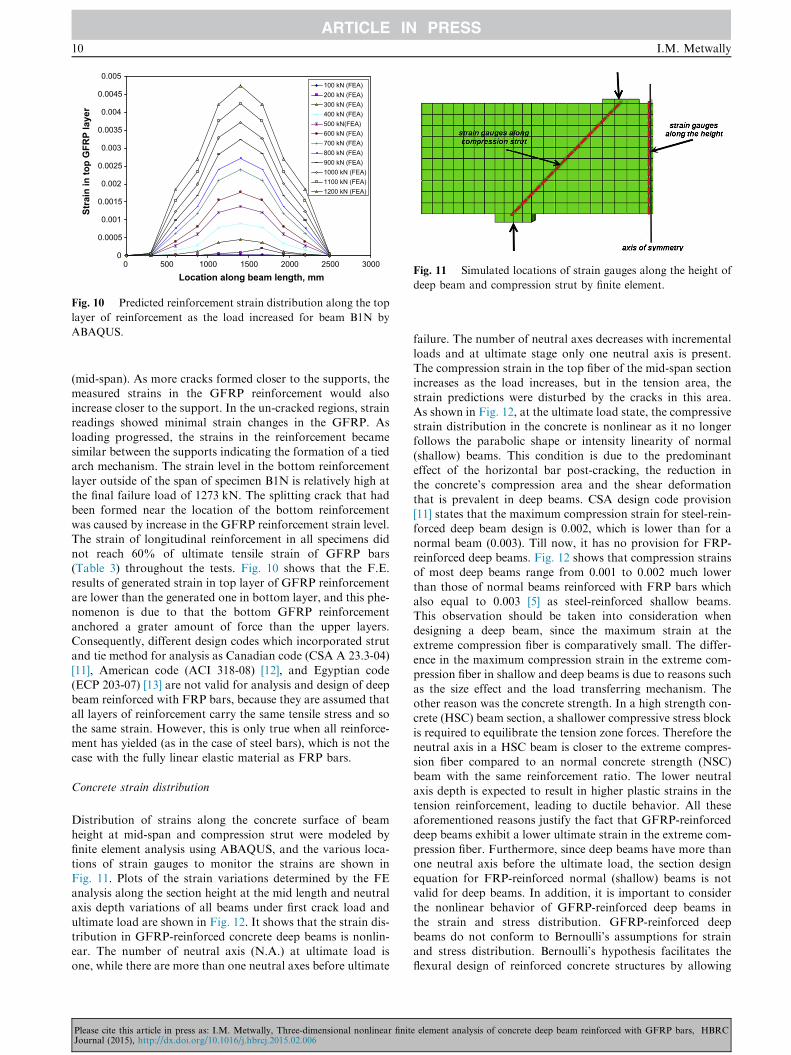
Fig. 10 Predicted reinforcement strain distribution along the top
layer of reinforcement as the load increased for beam B1N by
ABAQUS.
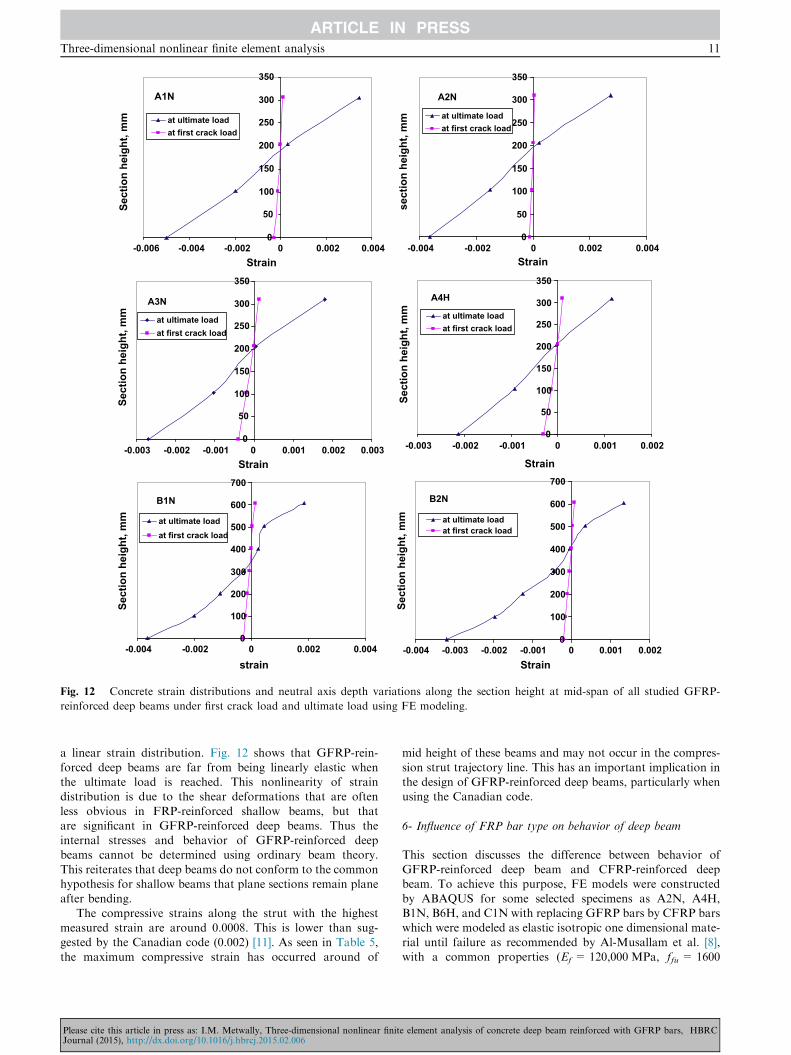
Fig. 11 Simulated locations of strain gauges along the height of
deep beam and compression strut by finite element.
10 I.M. Metwally
(mid-span). As more cracks formed closer to the supports, themeasured strains in the GFRP reinforcement would alsoincrease closer to the support. In the un-cracked regions, strainreadings showed minimal strain changes in the GFRP. As
loading progressed, the strains in the reinforcement becamesimilar between the supports indicating the formation of a tiedarch mechanism. The strain level in the bottom reinforcement
layer outside of the span of specimen B1N is relatively high atthe final failure load of 1273 kN. The splitting crack that hadbeen formed near the location of the bottom reinforcement
was caused by increase in the GFRP reinforcement strain level.The strain of longitudinal reinforcement in all specimens didnot reach 60% of ultimate tensile strain of GFRP bars(Table 3) throughout the tests. Fig. 10 shows that the F.E.
results of generated strain in top layer of GFRP reinforcementare lower than the generated one in bottom layer, and this phe-nomenon is due to that the bottom GFRP reinforcement
anchored a grater amount of force than the upper layers.Consequently, different design codes which incorporated strutand tie method for analysis as Canadian code (CSA A 23.3-04)
[11], American code (ACI 318-08) [12], and Egyptian code(ECP 203-07) [13] are not valid for analysis and design of deepbeam reinforced with FRP bars, because they are assumed that
all layers of reinforcement carry the same tensile stress and sothe same strain. However, this is only true when all reinforce-ment has yielded (as in the case of steel bars), which is not thecase with the fully linear elastic material as FRP bars.
Concrete strain distribution
Distribution of strains along the concrete surface of beam
height at mid-span and compression strut were modeled byfinite element analysis using ABAQUS, and the various loca-tions of strain gauges to monitor the strains are shown in
Fig. 11. Plots of the strain variations determined by the FEanalysis along the section height at the mid length and neutralaxis depth variations of all beams under first crack load and
ultimate load are shown in Fig. 12. It shows that the strain dis-tribution in GFRP-reinforced concrete deep beams is nonlin-ear. The number of neutral axis (N.A.) at ultimate load isone, while there are more than one neutral axes before ultimate
Please cite this article in press as: I.M. Metwally, Three-dimensional nonlinear finitJournal (2015), http://dx.doi.org/10.1016/j.hbrcj.2015.02.006
failure. The number of neutral axes decreases with incremental
loads and at ultimate stage only one neutral axis is present.The compression strain in the top fiber of the mid-span sectionincreases as the load increases, but in the tension area, the
strain predictions were disturbed by the cracks in this area.As shown in Fig. 12, at the ultimate load state, the compressivestrain distribution in the concrete is nonlinear as it no longerfollows the parabolic shape or intensity linearity of normal
(shallow) beams. This condition is due to the predominanteffect of the horizontal bar post-cracking, the reduction inthe concrete’s compression area and the shear deformation
that is prevalent in deep beams. CSA design code provision[11] states that the maximum compression strain for steel-rein-forced deep beam design is 0.002, which is lower than for a
normal beam (0.003). Till now, it has no provision for FRP-reinforced deep beams. Fig. 12 shows that compression strainsof most deep beams range from 0.001 to 0.002 much lower
than those of normal beams reinforced with FRP bars whichalso equal to 0.003 [5] as steel-reinforced shallow beams.This observation should be taken into consideration whendesigning a deep beam, since the maximum strain at the
extreme compression fiber is comparatively small. The differ-ence in the maximum compression strain in the extreme com-pression fiber in shallow and deep beams is due to reasons such
as the size effect and the load transferring mechanism. Theother reason was the concrete strength. In a high strength con-crete (HSC) beam section, a shallower compressive stress block
is required to equilibrate the tension zone forces. Therefore theneutral axis in a HSC beam is closer to the extreme compres-sion fiber compared to an normal concrete strength (NSC)beam with the same reinforcement ratio. The lower neutral
axis depth is expected to result in higher plastic strains in thetension reinforcement, leading to ductile behavior. All theseaforementioned reasons justify the fact that GFRP-reinforced
deep beams exhibit a lower ultimate strain in the extreme com-pression fiber. Furthermore, since deep beams have more thanone neutral axis before the ultimate load, the section design
equation for FRP-reinforced normal (shallow) beams is notvalid for deep beams. In addition, it is important to considerthe nonlinear behavior of GFRP-reinforced deep beams in
the strain and stress distribution. GFRP-reinforced deepbeams do not conform to Bernoulli’s assumptions for strainand stress distribution. Bernoulli’s hypothesis facilitates theflexural design of reinforced concrete structures by allowing
e element analysis of concrete deep beam reinforced with GFRP bars, HBRC
A1N
0
50
100
150
200
250
300
350
0-0.006 -0.004 -0.002 0.002 0.004Strain
Sect
ion
heig
ht, m
m at ultimate loadat first crack load
A2N
0
50
100
150
200
250
300
350
0-0.004 -0.002 0.002 0.004Strain
sect
ion
heig
ht, m
m at ultimate loadat first crack load
0
50
100
150
200
250
300
350
0-0.003 -0.002 -0.001 0.001 0.002 0.003Strain
Sect
ion
heig
ht, m
m at ultimate loadat first crack load
A3N A4H
0
50
100
150
200
250
300
350
-0.003 -0.002 -0.001 0 0.001 0.002
Strain
Sect
ion
heig
ht, m
m at ultimate loadat first crack load
B1N
0
100
200
300
400
500
600
700
0-0.004 -0.002 0.002 0.004
strain
Sect
ion
heig
ht, m
m at ultimate loadat first crack load
B2N
0
100
200
300
400
500
600
700
0-0.004 -0.003 -0.002 -0.001 0.001 0.002Strain
Sect
ion
heig
ht, m
m at ultimate loadat first crack load
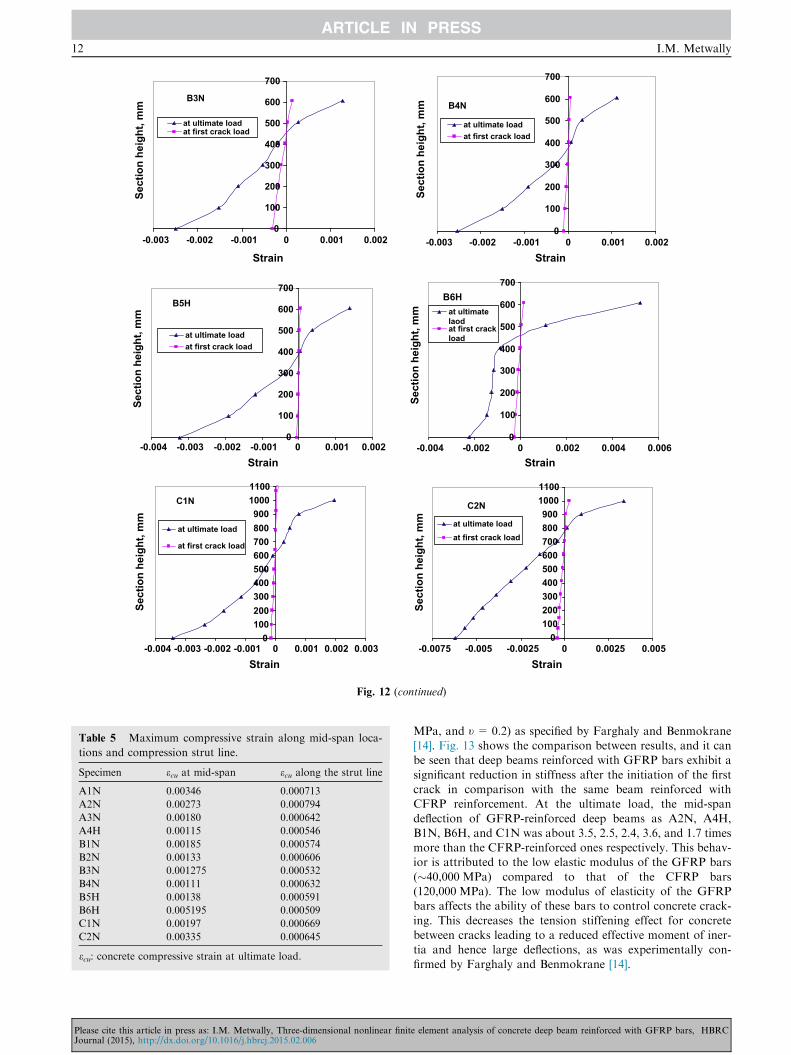
Fig. 12 Concrete strain distributions and neutral axis depth variations along the section height at mid-span of all studied GFRP-
reinforced deep beams under first crack load and ultimate load using FE modeling.
Three-dimensional nonlinear finite element analysis 11
a linear strain distribution. Fig. 12 shows that GFRP-rein-
forced deep beams are far from being linearly elastic whenthe ultimate load is reached. This nonlinearity of straindistribution is due to the shear deformations that are often
less obvious in FRP-reinforced shallow beams, but thatare significant in GFRP-reinforced deep beams. Thus theinternal stresses and behavior of GFRP-reinforced deepbeams cannot be determined using ordinary beam theory.
This reiterates that deep beams do not conform to the commonhypothesis for shallow beams that plane sections remain planeafter bending.
The compressive strains along the strut with the highestmeasured strain are around 0.0008. This is lower than sug-gested by the Canadian code (0.002) [11]. As seen in Table 5,
the maximum compressive strain has occurred around of
Please cite this article in press as: I.M. Metwally, Three-dimensional nonlinear finitJournal (2015), http://dx.doi.org/10.1016/j.hbrcj.2015.02.006
mid height of these beams and may not occur in the compres-
sion strut trajectory line. This has an important implication inthe design of GFRP-reinforced deep beams, particularly whenusing the Canadian code.
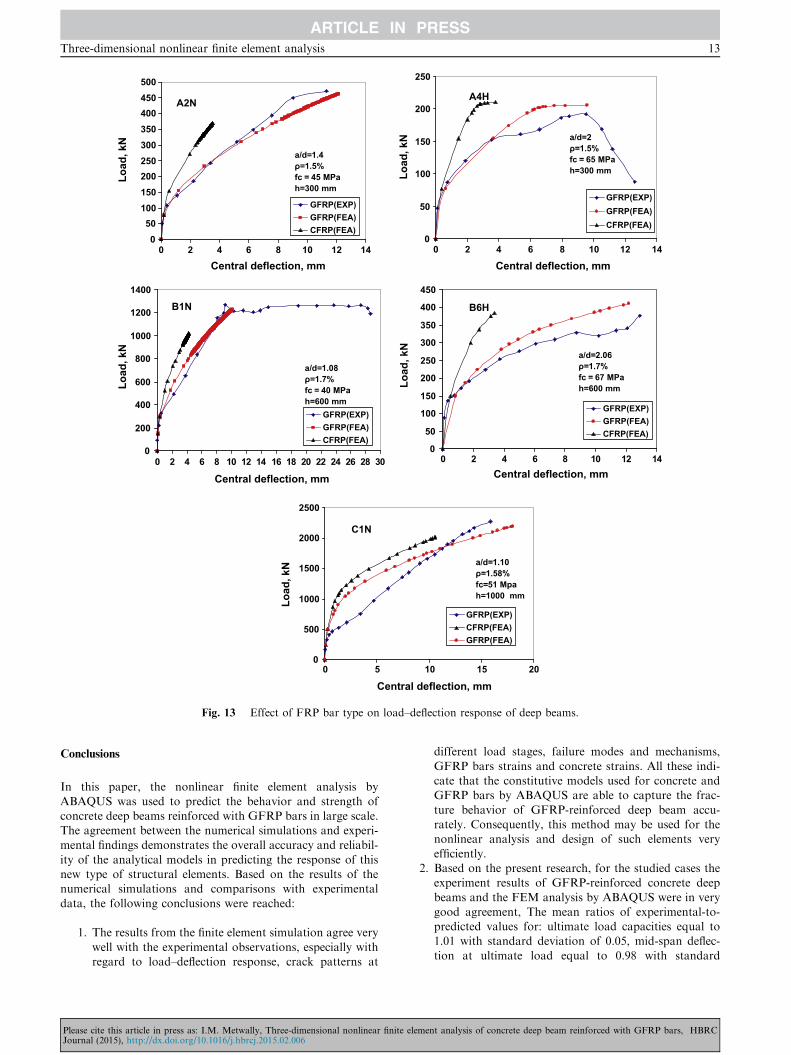
6- Influence of FRP bar type on behavior of deep beam
This section discusses the difference between behavior ofGFRP-reinforced deep beam and CFRP-reinforced deepbeam. To achieve this purpose, FE models were constructed
by ABAQUS for some selected specimens as A2N, A4H,B1N, B6H, and C1N with replacing GFRP bars by CFRP barswhich were modeled as elastic isotropic one dimensional mate-
rial until failure as recommended by Al-Musallam et al. [8],with a common properties (Ef = 120,000 MPa, ffu = 1600
e element analysis of concrete deep beam reinforced with GFRP bars, HBRC
0
100
200
300
400
500
600
700
0
Strain
Sect
ion
heig
ht, m
mat ultimate loadat first crack load
B3NB4N
0
100
200
300
400
500
600
700
0-0.003 -0.002 -0.001 0.001 0.002 -0.003 -0.002 -0.001 0.001 0.002Strain
Sect
ion
heig
ht, m
m
at ultimate loadat first crack load
B5H
0
100
200
300
400
500
600
700
0Strain
Sect
ion
heig
ht, m
m
at ultimate loadat first crack load
B6H
0-0.004 -0.003 -0.002 -0.001 0.001 0.002 -0.004 -0.002 0.002 0.004 0.0060
100
200
300
400
500
600
700
Strain
Sect
ion
heig
ht, m
m at ultimatelaodat first crackload
C1N
0100200300400500600700800900
10001100
0-0.004 -0.003 -0.002 -0.001 0.001 0.002 0.003Strain
Sect
ion
heig
ht, m
m
at ultimate load
at first crack load
0100200300400500600700800900
10001100
0-0.0075 -0.005 -0.0025 0.0025 0.005Strain
Sect
ion
heig
ht, m
m at ultimate load at first crack load
C2N
Fig. 12 (continued)
Table 5 Maximum compressive strain along mid-span loca-
tions and compression strut line.
Specimen ecu at mid-span ecu along the strut line
A1N 0.00346 0.000713
A2N 0.00273 0.000794
A3N 0.00180 0.000642
A4H 0.00115 0.000546
B1N 0.00185 0.000574
B2N 0.00133 0.000606
B3N 0.001275 0.000532
B4N 0.00111 0.000632
B5H 0.00138 0.000591
B6H 0.005195 0.000509
C1N 0.00197 0.000669
C2N 0.00335 0.000645
ecu: concrete compressive strain at ultimate load.
12 I.M. Metwally
Please cite this article in press as: I.M. Metwally, Three-dimensional nonlinear finitJournal (2015), http://dx.doi.org/10.1016/j.hbrcj.2015.02.006
MPa, and t = 0.2) as specified by Farghaly and Benmokrane[14]. Fig. 13 shows the comparison between results, and it canbe seen that deep beams reinforced with GFRP bars exhibit a
significant reduction in stiffness after the initiation of the firstcrack in comparison with the same beam reinforced withCFRP reinforcement. At the ultimate load, the mid-span
deflection of GFRP-reinforced deep beams as A2N, A4H,B1N, B6H, and C1N was about 3.5, 2.5, 2.4, 3.6, and 1.7 timesmore than the CFRP-reinforced ones respectively. This behav-ior is attributed to the low elastic modulus of the GFRP bars
(�40,000 MPa) compared to that of the CFRP bars(120,000 MPa). The low modulus of elasticity of the GFRPbars affects the ability of these bars to control concrete crack-
ing. This decreases the tension stiffening effect for concretebetween cracks leading to a reduced effective moment of iner-tia and hence large deflections, as was experimentally con-
firmed by Farghaly and Benmokrane [14].
e element analysis of concrete deep beam reinforced with GFRP bars, HBRC
050
100150200250300350400450500
Central deflection, mm
Load
, kN
GFRP(EXP)GFRP(FEA)CFRP(FEA)
a/d=1.4ρ=1.5%fc = 45 MPah=300 mm
A2N
0
50
100
150
200
250
6 8 10 12 14 0 20 2 4 4 6 8 10 12 14
Central deflection, mm
Load
, kN
GFRP(EXP)GFRP(FEA)CFRP(FEA)
a/d=2ρ=1.5%fc = 65 MPah=300 mm
A4H
0
200
400
600
800
1000
1200
1400
0 2 4 6 8 10 12 14 16 18 20 22 24 26 28 30
Central deflection, mm
Load
, kN
GFRP(EXP)GFRP(FEA)CFRP(FEA)
a/d=1.08ρ=1.7%fc = 40 MPah=600 mm
B1N
0
50
100
150
200
250
300
350
400
450
6 80 2 4 10 12 14Central deflection, mm
Load
, kN
GFRP(EXP)GFRP(FEA)CFRP(FEA)
a/d=2.06ρ=1.7%fc = 67 MPah=600 mm
B6H
0
500
1000
1500
2000
2500
0 5 10 15 20
Central deflection, mm
GFRP(EXP)CFRP(FEA)GFRP(FEA)
a/d=1.10ρ=1.58%fc=51 Mpah=1000 mm
C1N
Load
, kN
Fig. 13 Effect of FRP bar type on load–deflection response of deep beams.
Three-dimensional nonlinear finite element analysis 13
Conclusions
In this paper, the nonlinear finite element analysis by
ABAQUS was used to predict the behavior and strength ofconcrete deep beams reinforced with GFRP bars in large scale.The agreement between the numerical simulations and experi-mental findings demonstrates the overall accuracy and reliabil-
ity of the analytical models in predicting the response of thisnew type of structural elements. Based on the results of thenumerical simulations and comparisons with experimental
data, the following conclusions were reached:
1. The results from the finite element simulation agree very
well with the experimental observations, especially withregard to load–deflection response, crack patterns at
Please cite this article in press as: I.M. Metwally, Three-dimensional nonlinear finitJournal (2015), http://dx.doi.org/10.1016/j.hbrcj.2015.02.006
different load stages, failure modes and mechanisms,
GFRP bars strains and concrete strains. All these indi-cate that the constitutive models used for concrete andGFRP bars by ABAQUS are able to capture the frac-
ture behavior of GFRP-reinforced deep beam accu-rately. Consequently, this method may be used for thenonlinear analysis and design of such elements very
efficiently.2. Based on the present research, for the studied cases the
experiment results of GFRP-reinforced concrete deep
beams and the FEM analysis by ABAQUS were in verygood agreement, The mean ratios of experimental-to-predicted values for: ultimate load capacities equal to1.01 with standard deviation of 0.05, mid-span deflec-
tion at ultimate load equal to 0.98 with standard
e element analysis of concrete deep beam reinforced with GFRP bars, HBRC
14 I.M. Metwally
deviation of 0.07, diagonal cracking load equal to 0.99
with standard deviation of 0.05, and reserve capacityequal to 0.98 with standard deviation of 0.08.
3. The present finite element study which has been verified
through the experimental results demonstrated, that theabundant reserve capacity was available after the forma-tion of the main diagonal cracks, indicated that GFRP-reinforced concrete deep beams were able to redistribute
the internal forces and develop an arch mechanism.4. ABAQUS can monitor and capture the shape and prop-
agation of cracks during loading till failure. The predic-
tions of the failure modes of all the beams by finiteelement agree well with the experimental observations.
5. Finite element analysis and experimental results show
that, as loading progressed, the strain distribution inthe longitudinal GFRP reinforcement became approxi-mately uniform between the supports indicating the for-mation of a tied arch mechanism.
6. FE analysis in this research shows that the dependenceon the current design codes as ACI 318-08, CSA A23.3-04 and ECP-203-07 in analysis and design of
FRP-reinforced concrete deep beams is not accuratebecause they assumed that all layers of reinforcementcarry the same tensile stress and so the same strain; this
is not true in case of FRP reinforcement. However, thisis only true when all reinforcement has yielded (as incase of steel bars), which is not the case with the fully lin-
ear elastic material as FRP bars.7. Concrete strain distribution in GFRP-reinforced con-
crete deep beams is nonlinear, and they do not conformto Bernoulli’s assumptions for strain and stress dis-
tribution. This nonlinearity of strain distribution is dueto the shear deformations that are often less obviousin FRP-reinforced shallow beams, but that are signifi-
cant in GFRP-reinforced deep beams.8. The number of neutral axes at ultimate load is one, while
there are more than one neutral axes before ultimate
failure. The number of neutral axes decreases with incre-mental loads and at ultimate load stage only one neutralaxis is present.
9. Maximum compression strain in the extreme compres-
sion fiber of most GFRP-reinforced deep beams at ulti-mate stage of loading ranges from 0.001 to 0.002 muchlower than those of shallow beams reinforced with
FRP bars (0.003). This observation should be taken intoconsideration when designing a deep beam, since themaximum strain at the extreme compression fiber is
comparatively small.10. The strains measured along the compression strut were
less than the value of 0.002 proposed by the Canadian
code, with the highest measured strain reaching about0.0008. This study shows that the maximum compres-sion strain may not occur in the compression strut tra-jectory line, and the maximum compressive strain has
occurred around of mid height of GFRP-reinforceddeep beams. This has an important implication in thedesign of those beams, particularly when using the
Canadian code.11. Since, the nonlinear strain distribution dominates the
GFRP-reinforced deep members behavior, accordingly,
finite element analysis is an appropriate technique foranalysis and design of such beams.
Please cite this article in press as: I.M. Metwally, Three-dimensional nonlinear finitJournal (2015), http://dx.doi.org/10.1016/j.hbrcj.2015.02.006
12. Deep beam reinforced with GFRP bars showed different
behavior than that of beam reinforced with CFRP barsdue to the low elastic modulus of GFRP bars. At ulti-mate load level, the deflection of the GFRP-reinforced
deep concrete beam was in the range of 2–4 times morethan the CFRP-reinforced deep beam resulting from thelow elastic modulus of the GFRP bars. Thus, the deflec-tion, instead of strength will govern the design for con-
crete deep beam reinforced with FRP bars.13. Future work must include the formulation of a con-
stitutivemodel for time dependent effects such as concrete
creep, shrinkage and fire exposure. Also, experimentaltesting and finite element analysis of continuous deepbeams reinforced with FRP bars must be investigated.
Conflict of interest
None declared.
References
[1] M. Andermatt, A. Lubell, Behavior of concrete deep beams
reinforced with internal fiber-reinforced polymer––experimental
study, ACI Struct. J. 110 (2013) 585–594.
[2] E.G. Nawy, Reinforced Concrete: A Fundamental Approach,
Prentice Hall, Upper Saddle River, 2003.
[3] S. Islam, A. Khennane, Experimental Verification of Automated
Design of Reinforced Concrete Deep Beams. SIMULIA
Customer Conference, 2012.
[4] J.I. Enem, J.C. Ezeh, M.S.W. Mbagiorgu, D.O. Onwuka,
Analysis of deep beam using Finite Element Method, Int. J.
Appl. Sci. Eng. Res. 1 (2012) 348–356.
[5] ACI Committee 440. Guide for the Design and Construction of
Structural Concrete Reinforced with FRP Bars. ACI 440.1R-06,
American Concrete Institute. Farmington Hills, 2006.
[6] ABAQUS Standard Version 6.13-4 and ABAQUS standard
user’s manual. The Abaqus Software is a product of Dassault
Systemes Simulia Corp., Hibbitt Karlsson & Sorensen Inc.,
2014.
[7] R. Malm. Predicting shear type crack initiation and growth in
concrete with non-linear finite element method. PhD thesis,
Department of Civil and Architectural engineering, Royal
Institute of Technology (KTH) Stockholm, 2009.
[8] T. Al-Musallam, H. El-Sanadedy, Y. Al-Salloum, S. Al-Sayed,
Experimental and numerical investigation for the flexural
strengthening of RC beams using near-surface mounted steel
or GFRP bars, Constr. Build. Mater. J. 40 (2013) 145–161.
[9] J.K. Wight, J.G. MacGregor, Reinforced Concrete: Mechanics
and Design, fifth ed., Pearson Prentice Hall, Upper Saddle
River, New Jersey, 2009.
[10] M. Andermatt, A. Lubell, Strength modeling of concrete deep
beams reinforced with internal fiber-reinforced polymer, ACI
Struct. J. 110 (2013), 595-05.
[11] Canadian Standards Association, Design of concrete structures,
A23.3-04, Canadian Standards Association, Mississauga,
Ontario, Canada, 2004.
[12] ACI Committee 318, Building Code Requirements for
Structural Concrete and Commentary, ACI 318-08, American
Concrete Institute, Farmington Hills, 2008.
[13] Egyptian Code for Design and Construction of Concrete
Structures, ECP 203-07, Housing & Building National
Research Centre, 2007.
[14] A. Farghaly, B. Benmokrane, Shear behavior of FRP-reinforced
concrete deep beams without web reinforcement, J. Compos.
Constr. 17 (2013) 1–10.
e element analysis of concrete deep beam reinforced with GFRP bars, HBRC


![[Elearnica.ir]-ABAQUS Model for PCC Slab Cracking](https://static.fdocuments.net/doc/165x107/577cc3c91a28aba711972ae8/elearnicair-abaqus-model-for-pcc-slab-cracking.jpg)