Three-Dimensional Microscopy Data Exploration by Interactive Volume...
9
SCANNING VOL. 22, 218–226 (2000) Received: January 10, 2000 © FAMS, Inc. Accepted: April 20, 2000 Three-Dimensional Microscopy Data Exploration by Interactive Volume Visualization SHIAOFEN FANG, YI DAI, FREDERICK MYERS, MIHRAN TUCERYAN, KENNETH DUNN* Department of Computer and Information Science, Indiana University Purdue University Indianapolis; *Department of Medicine, Division of Nephrology, School of Medicine, Indiana University, Indianapolis, Indiana, USA Summary: This paper presents a new volume visualization approach for three-dimensional (3-D) interactive micro- scopy data exploration. Because of their unique image characteristics, 3-D microscopy data are often not able to be visualized effectively by conventional volume visual- ization techniques. In our approach, microscopy visual- ization is carried out in an interactive data exploration environment, based on a combination of interactive volume rendering techniques and image-based transfer function design methods. Interactive volume rendering is achieved by using two-dimensional (2-D) texture mapping in a Shear-Warp volume rendering algorithm. Image process- ing techniques are employed and integrated into the rendering pipeline for the definition and searching of appro- priate transfer functions that best reflect the user’s visual- ization intentions. These techniques have been imple- mented successfully in a prototype visualization system on low-end and middle-range SGI desktop workstations. Since only 2-D texture mapping is required, the system can also be easily ported to PC platforms. Key words: three-dimensional microscopy, visualization, volume rendering, texture mapping, image processing PACS: 07.05 Rm, 07.05.Pj Introduction In the past 20 years, microscopy has come to play an increasingly important role in the study of cell biology. The advances in biochemistry and molecular biology have gen- erated an increased appreciation of the cellular organiza- tion of the biochemical components of a cell. Although advances in confocal microscopy and image deconvolution have made it feasible to collect high-resolution (Dunn et al. 1994, Shaw 1995), three-dimensional (3-D) image vol- umes of thick samples such as epithelial cells, application of this technology to 3-D imaging is still in its infancy. Indeed, the proliferation of 3-D microscopy in cell biology has generated vast amounts of image data that have not been sufficiently explored and analyzed. The rapid advances in computer graphics and visual- ization, in particular volume visualization, have provided a great potential for the visualization of 3-D microscopy images. Volume visualization is a new 3-D computer graph- ics technique that is concerned with the abstraction, inter- pretation, rendering, and manipulation of large volume datasets. Volume-rendering algorithms, for instance, can directly display the entire volume dataset through semi- transparent images and allow the viewer to peer inside the internal structures of the image volume for truly 3-D data viewing and analysis. Although volume visualization meth- ods and tools have been used in many scientific and med- ical applications, such as visual simulations and computed tomography/magnetic resonance imaging (CT/MRI), its applications in 3-D microscopy are limited and largely ineffective. This is mainly because current volume visual- ization techniques are mostly designed for CT/MRI types of images and are poorly suited for 3-D microscopy appli- cations. Several unique characteristics of microscopy data pose serious challenges to conventional visualization tech- niques. First, fluorescently labeled samples characteristically have low signal levels, sometimes consisting of a single photon, so that microscopy images are typically much noisier than CT or MRI images. Furthermore, since exci- tation of fluorescence also destroys fluorophores through photobleaching, the signal-to-noise ratio decreases with the collection of each focal plane of an image volume. Con- sequently, microscopy image volumes are usually very sensitive to small changes in rendering parameters, such as the rendering transfer functions which map image intensity values to colors, opacities, or shading parameters. Thus, ordinary volume visualization algorithms frequently fail to capture the delicate structures present in many cellular objects. Second, structures in the microscopic scale typi- cally show higher complexity than those of the anatomic organs in CT or MRI images. This is particularly true in Address for reprints: Shiaofen Fang Department of Computer and Information Science Indiana University Purdue University Indianapolis 723 West Michigan Street, SL 280 Indianapolis, IN 46202, USA email: [email protected]
-
Upload
trinhxuyen -
Category
Documents
-
view
215 -
download
0
Transcript of Three-Dimensional Microscopy Data Exploration by Interactive Volume...

SCANNING VOL. 22, 218–226 (2000) Received: January 10, 2000© FAMS, Inc. Accepted: April 20, 2000
Three-Dimensional Microscopy Data Exploration by Interactive VolumeVisualization
SHIAOFEN FANG, YI DAI, FREDERICK MYERS, MIHRAN TUCERYAN, KENNETH DUNN*
Department of Computer and Information Science, Indiana University Purdue University Indianapolis; *Department ofMedicine, Division of Nephrology, School of Medicine, Indiana University, Indianapolis, Indiana, USA
Summary: This paper presents a new volume visualizationapproach for three-dimensional (3-D) interactive micro-scopy data exploration. Because of their unique imagecharacteristics, 3-D microscopy data are often not able tobe visualized effectively by conventional volume visual-ization techniques. In our approach, microscopy visual-ization is carried out in an interactive data explorationenvironment, based on a combination of interactive volumerendering techniques and image-based transfer functiondesign methods. Interactive volume rendering is achievedby using two-dimensional (2-D) texture mapping in aShear-Warp volume rendering algorithm. Image process-ing techniques are employed and integrated into the rendering pipeline for the definition and searching of appro-priate transfer functions that best reflect the user’s visual-ization intentions. These techniques have been imple-mented successfully in a prototype visualization system onlow-end and middle-range SGI desktop workstations. Sinceonly 2-D texture mapping is required, the system can alsobe easily ported to PC platforms.
Key words: three-dimensional microscopy, visualization,volume rendering, texture mapping, image processing
PACS: 07.05 Rm, 07.05.Pj
Introduction
In the past 20 years, microscopy has come to play anincreasingly important role in the study of cell biology. Theadvances in biochemistry and molecular biology have gen-erated an increased appreciation of the cellular organiza-tion of the biochemical components of a cell. Althoughadvances in confocal microscopy and image deconvolution
have made it feasible to collect high-resolution (Dunn etal. 1994, Shaw 1995), three-dimensional (3-D) image vol-umes of thick samples such as epithelial cells, applicationof this technology to 3-D imaging is still in its infancy.Indeed, the proliferation of 3-D microscopy in cell biologyhas generated vast amounts of image data that have notbeen sufficiently explored and analyzed.
The rapid advances in computer graphics and visual-ization, in particular volume visualization, have provideda great potential for the visualization of 3-D microscopyimages. Volume visualization is a new 3-D computer graph-ics technique that is concerned with the abstraction, inter-pretation, rendering, and manipulation of large volumedatasets. Volume-rendering algorithms, for instance, candirectly display the entire volume dataset through semi-transparent images and allow the viewer to peer inside theinternal structures of the image volume for truly 3-D dataviewing and analysis. Although volume visualization meth-ods and tools have been used in many scientific and med-ical applications, such as visual simulations and computedtomography/magnetic resonance imaging (CT/MRI), itsapplications in 3-D microscopy are limited and largelyineffective. This is mainly because current volume visual-ization techniques are mostly designed for CT/MRI typesof images and are poorly suited for 3-D microscopy appli-cations. Several unique characteristics of microscopy datapose serious challenges to conventional visualization tech-niques.
First, fluorescently labeled samples characteristicallyhave low signal levels, sometimes consisting of a singlephoton, so that microscopy images are typically muchnoisier than CT or MRI images. Furthermore, since exci-tation of fluorescence also destroys fluorophores throughphotobleaching, the signal-to-noise ratio decreases with thecollection of each focal plane of an image volume. Con-sequently, microscopy image volumes are usually verysensitive to small changes in rendering parameters, such asthe rendering transfer functions which map image intensityvalues to colors, opacities, or shading parameters. Thus,ordinary volume visualization algorithms frequently fail tocapture the delicate structures present in many cellularobjects. Second, structures in the microscopic scale typi-cally show higher complexity than those of the anatomicorgans in CT or MRI images. This is particularly true in
Address for reprints:
Shiaofen FangDepartment of Computer and Information ScienceIndiana University Purdue University Indianapolis723 West Michigan Street, SL 280Indianapolis, IN 46202, USAemail: [email protected]

multiparameter images, in which several different proteinswill be imaged simultaneously, each in a specific color offluorescence. A third problem is that the structures of theobjects to be examined are often partially or entirelyunknown. This leads to the strong need for interactive nav-igation and searching capabilities in both the spatial dimen-sions and the transfer function space.
Due to these special characteristics, 3-D microscopyvisualization is best performed in a data exploration envi-ronment in which users can interactively manipulate,search, and render 3-D microscopy images for their indi-vidual visualization goals. Two key technical requirementsfor such a visualization environment are interactivity andtransfer function design.
Data exploration is intrinsically a continuous and inter-active process. Although many surface rendering and vol-ume rendering algorithms have been developed (Lacrouteand Levoy 1994; Levoy 1988, 1990; Lorensen and Cline1987; Upson and Keeler 1988; Westover 1990), they havenot been able to provide interactive rendering speed tosupport interactive data exploration. In fact, interactivevolume visualization can currently only be obtained usingeither supercomputers (Parker et al. 1988) or special hard-ware systems, which are not available on common desk-top computers. The most popular hardware solution isusing 3-D texture mapping hardware which is only avail-able on high-end graphics workstations such as SGI’s Onyxsystems (Mountain View, Calif.) (Cabral et al. 1994, SGITechnical Publications 1998). A recently released hardwarechip, VolumePro, by Mitsubishi (Irvine, Calif.) also pro-vides real-time volume rendering, but with considerableadditional hardware cost. Furthermore, VolumePro does notsupport perspective projection, which is essential in dataexploration applications. These limitations severely restrictthe usability of volume visualization in 3-D microscopy.Thus, our first goal is to develop a low-cost technique forinteractive volume rendering that uses only existing hard-ware features on common desktop computers.
Another important component of data exploration is thesearching for the right transfer functions that best reflectthe users’ visualization intentions. The transfer functiondesign problem is particularly important and difficult withnoisy and unfamiliar data sets, but has not received suffi-cient research attention. Most current visualization systemsemploy a trial-and-error approach, which is extremely dif-ficult and time consuming for microscopy data. Moreimportant, visualization results obtained this way dependlargely on the user’s experience and “luck,” and can leadto confusing, misleading, and dubious data interpretations.A previous effort in improving the transfer function search-ing is rather limited. One approach is the evolution-basedinverse design approach (He et al. 1996, Marks et al. 1997),which uses a stochastic search technique to generate manyimage samples based on an initial population of predefinedtransfer functions, and then improves the samples based onthe user’s selections of the sample images at each evolu-tion step. Although this approach provides some level of
heuristics for transfer function searching, it is still a verytime-consuming process and does not support complicatedor procedural transfer functions that cannot be representedby the predefined function combinations. Another relatedwork (Kindlmann and Durkin 1998) uses gradient-basededge detection methods to render volumes in which regionsof interest are the boundaries between different materials.The image-based transfer function design approach in thispaper is based on a more systematic use of 3-D image pro-cessing techniques (Fang et al. 1998) of which the approachin Kindlmann and Durkin (1998) is a special case. In ourapproach, image processing procedures are integrated intothe visualization pipeline so that the users can interac-tively adjust the parameters of the image processing oper-ators for desired and predictable results.
Methods
Interactive 3-D microscopy data exploration can beachieved through a combination of interactive volume ren-dering and intuitive transfer function design. Technicaldetails of this approach will be given in this section. Theseinclude a new interactive volume rendering algorithm usingtwo-dimensional (2-D) texture mapping and a transferfunction design method based on image processing oper-ations.
Interactive Volume Rendering by Two-Dimensional Tex-ture Mapping
This algorithm applies 2-D texture mapping in a shear-warp based volume rendering process to achieve interactivespeed. There are two important advantages in using 2-D tex-ture mapping over other software- and hardware-basedmethods. First, 2-D texture mapping is normally imple-mented in hardware, and therefore is faster than equivalentoperations using CPU computations. Second, unlike 3-Dtexture mapping hardware that is only available on selectedhigh-end graphics workstations, hardware-implemented 2-D texture mapping is widely available and is usually a stan-dard feature on most desktop workstations and personalcomputers. Combining 2-D texture mapping and a shear-warp factorization technique, we are able to achieve inter-active volume rendering without special hardware require-ments.
Volume rendering using shear-warp factorization wasfirst proposed in Cameron and Undrill (1992) and later opti-mized in Lacroute and Levoy (1994). Although the algo-rithm given in Lacroute and Levoy (1994) is one of thefastest, it still does not provide interactive rendering per-formance. More important, the algorithm carries two lim-itations that make it unsuitable for data exploration appli-cations: (1) the algorithm slows down considerably whenusing perspective projection, and (2) it requires an expen-sive preprocessing step for data classification with everychange of the transfer function. Unfortunately, both the per-
S. Fang et al.: 3-D microscopy data exploration by interactive volume visualization 219
texture mapping process involves the resampling compu-tation (by hardware), this is a much faster operation thana CPU-only solution, as shown in Figure 1.
As in the original shear-warp algorithm (Lacroute andLevoy 1994), three sets of the slices of the volume need tobe defined for the three different major viewing axes. Thepolygon of each slice can be generated on-the-fly duringrendering, but its texture image needs to be predefinedand stored in the system for fast texture mapping. Sinceboth parallel and perspective viewings of polygons arehandled automatically by the graphics subsystem, there isvirtually no speed difference between parallel and per-spective projections. Unlike the algorithm given in Lacrouteand Levoy (1994), where special data structures (e.g., run-length encoding) need to be reconstructed every time thetransfer function is modified, the new algorithm extracts thetexture images directly from the original data set, inde-pendent of the transfer functions, and therefore does notrequire extra preprocessing when editing the transfer func-tions. Finally, the warping step can also be convenientlycarried out by 2-D texture mapping.
This algorithm, however, has two drawbacks.Memory requirements: Since no data compression is
employed for the three sets of texture images, memoryrequirements are large. For instance, a 2563 volume wouldrequire over 48 MB memory. A similar amount of mem-ory is required for typical microscopy data sets of size 512× 512 × 64. However, since memory price has been drop-ping at a faster pace than other hardware components, thismay not be a major concern for most users.
Lack of shading: Two-dimensional texture mapping cannot efficiently support shading that displays more realisticsurface features. Thus, our algorithm does not generateshaded images, which may result in a loss of quality for sur-face-rich data sets. However, this does not appear to be amajor problem with microscopy data sets in which surfacesare normally not well defined due to the nature of floures-cently labeled samples.
Image-Based Transfer Function Design
The need for transfer function design comes from thedynamic and often subjective visualization goals andrequirements in microscopy data exploration, where theusers need to search and manipulate the transfer functionsinteractively in the visualization process to view differenttypes of substructures, surfaces, and frequencies with dif-ferent visual attributes. Thus, an intuitive and efficient trans-fer function model is essential for this type of problem.
Transfer functions: A transfer function is a function ora procedure defined over the intensity-spatial domain of avolume data set. It computes a new intensity value foreach sample point in the volume space during rendering.It can also be applied to the voxel points of the entire vol-ume to reconstruct a new volume. The intensity valuesgenerated from a transfer function can be further mappedto color and opacity values using a color look-up table, rep-
220 Scanning Vol. 22, 3 (2000)
spective viewing and the continuous change of transferfunction are crucial features in data exploration.
Shear-warp algorithm is based on the shear-warp fac-torization of the viewing matrix:
M = P · S · W
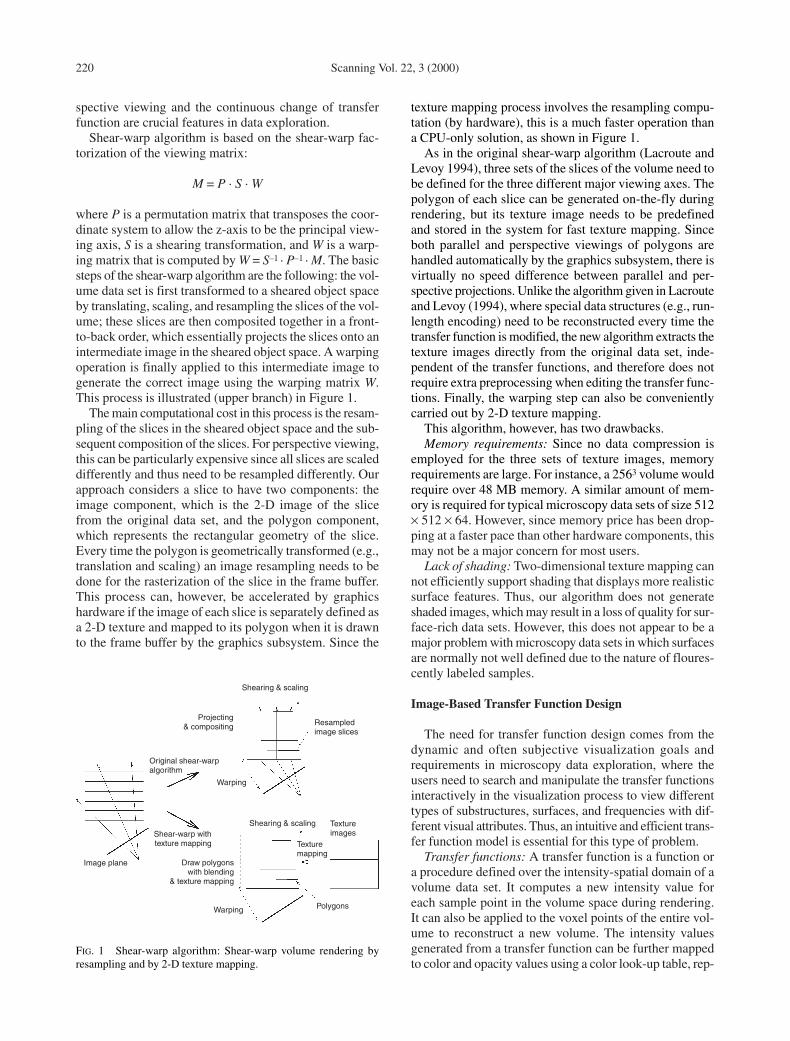
where P is a permutation matrix that transposes the coor-dinate system to allow the z-axis to be the principal view-ing axis, S is a shearing transformation, and W is a warp-ing matrix that is computed by W = S–1 · P–1 · M. The basicsteps of the shear-warp algorithm are the following: the vol-ume data set is first transformed to a sheared object spaceby translating, scaling, and resampling the slices of the vol-ume; these slices are then composited together in a front-to-back order, which essentially projects the slices onto anintermediate image in the sheared object space. A warpingoperation is finally applied to this intermediate image togenerate the correct image using the warping matrix W.This process is illustrated (upper branch) in Figure 1.
The main computational cost in this process is the resam-pling of the slices in the sheared object space and the sub-sequent composition of the slices. For perspective viewing,this can be particularly expensive since all slices are scaleddifferently and thus need to be resampled differently. Ourapproach considers a slice to have two components: theimage component, which is the 2-D image of the slicefrom the original data set, and the polygon component,which represents the rectangular geometry of the slice.Every time the polygon is geometrically transformed (e.g.,translation and scaling) an image resampling needs to bedone for the rasterization of the slice in the frame buffer.This process can, however, be accelerated by graphicshardware if the image of each slice is separately defined asa 2-D texture and mapped to its polygon when it is drawnto the frame buffer by the graphics subsystem. Since the
FIG. 1 Shear-warp algorithm: Shear-warp volume rendering byresampling and by 2-D texture mapping.
Shearing & scaling
Shearing & scaling
Polygons
Resampledimage slices
Warping
Warping
Image plane
Projecting& compositing
Draw polygonswith blending
& texture mapping
Shear-warp withtexture mapping
Original shear-warp algorithm
Texture mapping
Texture images
S. Fang et al.: 3-D microscopy data exploration by interactive volume visualization 221
resenting a piecewise linear mapping for each color/opac-ity component. We call this step the coloring step. Since anintensity volume is essentially a 3-D intensity image, atransfer function can be naturally considered to be animage-processing problem. In this model, a transfer func-tion, F: ν→ν, is defined as a sequence of mappings:
where ν is the volume data space, and fi: ν→ν correspondto a sequence of image processing procedures with ad-justable parameters. This sequence and its parameter setuniquely define one transfer function in the transfer func-tion space. For computational simplicity, fi is restricted tobe one of the following two types of mappings:
1. Intensity table. It is an intensity-to-intensity look-uptable representing a piecewise linear function over thevolume’s intensity field.
2. Neighborhood function. It is a function computedfrom the intensity values in an m × m × m neighbor-hood of a given voxel, where the neighborhood size,m, is an adjustable parameter of the transfer function.A median filter (Rosenfeld and Kak 1982), for in-stance, can be considered as a neighborhood function.A more typical example is the 3-D spatial convolution,as a 3-D linear filter of a volume V with an m × m × mmask T:
Some higher order image processing operations, such asdilation/erosion and anisotropic diffusion (Perona and
f x y z T i j k V x i y j z ki j k
m
m
( , , ) [ , , ] [ , , ]= ⋅ + + +=−
∑, ,
2
2
F f f f fn n= −o oLo o1 2 1
Malik 1990), cannot be directly represented as a neigh-borhood function; but these operations are normally appliedin some precomputation processes for the definitions ofsimpler functions.
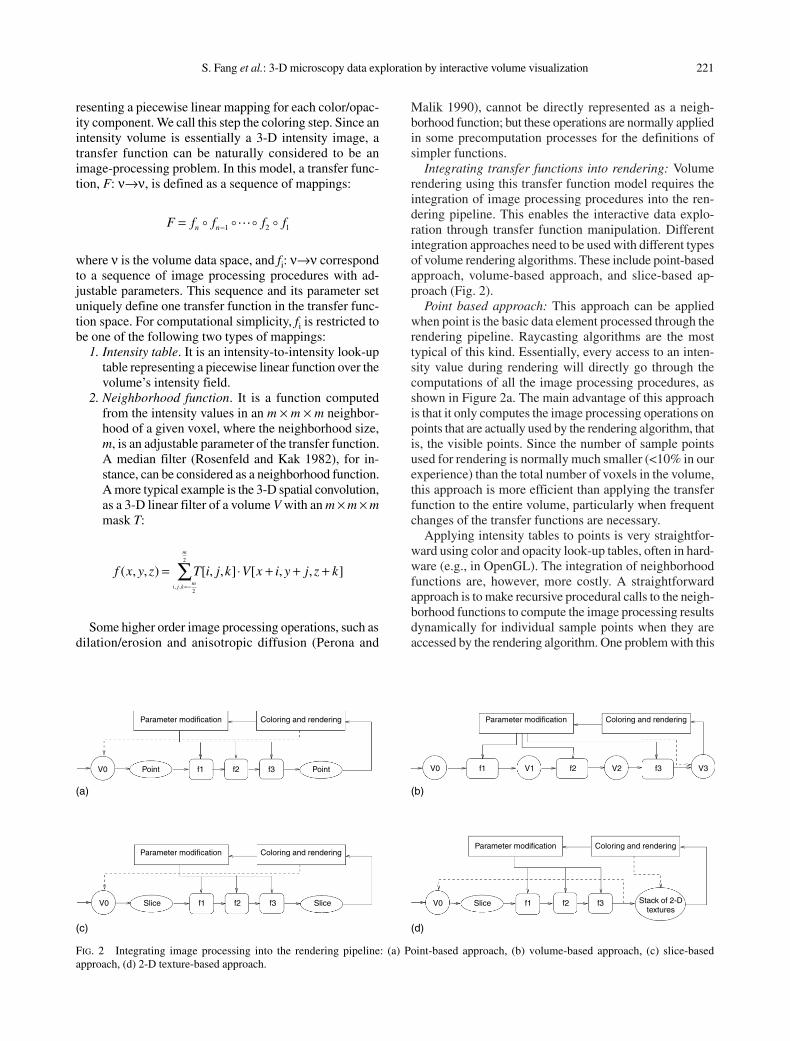
Integrating transfer functions into rendering: Volumerendering using this transfer function model requires theintegration of image processing procedures into the ren-dering pipeline. This enables the interactive data explo-ration through transfer function manipulation. Differentintegration approaches need to be used with different typesof volume rendering algorithms. These include point-basedapproach, volume-based approach, and slice-based ap-proach (Fig. 2).
Point based approach: This approach can be appliedwhen point is the basic data element processed through therendering pipeline. Raycasting algorithms are the mosttypical of this kind. Essentially, every access to an inten-sity value during rendering will directly go through thecomputations of all the image processing procedures, asshown in Figure 2a. The main advantage of this approachis that it only computes the image processing operations onpoints that are actually used by the rendering algorithm, thatis, the visible points. Since the number of sample pointsused for rendering is normally much smaller (<10% in ourexperience) than the total number of voxels in the volume,this approach is more efficient than applying the transferfunction to the entire volume, particularly when frequentchanges of the transfer functions are necessary.
Applying intensity tables to points is very straightfor-ward using color and opacity look-up tables, often in hard-ware (e.g., in OpenGL). The integration of neighborhoodfunctions are, however, more costly. A straightforwardapproach is to make recursive procedural calls to the neigh-borhood functions to compute the image processing resultsdynamically for individual sample points when they areaccessed by the rendering algorithm. One problem with this
FIG. 2 Integrating image processing into the rendering pipeline: (a) Point-based approach, (b) volume-based approach, (c) slice-basedapproach, (d) 2-D texture-based approach.
Parameter modification
V0 Point f1 f2 f3 Point
V0 Slice f1 f2 f3 Slice V0 Slice f1 f2 f3
V0 V1 V2 V3f1 f2 f3
Stack of 2-Dtextures
Coloring and rendering Parameter modification Coloring and rendering
Parameter modification Coloring and renderingParameter modification Coloring and rendering
(a) (b)
(c) (d)
process, however, is the potentially repeated computationwith multiple neighborhood functions. Since each voxelcan fall into the neighborhoods of several other voxels, itmay therefore be accessed (and computed) multiple timeswhen more than one neighborhood functions exist in atransfer function. When the number of neighborhood func-tions in a sequence is large, such overhead can be signifi-cant. Fortunately, the problem can be alleviated by apply-ing some buffering mechanism to store the intermediateresults of each computed sample point for possible repeataccesses. For instance, a buffer can be used for each neigh-borhood function to store the results of all sample pointsgoing through this function. This way, the overhead can bepartially or entirely eliminated.
Volume-based approach: In this approach, the neigh-borhood function procedures in the transfer function areapplied to the entire volume to generate a sequence ofintermediate volumes, with the final volume passed to thecoloring step, as shown in Figure 2b. This approach issuitable for rendering algorithms that do not have totalcontrol and access to individual voxels of the data set (orare inefficient to do so). The most typical case is the vol-ume-rendering approach using 3-D texture mapping. Whenthe 3-D texture mapping is implemented in hardware, thetransfer function computation cannot be easily insertedinto the texture mapping pipeline. In this case, applying thetransfer function at the volume level is more practical andefficient. Since 3-D texture mapping-based algorithms donot normally have early termination control (Levoy 1990)for avoiding computing points that no longer contribute tothe image, a point-based approach does not really have aclear advantage in this case. The implementation of thisapproach is also simpler since the image processing andvolume rendering are decoupled. For instance, special ren-dering hardware, such as the VolumePro chip by Mitsubishimay be used following the transfer function computation.
Slice-based approach: This approach applies the trans-fer function to one slice of the volume at a time, as shownin Figure 2c; it is suitable for algorithms that access the vol-ume in a slice-by-slice order. Our 2-D texture mapping-based shear-warp algorithm belongs to this category. Some3-D texture mapping-based algorithms can also be classi-fied into this category. For instance, in the algorithm givenin Cabral et al. (1994) images are formed by the texturemapping and blending of Z-planes, which are essentiallyresampled 2-D slices that are perpendicular to the view-ing direction. Compared with the volume-based approach,the slice-based approach uses less memory and is alsomore efficient and flexible when the algorithm needsdynamic determination of the sampling resolutions of theslices and the number of slices to be sampled based on run-time conditions; that is, only the samples that are actuallyused by the rendering procedure are computed by thetransfer function.
In practice, once a transfer function is defined, its ren-dering result often needs to be examined from many dif-ferent angles before a change is made to the transfer func-
tion. Thus, it is important to be able to reuse the transferfunction results for a sequence of renderings. This can bedone naturally with our 2-D texture mapping-based shear-warp algorithm. Essentially, each slice is computed by thetransfer function before it is saved as a 2-D texture. Thus,the rendering process only communicates with the 2-Dtexture images generated from the slices, and each changeof the transfer function requires a reloading of the 2-D tex-ture images. This process is shown in Figure 2d. Hardwareacceleration is also possible for image processing compu-tation. In our implementation, the ImageVision system onSGI workstations is used to compute chains of image pro-cessing operations. Since ImageVision takes advantage ofthe system’s graphics hardware whenever possible, it isusually faster than pure software implementation. Otherreal-time image processing solutions are also availablesuch as the DSP-based image processing chips by TexasInstruments (Dallas, Tex.).
Image enhancement for data filtering: In this image-based transfer function model, we mainly focus on twotypes of operations: image enhancement and boundarydetection. The goal of image enhancement is to improve thequality of the 3-D image volume for better visual appear-ance, based on the user’s visualization goals; that is, it isbasically a data filtering mechanism. Two types of imageenhancement techniques are commonly used: point en-hancement and spatial enhancement.
A point enhancement operation applies some functionto each intensity value individually to generate a new value.Since the result of a point enhancement operation onlydepends on the intensity value of the point to which it isapplied, the corresponding intensity mapping can be rep-resented as an intensity table in our transfer function model.The most common point enhancement operation is inten-sity modifications, in which the intensity curve of the inputvolume is altered in certain intensity intervals to increaseor reduce the exposure of the corresponding regions. Sim-ilar modification scan also be applied to the histogramcurve (e.g., histogram equalization). Although the para-meters of such operations ( e.g., the intensity intervals) canbe defined and adjusted directly by the users, they morelikely will come from the output of some other image pro-cessing procedures, such as boundary detections, in a visu-alization process.
A spatial enhancement operation derives the new inten-sity value of a given point from its neighborhood points,that is, the result is neighborhood dependent. Therefore,spatial enhancement operations can only be represented asneighborhood functions in our transfer function model. Ingeneral, spatial operations can be classified into smooth-ing and sharpening operations.
Smoothing operations are primarily used to removeimage noise. We sometimes also want to remove verysmall feature details for better presentation of the larger fea-tures. One example is the median filter that returns themedian intensity value in an m × m × m neighborhood.However, more typical smoothing operators are often rep-
222 Scanning Vol. 22, 3 (2000)
S. Fang et al.: 3-D microscopy data exploration by interactive volume visualization 223
resented as 3-D convolutions with spatial lowpass maskswhich filter out high-frequency image components. Themask represents a weighted average of the intensity valuesin a m × m × m neighborhood of each point in the volume.In addition to the mask size m, several other parametersmay also be defined to adjust the level of smoothing andblurring by manipulating the weights for the averaging. Oneexample is the 3-D Gaussian smoothing defined by aGaussian mask with parameters σ1, σ2, σ3 ∈ (0, +∞):
Sharpening operations aim to enhance geometric fea-tures by emphasizing the high-frequency components of theimages. This can be achieved by applying a highpass fil-ter, such as the Laplacian-type filter
to the image volume. Another useful operation is theunsharp masking that blends the low-frequency componentand high-frequency component of an image volume, wherethe weights of the linear combination are adjustable para-meters and represent the level of sharpening it generates.Again, most of these highpass filters can be represented byconvolution masks as neighborhood functions.
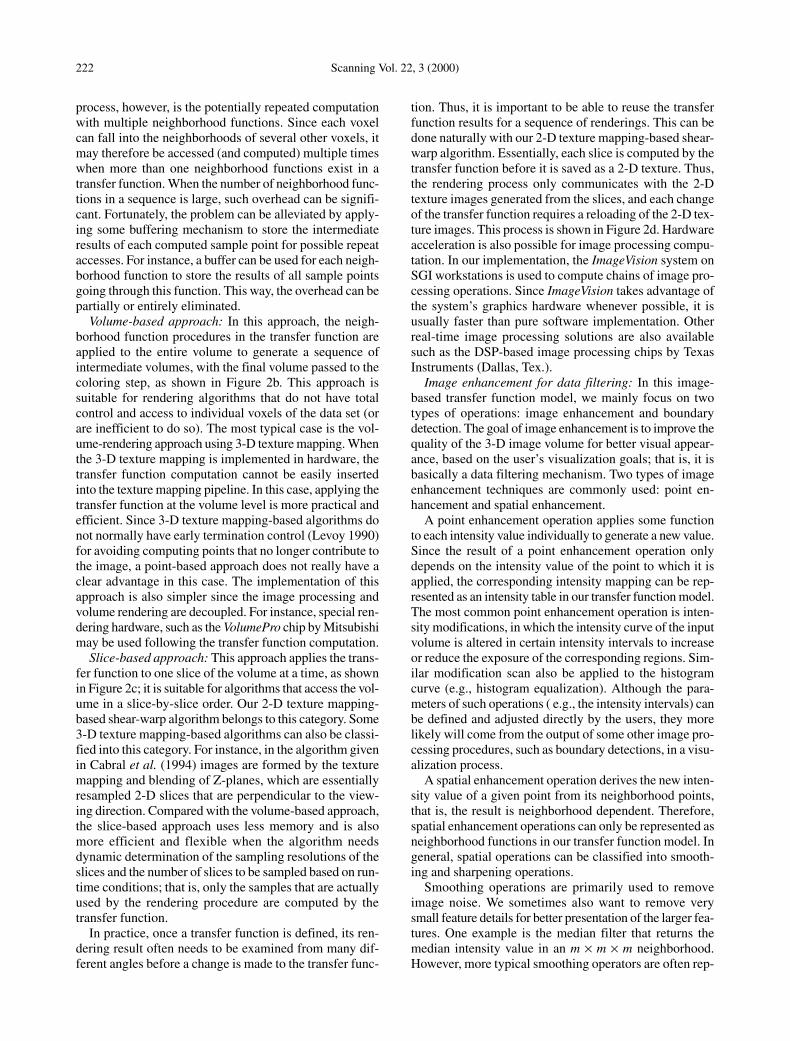
An example is shown in Figure 3 where the structure inan actin filament volume is visualized through enhance-ment operations.
Boundary detection for surface rendering: Boundarydetection operation finds the surface boundary voxels toderive the appropriate transfer function or thresholds forsurface rendering. Most 2-D edge detection algorithmscan be extended for 3-D boundary detection. Many ofthese algorithms employ some convolution masks to com-
f x y z g x y z g x y z( , , ) ( , , ) ( , , )= − ∇2
T i, j,k ei2
[ ] =− + +
2 2 21
2
2
22
2
32σ σ σ
j k
pute the discrete approximations of some differential oper-ators to measure the rates of changes of the intensity field(gradients), and then classify surface boundary voxelsbased on a magnitude thresholding of the gradient values.More sophisticated edge detection algorithms have alsobeen developed in Computer Vision (Perona and Malik1990).
Iso-surface-based approach: Iso-surface renderingrequires predefined iso-values to identify the iso-surfaces.Unfortunately, these iso-values are often not known inadvance. Using the image-based approach, we can applyan edge detection operator to derive these iso-values auto-matically for iso-surface rendering. Note that extraction ofthe iso-surfaces (Lorensen and Cline 1987) is not neces-sarily needed. For instance, we can define a transfer func-tion through intensity modification that renders only alayer of the surface voxels, defined by some narrow inten-sity intervals surrounding these iso-values.
To derive the iso-values, a histogram of all the bound-ary voxels from the boundary detection operator is first gen-erated. The intensity values at which the histogram reacheslocal maxima can then be used as the surface iso-values.A smoothing operation (e.g., Gaussian smoothing) mayneed to be applied to the histogram first to remove noises.It should be mentioned that, with this approach, both theboundary detection and histogram analysis are precompu-tations of the actual rendering process. It is, therefore, pos-sible to apply higher order edge detection operations in thisprocess. By setting different scales of parameters in theboundary detection process, a set of multiscale iso-valuescan also be precomputed, and then used to define a set ofmultiscale transfer functions (as simple intensity tables) fordifferent levels of surface rendering in data exploration.
Dynamic boundary detection-based approach: A secondapproach in using boundary detection for surface render-ing is the direct application of a boundary detection oper-ation to each sample point when it is accessed by the ren-dering algorithm. This allows the rendering algorithm to
FIG. 3 A fluorescently labeled actin filaments volume: (a) Volume rendering by a linear ramp transfer function, (b) Laplacian masking fol-lowed by unsharp masking with γ=3, (c) Laplacian masking followed by unsharp masking with γ=10.
(b)(a) (c)

224 Scanning Vol. 22, 3 (2000)
determine dynamically whether or not a sample pointbelongs to a surface boundary for appropriate renderingactions. With this approach, only simple boundary detec-tion methods (e.g., convolution mask-based detectors)ought to be applied for speed reasons. This approach is par-ticularly useful for surfaces that cannot be simply definedas iso-surfaces. One example is the photobleaching effectin fluorescence microscopy, where the entire depth of thesample is illuminated with light that both excites anddestroys fluorophores through photo-oxidation. When oneattempts to collect serial optical sections of a sample vol-ume, the images are characterized by an increase in theamount of photobleaching of each sequential plane, suchthat the same material may have different intensity valuesin different slices. In these cases, the boundaries may needto be identified using more sophisticated edge detectionmethods, and the data gradient is a more effective measureof surfaces than the iso-value. As a very simple example,the magnitudes of gradients may be proportionally mappedto the opacity values in the opacity transfer function to
emphasize high-gradient regions for surface renderingeffect. A gradient thresholding may also be used to renderonly the high gradient voxels. In general, this approachrequires the intensity mappings for transfer function defi-nition to be represented as neighborhood functions and istherefore more expensive than the iso-surface-basedapproach.
An example is shown in Figure 4 where the surfaces ina Golgi Complex volume are visualized through both iso-surface rendering and dynamic boundary detection. Theiso-value is determined using the histogram curve of theboundary points.
Results
Using the techniques described in this paper, we havedeveloped an integrated system, called IVIE, for the inter-active visualization and imaging of volume data sets.Although IVIE is designed for general volume data, it is
FIG. 4 Surface rendering of a Golgi complex: (a) Volume rendering by a linear ramp; (b) the histogram of boundary points; (c) iso-surface ren-dering with an iso-value 87, obtained from (b); (d) surface rendering by dynamic boundary detection.
(a) (c)
(b) (d)
S. Fang et al.: 3-D microscopy data exploration by interactive volume visualization 225
particularly suitable for noisy and complex data sets, suchas 3-D microscopy data volumes, that require sophisti-cated transfer functions and interactive data exploration.The system is written in C++ and OpenGL 1.1, and is cur-rently implemented on SGI OCTANE and O2 workstations.Since only 2-D texture mapping hardware is used, it canbe easily ported to PC platforms. Interactive volume ren-dering is achieved using the 2-D texture mapping based
shear-warp algorithm described in the section titled “Inter-active Volume Rendering by 2-D Texture Mapping.” Thealgorithm requires a 128 MB main memory to run 2563
sized volumes. Unlike the original shear-warp algorithm,this system shows no speed difference between parallel andperspective projections. On an SGI OCTANE workstationwith 128 MB main memory and 4 MB texture memory, weare able to volume render a 256 × 256 × 64 data set at a 7
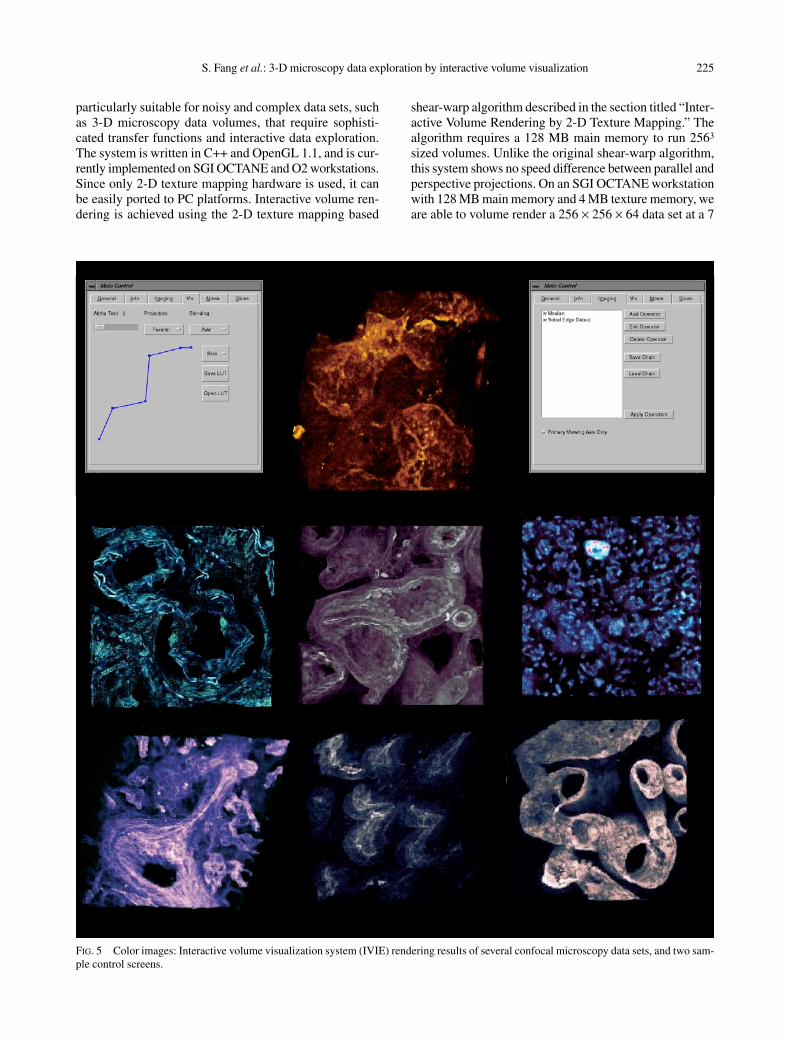
FIG. 5 Color images: Interactive volume visualization system (IVIE) rendering results of several confocal microscopy data sets, and two sam-ple control screens.
tions in IVIE is not yet interactive. We would like to inves-tigate new image processing solutions (possibly hardwareenhanced) to achieve truly interactive transfer functiondesign. Since the graphics accelerators on PCs often havevery large 2-D texture memory, we expect that the perfor-mance of our volume rendering algorithm on PCs will beeven better.
References
Cabral B, Cam N, Foran J: Accelerated volume rendering and tomo-graphic reconstruction using texture mapping hardware. In Proc.1994 Symposium on Volume Visualization, 91–98, October(1994)
Cameron GG, Undrill PE: Rendering volumetric medical imagesdata on a simd-architecture computer. In Proc. 3rd Eurograph-ics Workshop on Rendering, 135–145, May (1992)
Dunn K, Mayor S, Meyer J, Maxfield F: Applications of ratio fluo-rescence microscopy in the study of cell physiology. FASEB J8, 573–582 (1994)
Fang S, Biddlecome T, Tuceryan M: Image-based transfer functiondesign for data exploration in volume visualization. In Proc.IEEE Visualization ‘98, 319–326, October (1998)
He T, Hong L, Kaufman A, Pfister H: Generation of transfer func-tions with stochastic search techniques. In IEEE Visualization96, 227–234, October (1996)
Kindlmann G, Durkin J: Semi-automatic generation of transfer func-tions for direct volume rendering. In IEEE/ACM 1998 Sympo-sium on Volume Visualization (1998)
Lacroute P, Levoy M: Fast volume rendering using a shear-warp fac-torization of the viewing transformation. SIGGRAPH ’94,451–458 (1994)
Levoy M: Display of surfaces from volume data. IEEE ComputerGraphics and Application, 8(3), 29–37, May (1988)
Levoy M: Efficient ray tracing of volume data. ACM Trans on Graph-ics, 9(3), 245–261, July (1990)
Lorensen WE, Cline HE: Marching cubes: A high resolution 3D sur-face construction algorithm. Computer Graphics, SIGGRAPH’87, 21(4), 163–169, July 1987
Marks J, Andalman B, Beardsley PA, Freeman W, Gibson S, Hod-gins J, Kang T, Mirtich B, Pfister H, Ruml W, Ryall K, SeimsJ, Shieber S: Design galleries: A general approach to settingparameters for computer graphics and animation. In SIGGRAPH’97, 389–400 (1997)
Parker S, Shirley P, Livnat Y, Hansen C, Sloan P: Interactive ray trac-ing for isosurface rendering. In Proc. IEEE Visualization ’98,233–238 (1998)
Perona P, Malik J: Scale-space and edge detection using anisotropicdiffusion. IEEE Trans Pattern Analysis and Machine Intelli-gence, 12(7) 629–639 (1990)
Rosenfeld A, Kak A: Digital Picture Processing. Academic Press(1982)
SGI Technical Publications. Open GL Volumizer Programmer’sGuide. SGI (1998)
Shaw PJ: Comparison of wide-field/deconvolution and confocalmicroscopy for 3D imaging. In Handbook of Biological Con-focal Microscopy, 2nd Edition, (1995) 373–387
Upson C, Keeler M: V-buffer: Visible volume rendering. ComputerGraphics, SIGGRAPH ’88, 22(4), 59–64, August (1988)
Westover L: Footprint evaluation for volume rendering. ComputerGraphics, SIGGRAPH ’90, 24(4) 367–376, August (1990)
226 Scanning Vol. 22, 3 (2000)
frames/s rate. The frame rate is reduced to 5 frames/s onan SGI O2 workstation with 128 MB main memory and 1MB texture memory. Such frame rates allow users to rotateand zoom in/out interactively with full volume renderingresolution. For an even better frame rate, IVIE also providesan adaptive rendering option that automatically adjusts thenumber of slices (2-D textures) to be used for renderingwhen the object is in motion. Since loss of resolution dur-ing motion is normally less noticeable, it is a very effec-tive feature for smooth animation and motion.
Two image processing libraries are used in IVIE. Thefirst is a software toolkit we wrote using C++ for both 2-D and 3-D image processing operations. The second is theImageVision library by SGI. Since ImageVision takesadvantages of some hardware features through OpenGL,it is faster than our software implementations. On the otherhand, it is only available on SGI workstations, and wouldneed to be replaced by either a software library or somehardware image processing chips if the system is ported toa PC platform. For 256 × 256 × 64 volumes, the transferfunction computation without ImageVision takes from 6 to170 s for each filter. It is about twice as fast if ImageVisionwere used. Although the image processing computationusing ImageVision is very fast, the majority of the time forthe transfer function process is spent on building and load-ing the 2-D texture objects rather than on the image pro-cessing itself.
The front end of IVIE is a graphical user interface witha rendering window and a control panel that includes anumber of control screens for controlling different systemfunctions, such as volume rendering, 2-D and 3-D imageprocessing, color and opacity map manipulation, trans-parency adjustment, movie making, and slice-based oper-ations. Some sample control screens and rendering imagesgenerated by IVIE are shown in Figure 5.
Conclusions
An interactive volume visualization system, IVIE, for 3-D microscopy images is described. Two new techniques areemployed in this system: interactive volume rendering by2-D texture mapping and transfer function design usingimage processing operations. They form the basis of aninteractive volume data exploration environment that isparticularly suitable for 3-D microscopy data sets. Thesystem is intentionally designed to avoid using advancedgraphics hardware features such as 3-D texture mapping.Thus, it can be easily implemented on PC platforms andother low-end workstations. Future work will be focusedon the performance enhancement of the image processingcomputation and the PC implementation of the IVIE sys-tem. Currently, the speed of the image processing opera-