Three Aspects of Globalization: Liberalization, Financial Integration
133
Transcript of Three Aspects of Globalization: Liberalization, Financial Integration
Three Aspects of GlobalizationLiberalization, Financial Integration,and Multinational Organization
Inaugural-Dissertationzur Erlangung des Grades
Doctor oeconomiae publicae (Dr. oec. publ.)an der Ludwig-Maximilians-Universität München
2009
vorgelegt vonLinda Rousová
Referentin: Prof. Dr. Dalia MarinKorreferent: Prof. Dr. Joachim WinterPromotionsabschlussberatung: 19. Mai 2010

Acknowledgements
While writing this thesis I have received support and encouragement from numerouspeople. First of all, I would like to thank to my supervisor Prof. Dalia Marin whosehelpful advice, continual encouragement, and academic guidance made this disserta-tion possible. Working jointly with her was extremely inspiring and I have learned alot. I also appreciate her generous support as my mentor within the LMU MentoringProgram. Secondly, I would like to thank Prof. Joachim Winter from whom I receivedprecious feedback while presenting in his internal seminars and who agreed to act asmy co-supervisor. I am also grateful to Prof. Stefan Mittnik, whom I was happy tohave as my third examiner.
Furthermore, I would like to thank Roberta Piermartini, who was my kind super-visor during my internship at the WTO and who involved me in the project on the airservices sector of which Chapter 3 is a part. I am also indebted to Antonia Carzanigaand Pierre Latrille for initiating this work and for their valuable contributions.
The Munich Graduate School of Economics (MGSE) was a very stimulating envi-ronment in which to work and I had the opportunity to meet many kind and interestingpeople who made writing this thesis less dicult and more fun. In particular, I thankAndré Ebner, Rainer Lanz, Christian Schulte, Joachim Klein, and Matthias Zehet-mayer for their ongoing help, encouragement, and valuable comments on my researchas well as for the good time I had with them. Comments on Chapter 2 by Prof. JarkoFidrmuc and Prof. Gebhard Flaig were also highly appreciated. Financial supportfrom the Deutsche Forschungsgemeinschaft (DFG) is also gratefully acknowledged.
Many thanks go to my colleagues at the Chair of International Economics for theirsupport and challenging discussions over coee: Ivan Andreev, Eliot Culp, Lei Hou,Michael Seitz, and Thorsten Hansen. In addition, I beneted from the administrativeassistance of Mrs. Buchmayr, Mrs. Tehua-Maqdissi, Mrs. Szantone-Sturm, and InesPelger, who were all a great help.
Finally, I would like to thank my family for their support during all these years.My most special, nal thanks go to you, Jens, for all your patience, tolerance, encour-agement, and love. I am especially sorry for all the broken glasses.
Munich, December 2009
Contents
Preface 1References . . . . . . . . . . . . . . . . . . . . . . . . . . . . . . . . . . . . . 6
1 Free Sky and Clouds of Restrictions 71.1 Introduction . . . . . . . . . . . . . . . . . . . . . . . . . . . . . . . . . 71.2 Main Features of Air Services Agreements . . . . . . . . . . . . . . . . 111.3 Degree of Air Services Liberalization . . . . . . . . . . . . . . . . . . . 121.4 Empirical Model . . . . . . . . . . . . . . . . . . . . . . . . . . . . . . 161.5 Results . . . . . . . . . . . . . . . . . . . . . . . . . . . . . . . . . . . . 17
1.5.1 Alternative Estimation Methods . . . . . . . . . . . . . . . . . . 201.5.2 Alternative Measures of Liberalization . . . . . . . . . . . . . . 231.5.3 Cluster Analysis . . . . . . . . . . . . . . . . . . . . . . . . . . . 23
1.6 Conclusions . . . . . . . . . . . . . . . . . . . . . . . . . . . . . . . . . 281.A Appendices to Chapter 1 . . . . . . . . . . . . . . . . . . . . . . . . . . 30
1.A.1 Construction of the Factor Analysis Index (FAI) . . . . . . . . . 301.A.2 Air Services Liberalization by Country . . . . . . . . . . . . . . 321.A.3 Data Sources . . . . . . . . . . . . . . . . . . . . . . . . . . . . 36
References . . . . . . . . . . . . . . . . . . . . . . . . . . . . . . . . . . . . . 38
2 Are the Central European Stock Markets Still Dierent? 412.1 Introduction . . . . . . . . . . . . . . . . . . . . . . . . . . . . . . . . . 412.2 Development of the Central European Stock Markets . . . . . . . . . . 452.3 Data . . . . . . . . . . . . . . . . . . . . . . . . . . . . . . . . . . . . . 482.4 Methodology . . . . . . . . . . . . . . . . . . . . . . . . . . . . . . . . 512.5 Results . . . . . . . . . . . . . . . . . . . . . . . . . . . . . . . . . . . . 53
2.5.1 Pre-accession Period . . . . . . . . . . . . . . . . . . . . . . . . 53
Contents ii
2.5.2 Accession Period . . . . . . . . . . . . . . . . . . . . . . . . . . 572.5.3 Post-accession Period . . . . . . . . . . . . . . . . . . . . . . . . 582.5.4 Robustness Checks . . . . . . . . . . . . . . . . . . . . . . . . . 63
2.6 Conclusions . . . . . . . . . . . . . . . . . . . . . . . . . . . . . . . . . 642.A Appendices to Chapter 2 . . . . . . . . . . . . . . . . . . . . . . . . . . 66
2.A.1 Model Specications . . . . . . . . . . . . . . . . . . . . . . . . 662.A.2 Cointegration Relations . . . . . . . . . . . . . . . . . . . . . . 682.A.3 Constancy of Parameters . . . . . . . . . . . . . . . . . . . . . . 69
References . . . . . . . . . . . . . . . . . . . . . . . . . . . . . . . . . . . . . 73
3 Do Multinationals Transplant their Business Model? 773.1 Introduction . . . . . . . . . . . . . . . . . . . . . . . . . . . . . . . . . 773.2 Data . . . . . . . . . . . . . . . . . . . . . . . . . . . . . . . . . . . . . 84
3.2.1 Measuring Organization . . . . . . . . . . . . . . . . . . . . . . 843.2.2 Measuring Competition and Trade . . . . . . . . . . . . . . . . 883.2.3 Social Capital in Host Countries . . . . . . . . . . . . . . . . . . 89
3.3 Empirical Specication and Results . . . . . . . . . . . . . . . . . . . . 893.3.1 What Favors Decentralization in Foreign Aliates? . . . . . . . 893.3.2 When Does Transplantation Happen? . . . . . . . . . . . . . . . 100
3.4 Conclusions . . . . . . . . . . . . . . . . . . . . . . . . . . . . . . . . . 1093.A Appendices to Chapter 3 . . . . . . . . . . . . . . . . . . . . . . . . . . 111
3.A.1 Data and Descriptives . . . . . . . . . . . . . . . . . . . . . . . 1113.A.2 Corporate Decisions . . . . . . . . . . . . . . . . . . . . . . . . 1163.A.3 Market Environment in Host Countries . . . . . . . . . . . . . . 118
References . . . . . . . . . . . . . . . . . . . . . . . . . . . . . . . . . . . . . 122
List of Figures
1.1 Histograms of the Degree of International Air Services Liberalization . 151.2 International Air Services Liberalization by Income Level . . . . . . . . 15
2.1 Logarithms of the Stock Market Indices . . . . . . . . . . . . . . . . . . 492.2 Test of β = "known β", Accession Period . . . . . . . . . . . . . . . . . 582.3 The First Cointegration Relation, Pre-accession Period . . . . . . . . . 682.4 The Third Cointegration Relation, Post-accession Period . . . . . . . . 682.5 Test for Constancy of Log-likelihood Function, Pre-accession Period . . 692.6 Development of the First Eigenvalue, Pre-accession Period . . . . . . . 692.7 Test of β constancy, Pre-accession Period . . . . . . . . . . . . . . . . . 702.8 Likelihood Ratio Test of Restrictions, Pre-accession Period . . . . . . . 702.9 Test for Constancy of Log-likelihood Function, Post-accession Period . 712.10 Development of the Three Eigenvalues, Post-accession Period . . . . . . 712.11 Test of β constancy, Post-accession Period . . . . . . . . . . . . . . . . 722.12 Likelihood Ratio Test of Restrictions, Post-accession Period . . . . . . 72
3.1 Productivity of Foreign Aliates in Host Countries . . . . . . . . . . . 783.2 Level of Decentralization of Parent Firms and their Aliates . . . . . . 813.3 Multinationals' Transplantation of Business Model . . . . . . . . . . . . 823.4 Social Capital in Host Regions . . . . . . . . . . . . . . . . . . . . . . . 983.5 Level of Contract Enforcement in Host Countries . . . . . . . . . . . . 1183.6 Level of Trust in Host Countries . . . . . . . . . . . . . . . . . . . . . . 1193.7 Level of Hierarchical Religion in Host Countries . . . . . . . . . . . . . 119
List of Tables
1.1 International Air Passengers by Income Group of Countries . . . . . . . 91.2 Number of Air Services Agreements by Provision . . . . . . . . . . . . 131.3 The Informed Index (ALI) and the Statistical Index (FAI), Weights . . 141.4 International Passenger Flows, The role of Air Liberalization Index . . 181.5 International Passenger Flows, Alternative Estimation Techniques . . . 221.6 The Informed Index (ALI) and the Statistical Index (FAI), Estimates . 231.7 Dierent Types of Agreements Identied by Cluster Analysis . . . . . . 251.8 International Passenger Flows, The Role of Types of Agreements . . . . 261.9 Worldwide Adoption of Dierent Types of Agreements . . . . . . . . . 281.10 Denition of Indicators of Liberalization . . . . . . . . . . . . . . . . . 301.11 The Statistical Index (FAI), Factors Loadings and Weights . . . . . . . 311.12 Time-sensitive Sectors . . . . . . . . . . . . . . . . . . . . . . . . . . . 37
2.1 Development of the Central European Stock Markets . . . . . . . . . . 462.2 Descriptive Statistics of the Stock Market Returns . . . . . . . . . . . . 502.3 Correlations of the Stock Market Returns . . . . . . . . . . . . . . . . . 512.4 Trace Test, Pre-accession Period . . . . . . . . . . . . . . . . . . . . . . 552.5 Tests of Restrictions on β and α, Pre-accession Period . . . . . . . . . 552.6 Estimates of β under Dierent Restrictions, Pre-accession Period . . . 562.7 Final Model, Pre-accession Period . . . . . . . . . . . . . . . . . . . . . 572.8 Trace Test, Post-accession Period . . . . . . . . . . . . . . . . . . . . . 592.9 Tests of Exclusion Restrictions on β, Post-accession Period . . . . . . . 602.10 Estimates of β under Dierent Restrictions, Post-accession Period . . . 612.11 Final Model, Post-accession Period . . . . . . . . . . . . . . . . . . . . 622.12 Misspecication Tests . . . . . . . . . . . . . . . . . . . . . . . . . . . . 66
List of Tables v
3.1 Transplantation via Organization . . . . . . . . . . . . . . . . . . . . . 803.2 Level of Command of Parent and Subsidiary Firms . . . . . . . . . . . 813.3 Multinationals' Transplantation of Business Model . . . . . . . . . . . . 873.4 Decentralization in Subsidiary Firms, The Basic Model . . . . . . . . . 913.5 Decentralization in Subsidiary Firms, Competition and Trade: OLS . . 933.6 Decentralization in Subsidiary Firms, Competition and Trade: IV . . . 963.7 Decentralization in Subsidiary Firms: Contracts, Trust, and Religion . 993.8 Transplantation via Organization . . . . . . . . . . . . . . . . . . . . . 1023.9 Transplantation via Organization: Partial Eects . . . . . . . . . . . . 1033.10 Transplantation via CEO . . . . . . . . . . . . . . . . . . . . . . . . . . 1063.11 Transplantation via CEO: Partial Eects . . . . . . . . . . . . . . . . . 1073.12 Description of Variables and Data Sources . . . . . . . . . . . . . . . . 1113.13 Descriptive Statistics . . . . . . . . . . . . . . . . . . . . . . . . . . . . 1153.14 Corporate Decisions in Subsidiary and Parent Firms . . . . . . . . . . . 1163.15 Similarity of Corporate Decisions between Subsidiary and Parent Firms 1173.16 Market Environment: the Czech Republic and Hungary . . . . . . . . . 1203.17 Market Environment: Poland and Slovakia . . . . . . . . . . . . . . . . 121

Preface
"It has been said that arguing against globalization is like arguing against the law ofgravity. But that does not mean we should accept a law that allows only heavy-weightsto survive. On the contrary: we must make globalization an engine that lifts people outof hardship and misery, not a force that holds them down. We must build partnershipsstrong enough to make sure that the global market is embedded in broadly shared valuesand practices that reect global needs, so that globalization can benet all the world'speople." (Ko Annan, 2000)
As noted by Ko Annan, the former Secretary-General of the United Nations, welive in an era of an ongoing process of globalization that appears to be as naturaland inevitable as the law of gravity. Undoubtedly, the technological progress is one ofthe main driving forces of globalization since it shortens distances in a broad sense byreducing transport and communication costs. This is further fostered by the eliminationof politically-imposed barriers in recent years. The pace of the globalization process hasaccelerated especially after the fall of the Iron Curtain in 1989 as most of the countriesof the former Eastern bloc got involved into the global economy while undergoing atransition process from centrally planned economies toward free market economies.
Since the process of globalization is so widespread and dynamic, its pros and conshave been some of the most hotly-debated topics in international economics in recentyears. On the one hand, already the Ricardian theory of comparative advantage twocenturies ago (Ricardo, 1817) predicted that trade liberalization leads to a more ecientreallocation of resources which in turn creates net benets for both parties involvedin the exchange of goods. On the other hand, there are concerns about increasinginequality resulting from the fact that the benets of globalization are unevenly spread(see Krugman and Venables, 1995; Milanovic, 2005). Therefore, also Ko Annan calledfor reasonable and fair-minded rules that would amend the globalization process tobenet all.
Preface 2
This thesis contributes to the ongoing debate on globalization, by studying threedierent aspects of the process. Chapter 1 shows that liberalization of the air servicessector signicantly increases air passenger trac, thereby improving the performanceof the sector, facilitating face-to-face communication, and supporting the developmentof other sectors of an economy such as tourism. The results also suggest that theexisting regulatory framework is very uneven as the air services sectors of low-incomecountries remain heavily regulated. Chapter 2 delivers evidence about tightening inter-dependence of stock markets that imply limited possibility for international portfoliodiversication and increased vulnerability of the nancial sector to the transmission ofshocks from one country to another. Hence, Chapter 2 points to a potentially nega-tive eect of globalization, especially with respect to the recent global economic crisis.Chapter 3 examines the phenomenon of multinational corporations that are found tobe the most productive rms by focusing on their internal business culture and orga-nization. In particular, Chapter 3 provides insights into the conditions under whichmultinationals transplant their business model to other countries. This is potentiallyimportant for getting a better understanding of the ability of multinationals to trans-plant their productivity advantage abroad.
The three chapters study increasing integration of national economies by analyzingits characteristics, causes, and consequences. Whereas Chapter 1 assesses the processof integration from a global perspective involving a large number of countries, the twofollowing chapters focus on transition economies in Eastern Europe. The three chaptersare self-contained and can be read independently of each other.
As mentioned above, the process of globalization is strongly bolstered by new trans-port, communication, and computer technologies. One of the most dynamic sectorsdriven by technological change is the air transport sector, which is studied in the rstchapter of this thesis.1 Technological progress apart, the regulatory set-up appears toplay an important role in the development of this sector (see Micco and Serebrisky,2006). In fact, air transport has been heavily regulated by governments since the In-ternational Civil Aviation Conference in 1944 and only recently several countries andregions have liberalized the regulatory framework. For instance, the countries of theEuropean Economic Area set up very liberal conditions for air services within theirregion in the mid 1990s. However, signicant restrictions remain and, as a result, theaviation market is regulated by a plethora of dierent types of regimes, as imposed byvarious bilateral and plurilateral Air Services Agreements.
1Chapter 1 is based on joint work with Roberta Piermartini, World Trade Organization (WTO).
Preface 3
Chapter 1 investigates the extent of discrimination in terms of access to interna-tional air services generated by this system. In particular, using recently availableinformation on approximately 2300 Air Services Agreements covering 184 countries, weestimate the impact of international air services liberalization on air passenger ows.We use several measures of liberalization as well as alternative estimation techniquesto address potential problems of endogeneity, heteroscedasticity, and data inaccuracy.In addition, we argue that the traditional approach of modeling services trade liber-alization by means of an index does not fully account for the discontinuous nature ofservices liberalization and propose the use of cluster analysis instead.
We nd strong evidence of a positive and signicant impact of the degree of liberal-ization on passenger trac. For instance, the higher degree of air services liberalizationamong countries of the European Economic Area is estimated to account for rates ofpassenger trac which are 22 percent higher compared with trac between countriesthat signed Open Skies-type of agreements. The latter represents relatively liberaltypes of Air Services Agreements signed mainly by the United States. Our resultssuggest that the present system of a complex web of dierent Air Services Agreementsgenerates a discriminatory environment for access to air services. The discriminationtends to concern especially low income countries whose Air Services Agreements typi-cally include very restrictive provisions.
Chapter 2 studies globalization from a more focused perspective by concentratingon the Central European countries2 that have been the leaders among the EasternEuropean countries in the transition process from centrally planned systems towardfree market economies. Developed countries have played an important role in theprocess of transition. Especially the countries in Western Europe have invested largeamounts of capital, mainly in the form of foreign direct investment, in the CentralEuropean region since the early 1990s (Mora, Garibaldi, Sahay, and Zettelmeyer, 2002;Lankes and Stern, 1999). The tightening economical relations have been accompaniedby signicant institutional reforms and changes in the scal and monetary policiesof the Central European countries, driven by the attempt to join the European Union(EU) soon. The EU accession per se on May 1, 2004 led for instance to the full removalof restrictions on movements of capital.
Empirical literature on major developed stock markets (see, for instance, Kasa,1992) suggests that deregulation and liberalization in capital markets, the importance
2The term "Central Europe" is used to refer to the group of four Visegrád countries, namely theCzech Republic, Hungary, Poland, and Slovakia.
Preface 4
of foreign capital inows as well as the deepening institutional integration are likely tolead to stronger stock market integration. Chapter 2 examines whether this can alsobe observed in the case of the three largest Central European markets, namely thosein the Czech Republic, Hungary, and Poland. The nancial integration is studied fromthe perspective of a long-run convergence toward stable equilibrium relations amongthe stock markets, as modeled by the Johansen cointegration method.
The results in Chapter 2 show that the Central European stock markets have indeedbecome more integrated with the global economy in general and with the "old" EUin particular after the EU accession. This is evidenced by the emergence of two newlong-run equilibrium relations in the post-accession period that link the movementsof the Central European markets to the movements of the Western European, UnitedStates, and Russian markets, whereas no such relations could be detected before the EUenlargement. In particular, one new relation links the Central European markets to theWestern European market, reecting tighter co-movements of the "new" and the "old"EU markets. The second new relation points at the role of the United States marketfor both the Central and the Western European markets. These ndings suggest thatthe Central European stock markets have become more vulnerable to shocks hittingthe global economy on the one hand but more resistant to domestic shocks on the otherhand.
One important channel through which national economies become more intercon-nected is foreign direct investment. The term foreign direct investment refers to asituation, in which a company from one country is making an investment into buildinga new enterprise in another country or acquires a majority of shares in a rm operat-ing outside the country so that the investing rm gains control over the rm abroad.The investing company (the parent rm) and its foreign aliate (the subsidiary rm)together form a multinational corporation. The phenomenon of multinational corpo-rations is studied in Chapter 3.3
Recent literature on international trade has established that the most productiverms within a national economy tend to become multinationals. But our data reveal astartling variation in productivity levels of foreign aliates across countries of the samemultinational parent rms suggesting that not all multinationals transplant their homeproductivity advantage to other countries. One candidate for this startling dierence
3Chapter 3 is based on joint work with Dalia Marin, University of Munich.
Preface 5
in productivity levels among subsidiaries is the ability of multinationals to transplanttheir business culture abroad.
Chapter 3 examines the factors which determine what type of organization is im-plemented abroad and whether or not multinationals transplant their business modelto other countries. To investigate this, we collect original and uniquely matched parentand aliate data on the internal organization of 660 German and Austrian parent rmsand 2200 of their subsidiaries in Eastern Europe. In particular, we test the hypothesisthat the ability of multinationals to transplant their business model to foreign aliatesis determined by the organization of the multinational corporation on the one handand the market environment on the other hand.
We nd that the organization implemented in foreign aliates tends to be moredecentralized regarding the decision-making structure within the corporation comparedwith the organization of the parent rm. The decision to decentralize the businessmodel appears to be more strongly determined by the organization of the multinationalcorporation than the decision to transplant the business model. The other way round,the decision to transplant is more aected by the market conditions in both the homeand the host country. In particular, our results point to the importance of productmarket competition for the transplantation of the business model.
References
Annan, K., 2000. Opening Address to the 53rd Annual United Nations DPI/NGOConference. United Nations Headquarters, New York. Available at http://www.un.org/dpi/ngosection/annualconfs/53/sg-address.html.
Kasa, K., 1992. Common Stochastic Trends in International Stock Markets. Journal ofMonetary Economics 29, 95124.
Krugman, P., Venables, A. J., 1995. Globalization and the Inequality of Nations. TheQuarterly Journal of Economics 110 (4), 857880.
Lankes, H. P., Stern, N., 1999. Capital Flows to Eastern Europe. In: Feldstein, M.(Ed.), International Capital Flows. National Bureau of Economic Research, pp. 5796.
Micco, A., Serebrisky, T., 2006. Competition Regimes and Air Transport Costs: TheEects of Open Skies Agreements. Journal of International Economics 70 (1), 2551.
Milanovic, B., 2005. Can We Discern the Eect of Globalization on Income Distri-bution? Evidence from Household Surveys. World Bank Economic Review 19 (1),2144.
Mora, N., Garibaldi, P., Sahay, R., Zettelmeyer, J., 2002. What Moves Capital toTransition Economies? IMF Working Papers 02/64, International Monetary Fund,Washington, DC.
Ricardo, D., 1817. On the Principles of Political Economy and Taxation. John Murray,London.
Chapter 1
Free Sky and Clouds of Restrictions∗
1.1 Introduction
Air transport has rapidly expanded in the last few decades. Passenger trac experi-enced an average annual increase of ve to nine percent between 1960 and 2004 (Hanlon,2006). Air cargo has grown even faster in recent years. Hummels (2007) reports thatton-miles shipped by air increased by 11.7 percent in the period 1975 to 2004. Thereason for this rapid expansion is the substantial decline of air transport costs. Airtransport costs decreased by 92 percent between 1955 and 2004. The largest drop,equal to 8.1 percent annually, took place between period 1955 and 1972, the periodwhen the use of jet engines became widespread (Hummels, 2007).
Technological progress apart, changes in the regulatory set-up may have helped inreducing air transport costs as well. The regulatory regime that governs internationalair transport has been heavily regulated by governments since the International CivilAviation Conference in 1944. In the absence of a multilateral agreement,1 over 3500bilateral and plurilateral Air Services Agreements have been signed worldwide. Arst signicant step in the liberalization process was taken in 1992, when the UnitedStates signed its rst Open Sky Agreement with the Netherlands that eased particularregulations on the capacity of services oered. Since then, the United States have signedover 60 Open Skies Agreements and the countries of the European Economic Area haveset very liberal conditions for air services in their region. Signicant restrictions remainin the aviation market, however, and the result is a very complex web of dierent
∗This chapter is based on joint work with Roberta Piermartini, World Trade Organization (WTO).1Air transport services are excluded from GATS, the WTO multilateral agreement on trade in
services.
Free Sky and Clouds of Restrictions 8
types of regimes under which air companies operate. Therefore, interesting empiricalquestions are whether air services liberalization has had a signicant impact on theperformance of the aviation industry and, more specically, how eective dierenttypes of agreements have been in improving market competition, lowering transportcosts, and increasing trac volumes.
The empirical evidence addressing these questions is scarce and tends to use ei-ther indices to measure the degree of liberalization or a dummy to denote the exis-tence of a particular Air Services Agreement. In addition, the evidence is typicallylimited to a subset of countries. For example, focusing on thirteen OECD countries,Gönenç and Nicoletti (2000) construct a bilateral restrictiveness index by means of fac-tor analysis and estimate positive and signicant eects of air services restrictiveness onpassenger air fares. Using the same index, Doove, Gabbitas, Nguyen-Hong, and Owen(2001) extend Gonenc and Nicoletti's analysis to a group of 35 economies and obtainsimilar results. In a study specic to the Open Skies Agreements signed by the UnitedStates, Micco and Serebrisky (2006) show that introducing Open Skies Agreements re-duced nominal air cargo transport costs by 9 percent between 1990 and 2003, but theynotice that the results are driven by Open Skies Agreements with middle- and high-income countries whereas they do not nd signicant eects of Open Skies Agreementsfor low-income countries.
One important limit of the existing literature is that it does not take into accountthat air services liberalization does not follow a continuous process. While tari bar-riers in trade in goods can be progressively reduced, barriers to services trade cannot.Air Services Agreements are dierent in various respects from tari barriers and, inparticular, a wide range of types of agreements exists. To take this into account, wesuggest a novel approach to estimate the impact of air services liberalization, namelythe use of cluster analysis.
Moreover, our analysis relies on a large dataset with 184 countries. This is impor-tant because it allows us to cover a wide range of types of agreements and addressthe discontinuous nature of air services liberalization. More specically, our datasetincludes approximately 2300 Air Services Agreements in force in 2005. Informationon the agreements is obtained from the World's Air Services Agreements (WASA)database provided by the International Civil Aviation Organization (ICAO, 2005) andfrom the "QUASAR" database developed by the World Trade Organization (WTO,2007). As shown in Table 1.1, these agreements regulate some 80 percent of worldwide
Free Sky and Clouds of Restrictions 9
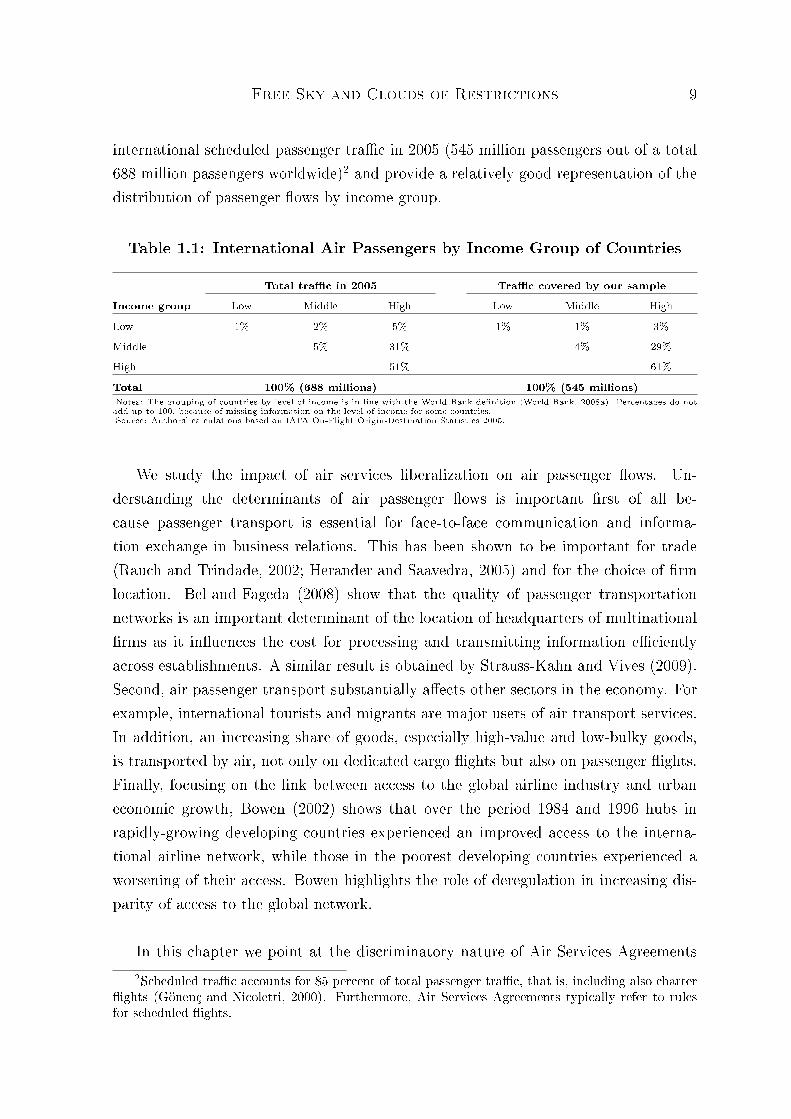
international scheduled passenger trac in 2005 (545 million passengers out of a total688 million passengers worldwide)2 and provide a relatively good representation of thedistribution of passenger ows by income group.
Table 1.1: International Air Passengers by Income Group of Countries
Total trac in 2005 Trac covered by our sampleIncome group Low Middle High Low Middle High
Low 1% 2% 5% 1% 1% 3%Middle 5% 31% 4% 29%High 51% 61%
Total 100% (688 millions) 100% (545 millions)Notes: The grouping of countries by level of income is in line with the World Bank denition (World Bank, 2008a). Percentages do notadd up to 100, because of missing information on the level of income for some countries.Source: Authors' calculations based on IATA On-Flight Origin-Destination Statistics 2005.
We study the impact of air services liberalization on air passenger ows. Un-derstanding the determinants of air passenger ows is important rst of all be-cause passenger transport is essential for face-to-face communication and informa-tion exchange in business relations. This has been shown to be important for trade(Rauch and Trindade, 2002; Herander and Saavedra, 2005) and for the choice of rmlocation. Bel and Fageda (2008) show that the quality of passenger transportationnetworks is an important determinant of the location of headquarters of multinationalrms as it inuences the cost for processing and transmitting information ecientlyacross establishments. A similar result is obtained by Strauss-Kahn and Vives (2009).Second, air passenger transport substantially aects other sectors in the economy. Forexample, international tourists and migrants are major users of air transport services.In addition, an increasing share of goods, especially high-value and low-bulky goods,is transported by air, not only on dedicated cargo ights but also on passenger ights.Finally, focusing on the link between access to the global airline industry and urbaneconomic growth, Bowen (2002) shows that over the period 1984 and 1996 hubs inrapidly-growing developing countries experienced an improved access to the interna-tional airline network, while those in the poorest developing countries experienced aworsening of their access. Bowen highlights the role of deregulation in increasing dis-parity of access to the global network.
In this chapter we point at the discriminatory nature of Air Services Agreements2Scheduled trac accounts for 85 percent of total passenger trac, that is, including also charter
ights (Gönenç and Nicoletti, 2000). Furthermore, Air Services Agreements typically refer to rulesfor scheduled ights.
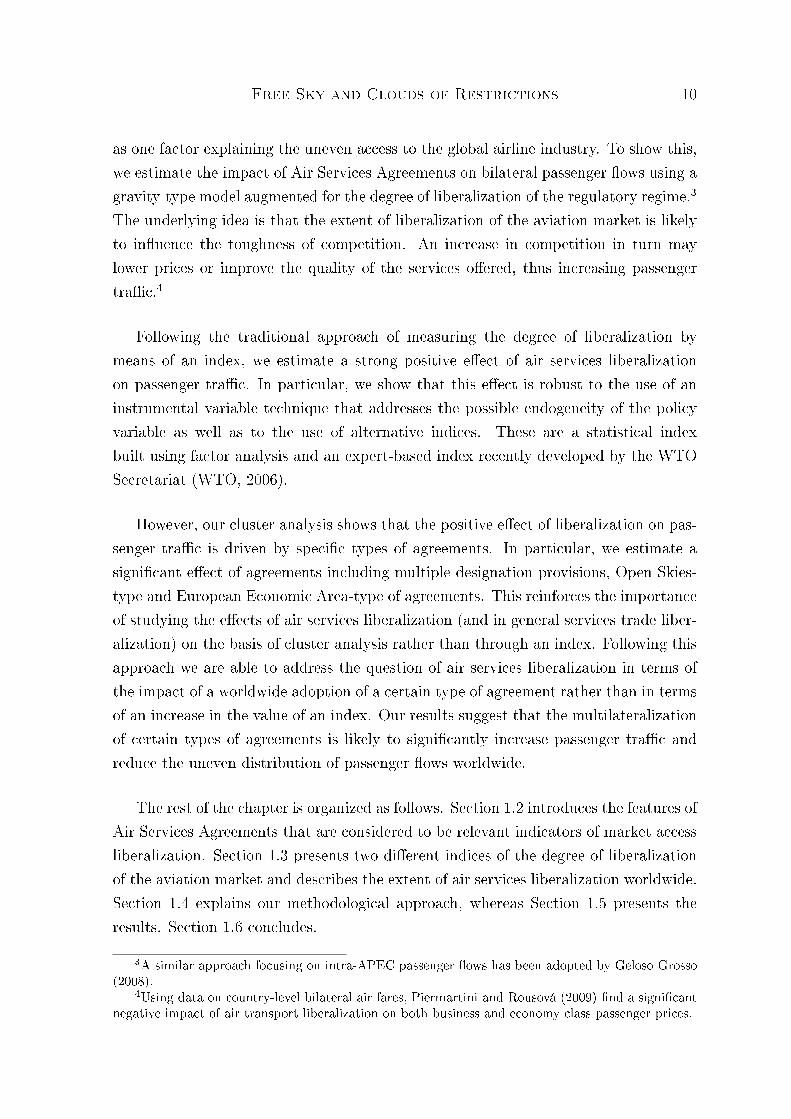
Free Sky and Clouds of Restrictions 10
as one factor explaining the uneven access to the global airline industry. To show this,we estimate the impact of Air Services Agreements on bilateral passenger ows using agravity-type model augmented for the degree of liberalization of the regulatory regime.3
The underlying idea is that the extent of liberalization of the aviation market is likelyto inuence the toughness of competition. An increase in competition in turn maylower prices or improve the quality of the services oered, thus increasing passengertrac.4
Following the traditional approach of measuring the degree of liberalization bymeans of an index, we estimate a strong positive eect of air services liberalizationon passenger trac. In particular, we show that this eect is robust to the use of aninstrumental variable technique that addresses the possible endogeneity of the policyvariable as well as to the use of alternative indices. These are a statistical indexbuilt using factor analysis and an expert-based index recently developed by the WTOSecretariat (WTO, 2006).
However, our cluster analysis shows that the positive eect of liberalization on pas-senger trac is driven by specic types of agreements. In particular, we estimate asignicant eect of agreements including multiple designation provisions, Open Skies-type and European Economic Area-type of agreements. This reinforces the importanceof studying the eects of air services liberalization (and in general services trade liber-alization) on the basis of cluster analysis rather than through an index. Following thisapproach we are able to address the question of air services liberalization in terms ofthe impact of a worldwide adoption of a certain type of agreement rather than in termsof an increase in the value of an index. Our results suggest that the multilateralizationof certain types of agreements is likely to signicantly increase passenger trac andreduce the uneven distribution of passenger ows worldwide.
The rest of the chapter is organized as follows. Section 1.2 introduces the features ofAir Services Agreements that are considered to be relevant indicators of market accessliberalization. Section 1.3 presents two dierent indices of the degree of liberalizationof the aviation market and describes the extent of air services liberalization worldwide.Section 1.4 explains our methodological approach, whereas Section 1.5 presents theresults. Section 1.6 concludes.
3A similar approach focusing on intra-APEC passenger ows has been adopted by Geloso Grosso(2008).
4Using data on country-level bilateral air fares, Piermartini and Rousová (2009) nd a signicantnegative impact of air transport liberalization on both business and economy class passenger prices.
Free Sky and Clouds of Restrictions 11
1.2 Main Features of Air Services Agreements
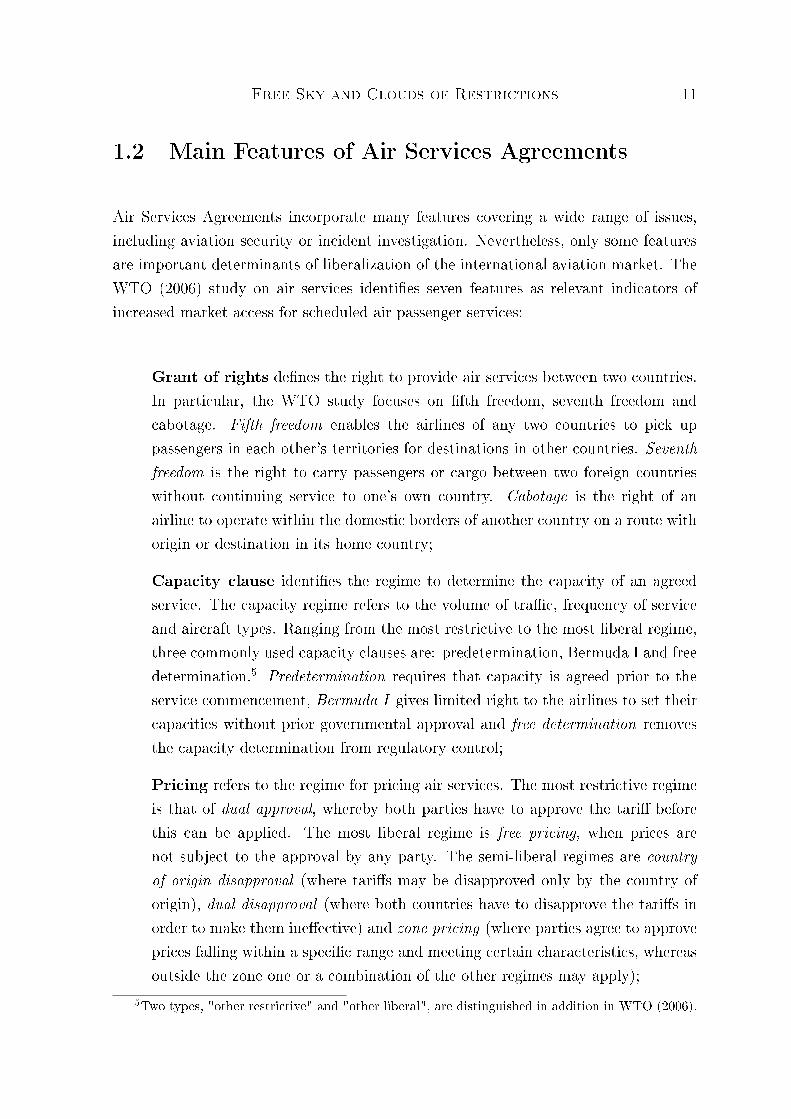
Air Services Agreements incorporate many features covering a wide range of issues,including aviation security or incident investigation. Nevertheless, only some featuresare important determinants of liberalization of the international aviation market. TheWTO (2006) study on air services identies seven features as relevant indicators ofincreased market access for scheduled air passenger services:
Grant of rights denes the right to provide air services between two countries.In particular, the WTO study focuses on fth freedom, seventh freedom andcabotage. Fifth freedom enables the airlines of any two countries to pick uppassengers in each other's territories for destinations in other countries. Seventhfreedom is the right to carry passengers or cargo between two foreign countrieswithout continuing service to one's own country. Cabotage is the right of anairline to operate within the domestic borders of another country on a route withorigin or destination in its home country;
Capacity clause identies the regime to determine the capacity of an agreedservice. The capacity regime refers to the volume of trac, frequency of serviceand aircraft types. Ranging from the most restrictive to the most liberal regime,three commonly used capacity clauses are: predetermination, Bermuda I and freedetermination.5 Predetermination requires that capacity is agreed prior to theservice commencement, Bermuda I gives limited right to the airlines to set theircapacities without prior governmental approval and free determination removesthe capacity determination from regulatory control;
Pricing refers to the regime for pricing air services. The most restrictive regimeis that of dual approval, whereby both parties have to approve the tari beforethis can be applied. The most liberal regime is free pricing, when prices arenot subject to the approval by any party. The semi-liberal regimes are countryof origin disapproval (where taris may be disapproved only by the country oforigin), dual disapproval (where both countries have to disapprove the taris inorder to make them ineective) and zone pricing (where parties agree to approveprices falling within a specic range and meeting certain characteristics, whereasoutside the zone one or a combination of the other regimes may apply);
5Two types, "other restrictive" and "other liberal", are distinguished in addition in WTO (2006).
Free Sky and Clouds of Restrictions 12
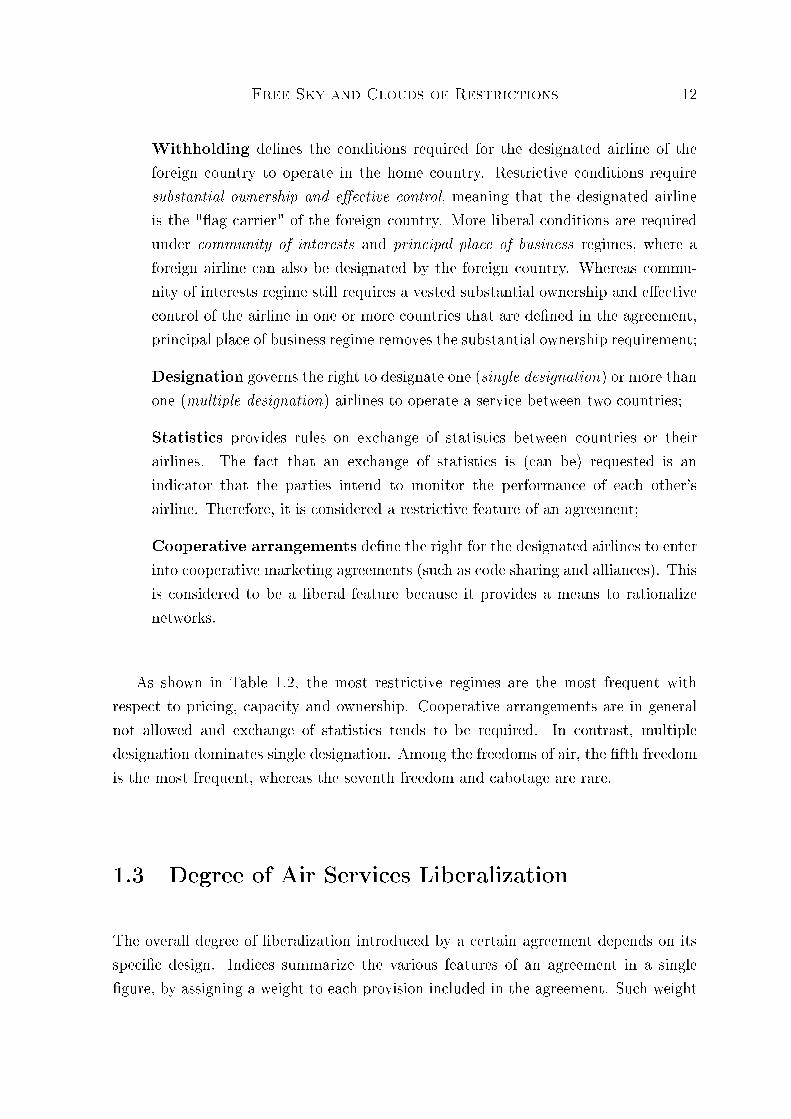
Withholding denes the conditions required for the designated airline of theforeign country to operate in the home country. Restrictive conditions requiresubstantial ownership and eective control, meaning that the designated airlineis the "ag carrier" of the foreign country. More liberal conditions are requiredunder community of interests and principal place of business regimes, where aforeign airline can also be designated by the foreign country. Whereas commu-nity of interests regime still requires a vested substantial ownership and eectivecontrol of the airline in one or more countries that are dened in the agreement,principal place of business regime removes the substantial ownership requirement;
Designation governs the right to designate one (single designation) or more thanone (multiple designation) airlines to operate a service between two countries;
Statistics provides rules on exchange of statistics between countries or theirairlines. The fact that an exchange of statistics is (can be) requested is anindicator that the parties intend to monitor the performance of each other'sairline. Therefore, it is considered a restrictive feature of an agreement;
Cooperative arrangements dene the right for the designated airlines to enterinto cooperative marketing agreements (such as code sharing and alliances). Thisis considered to be a liberal feature because it provides a means to rationalizenetworks.
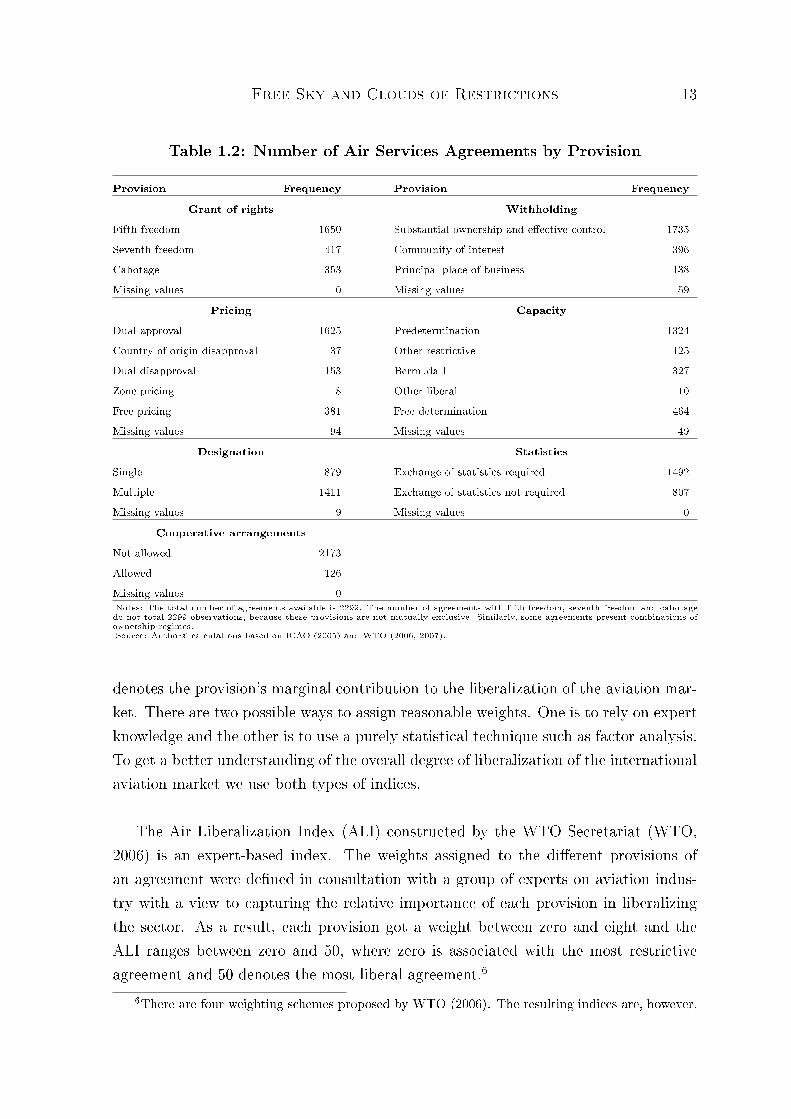
As shown in Table 1.2, the most restrictive regimes are the most frequent withrespect to pricing, capacity and ownership. Cooperative arrangements are in generalnot allowed and exchange of statistics tends to be required. In contrast, multipledesignation dominates single designation. Among the freedoms of air, the fth freedomis the most frequent, whereas the seventh freedom and cabotage are rare.
1.3 Degree of Air Services Liberalization
The overall degree of liberalization introduced by a certain agreement depends on itsspecic design. Indices summarize the various features of an agreement in a singlegure, by assigning a weight to each provision included in the agreement. Such weight
Free Sky and Clouds of Restrictions 13
Table 1.2: Number of Air Services Agreements by Provision
Provision Frequency Provision FrequencyGrant of rights Withholding
Fifth freedom 1650 Substantial ownership and eective control 1735Seventh freedom 417 Community of interest 396Cabotage 353 Principal place of business 138Missing values 0 Missing values 59
Pricing CapacityDual approval 1625 Predetermination 1324Country of origin disapproval 37 Other restrictive 125Dual disapproval 153 Bermuda I 327Zone pricing 8 Other liberal 10Free pricing 381 Free determination 464Missing values 94 Missing values 49
Designation StatisticsSingle 879 Exchange of statistics required 1492Multiple 1411 Exchange of statistics not required 807Missing values 9 Missing values 0
Cooperative arrangementsNot allowed 2173Allowed 126Missing values 0Notes: The total number of agreements available is 2299. The number of agreements with fth freedom, seventh freedom and cabotagedo not total 2299 observations, because these provisions are not mutually exclusive. Similarly, some agreements present combinations ofownership regimes.Source: Authors' calculations based on ICAO (2005) and WTO (2006, 2007).
denotes the provision's marginal contribution to the liberalization of the aviation mar-ket. There are two possible ways to assign reasonable weights. One is to rely on expertknowledge and the other is to use a purely statistical technique such as factor analysis.To get a better understanding of the overall degree of liberalization of the internationalaviation market we use both types of indices.
The Air Liberalization Index (ALI) constructed by the WTO Secretariat (WTO,2006) is an expert-based index. The weights assigned to the dierent provisions ofan agreement were dened in consultation with a group of experts on aviation indus-try with a view to capturing the relative importance of each provision in liberalizingthe sector. As a result, each provision got a weight between zero and eight and theALI ranges between zero and 50, where zero is associated with the most restrictiveagreement and 50 denotes the most liberal agreement.6
6There are four weighting schemes proposed by WTO (2006). The resulting indices are, however,
Free Sky and Clouds of Restrictions 14
Following the approach of previous empirical literature (Gönenç and Nicoletti,2000), we construct a second index of air services liberalization by means of factoranalysis (see Appendix 1.A.1 for more details). This statistical index (Factor AnalysisIndex or FAI) ranges between zero and one and increases with the degree of liberaliza-tion of the aviation market.7
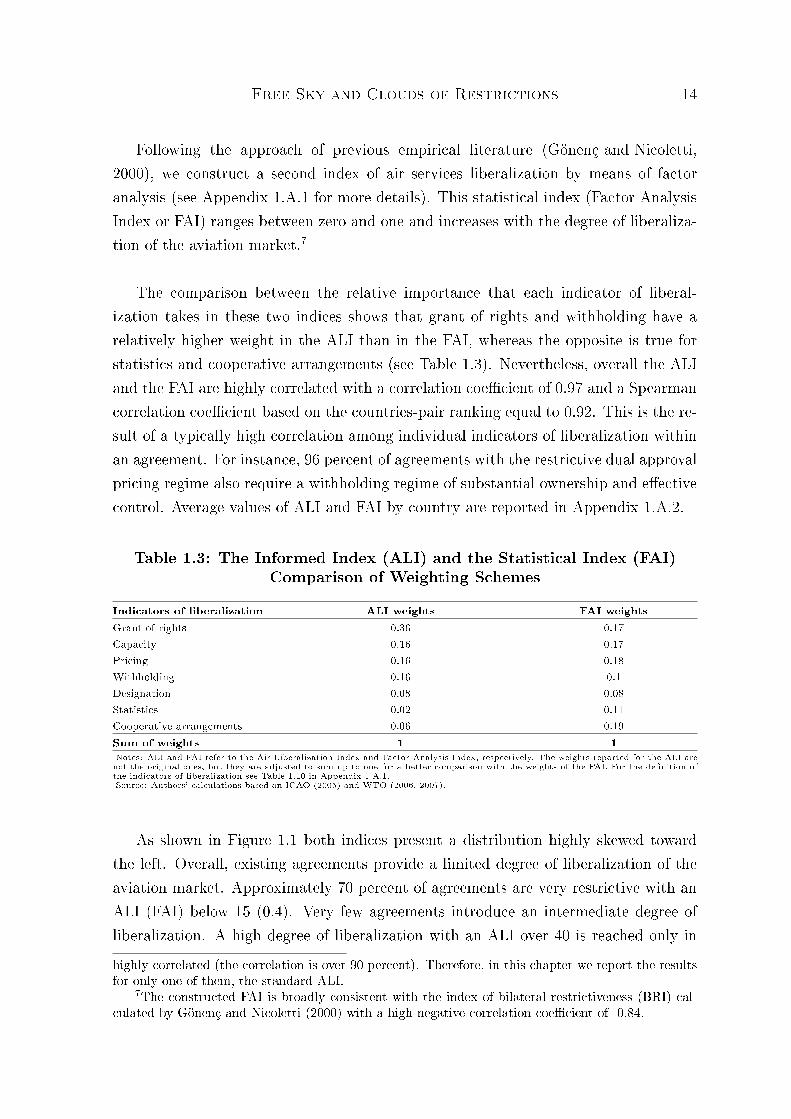
The comparison between the relative importance that each indicator of liberal-ization takes in these two indices shows that grant of rights and withholding have arelatively higher weight in the ALI than in the FAI, whereas the opposite is true forstatistics and cooperative arrangements (see Table 1.3). Nevertheless, overall the ALIand the FAI are highly correlated with a correlation coecient of 0.97 and a Spearmancorrelation coecient based on the countries-pair ranking equal to 0.92. This is the re-sult of a typically high correlation among individual indicators of liberalization withinan agreement. For instance, 96 percent of agreements with the restrictive dual approvalpricing regime also require a withholding regime of substantial ownership and eectivecontrol. Average values of ALI and FAI by country are reported in Appendix 1.A.2.
Table 1.3: The Informed Index (ALI) and the Statistical Index (FAI)Comparison of Weighting Schemes
Indicators of liberalization ALI weights FAI weightsGrant of rights 0.36 0.17Capacity 0.16 0.17Pricing 0.16 0.18Withholding 0.16 0.1Designation 0.08 0.08Statistics 0.02 0.11Cooperative arrangements 0.06 0.19Sum of weights 1 1Notes: ALI and FAI refer to the Air Liberalization Index and Factor Analysis Index, respectively. The weights reported for the ALI arenot the original ones, but they are adjusted to sum up to one for a better comparison with the weights of the FAI. For the denition ofthe indicators of liberalization see Table 1.10 in Appendix 1.A.1.Source: Authors' calculations based on ICAO (2005) and WTO (2006, 2007).
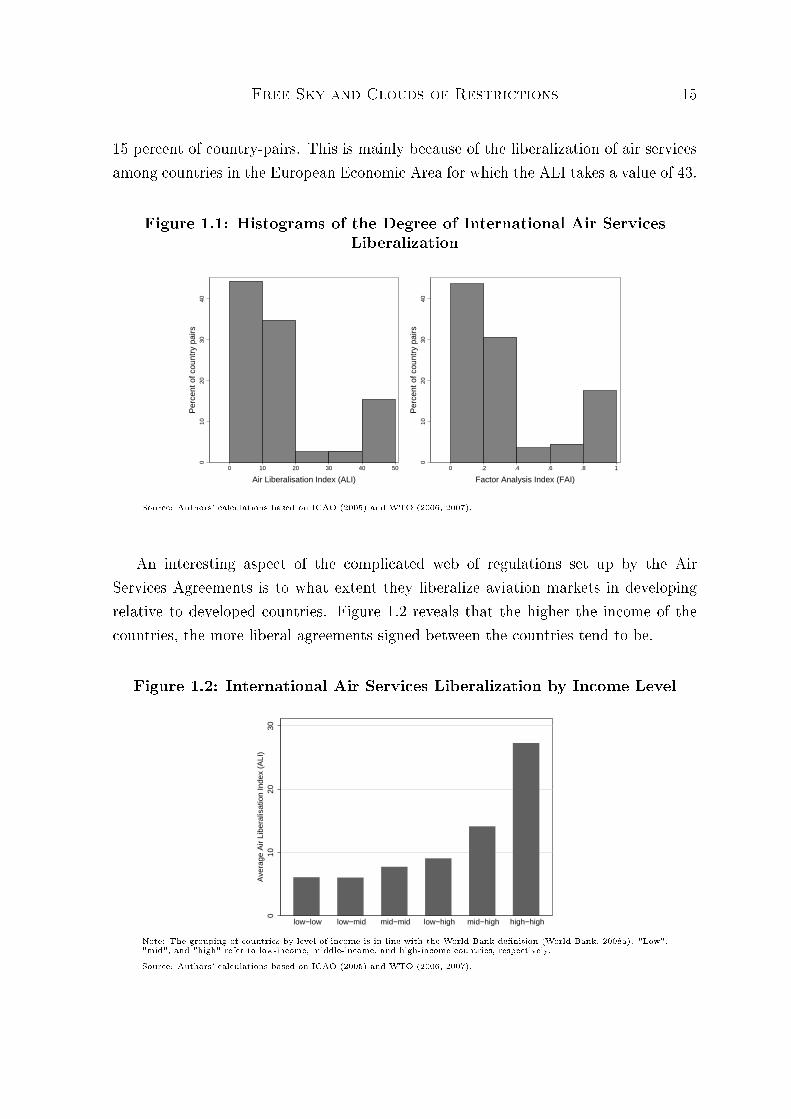
As shown in Figure 1.1 both indices present a distribution highly skewed towardthe left. Overall, existing agreements provide a limited degree of liberalization of theaviation market. Approximately 70 percent of agreements are very restrictive with anALI (FAI) below 15 (0.4). Very few agreements introduce an intermediate degree ofliberalization. A high degree of liberalization with an ALI over 40 is reached only inhighly correlated (the correlation is over 90 percent). Therefore, in this chapter we report the resultsfor only one of them, the standard ALI.
7The constructed FAI is broadly consistent with the index of bilateral restrictiveness (BRI) cal-culated by Gönenç and Nicoletti (2000) with a high negative correlation coecient of -0.84.
Free Sky and Clouds of Restrictions 15
15 percent of country-pairs. This is mainly because of the liberalization of air servicesamong countries in the European Economic Area for which the ALI takes a value of 43.
Figure 1.1: Histograms of the Degree of International Air ServicesLiberalization
010
2030
40
Per
cent
of c
ount
ry p
airs
0 10 20 30 40 50
Air Liberalisation Index (ALI)
010
2030
40
Per
cent
of c
ount
ry p
airs
0 .2 .4 .6 .8 1
Factor Analysis Index (FAI)
Source: Authors' calculations based on ICAO (2005) and WTO (2006, 2007).
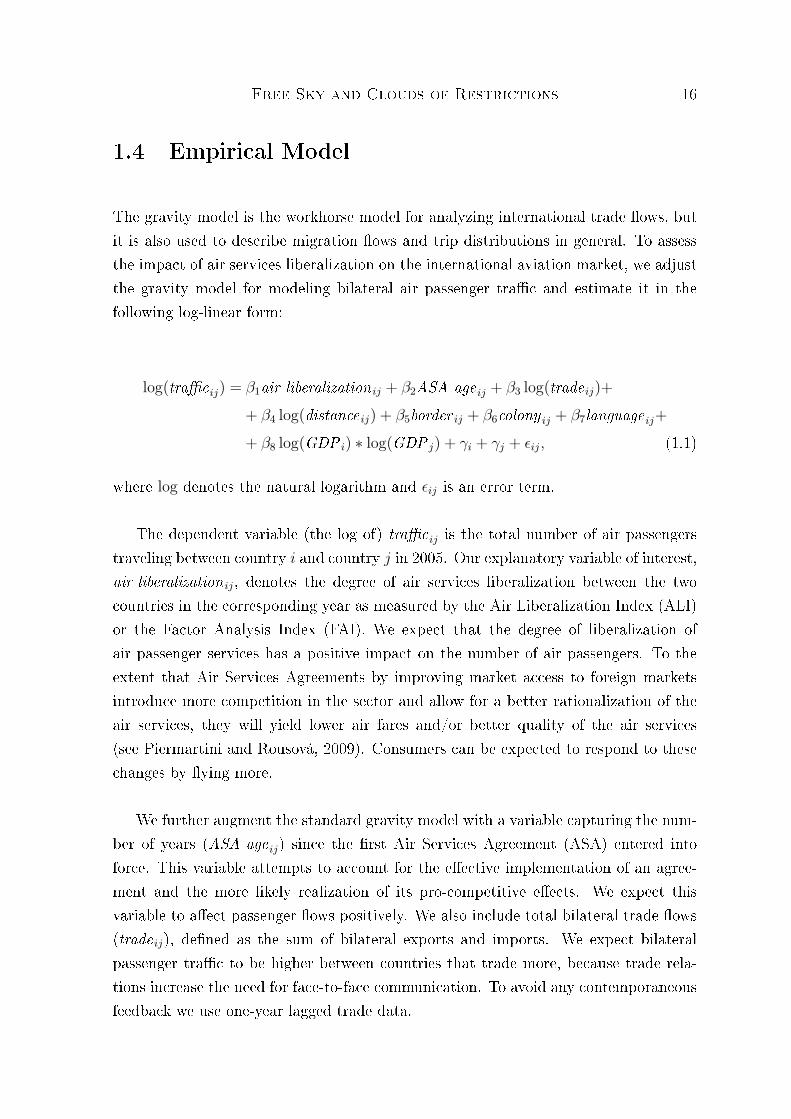
An interesting aspect of the complicated web of regulations set up by the AirServices Agreements is to what extent they liberalize aviation markets in developingrelative to developed countries. Figure 1.2 reveals that the higher the income of thecountries, the more liberal agreements signed between the countries tend to be.
Figure 1.2: International Air Services Liberalization by Income Level
010
2030
Ave
rage
Air
Libe
ralis
atio
n In
dex
(ALI
)
low−low low−mid mid−mid low−high mid−high high−high
Note: The grouping of countries by level of income is in line with the World Bank denition (World Bank, 2008a). "Low","mid", and "high" refer to low-income, middle-income, and high-income countries, respectively.
Source: Authors' calculations based on ICAO (2005) and WTO (2006, 2007).
Free Sky and Clouds of Restrictions 16
1.4 Empirical Model
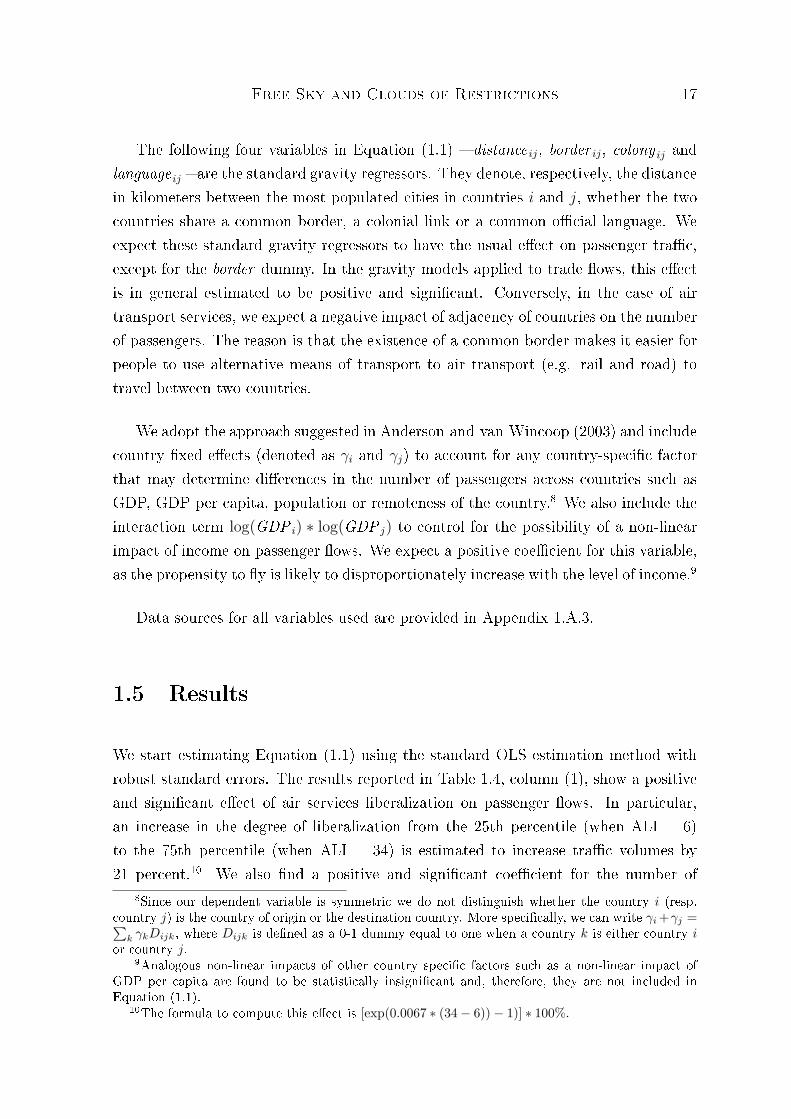
The gravity model is the workhorse model for analyzing international trade ows, butit is also used to describe migration ows and trip distributions in general. To assessthe impact of air services liberalization on the international aviation market, we adjustthe gravity model for modeling bilateral air passenger trac and estimate it in thefollowing log-linear form:
log(tracij) = β1air liberalization ij + β2ASA age ij + β3 log(trade ij)+
+ β4 log(distance ij) + β5border ij + β6colony ij + β7language ij+
+ β8 log(GDP i) ∗ log(GDP j) + γi + γj + εij, (1.1)
where log denotes the natural logarithm and εij is an error term.
The dependent variable (the log of) tracij is the total number of air passengerstraveling between country i and country j in 2005. Our explanatory variable of interest,air liberalization ij, denotes the degree of air services liberalization between the twocountries in the corresponding year as measured by the Air Liberalization Index (ALI)or the Factor Analysis Index (FAI). We expect that the degree of liberalization ofair passenger services has a positive impact on the number of air passengers. To theextent that Air Services Agreements by improving market access to foreign marketsintroduce more competition in the sector and allow for a better rationalization of theair services, they will yield lower air fares and/or better quality of the air services(see Piermartini and Rousová, 2009). Consumers can be expected to respond to thesechanges by ying more.
We further augment the standard gravity model with a variable capturing the num-ber of years (ASA age ij) since the rst Air Services Agreement (ASA) entered intoforce. This variable attempts to account for the eective implementation of an agree-ment and the more likely realization of its pro-competitive eects. We expect thisvariable to aect passenger ows positively. We also include total bilateral trade ows(trade ij), dened as the sum of bilateral exports and imports. We expect bilateralpassenger trac to be higher between countries that trade more, because trade rela-tions increase the need for face-to-face communication. To avoid any contemporaneousfeedback we use one-year lagged trade data.
Free Sky and Clouds of Restrictions 17
The following four variables in Equation (1.1) distance ij, border ij, colony ij andlanguage ij are the standard gravity regressors. They denote, respectively, the distancein kilometers between the most populated cities in countries i and j, whether the twocountries share a common border, a colonial link or a common ocial language. Weexpect these standard gravity regressors to have the usual eect on passenger trac,except for the border dummy. In the gravity models applied to trade ows, this eectis in general estimated to be positive and signicant. Conversely, in the case of airtransport services, we expect a negative impact of adjacency of countries on the numberof passengers. The reason is that the existence of a common border makes it easier forpeople to use alternative means of transport to air transport (e.g. rail and road) totravel between two countries.
We adopt the approach suggested in Anderson and van Wincoop (2003) and includecountry xed eects (denoted as γi and γj) to account for any country-specic factorthat may determine dierences in the number of passengers across countries such asGDP, GDP per capita, population or remoteness of the country.8 We also include theinteraction term log(GDP i) ∗ log(GDP j) to control for the possibility of a non-linearimpact of income on passenger ows. We expect a positive coecient for this variable,as the propensity to y is likely to disproportionately increase with the level of income.9
Data sources for all variables used are provided in Appendix 1.A.3.
1.5 Results
We start estimating Equation (1.1) using the standard OLS estimation method withrobust standard errors. The results reported in Table 1.4, column (1), show a positiveand signicant eect of air services liberalization on passenger ows. In particular,an increase in the degree of liberalization from the 25th percentile (when ALI = 6)to the 75th percentile (when ALI = 34) is estimated to increase trac volumes by21 percent.10 We also nd a positive and signicant coecient for the number of
8Since our dependent variable is symmetric we do not distinguish whether the country i (resp.country j) is the country of origin or the destination country. More specically, we can write γi +γj =∑
k γkDijk, where Dijk is dened as a 0-1 dummy equal to one when a country k is either country ior country j.
9Analogous non-linear impacts of other country specic factors such as a non-linear impact ofGDP per capita are found to be statistically insignicant and, therefore, they are not included inEquation (1.1).
10The formula to compute this eect is [exp(0.0067 ∗ (34− 6))− 1)] ∗ 100%.
Free Sky and Clouds of Restrictions 18
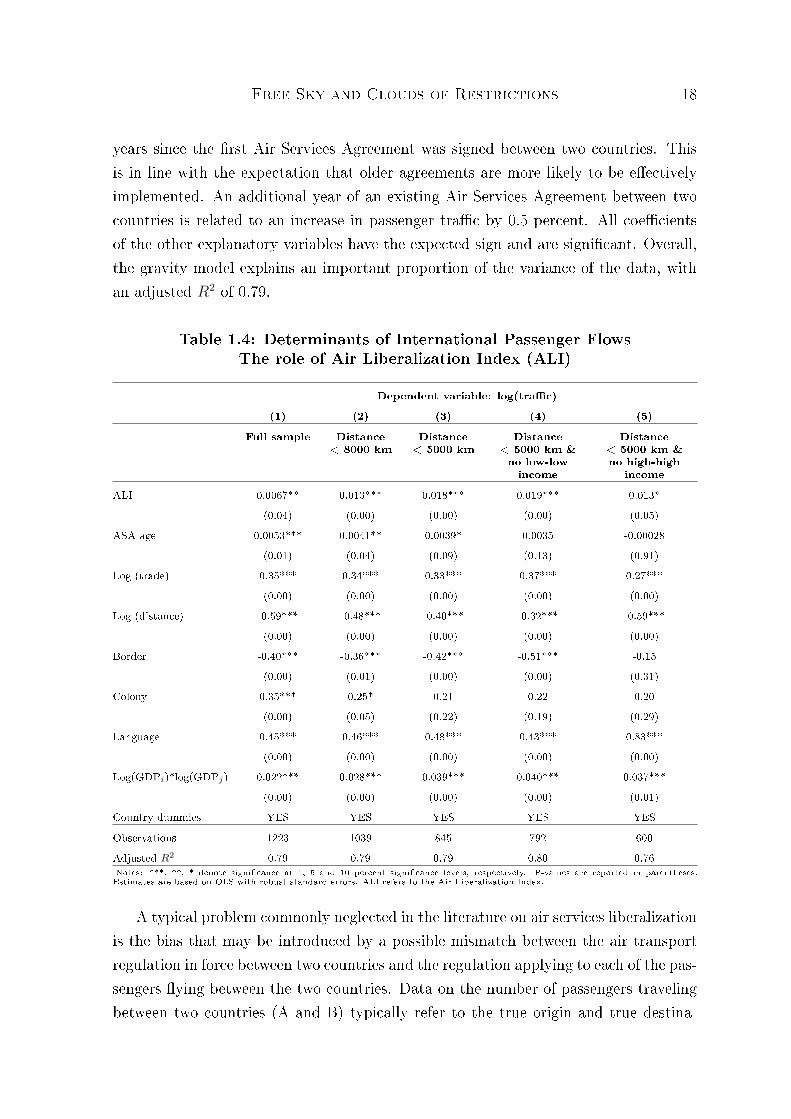
years since the rst Air Services Agreement was signed between two countries. Thisis in line with the expectation that older agreements are more likely to be eectivelyimplemented. An additional year of an existing Air Services Agreement between twocountries is related to an increase in passenger trac by 0.5 percent. All coecientsof the other explanatory variables have the expected sign and are signicant. Overall,the gravity model explains an important proportion of the variance of the data, withan adjusted R2 of 0.79.
Table 1.4: Determinants of International Passenger FlowsThe role of Air Liberalization Index (ALI)
Dependent variable: log(trac)(1) (2) (3) (4) (5)
Full sample Distance< 8000 km
Distance< 5000 km
Distance< 5000 km &no low-lowincome
Distance< 5000 km &no high-high
incomeALI 0.0067** 0.013*** 0.018*** 0.019*** 0.013*
(0.04) (0.00) (0.00) (0.00) (0.05)ASA age 0.0053*** 0.0041** 0.0039* 0.0035 -0.00028
(0.01) (0.04) (0.09) (0.13) (0.91)Log (trade) 0.35*** 0.34*** 0.33*** 0.37*** 0.27***
(0.00) (0.00) (0.00) (0.00) (0.00)Log (distance) -0.59*** -0.48*** -0.40*** -0.32*** -0.59***
(0.00) (0.00) (0.00) (0.00) (0.00)Border -0.40*** -0.36*** -0.42*** -0.51*** -0.15
(0.00) (0.01) (0.00) (0.00) (0.31)Colony 0.35*** 0.25* 0.21 0.22 0.20
(0.00) (0.05) (0.22) (0.19) (0.29)Language 0.45*** 0.46*** 0.48*** 0.43*** 0.83***
(0.00) (0.00) (0.00) (0.00) (0.00)Log(GDPi)*log(GDPj) 0.022*** 0.028*** 0.039*** 0.040*** 0.037***
(0.00) (0.00) (0.00) (0.00) (0.01)Country dummies YES YES YES YES YES
Observations 1223 1039 845 792 600Adjusted R2 0.79 0.79 0.79 0.80 0.76Notes: ***, **, * denote signicance at 1, 5 and 10 percent signicance levels, respectively. P-values are reported in parentheses.Estimates are based on OLS with robust standard errors. ALI refers to the Air Liberalization Index.
A typical problem commonly neglected in the literature on air services liberalizationis the bias that may be introduced by a possible mismatch between the air transportregulation in force between two countries and the regulation applying to each of the pas-sengers ying between the two countries. Data on the number of passengers travelingbetween two countries (A and B) typically refer to the true origin and true destina-
Free Sky and Clouds of Restrictions 19
tion of each passenger. This type of data does not allow us to distinguish betweenpassengers ying directly and passengers ying via a third country. For example, ifa passenger travels from country A to country B via (unknown) country C, the rulesgoverning his/her trip are not those established by the Air Services Agreement betweencountries A and B, but those established by the agreements between countries A andC and between countries B and C.
In order to minimize this potential bias, we estimate Equation (1.1) only for thesample of country-pairs that are connected by a direct air service. When a direct servicebetween two countries exists, we can reasonably assume that most of the bilateralpassenger trac is regulated on the basis of the bilateral agreement signed by the twocountries. In fact, case studies suggest that the number of passengers traveling viaa third country when a direct service exists is a small percentage of total passengerow.11 In contrast, when there is no direct ight, the degree of air services liberalizationdened in the agreement between two countries does not represent the conditions underwhich airlines operating the indirect connection work.12
To address the mismatch in the passenger data and the regulatory data, we runregressions on sub-samples of country pairs with distances below 8000 and 5000 kmin columns (3) and (4) of Table 1.4, respectively. The underlying idea is that passen-gers are more likely to y directly on shorter distances, because stopovers prolong thetotal duration of travel relatively more on short-distance than on long-distance ightsand because short-distance ights are more frequent. Therefore, we expect a bettercorrespondence between passengers and regulation on short-distance ights than onlong-distance ights. We indeed nd a stronger impact of air services liberalizationon trac ows in these sub-samples than in the full sample (the ALI coecient in-creases from 0.0067 to 0.018). This suggests that the possible problem created bydata mismatch does not undermine our results. On the contrary, if any, the bias actstoward underestimating the impact of air services liberalization on the number of airpassengers.
In columns (4) and (5) of Table 1.4 we remove from the sample of short-distanceroutes country-pairs of two low- and two high-income countries, respectively, to test
11For example, estimates for a ight from London Gatwick to Dallas based on 1996 informationshow that non-EU passengers constitute less than 20 percent of total passengers (Hanlon, 2006). SinceLondon is an important hub for long-haul ights we should expect this percentage to be even lowerfor other countries and on other routes.
12This is conrmed by the data. When we run regressions only for the sample of country-pairswithout a direct service link, we nd that the coecient for the ALI is insignicant.
Free Sky and Clouds of Restrictions 20
the sensitivity of our results to dierent income groups. The estimated coecient forALI remains positive and signicant, though it is somewhat smaller for the sample ofagreements signed by low- and middle-income countries (column (4)) than for thosesigned by middle- and high-income countries (column (5)).
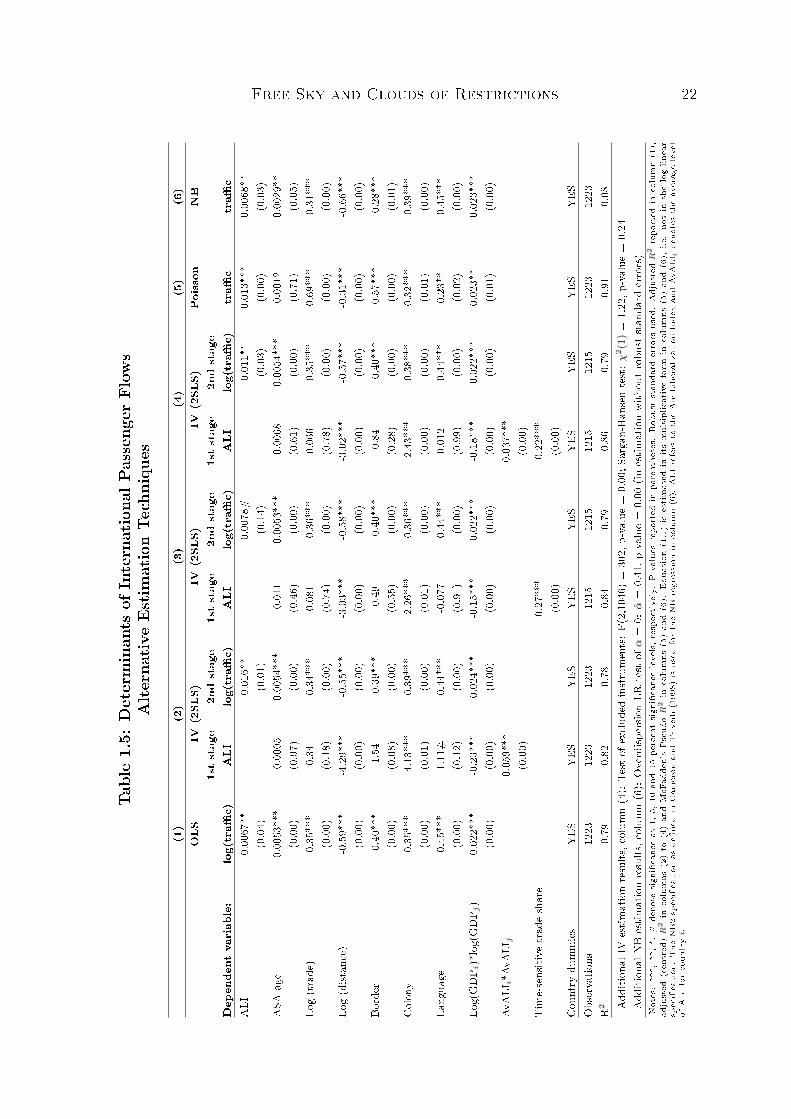
1.5.1 Alternative Estimation Methods
A standard problem of studies that look at the impact of liberalization policies is thepotential endogeneity of the policy variables. One way in which the endogeneity prob-lem can arise in the model is if countries respond to the actual trac volumes bysigning more liberal agreements. For instance, a country could tend to sign liberalagreements with partners with which it has low trac volumes in order to promotebilateral trac. In this case the coecients resulting from OLS estimations would bebiased downwards. On the other hand, OLS will overestimate the impact of liberal-ization on passenger trac, if a country tends to sign liberal agreements with partnerswith whom it already shares high trac volumes.
To address the endogeneity problem, we run instrumental variable (IV) regressionsand report the results in Table 1.5, columns (2) to (4). We use two instruments. Therst instrument is the interaction between the average levels of the ALI (denoted asAvALI ) of the two countries in a pair. This instrument is motivated by the expectationthat the bilateral degree of air services liberalization is positively inuenced by theoverall level of air services liberalization of each country in the pair and that thiseect is likely to be magnied if both countries have already high overall degree ofliberalization. The results of the rst stage regression in column (2) conrm thisexpectation as the coecient of the interaction term AvALI i ∗AvALI j is estimated tobe positive and signicant.13 Furthermore, this instrument is likely to be exogenous tobilateral trac ows, because the average level of air services liberalization of a countryis determined by negotiations with a variety of partners (the average number of partnersfor a country in our sample is 25). In particular, the reversed causality problem tends tobe minimized: If bilateral trac ows inuenced governmental decisions to sign a newAir Services Agreement between the relevant country pair, the overall liberalizationlevel would change only marginally due to a change in one bilateral agreement.
13Note that the linear eect of AvALI i + AvALI j on ALI ij is already captured by the countryxed eects.
Free Sky and Clouds of Restrictions 21
As an alternative instrument, we use the share of trade in time-sensitive goodsin total trade, denoted as time-sensitive trade share. We dene time-sensitive thosesectors, for which the share of imports via air exceeds 40 percent.14 The rationale forusing this instrument relies on the political economy argument that producers of time-sensitive goods will lobby the government to liberalize air cargo transport in order tobenet from lower prices. Since negotiations are costly, liberalization of passenger andcargo air services are likely to go hand in hand. As a result, a high share of trade intime-sensitive goods is likely to act toward liberalization of Air Services Agreementsregulating passenger trac. The results reported in the rst stage regressions in column(3) conrm this intuition. In addition, we expect this instrument to be exogenousbecause there is no particular reason why people trading in time-sensitive goods wouldtend to y more (or less) than people active in other sectors.
The results obtained using the IV estimations conrm a positive and signicanteect of the degree of air services liberalization on the number of passengers. The coef-cient of the ALI estimated with the IV method is always higher than that estimatedwith OLS. This supports the hypothesis that endogeneity arises because countriestend to sign more liberal agreements with the intention to promote initially low tracows. When using both instruments jointly in column (4), the Sargan-Hansen test ofover-identifying restrictions suggests that the instruments are valid instruments, i.e.,uncorrelated with the error term.
To check the robustness of our results to dierent estimation techniques, wealso use the Poisson and the Negative Binomial (NB) estimation methods. Thesetechniques take into account that bilateral passenger trac is a count variable, i.e.non-negative and discrete, and address the heteroscedasticity pattern in the data(Silva and Tenreyro, 2006). The results of these regressions are reported in Table 1.5,columns (5) and (6). The coecient for the ALI remains positive and signicant. Themore exible NB regression turns out to be more suitable than the Poisson regressionaccording to the test for over-dispersion and the coecients obtained by the NB appearto be very similar to those of OLS in column (1). Although the NB is a methodologyexplicitly designed for count data, OLS estimation is in our case a satisfactory methodas well. The reason is that the values of the count variable are large and dispersed andthus the characteristics of the variable are similar to those of a continuous variable.The average number of passengers in our sample is over 410,000.
14Data on imports via air are obtained from the Global Trade Atlas and refer to the US (the listof the time-sensitive sectors is reported in Table 1.12 in Appendix 1.A.3).
Free Sky and Clouds of Restrictions 22
Table1.5:
Determinan
tsof
Internationa
lPasseng
erFlow
sAlte
rnativeEs
timationTe
chniqu
es
(1)
(2)
(3)
(4)
(5)
(6)
OLS
IV(2SL
S)IV
(2SL
S)IV
(2SL
S)Po
isson
NB
1ststage
2ndstage
1ststage
2ndstage
1ststage
2ndstage
Dep
ende
ntvariab
le:
log(tra
c)ALI
log(tra
c)ALI
log(tra
c)ALI
log(tra
c)tra
ctra
cALI
0.00
67**
0.01
6**
0.00
78#
0.01
1**
0.01
3***
0.00
68**
(0.04)
(0.01)
(0.14)
(0.03)
(0.00)
(0.03)
ASA
age
0.00
53**
*-0.000
50.00
54**
*-0.011
0.00
53**
*-0.006
80.00
54**
*0.00
120.00
29**
(0.00)
(0.97)
(0.00)
(0.46)
(0.00)
(0.61)
(0.00)
(0.71)
(0.05)
Log(trade
)0.35
***
0.34
0.34
***
0.08
10.36
***
0.06
60.35
***
0.69
***
0.31
***
(0.00)
(0.18)
(0.00)
(0.74)
(0.00)
(0.78)
(0.00)
(0.00)
(0.00)
Log(dist
ance)
-0.59*
**-4.29*
**-0.55*
**-3.03*
**-0.58*
**-3.02*
**-0.57*
**-0.31*
**-0.66*
**(0.00)
(0.00)
(0.00)
(0.00)
(0.00)
(0.00)
(0.00)
(0.00)
(0.00)
Border
-0.40*
**-1.54
-0.39*
**-0.49
-0.40*
**-0.84
-0.40*
**-0.57*
**-0.28*
**(0.00)
(0.08)
(0.00)
(0.55)
(0.00)
(0.28)
(0.00)
(0.00)
(0.01)
Colon
y0.35
***
-4.13*
**0.39
***
-2.26*
**0.36
***
-2.43*
**0.38
***
0.32
***
0.39
***
(0.00)
(0.01)
(0.00)
(0.01)
(0.00)
(0.00)
(0.00)
(0.01)
(0.00)
Lang
uage
0.45
***
1.11
#0.44
***
-0.077
0.44
***
0.01
20.44
***
0.23
**0.45
***
(0.00)
(0.12)
(0.00)
(0.91)
(0.00)
(0.99)
(0.00)
(0.02)
(0.00)
Log(GDP i
)*log(GDP j
)0.02
2***
-0.23*
**0.02
4***
-0.15*
**0.02
2***
-0.18*
**0.02
2***
0.02
3**
0.02
3***
(0.00)
(0.00)
(0.00)
(0.00)
(0.00)
(0.00)
(0.00)
(0.01)
(0.00)
AvALI
i*A
vALI
j0.05
9***
0.03
7***
(0.00)
(0.00)
Tim
e-sensitive
trad
eshare
0.27
***
0.22
***
(0.00)
(0.00)
Cou
ntry
dummies
YES
YES
YES
YES
YES
YES
YES
YES
YES
Observatio
ns12
2312
2312
2312
1512
1512
1512
1512
2312
23R
20.79
0.82
0.78
0.84
0.79
0.86
0.79
0.91
0.08
Add
ition
alIV
estim
ationresults
,colum
n(4):
Test
ofexclud
edinstruments:F(
2,10
46)=
302,
p-value=
0.00
;Sarga
n-Han
sentest:χ
2(1
)=
1.22
,p-value
=0.24
Add
ition
alNB
estim
ationresults
,colum
n(6):
Overdisp
ersio
nLR
test
ofα=
0:α=
0.41
,p-value
=0.00
(inestim
ationwith
outrobu
ststan
dard
errors)
Notes:**
*,**
,*,
#de
note
sign
icanc
eat
1,5,
10an
d15
percentsign
icanc
elevels,respectively.P-value
srepo
rted
inpa
renthe
ses.
Rob
uststan
dard
errors
used
.Adjusted
R2repo
rted
incolumn(1),
adjusted
(centred
)R
2in
columns
(2)to
(4)an
dMcF
adde
n'sPseud
oR
2in
columns
(5)an
d(6).
Equ
ation(1.1)is
estimated
initsmultiplicativeform
incolumns
(5)an
d(6),
i.e.no
tin
thelog-lin
ear
specication
.The
NB2specication
asde
ned
inCam
eron
andTr
ived
i(19
98)is
used
fortheNB
regression
incolumn(6).
ALI
refers
totheAir
Libe
raliz
ationInde
xan
dAv
ALI
ide
notestheaverag
elevel
ofALI
forcoun
try
i.
Free Sky and Clouds of Restrictions 23
In conclusion, the most conservative estimate regarding the variable of interest isobtained by the standard OLS estimation method. For this reason the results presentedhereafter are those obtained using this method.
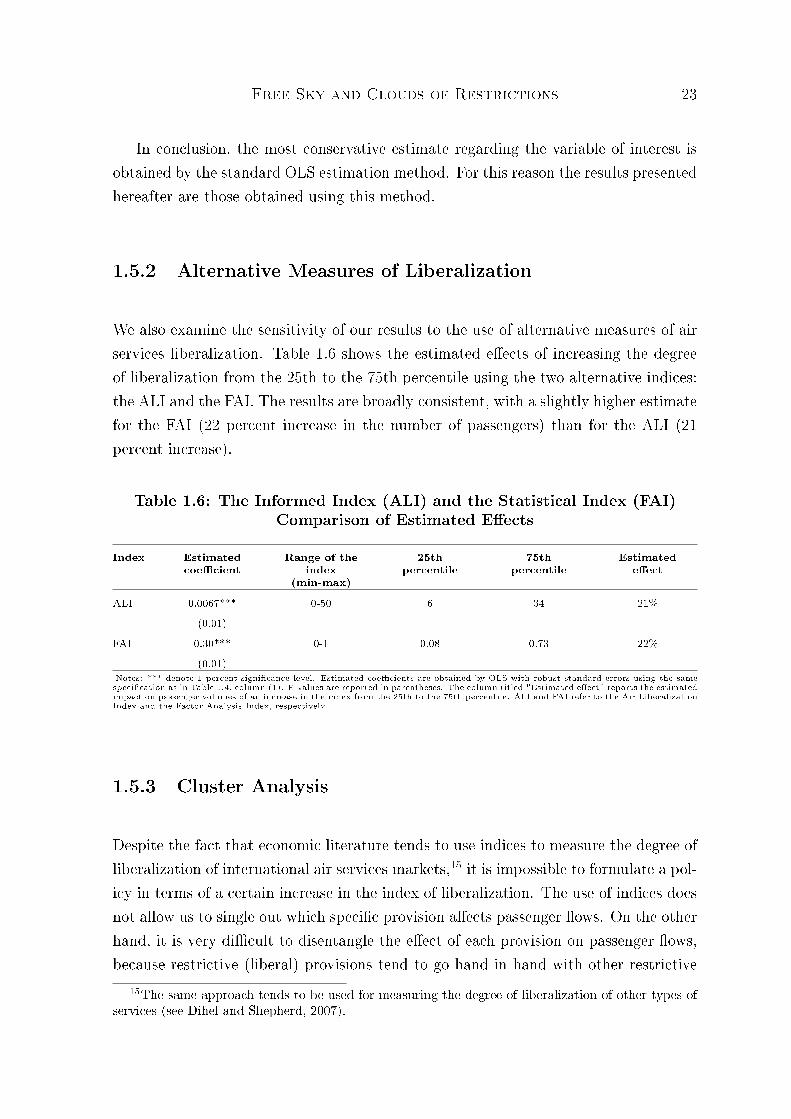
1.5.2 Alternative Measures of Liberalization
We also examine the sensitivity of our results to the use of alternative measures of airservices liberalization. Table 1.6 shows the estimated eects of increasing the degreeof liberalization from the 25th to the 75th percentile using the two alternative indices:the ALI and the FAI. The results are broadly consistent, with a slightly higher estimatefor the FAI (22 percent increase in the number of passengers) than for the ALI (21percent increase).
Table 1.6: The Informed Index (ALI) and the Statistical Index (FAI)Comparison of Estimated Eects
Index Estimatedcoecient
Range of theindex
(min-max)
25thpercentile
75thpercentile
Estimatedeect
ALI 0.0067*** 0-50 6 34 21%(0.01)
FAI 0.30*** 0-1 0.08 0.73 22%(0.01)
Notes: *** denote 1 percent signicance level. Estimated coecients are obtained by OLS with robust standard errors using the samespecication as in Table 1.4, column (1). P-values are reported in parentheses. The column titled "Estimated eect" reports the estimatedimpact on passenger volumes of an increase in the index from the 25th to the 75th percentile. ALI and FAI refer to the Air LiberalizationIndex and the Factor Analysis Index, respectively.
1.5.3 Cluster Analysis
Despite the fact that economic literature tends to use indices to measure the degree ofliberalization of international air services markets,15 it is impossible to formulate a pol-icy in terms of a certain increase in the index of liberalization. The use of indices doesnot allow us to single out which specic provision aects passenger ows. On the otherhand, it is very dicult to disentangle the eect of each provision on passenger ows,because restrictive (liberal) provisions tend to go hand in hand with other restrictive
15The same approach tends to be used for measuring the degree of liberalization of other types ofservices (see Dihel and Shepherd, 2007).
Free Sky and Clouds of Restrictions 24
(liberal) provisions within one agreement, thus creating a problem of multicollinerityin estimations.
To address the issue of multicollinearity and to identify the relative importanceof dierent types of agreements for passenger ows, we use cluster analysis. Clus-ter analysis is a suitable tool to distinguish various types of agreements, because itclassies objects (agreements) into dierent groups (clusters) according to their "simi-larity". In the analysis that follows, we use agglomerative hierarchical cluster analysis(Härdle and Simar, 2007) that takes each observation as a separate cluster at the be-ginning and merges them successively into larger and larger clusters.
We conduct cluster analysis in two steps. In the rst step, we identify provisionsthat have a signicant eect on passenger ows by running three dierent types of grav-ity regressions. First, we run a set of 19 regressions, one for each provision (modeledby a dummy variable). Then, we run a set of seven regressions, each one includ-ing the group of provisions specic to a certain indicator of liberalization (grants ofright, withholding, etc.). Finally, we run one regression with all provisions. Using anon-conservative signicance level of 15 percent to detect all potentially inuential pro-visions, we identify nine provisions, signicant in at least one regression.16 These areseventh freedom, cabotage, free determination of capacity, free pricing, community ofinterest, multiple designation and no requirement for statistical exchange all showinga positive eect on passenger ows and dual approval and substantial ownership andeective control showing a negative sign.17 In the second step, we use these nineprovisions as distinguishing features for the cluster analysis.
The rst level of aggregation reveals 24 dierent types of existing agreements. Inorder to obtain more balanced clusters in terms of the number of agreements, we optedfor higher levels of aggregation. Table 1.7 displays seven clusters obtained at the sev-enteenth level of aggregation. This level turned out to be reasonable in terms of thenumber of observations in each cluster and in terms of explanatory power in the grav-ity regressions. Clusters are ordered from the most restrictive to the most liberal type(from C1 to C7) and for each cluster the percentage of agreements characterized bya certain provision is reported. For instance, cluster C1 includes the most restrictive
16The results of these regressions are available on request.17Recall that passenger trac data do not contain information on stop-overs. For this reason we
use only the sample of country pairs with a direct service link. It is therefore not surprising that fthfreedom that relates exclusively to stop-over ights is not found to be signicant in this sample. Thefact that we nd a signicant eect of fth freedom for the sample of country pairs without a directconnection conrms this intuition.
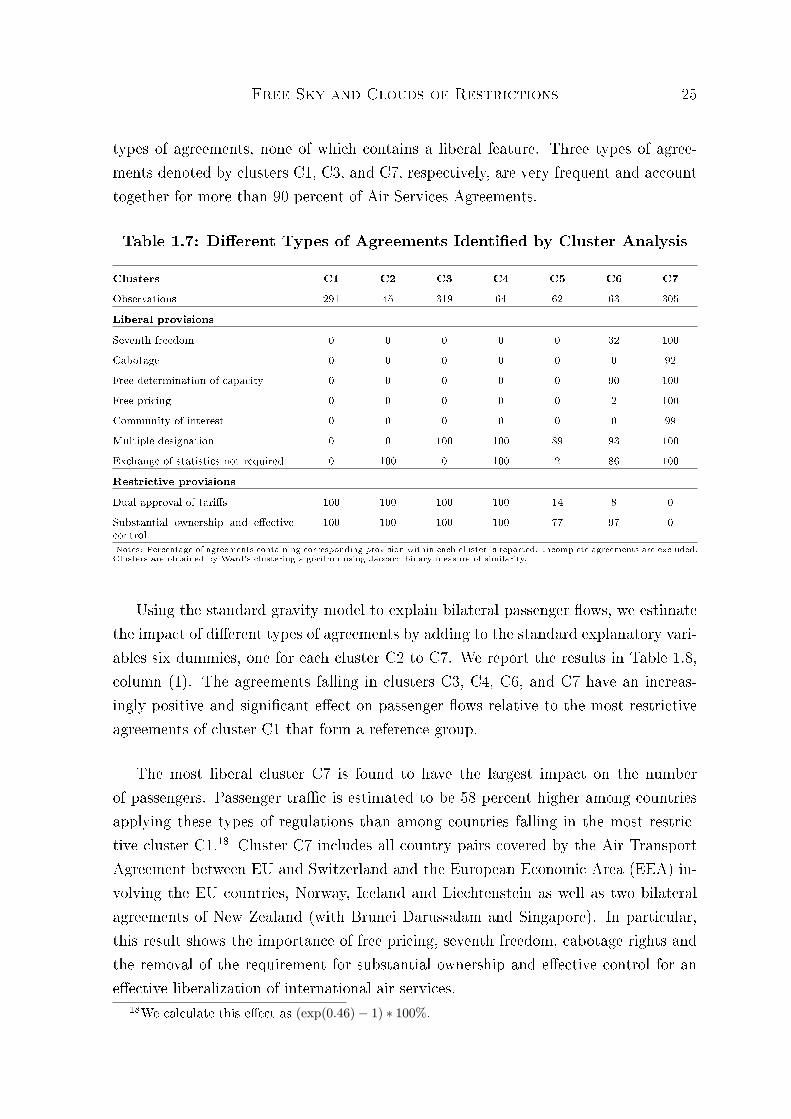
Free Sky and Clouds of Restrictions 25
types of agreements, none of which contains a liberal feature. Three types of agree-ments denoted by clusters C1, C3, and C7, respectively, are very frequent and accounttogether for more than 90 percent of Air Services Agreements.
Table 1.7: Dierent Types of Agreements Identied by Cluster Analysis
Clusters C1 C2 C3 C4 C5 C6 C7Observations 291 45 319 64 62 63 305
Liberal provisionsSeventh freedom 0 0 0 0 0 32 100Cabotage 0 0 0 0 0 0 92Free determination of capacity 0 0 0 0 0 90 100Free pricing 0 0 0 0 0 2 100Community of interest 0 0 0 0 0 0 99Multiple designation 0 0 100 100 89 93 100Exchange of statistics not required 0 100 0 100 2 86 100
Restrictive provisionsDual approval of taris 100 100 100 100 14 8 0Substantial ownership and eectivecontrol
100 100 100 100 77 97 0
Notes: Percentage of agreements containing corresponding provision within each cluster is reported. Incomplete agreements are excluded.Clusters are obtained by Ward's clustering algorithm using Jaccard binary measure of similarity.
Using the standard gravity model to explain bilateral passenger ows, we estimatethe impact of dierent types of agreements by adding to the standard explanatory vari-ables six dummies, one for each cluster C2 to C7. We report the results in Table 1.8,column (1). The agreements falling in clusters C3, C4, C6, and C7 have an increas-ingly positive and signicant eect on passenger ows relative to the most restrictiveagreements of cluster C1 that form a reference group.
The most liberal cluster C7 is found to have the largest impact on the numberof passengers. Passenger trac is estimated to be 58 percent higher among countriesapplying these types of regulations than among countries falling in the most restric-tive cluster C1.18 Cluster C7 includes all country pairs covered by the Air TransportAgreement between EU and Switzerland and the European Economic Area (EEA) in-volving the EU countries, Norway, Iceland and Liechtenstein as well as two bilateralagreements of New Zealand (with Brunei Darussalam and Singapore). In particular,this result shows the importance of free pricing, seventh freedom, cabotage rights andthe removal of the requirement for substantial ownership and eective control for aneective liberalization of international air services.
18We calculate this eect as (exp(0.46)− 1) ∗ 100%.
Free Sky and Clouds of Restrictions 26
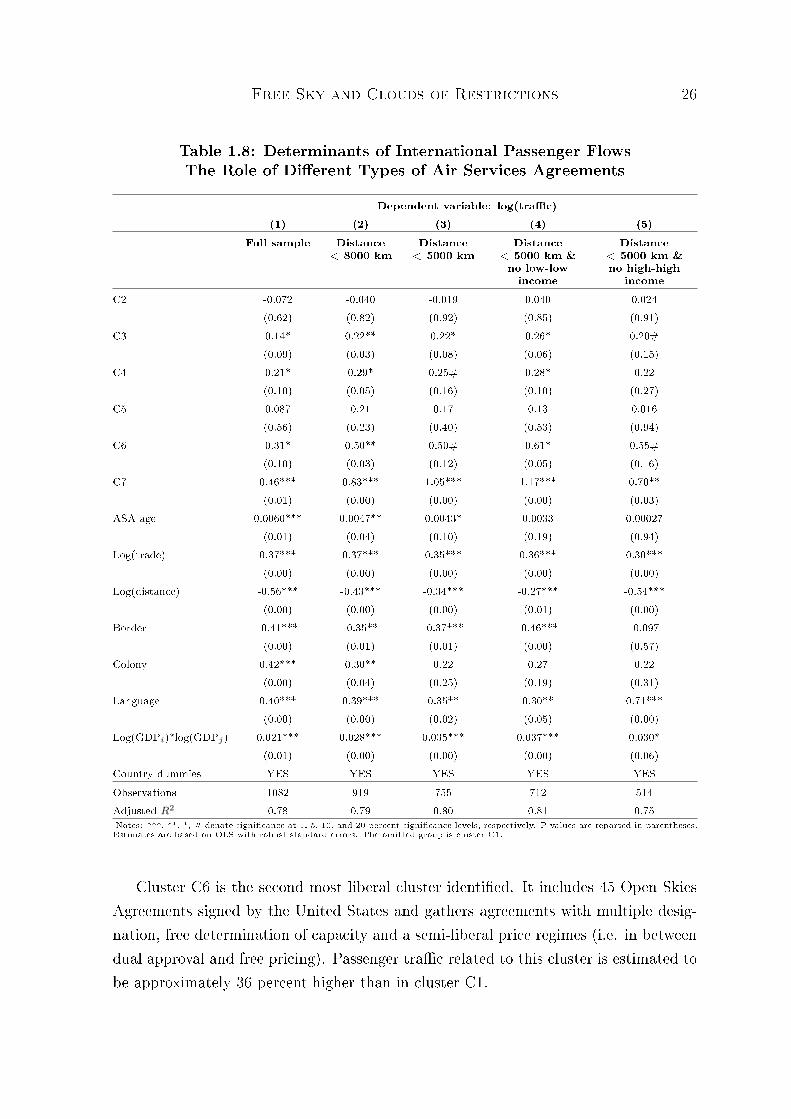
Table 1.8: Determinants of International Passenger FlowsThe Role of Dierent Types of Air Services Agreements
Dependent variable: log(trac)(1) (2) (3) (4) (5)
Full sample Distance< 8000 km
Distance< 5000 km
Distance< 5000 km &no low-lowincome
Distance< 5000 km &no high-high
incomeC2 -0.072 -0.040 -0.019 0.040 0.024
(0.62) (0.82) (0.92) (0.85) (0.91)C3 0.14* 0.22** 0.22* 0.26* 0.20#
(0.09) (0.03) (0.08) (0.06) (0.15)C4 0.21* 0.29* 0.25# 0.28* 0.22
(0.10) (0.05) (0.16) (0.10) (0.27)C5 0.087 0.21 0.17 0.13 0.016
(0.56) (0.23) (0.40) (0.53) (0.94)C6 0.31* 0.50** 0.50# 0.61* 0.55#
(0.10) (0.03) (0.12) (0.05) (0.16)C7 0.46*** 0.83*** 1.05*** 1.17*** 0.70**
(0.01) (0.00) (0.00) (0.00) (0.03)ASA age 0.0060*** 0.0047** 0.0043* 0.0033 0.00027
(0.01) (0.04) (0.10) (0.19) (0.94)Log(trade) 0.37*** 0.37*** 0.35*** 0.36*** 0.30***
(0.00) (0.00) (0.00) (0.00) (0.00)Log(distance) -0.56*** -0.43*** -0.34*** -0.27*** -0.54***
(0.00) (0.00) (0.00) (0.01) (0.00)Border -0.41*** -0.35** -0.37*** -0.46*** -0.097
(0.00) (0.01) (0.01) (0.00) (0.57)Colony 0.42*** 0.30** 0.22 0.27 0.22
(0.00) (0.04) (0.25) (0.19) (0.31)Language 0.40*** 0.39*** 0.35** 0.30** 0.71***
(0.00) (0.00) (0.02) (0.05) (0.00)Log(GDPi)*log(GDPj) 0.021*** 0.028*** 0.035*** 0.037*** 0.030*
(0.01) (0.00) (0.00) (0.00) (0.06)Country dummies YES YES YES YES YESObservations 1082 919 755 712 514Adjusted R2 0.78 0.79 0.80 0.81 0.75Notes: ***, **, *, # denote signicance at 1, 5, 10, and 20 percent signicance levels, respectively. P-values are reported in parentheses.Estimates are based on OLS with robust standard errors. The omitted group is cluster C1.
Cluster C6 is the second most liberal cluster identied. It includes 45 Open SkiesAgreements signed by the United States and gathers agreements with multiple desig-nation, free determination of capacity and a semi-liberal price regimes (i.e. in betweendual approval and free pricing). Passenger trac related to this cluster is estimated tobe approximately 36 percent higher than in cluster C1.
Free Sky and Clouds of Restrictions 27
The positive coecient for cluster C4 and C3 shows the importance of multipledesignation, that accounts for some 15 to 21 percent increase in passenger trac com-pared to cluster C1. The countries that most frequently appear in these groups are:for cluster C4 the United States and France (in eight agreements), Tunisia and Brazil(in six agreements) and Paraguay (in ve agreements); for cluster C3 United Kingdom(37 agreements), Hong-Kong China (22 agreements), India (21 agreements), Singapore(16 agreements) or Malaysia (15 agreements).
To check the robustness of the results, we estimate the eects of dierent typesof agreements using various subsamples in columns (2) to (5) of Table 1.8. In linewith the results in Table 1.4, we nd a stronger impact of air services liberalization onpassenger ows, when using subsamples of short-distance ights (columns (2) and (3)).Similarly, the impact is estimated to be higher when using the sample of agreementssigned by high- and middle-income countries (column (4)) compared to the sample ofagreements signed by middle- and low-income countries (column (5)). The dierence is,however, rather small for the type of agreements with multiple designation and OpenSkies-type of agreements, which suggests a similar response of passenger trac owsto the implementation of those two types of agreements across countries with dierentlevel of income.
Overall, we consistently nd positive and signicant eects of agreements that intro-duce multiple designation (cluster C3 and C4), Open Skies-type of agreements (clusterC6), and the EEA-type of agreements (cluster C7). The result that more liberal agree-ments increase passenger ows the most also appears to be robust.
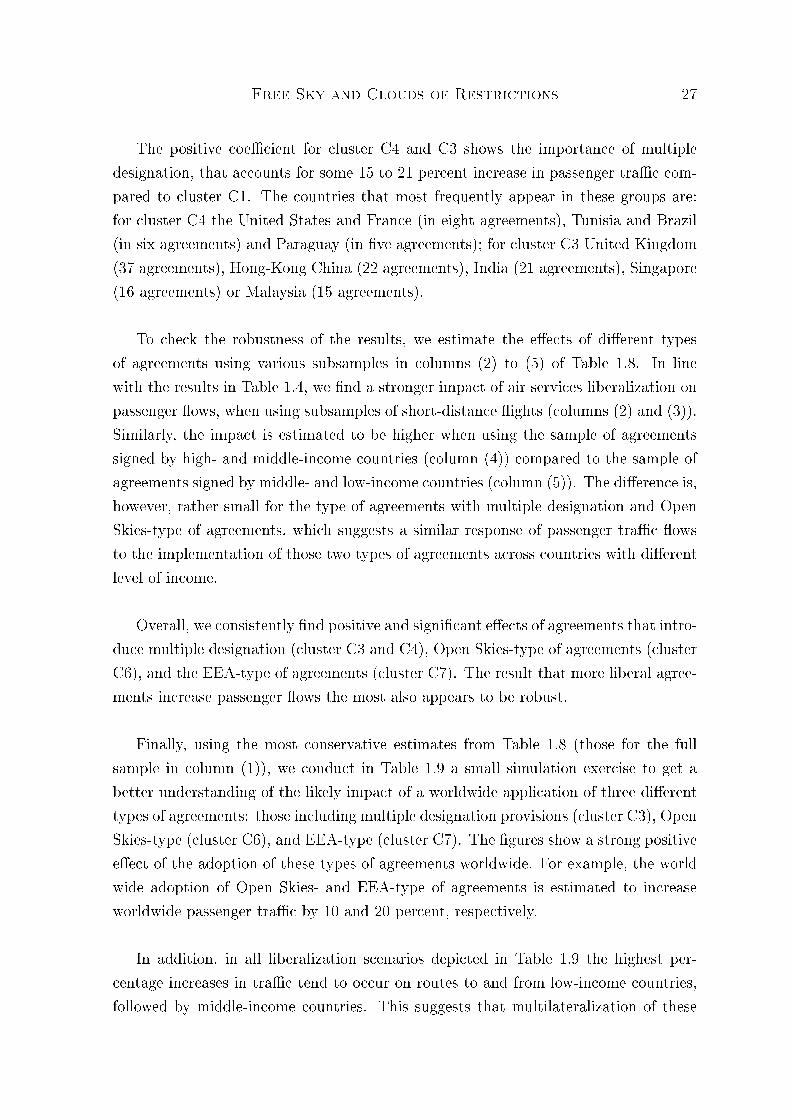
Finally, using the most conservative estimates from Table 1.8 (those for the fullsample in column (1)), we conduct in Table 1.9 a small simulation exercise to get abetter understanding of the likely impact of a worldwide application of three dierenttypes of agreements: those including multiple designation provisions (cluster C3), OpenSkies-type (cluster C6), and EEA-type (cluster C7). The gures show a strong positiveeect of the adoption of these types of agreements worldwide. For example, the worldwide adoption of Open Skies- and EEA-type of agreements is estimated to increaseworldwide passenger trac by 10 and 20 percent, respectively.
In addition, in all liberalization scenarios depicted in Table 1.9 the highest per-centage increases in trac tend to occur on routes to and from low-income countries,followed by middle-income countries. This suggests that multilateralization of these
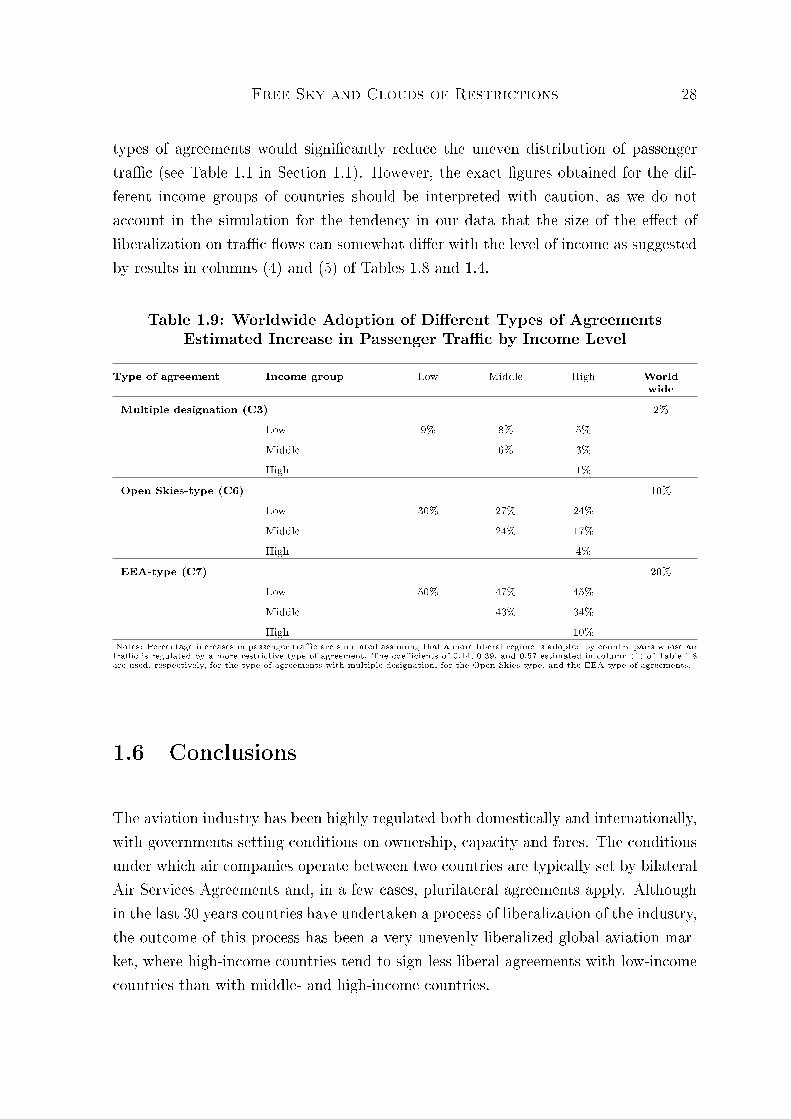
Free Sky and Clouds of Restrictions 28
types of agreements would signicantly reduce the uneven distribution of passengertrac (see Table 1.1 in Section 1.1). However, the exact gures obtained for the dif-ferent income groups of countries should be interpreted with caution, as we do notaccount in the simulation for the tendency in our data that the size of the eect ofliberalization on trac ows can somewhat dier with the level of income as suggestedby results in columns (4) and (5) of Tables 1.8 and 1.4.
Table 1.9: Worldwide Adoption of Dierent Types of AgreementsEstimated Increase in Passenger Trac by Income Level
Type of agreement Income group Low Middle High Worldwide
Multiple designation (C3) 2%Low 9% 8% 5%Middle 6% 3%High 1%
Open Skies-type (C6) 10%Low 30% 27% 24%Middle 24% 17%High 4%
EEA-type (C7) 20%Low 50% 47% 45%Middle 43% 34%High 10%
Notes: Percentage increases in passenger trac are simulated assuming that a more liberal regime is adopted by country pairs whose airtrac is regulated by a more restrictive type of agreement. The coecients of 0.14, 0.39, and 0.57 estimated in column (1) of Table 1.8are used, respectively, for the type of agreements with multiple designation, for the Open Skies-type, and the EEA-type of agreements.
1.6 Conclusions
The aviation industry has been highly regulated both domestically and internationally,with governments setting conditions on ownership, capacity and fares. The conditionsunder which air companies operate between two countries are typically set by bilateralAir Services Agreements and, in a few cases, plurilateral agreements apply. Althoughin the last 30 years countries have undertaken a process of liberalization of the industry,the outcome of this process has been a very unevenly liberalized global aviation mar-ket, where high-income countries tend to sign less liberal agreements with low-incomecountries than with middle- and high-income countries.
Free Sky and Clouds of Restrictions 29
To assess the economic impact of the present system of Air Services Agreements,this chapter focuses on international air passenger transport, an important factor infacilitating trade and in the development of other sectors of an economy such as tourism.Relying on detailed information on the regulatory set-up of the aviation market for asample of some 2300 Air Services Agreements, we estimate the impact of the degree ofair services liberalization on the volume of international passenger ows.
Following the traditional approach of measuring the degree of liberalization bymeans of an index, we nd strong evidence of a positive and signicant impact of thedegree of liberalization of the international aviation market on passenger trac. Inparticular, we estimate that increasing the degree of liberalization from the 25th to the75th percentile increases passenger trac by approximately 21 percent. This eect isshown to be robust to potential problems of endogeneity, heteroscedasticity and datainaccuracy.
However, unlike the removal of tari barriers in goods, the liberalization of airtransport services cannot take place in the form of a continuous process of liberalization.For this reason we conduct a cluster analysis to disentangle the eects of dierenttypes of possible agreements. Using this approach, we show that the positive eectof liberalization on passenger trac is driven by particular types of agreements: thoseincluding multiple designation, Open Skies-type, and European Economic Area-type(EEA-type) of agreements. For instance, we estimate that trac ows regulated bythe very liberal EEA-type of agreements tend to be by some 22 percent higher thattrac ows regulated by the Open Skies-type of agreements. In addition, our resultssuggest that multilateralization of multiple designation provisions and Open Skies-typeof agreements is likely to increase passenger trac worldwide by two and ten percent,respectively.
More research is needed to quantify the impact of Air Services Agreements oncargo trac. The results of this chapter, however, suggest a very important policyimplication. The present system of a plethora of Air Services Agreements characterizedby a variety of degrees of liberalization generates a discriminatory environment foraccess to air services. This discrimination appears particularly to penalize low-incomecountries that tend to sign less liberal Air Services Agreements. They may be theprimary beneciary of improved access to the international aviation market.
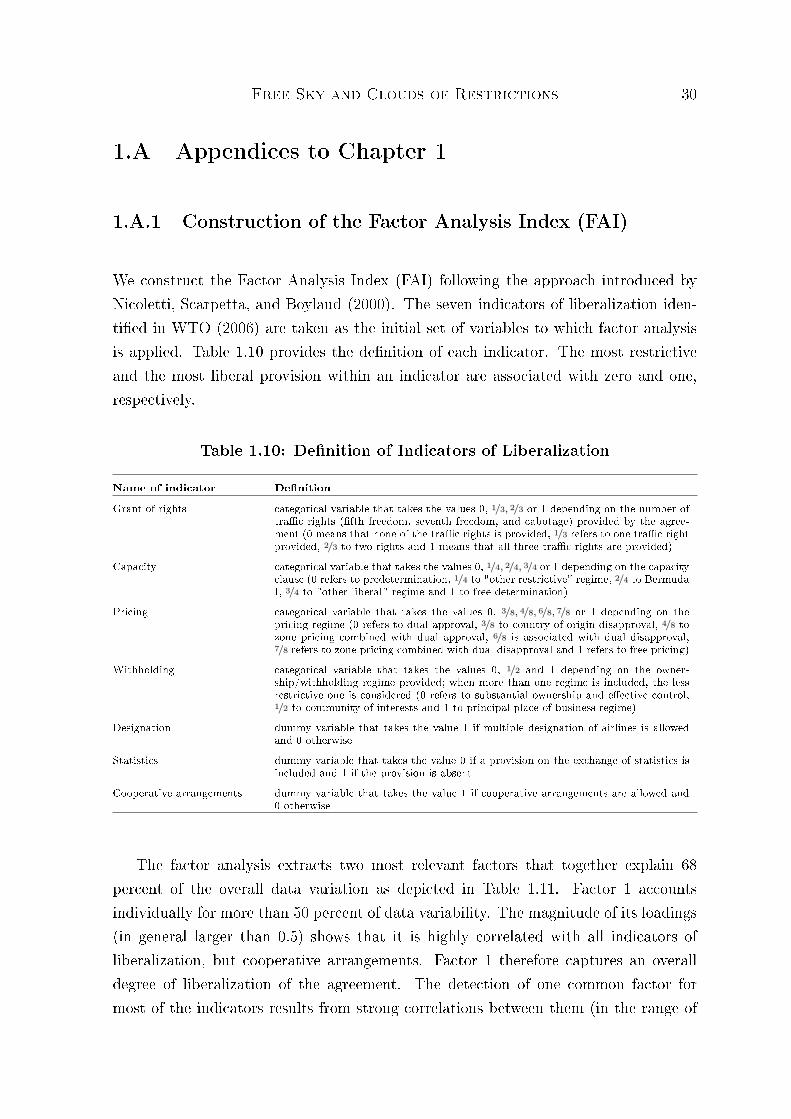
Free Sky and Clouds of Restrictions 30
1.A Appendices to Chapter 1
1.A.1 Construction of the Factor Analysis Index (FAI)
We construct the Factor Analysis Index (FAI) following the approach introduced byNicoletti, Scarpetta, and Boylaud (2000). The seven indicators of liberalization iden-tied in WTO (2006) are taken as the initial set of variables to which factor analysisis applied. Table 1.10 provides the denition of each indicator. The most restrictiveand the most liberal provision within an indicator are associated with zero and one,respectively.
Table 1.10: Denition of Indicators of Liberalization
Name of indicator DenitionGrant of rights categorical variable that takes the values 0, 1/3, 2/3 or 1 depending on the number of
trac rights (fth freedom, seventh freedom, and cabotage) provided by the agree-ment (0 means that none of the trac rights is provided, 1/3 refers to one trac rightprovided, 2/3 to two rights and 1 means that all three trac rights are provided)
Capacity categorical variable that takes the values 0, 1/4, 2/4, 3/4 or 1 depending on the capacityclause (0 refers to predetermination, 1/4 to "other restrictive" regime, 2/4 to BermudaI, 3/4 to "other liberal" regime and 1 to free determination)
Pricing categorical variable that takes the values 0, 3/8, 4/8, 6/8, 7/8 or 1 depending on thepricing regime (0 refers to dual approval, 3/8 to country of origin disapproval, 4/8 tozone pricing combined with dual approval, 6/8 is associated with dual disapproval,7/8 refers to zone pricing combined with dual disapproval and 1 refers to free pricing)
Withholding categorical variable that takes the values 0, 1/2 and 1 depending on the owner-ship/withholding regime provided; when more than one regime is included, the lessrestrictive one is considered (0 refers to substantial ownership and eective control,1/2 to community of interests and 1 to principal place of business regime)
Designation dummy variable that takes the value 1 if multiple designation of airlines is allowedand 0 otherwise
Statistics dummy variable that takes the value 0 if a provision on the exchange of statistics isincluded and 1 if the provision is absent
Cooperative arrangements dummy variable that takes the value 1 if cooperative arrangements are allowed and0 otherwise
The factor analysis extracts two most relevant factors that together explain 68percent of the overall data variation as depicted in Table 1.11. Factor 1 accountsindividually for more than 50 percent of data variability. The magnitude of its loadings(in general larger than 0.5) shows that it is highly correlated with all indicators ofliberalization, but cooperative arrangements. Factor 1 therefore captures an overalldegree of liberalization of the agreement. The detection of one common factor formost of the indicators results from strong correlations between them (in the range of
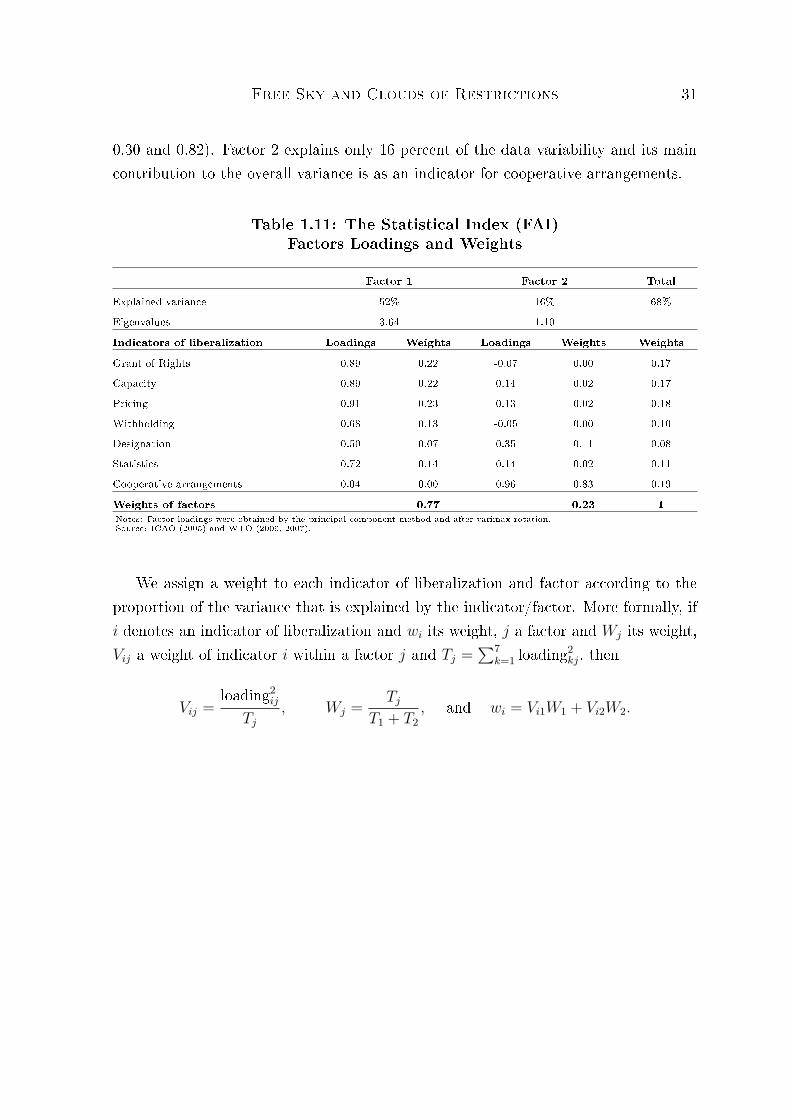
Free Sky and Clouds of Restrictions 31
0.30 and 0.82). Factor 2 explains only 16 percent of the data variability and its maincontribution to the overall variance is as an indicator for cooperative arrangements.
Table 1.11: The Statistical Index (FAI)Factors Loadings and Weights
Factor 1 Factor 2 TotalExplained variance 52% 16% 68%Eigenvalues 3.64 1.10
Indicators of liberalization Loadings Weights Loadings Weights WeightsGrant of Rights 0.89 0.22 -0.07 0.00 0.17Capacity 0.89 0.22 0.14 0.02 0.17Pricing 0.91 0.23 0.13 0.02 0.18Withholding 0.68 0.13 -0.05 0.00 0.10Designation 0.50 0.07 0.35 0.11 0.08Statistics 0.72 0.14 0.14 0.02 0.11Cooperative arrangements 0.04 0.00 0.96 0.83 0.19
Weights of factors 0.77 0.23 1Notes: Factor loadings were obtained by the principal component method and after varimax rotation.Source: ICAO (2005) and WTO (2006, 2007).
We assign a weight to each indicator of liberalization and factor according to theproportion of the variance that is explained by the indicator/factor. More formally, ifi denotes an indicator of liberalization and wi its weight, j a factor and Wj its weight,Vij a weight of indicator i within a factor j and Tj =
∑7k=1 loading2
kj, then
Vij =loading2
ij
Tj
, Wj =Tj
T1 + T2
, and wi = Vi1W1 + Vi2W2.
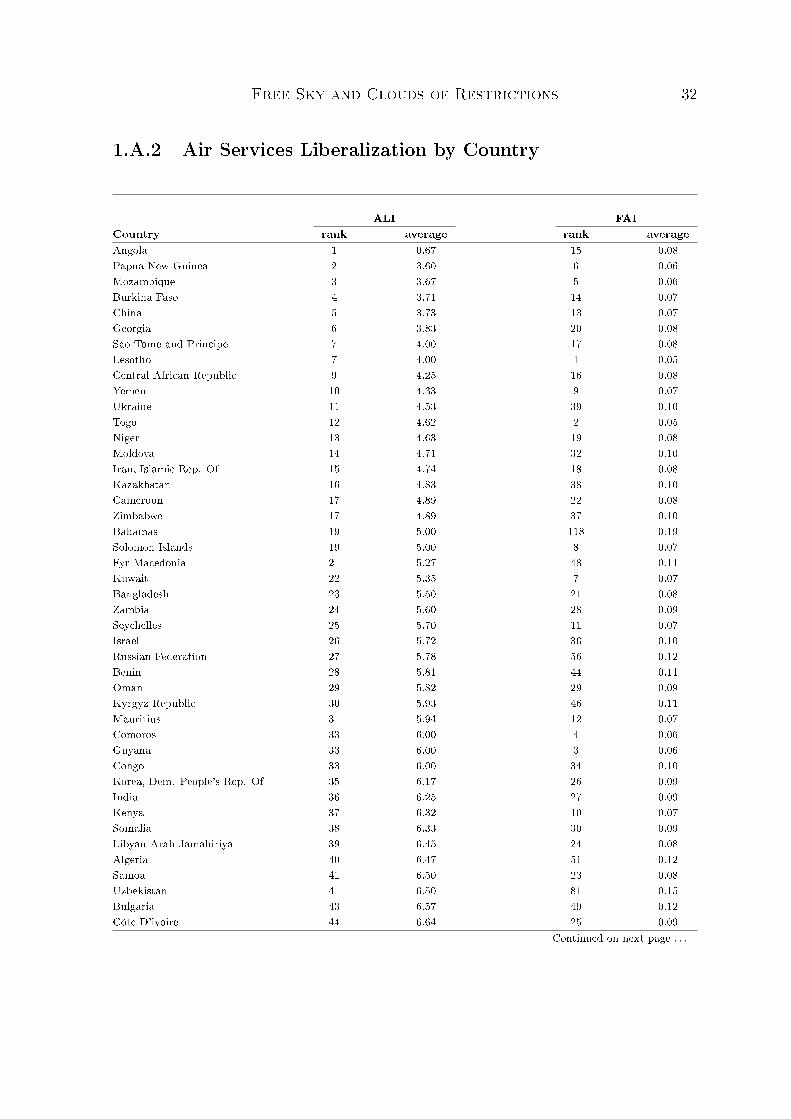
Free Sky and Clouds of Restrictions 32
1.A.2 Air Services Liberalization by Country
ALI FAICountry rank average rank averageAngola 1 0.67 15 0.08Papua New Guinea 2 3.60 6 0.06Mozambique 3 3.67 5 0.06Burkina Faso 4 3.71 14 0.07China 5 3.73 13 0.07Georgia 6 3.83 20 0.08Sao Tome and Principe 7 4.00 17 0.08Lesotho 7 4.00 1 0.05Central African Republic 9 4.25 16 0.08Yemen 10 4.33 9 0.07Ukraine 11 4.53 39 0.10Togo 12 4.62 2 0.05Niger 13 4.63 19 0.08Moldova 14 4.71 32 0.10Iran, Islamic Rep. Of 15 4.74 18 0.08Kazakhstan 16 4.83 38 0.10Cameroon 17 4.89 22 0.08Zimbabwe 17 4.89 37 0.10Bahamas 19 5.00 118 0.19Solomon Islands 19 5.00 8 0.07Fyr Macedonia 21 5.27 48 0.11Kuwait 22 5.35 7 0.07Bangladesh 23 5.50 21 0.08Zambia 24 5.60 28 0.09Seychelles 25 5.70 11 0.07Israel 26 5.72 36 0.10Russian Federation 27 5.78 56 0.12Benin 28 5.81 44 0.11Oman 29 5.82 29 0.09Kyrgyz Republic 30 5.93 46 0.11Mauritius 31 5.94 12 0.07Comoros 33 6.00 4 0.06Guyana 33 6.00 3 0.06Congo 33 6.00 34 0.10Korea, Dem. People's Rep. Of 35 6.17 26 0.09India 36 6.25 27 0.09Kenya 37 6.32 10 0.07Somalia 38 6.33 30 0.09Libyan Arab Jamahiriya 39 6.45 24 0.08Algeria 40 6.47 51 0.12Samoa 41 6.50 23 0.08Uzbekistan 41 6.50 81 0.15Bulgaria 43 6.57 49 0.12Côte D'ivoire 44 6.64 25 0.09
Continued on next page . . .
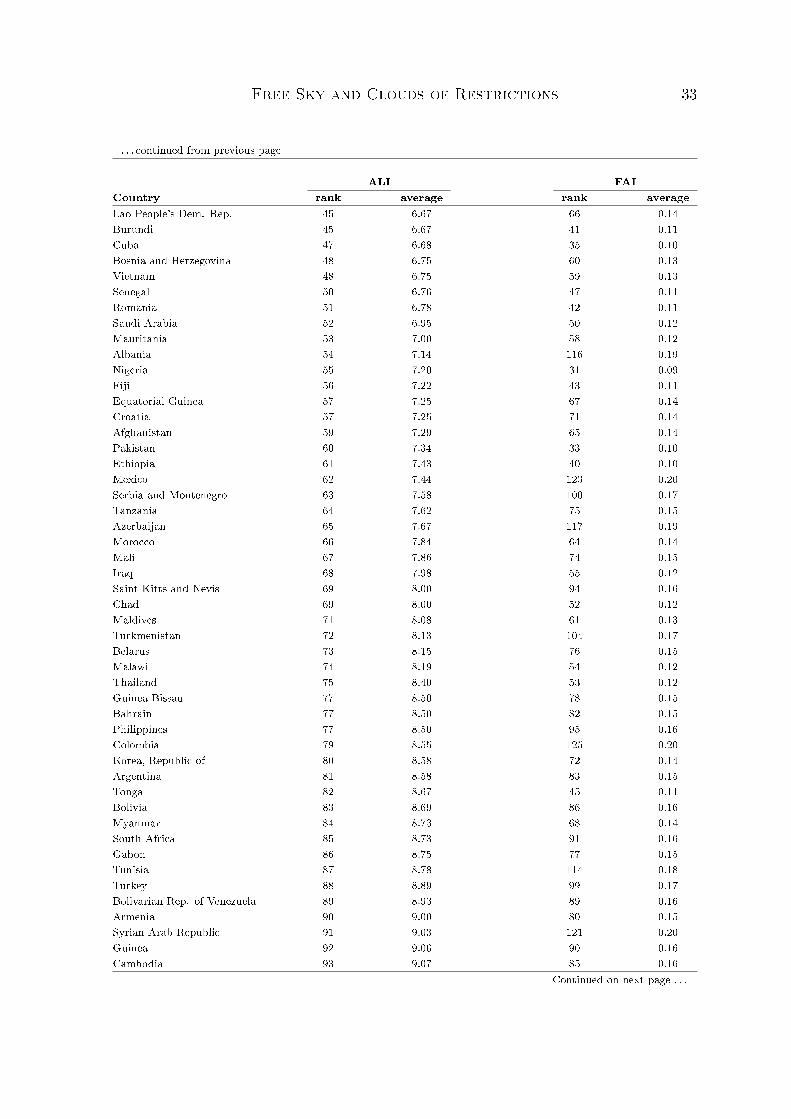
Free Sky and Clouds of Restrictions 33
. . . continued from previous page
ALI FAICountry rank average rank averageLao People's Dem. Rep. 45 6.67 66 0.14Burundi 45 6.67 41 0.11Cuba 47 6.68 35 0.10Bosnia and Herzegovina 48 6.75 60 0.13Vietnam 48 6.75 59 0.13Senegal 50 6.76 47 0.11Romania 51 6.78 42 0.11Saudi Arabia 52 6.95 50 0.12Mauritania 53 7.00 58 0.12Albania 54 7.14 116 0.19Nigeria 55 7.20 31 0.09Fiji 56 7.22 43 0.11Equatorial Guinea 57 7.25 67 0.14Croatia 57 7.25 71 0.14Afghanistan 59 7.29 65 0.14Pakistan 60 7.34 33 0.10Ethiopia 61 7.43 40 0.10Mexico 62 7.44 123 0.20Serbia and Montenegro 63 7.58 100 0.17Tanzania 64 7.62 75 0.15Azerbaijan 65 7.67 117 0.19Morocco 66 7.84 64 0.14Mali 67 7.86 74 0.15Iraq 68 7.98 55 0.12Saint Kitts and Nevis 69 8.00 94 0.16Chad 69 8.00 52 0.12Maldives 71 8.08 61 0.13Turkmenistan 72 8.13 104 0.17Belarus 73 8.15 76 0.15Malawi 74 8.19 54 0.12Thailand 75 8.40 53 0.12Guinea-Bissau 77 8.50 78 0.15Bahrain 77 8.50 82 0.15Philippines 77 8.50 95 0.16Colombia 79 8.55 125 0.20Korea, Republic of 80 8.58 72 0.14Argentina 81 8.58 83 0.15Tonga 82 8.67 45 0.11Bolivia 83 8.69 86 0.16Myanmar 84 8.73 68 0.14South Africa 85 8.73 91 0.16Gabon 86 8.75 77 0.15Tunisia 87 8.78 114 0.18Turkey 88 8.89 99 0.17Bolivarian Rep. of Venezuela 89 8.93 89 0.16Armenia 90 9.00 80 0.15Syrian Arab Republic 91 9.03 121 0.20Guinea 92 9.06 90 0.16Cambodia 93 9.07 85 0.16
Continued on next page . . .
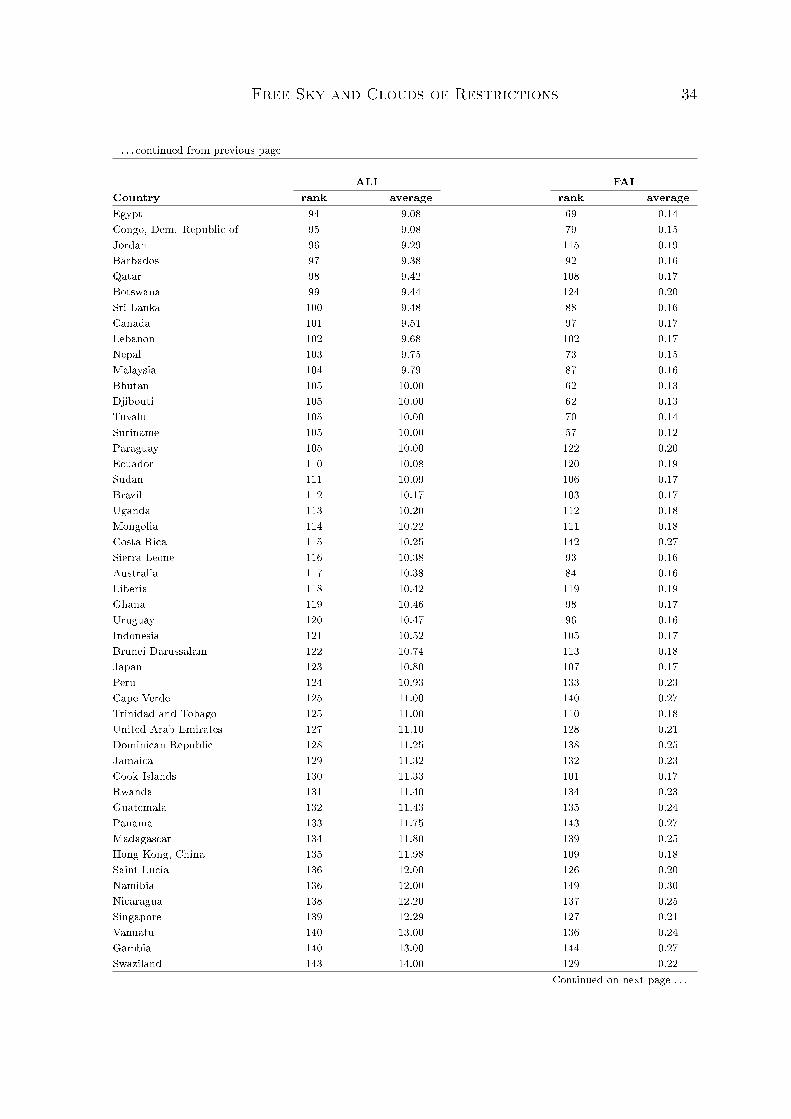
Free Sky and Clouds of Restrictions 34
. . . continued from previous page
ALI FAICountry rank average rank averageEgypt 94 9.08 69 0.14Congo, Dem. Republic of 95 9.08 79 0.15Jordan 96 9.29 115 0.19Barbados 97 9.38 92 0.16Qatar 98 9.42 108 0.17Botswana 99 9.44 124 0.20Sri Lanka 100 9.48 88 0.16Canada 101 9.51 97 0.17Lebanon 102 9.68 102 0.17Nepal 103 9.75 73 0.15Malaysia 104 9.79 87 0.16Bhutan 105 10.00 62 0.13Djibouti 105 10.00 62 0.13Tuvalu 105 10.00 70 0.14Suriname 105 10.00 57 0.12Paraguay 105 10.00 122 0.20Ecuador 110 10.08 120 0.19Sudan 111 10.09 106 0.17Brazil 112 10.17 103 0.17Uganda 113 10.20 112 0.18Mongolia 114 10.22 111 0.18Costa Rica 115 10.25 142 0.27Sierra Leone 116 10.38 93 0.16Australia 117 10.38 84 0.16Liberia 118 10.42 119 0.19Ghana 119 10.46 98 0.17Uruguay 120 10.47 96 0.16Indonesia 121 10.52 105 0.17Brunei Darussalam 122 10.74 113 0.18Japan 123 10.80 107 0.17Peru 124 10.93 133 0.23Cape Verde 125 11.00 140 0.27Trinidad and Tobago 125 11.00 110 0.18United Arab Emirates 127 11.10 128 0.21Dominican Republic 128 11.25 138 0.25Jamaica 129 11.32 132 0.23Cook Islands 130 11.33 101 0.17Rwanda 131 11.40 134 0.23Guatemala 132 11.43 135 0.24Panama 133 11.75 143 0.27Madagascar 134 11.80 139 0.25Hong Kong, China 135 11.98 109 0.18Saint Lucia 136 12.00 126 0.20Namibia 136 12.00 149 0.30Nicaragua 138 12.20 137 0.25Singapore 139 12.29 127 0.21Vanuatu 140 13.00 136 0.24Gambia 140 13.00 144 0.27Swaziland 143 14.00 129 0.22
Continued on next page . . .
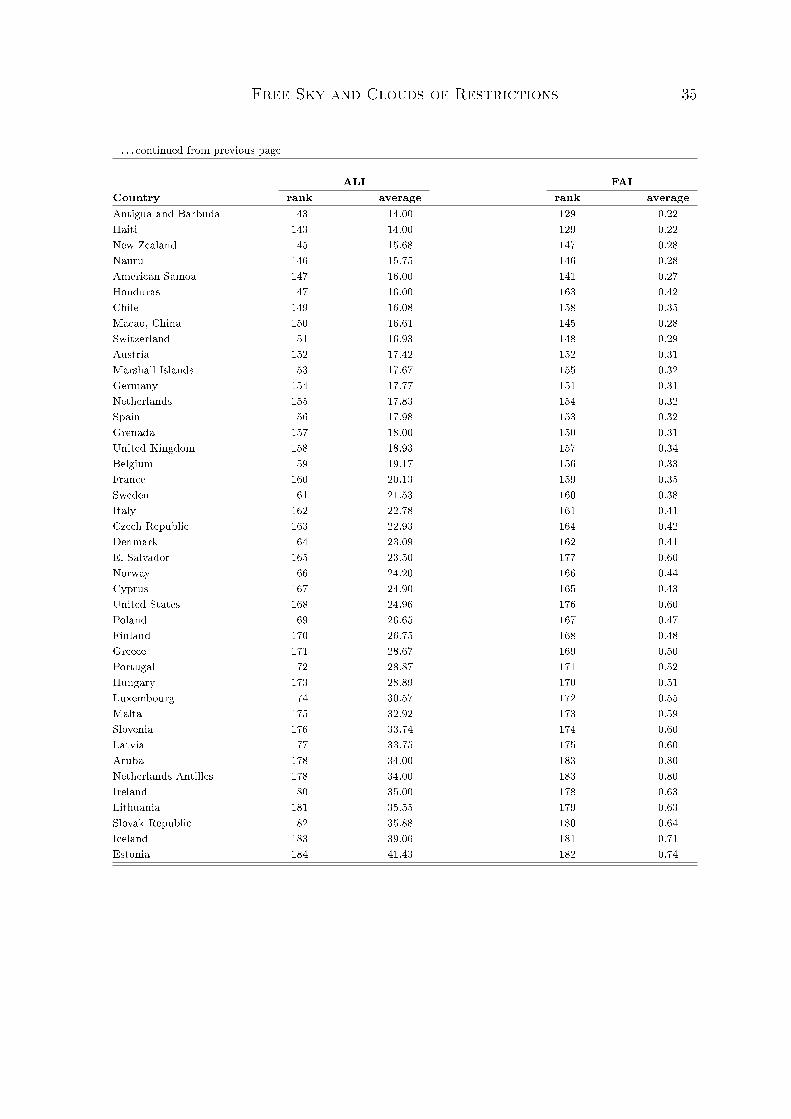
Free Sky and Clouds of Restrictions 35
. . . continued from previous page
ALI FAICountry rank average rank averageAntigua and Barbuda 143 14.00 129 0.22Haiti 143 14.00 129 0.22New Zealand 145 15.68 147 0.28Nauru 146 15.75 146 0.28American Samoa 147 16.00 141 0.27Honduras 147 16.00 163 0.42Chile 149 16.08 158 0.35Macao, China 150 16.61 145 0.28Switzerland 151 16.93 148 0.29Austria 152 17.42 152 0.31Marshall Islands 153 17.67 155 0.32Germany 154 17.77 151 0.31Netherlands 155 17.83 154 0.32Spain 156 17.98 153 0.32Grenada 157 18.00 150 0.31United Kingdom 158 18.93 157 0.34Belgium 159 19.17 156 0.33France 160 20.13 159 0.35Sweden 161 21.53 160 0.38Italy 162 22.78 161 0.41Czech Republic 163 22.93 164 0.42Denmark 164 23.09 162 0.41El Salvador 165 23.50 177 0.60Norway 166 24.20 166 0.44Cyprus 167 24.90 165 0.43United States 168 24.96 176 0.60Poland 169 26.65 167 0.47Finland 170 26.75 168 0.48Greece 171 28.67 169 0.50Portugal 172 28.87 171 0.52Hungary 173 28.89 170 0.51Luxembourg 174 30.57 172 0.55Malta 175 32.92 173 0.59Slovenia 176 33.74 174 0.60Latvia 177 33.75 175 0.60Aruba 178 34.00 183 0.80Netherlands Antilles 178 34.00 183 0.80Ireland 180 35.00 178 0.63Lithuania 181 35.55 179 0.63Slovak Republic 182 35.88 180 0.64Iceland 183 39.06 181 0.71Estonia 184 41.43 182 0.74
Free Sky and Clouds of Restrictions 36
1.A.3 Data Sources
Data on distance, common border, common colonial link and common language wereobtained from CEPII (2008). Data on GDP are based on the World DevelopmentIndicators (WDI) database (World Bank, 2008b) and trade data are extracted fromthe WITS - UN COMTRADE database (World Bank, 2008c). The denition of time-sensitive sectors is based on the US imports obtained from the Global Trade Atlas(Global Trade Information Services, 2009) (see Table 1.12 for the full listing of thetime-sensitive sectors). The grouping of countries by level of income is in line withthe World Bank denition (World Bank, 2008a). Data on passenger trac and theexistence of direct services between two countries are provided by the InternationalAviation Transport Association (IATA). Information on the agreements and the num-ber of years since they were rst signed come from the World's Air Services Agreements(WASA) database provided by the International Civil Aviation Organization (ICAO,2005). This database covers 2204 bilateral Air Services agreements, but only 1921 ofthese are used, since the rest are covered by plurilateral agreements. Information onplurilateral agreements was obtained from WTO (2007). In particular, we include theAir Transport Agreement between EU and Switzerland and the Agreement on the Eu-ropean Economic Area (EEA) involving the EU (25) countries, Norway, Iceland andLiechtenstein. We ignore other plurilateral agreements because their eective imple-mentation is improbable (see WTO, 2007, Chap. I for more details). The informedindex of air transport liberalization, the ALI, is from WTO (2006, 2007). All datacollected are for the year 2005.
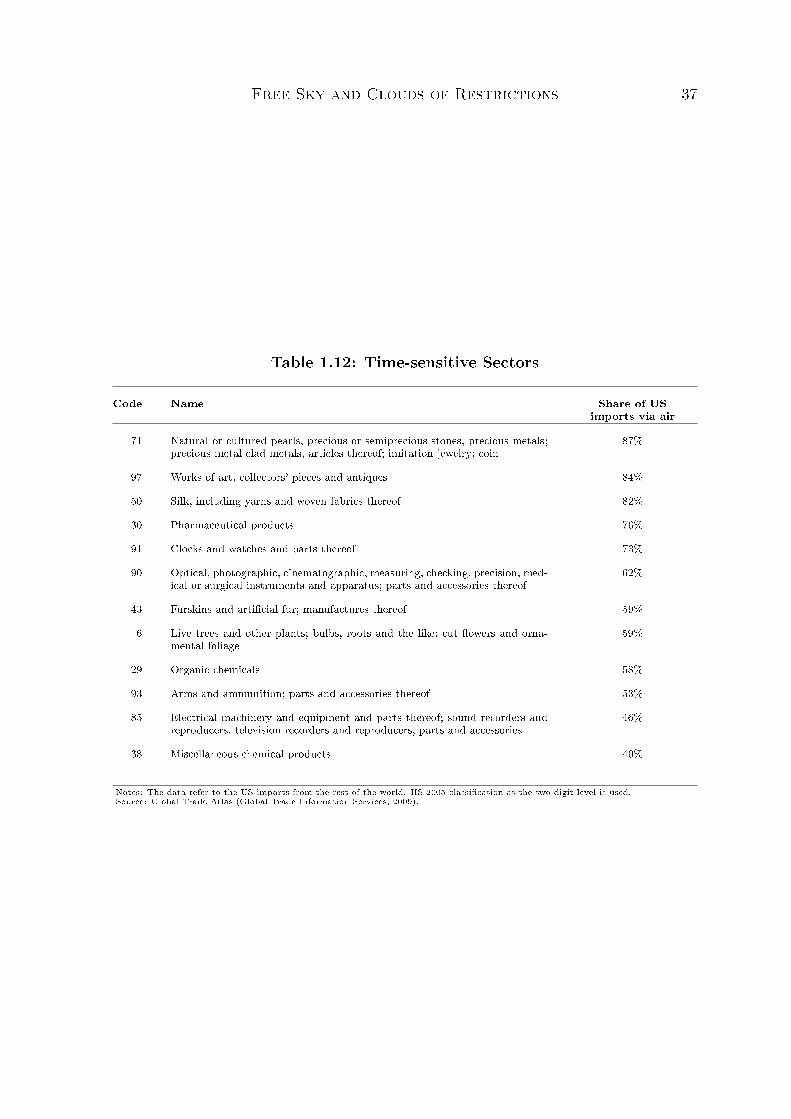
Free Sky and Clouds of Restrictions 37
Table 1.12: Time-sensitive Sectors
Code Name Share of USimports via air
71 Natural or cultured pearls, precious or semiprecious stones, precious metals;precious metal clad metals, articles thereof; imitation jewelry; coin
87%
97 Works of art, collectors' pieces and antiques 84%
50 Silk, including yarns and woven fabrics thereof 82%
30 Pharmaceutical products 76%
91 Clocks and watches and parts thereof 73%
90 Optical, photographic, cinematographic, measuring, checking, precision, med-ical or surgical instruments and apparatus; parts and accessories thereof
62%
43 Furskins and articial fur; manufactures thereof 59%
6 Live trees and other plants; bulbs, roots and the like; cut owers and orna-mental foliage
59%
29 Organic chemicals 58%
93 Arms and ammunition; parts and accessories thereof 53%
85 Electrical machinery and equipment and parts thereof; sound recorders andreproducers, television recorders and reproducers, parts and accessories
46%
38 Miscellaneous chemical products 40%
Notes: The data refer to the US imports from the rest of the world. HS 2005 classication at the two-digit level is used.Source: Global Trade Atlas (Global Trade Information Services, 2009).
References
Anderson, J. E., van Wincoop, E., 2003. Gravity with Gravitas: A Solution to theBorder Puzzle. American Economic Review 93 (1), 170192.
Bel, G., Fageda, X., 2008. Getting There Fast: Globalization, Intercontinental Flightsand Location of Headquarters. Economic Geography 8 (4), 471495.
Bowen, J., 2002. Network Change, Deregulation, and Access in the Global AirlineIndustry. Economic Geography 78 (4), 425439.
Cameron, A. C., Trivedi, P. K., 1998. Regression Analysis of Count Data. EconometricSociety Monographs No. 30, Cambridge University Press.
CEPII, 2008. Geodesic Distances. Available at http://www.cepii.fr/anglaisgraph/bdd/distances.htm.
Dihel, N., Shepherd, B., 2007. Modal Estimates of Services Barriers. OECD TradePolicy Working Paper 51, Organization for Economic Cooperation and Development,Trade Directorate, Paris.
Doove, S., Gabbitas, O., Nguyen-Hong, D., Owen, J., 2001. Price Eects of Regulation:Telecommunications, Air Passenger Transport and Electricity Supply. ProductivityCommission Sta Research Paper 0110004, AusInfo, Cranberra.
Geloso Grosso, M., 2008. Liberalizing Air Transport Services in APEC. GEM WorkingPaper November 2008, Group d'Économie Mondiale, Paris.
Global Trade Information Services, 2009. Global Trade Atlas. Available at http://www.gtis.com.
Gönenç, R., Nicoletti, G., 2000. Regulation, Market Structure and Performance inAir Passenger Transportation. OECD Economics Department Working Papers 254,Organization for Economic Cooperation and Development, Economics Department,Paris.
Free Sky and Clouds of Restrictions 39
Hanlon, P., 2006. Global Airlines: Competition in a Transnational Industry, 3rd Edi-tion. A Butterworth-Heinemann Title, Elsevier.
Herander, M. G., Saavedra, L. A., 2005. Exports and the Structure of Immigrant-Based Networks: The Role of Geographic Proximity. The Review of Economics andStatistics 87 (2), 323335.
Härdle, W., Simar, L., 2007. Applied Multivariate Statistical Analysis, 2nd Edition.Springer.
Hummels, D., 2007. Transportation Costs and International Trade in the Second Eraof Globalization. Journal of Economic Perspectives 21 (3), 131154.
ICAO, 2005. Database of the World's Air Services Agreements (WASA). 2005 edition,CD room, International Civil Aviation Organization, Montreal.
Micco, A., Serebrisky, T., 2006. Competition Regimes and Air Transport Costs: TheEects of Open Skies Agreements. Journal of International Economics 70 (1), 2551.
Nicoletti, G., Scarpetta, S., Boylaud, O., 2000. Summary Indicators of Product MarketRegulation with an Extension to Employment Protection Legislation. OECD Eco-nomics Department Working Papers 226, Organization for Economic Cooperationand Development, Economics Department, Paris.
Piermartini, R., Rousová, L., 2009. Air Services Liberalization, Passenger Fares andthe Patterns of Trade. Mimeo, University of Munich, Munich, and World TradeOrganization, Geneva.
Rauch, J. E., Trindade, V., 2002. Ethnic Chinese Networks in International Trade. TheReview of Economics and Statistics 84 (1), 116130.
Silva, J. M. C. S., Tenreyro, S., 2006. The Log of Gravity. The Review of Economicsand Statistics 88 (4), 641658.
Strauss-Kahn, V., Vives, X., 2009. Why and Where Do Headquarters Move? RegionalScience and Urban Economics 39 (2), 168186.
World Bank, 2008a. World Bank Income Classication. Available at http://siteresources.worldbank.org/DATASTATISTICS/Resources/OGHIST.xls.
World Bank, 2008b. World Development Indicators (WDI). Available at http://go.worldbank.org/U0FSM7AQ40.
Are the Central European Stock Markets Still Different? 40
World Bank, 2008c. World Integrated Trade Solution (WITS). Available at http://wits.worldbank.org.
WTO, 2006. Second Review of the Air Transport Annex, Developments in theAir Transport Sector (Part Two), Quantitative Air Services Agreements Review(QUASAR). Volumes I and II, Document S/C/W/270/Add.1, World Trade Organi-zation, Geneva.
WTO, 2007. Second Review of the Air Transport Annex, Developments in theAir Transport Sector (Part Three), Quantitative Air Services Agreements Review(QUASAR). Document S/C/W/270/Add.2, World Trade Organization, Geneva.
Chapter 2
Are the Central European StockMarkets Still Dierent?A Cointegration Analysis
2.1 Introduction
The recent nancial crises has rapidly developed and spread from the United States toother parts of the world. This points to the risks of the global nancial sector, whereshocks are easily transmitted from one country to another. Therefore, it is of particularinterest to understand the process of nancial integration, investigate its underlyinglinkages, and identify its drivers.
The transition economies in Central Europe1 oer a unique opportunity to studythe eects of institutional changes on nancial integration. First of all, many sub-stantial legal and institutional reforms have been occurring in the Central Euro-pean countries since the fall of communist regimes in 1989. The countries quicklyembarked on programs of liberalization and privatization and their economies haveundergone a relatively fast and successful transition process from centrally plannedeconomies towards free markets. Second, an important role in the transition pro-cess has been played by large capital inows to the region from developed coun-tries. The Central European countries have attracted particularly signicant amountsof foreign direct investment (FDI), originating mainly from Western Europe (see
1The term "Central Europe" refers to the Visegrád Group of countries, namely the Czech Republic,Hungary, Poland and Slovakia.

Are the Central European Stock Markets Still Different? 42
Mora, Garibaldi, Sahay, and Zettelmeyer, 2002).
Furthermore, the institutional arrangements as well as scal and monetary policieshave been strongly motivated by several criteria that set conditions for the EuropeanUnion (EU) accession and have directed the adjustment of the Central European coun-tries towards the EU standards since the mid 1990s.2 The EU accession per se onMay 1, 2004 was associated with the full removal of restrictions on movements of cap-ital. Nevertheless, the restructuring process continues as policy makers in the newmember countries attempt to join the Eurozone (McKinnon, 1999; Buiter and Grafe,2002; Buiter, 2004),3 and the institutional changes are accompanied by a convergencein macro-economic fundamentals of the recent EU members to the EU standards(Kocenda, Kutan, and Yigit, 2006).
The ongoing institutional integration of the Central European countries withthe global economy, the importance of foreign investment in these countries andtheir macro-economic developments suggest tightening of the stock market relations,as evidenced by extensive empirical literature on major developed stock markets(see Eun and Shim, 1989; Koch and Koch, 1991; Taylor and Tonks, 1989; Kasa, 1992;Masih and Masih, 1992; Longin and Solnik, 1995; Bessler and Yang, 2003). In partic-ular, nancial integration of the Central European markets with the "old" EU4 mar-kets can be expected due to the EU enlargement as well as signicant capital inowsto Central Europe from these countries. Surprisingly, the existing empirical litera-ture on the Central European stock markets has delivered no (Gilmore and McManus,2002, 2003) or only limited evidence (Egert and Kocenda, 2007; Syrioupoulus, 2006;Syllignakis and Kouretas, 2009) for such developments so far, when focusing on thelong-run stock market linkages. In fact, this literature does not typically investigatethe developments of the long-run relations; rather, it tends to t only one model forthe whole period of interest, tacitly assuming that the parameters of the model areconstant over the whole time span. One exception is Voronkova (2004), who controlsfor structural breaks in the relations and indeed nds stronger evidence of long-runlinks than reported in the previous literature.
My approach follows Voronkova's work by assuming a priori that the characteris-2Hungary and Poland applied for the EU membership in 1994, followed by Slovakia in 1995 and
the Czech Republic in 1996.3Slovakia already adopted the Euro on January 1, 2009.4The "old" EU refers to the EU-15 and comprises the following 15 countries: Austria, Belgium,
Denmark, Finland, France, Germany, Greece, Ireland, Italy, Luxembourg, Netherlands, Portugal,Spain, Sweden, United Kingdom.
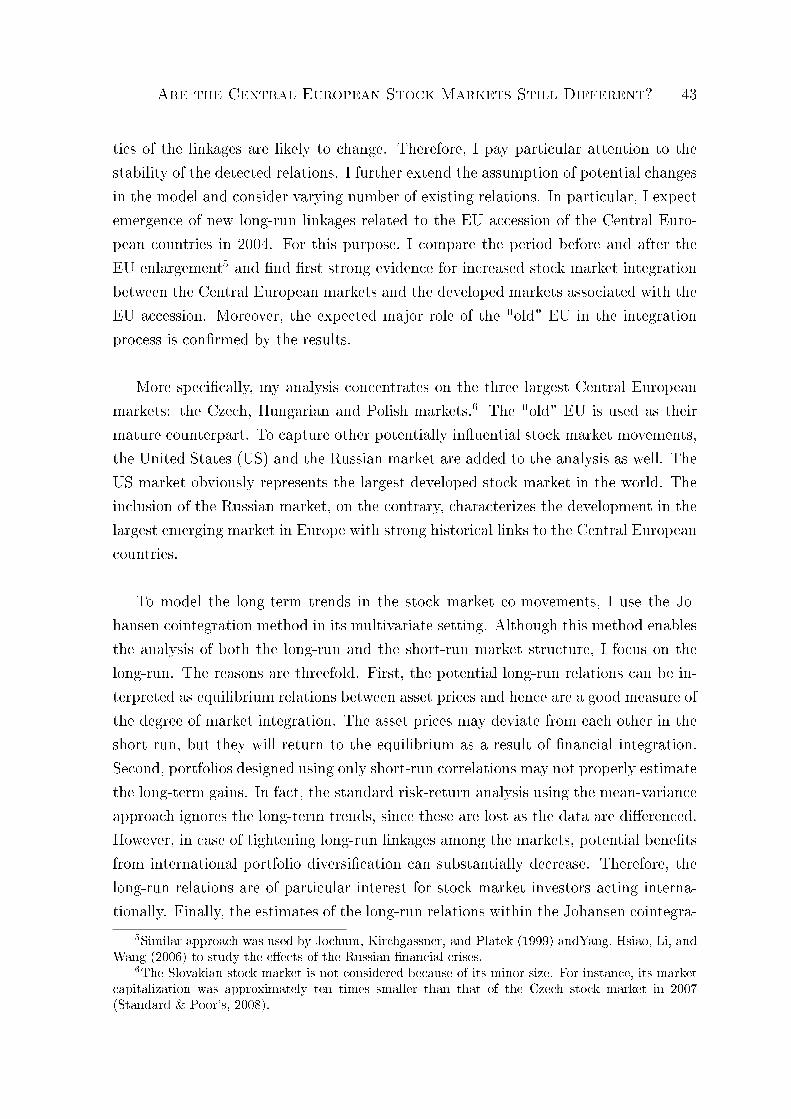
Are the Central European Stock Markets Still Different? 43
tics of the linkages are likely to change. Therefore, I pay particular attention to thestability of the detected relations. I further extend the assumption of potential changesin the model and consider varying number of existing relations. In particular, I expectemergence of new long-run linkages related to the EU accession of the Central Euro-pean countries in 2004. For this purpose, I compare the period before and after theEU enlargement5 and nd rst strong evidence for increased stock market integrationbetween the Central European markets and the developed markets associated with theEU accession. Moreover, the expected major role of the "old" EU in the integrationprocess is conrmed by the results.
More specically, my analysis concentrates on the three largest Central Europeanmarkets: the Czech, Hungarian and Polish markets.6 The "old" EU is used as theirmature counterpart. To capture other potentially inuential stock market movements,the United States (US) and the Russian market are added to the analysis as well. TheUS market obviously represents the largest developed stock market in the world. Theinclusion of the Russian market, on the contrary, characterizes the development in thelargest emerging market in Europe with strong historical links to the Central Europeancountries.
To model the long-term trends in the stock market co-movements, I use the Jo-hansen cointegration method in its multivariate setting. Although this method enablesthe analysis of both the long-run and the short-run market structure, I focus on thelong-run. The reasons are threefold. First, the potential long-run relations can be in-terpreted as equilibrium relations between asset prices and hence are a good measure ofthe degree of market integration. The asset prices may deviate from each other in theshort run, but they will return to the equilibrium as a result of nancial integration.Second, portfolios designed using only short-run correlations may not properly estimatethe long-term gains. In fact, the standard risk-return analysis using the mean-varianceapproach ignores the long-term trends, since these are lost as the data are dierenced.However, in case of tightening long-run linkages among the markets, potential benetsfrom international portfolio diversication can substantially decrease. Therefore, thelong-run relations are of particular interest for stock market investors acting interna-tionally. Finally, the estimates of the long-run relations within the Johansen cointegra-
5Similar approach was used by Jochum, Kirchgassner, and Platek (1999) andYang, Hsiao, Li, andWang (2006) to study the eects of the Russian nancial crises.
6The Slovakian stock market is not considered because of its minor size. For instance, its marketcapitalization was approximately ten times smaller than that of the Czech stock market in 2007(Standard & Poor's, 2008).
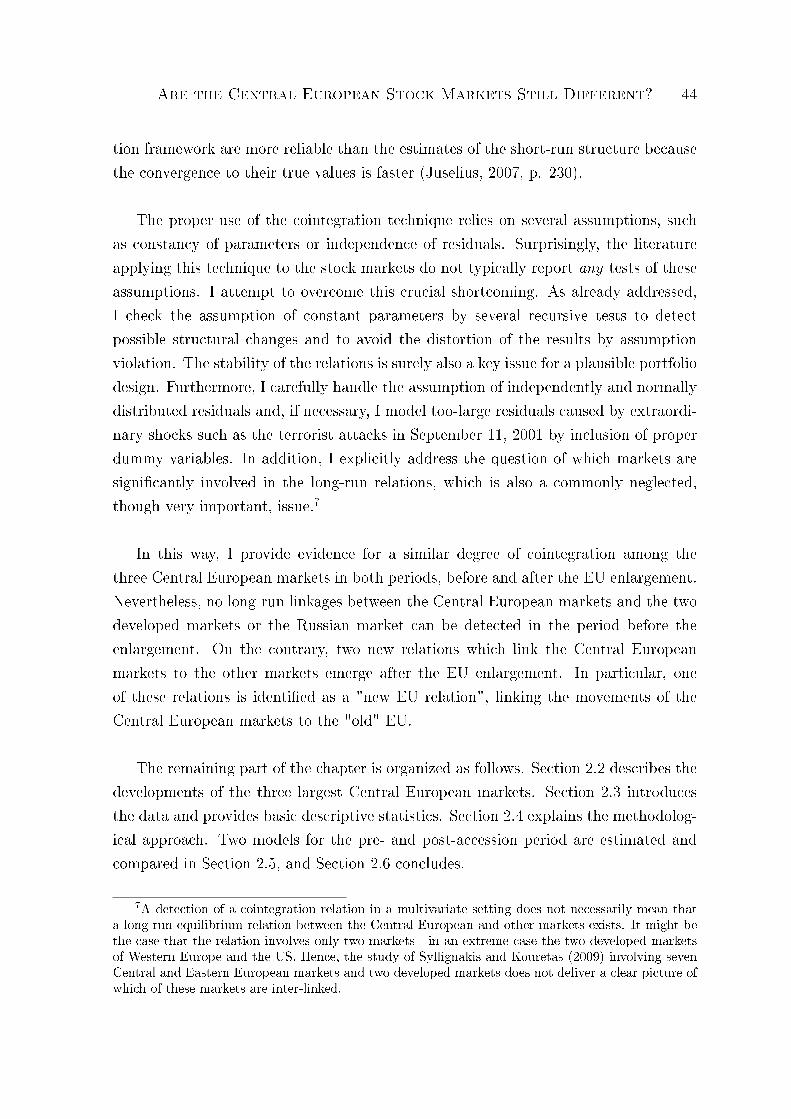
Are the Central European Stock Markets Still Different? 44
tion framework are more reliable than the estimates of the short-run structure becausethe convergence to their true values is faster (Juselius, 2007, p. 230).
The proper use of the cointegration technique relies on several assumptions, suchas constancy of parameters or independence of residuals. Surprisingly, the literatureapplying this technique to the stock markets do not typically report any tests of theseassumptions. I attempt to overcome this crucial shortcoming. As already addressed,I check the assumption of constant parameters by several recursive tests to detectpossible structural changes and to avoid the distortion of the results by assumptionviolation. The stability of the relations is surely also a key issue for a plausible portfoliodesign. Furthermore, I carefully handle the assumption of independently and normallydistributed residuals and, if necessary, I model too-large residuals caused by extraordi-nary shocks such as the terrorist attacks in September 11, 2001 by inclusion of properdummy variables. In addition, I explicitly address the question of which markets aresignicantly involved in the long-run relations, which is also a commonly neglected,though very important, issue.7
In this way, I provide evidence for a similar degree of cointegration among thethree Central European markets in both periods, before and after the EU enlargement.Nevertheless, no long-run linkages between the Central European markets and the twodeveloped markets or the Russian market can be detected in the period before theenlargement. On the contrary, two new relations which link the Central Europeanmarkets to the other markets emerge after the EU enlargement. In particular, oneof these relations is identied as a "new EU relation", linking the movements of theCentral European markets to the "old" EU.
The remaining part of the chapter is organized as follows. Section 2.2 describes thedevelopments of the three largest Central European markets. Section 2.3 introducesthe data and provides basic descriptive statistics. Section 2.4 explains the methodolog-ical approach. Two models for the pre- and post-accession period are estimated andcompared in Section 2.5, and Section 2.6 concludes.
7A detection of a cointegration relation in a multivariate setting does not necessarily mean thata long-run equilibrium relation between the Central European and other markets exists. It might bethe case that the relation involves only two markets - in an extreme case the two developed marketsof Western Europe and the US. Hence, the study of Syllignakis and Kouretas (2009) involving sevenCentral and Eastern European markets and two developed markets does not deliver a clear picture ofwhich of these markets are inter-linked.
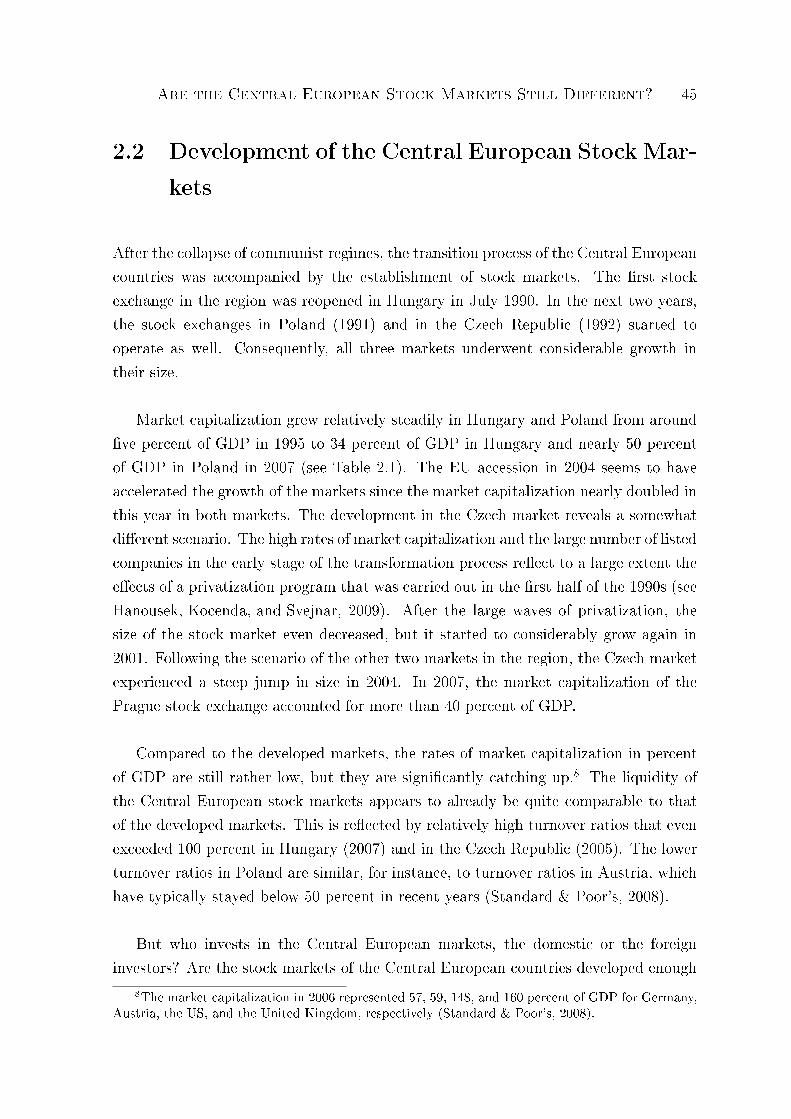
Are the Central European Stock Markets Still Different? 45
2.2 Development of the Central European Stock Mar-kets
After the collapse of communist regimes, the transition process of the Central Europeancountries was accompanied by the establishment of stock markets. The rst stockexchange in the region was reopened in Hungary in July 1990. In the next two years,the stock exchanges in Poland (1991) and in the Czech Republic (1992) started tooperate as well. Consequently, all three markets underwent considerable growth intheir size.
Market capitalization grew relatively steadily in Hungary and Poland from aroundve percent of GDP in 1995 to 34 percent of GDP in Hungary and nearly 50 percentof GDP in Poland in 2007 (see Table 2.1). The EU accession in 2004 seems to haveaccelerated the growth of the markets since the market capitalization nearly doubled inthis year in both markets. The development in the Czech market reveals a somewhatdierent scenario. The high rates of market capitalization and the large number of listedcompanies in the early stage of the transformation process reect to a large extent theeects of a privatization program that was carried out in the rst half of the 1990s (seeHanousek, Kocenda, and Svejnar, 2009). After the large waves of privatization, thesize of the stock market even decreased, but it started to considerably grow again in2001. Following the scenario of the other two markets in the region, the Czech marketexperienced a steep jump in size in 2004. In 2007, the market capitalization of thePrague stock exchange accounted for more than 40 percent of GDP.
Compared to the developed markets, the rates of market capitalization in percentof GDP are still rather low, but they are signicantly catching up.8 The liquidity ofthe Central European stock markets appears to already be quite comparable to thatof the developed markets. This is reected by relatively high turnover ratios that evenexceeded 100 percent in Hungary (2007) and in the Czech Republic (2005). The lowerturnover ratios in Poland are similar, for instance, to turnover ratios in Austria, whichhave typically stayed below 50 percent in recent years (Standard & Poor's, 2008).
But who invests in the Central European markets, the domestic or the foreigninvestors? Are the stock markets of the Central European countries developed enough
8The market capitalization in 2006 represented 57, 59, 148, and 160 percent of GDP for Germany,Austria, the US, and the United Kingdom, respectively (Standard & Poor's, 2008).
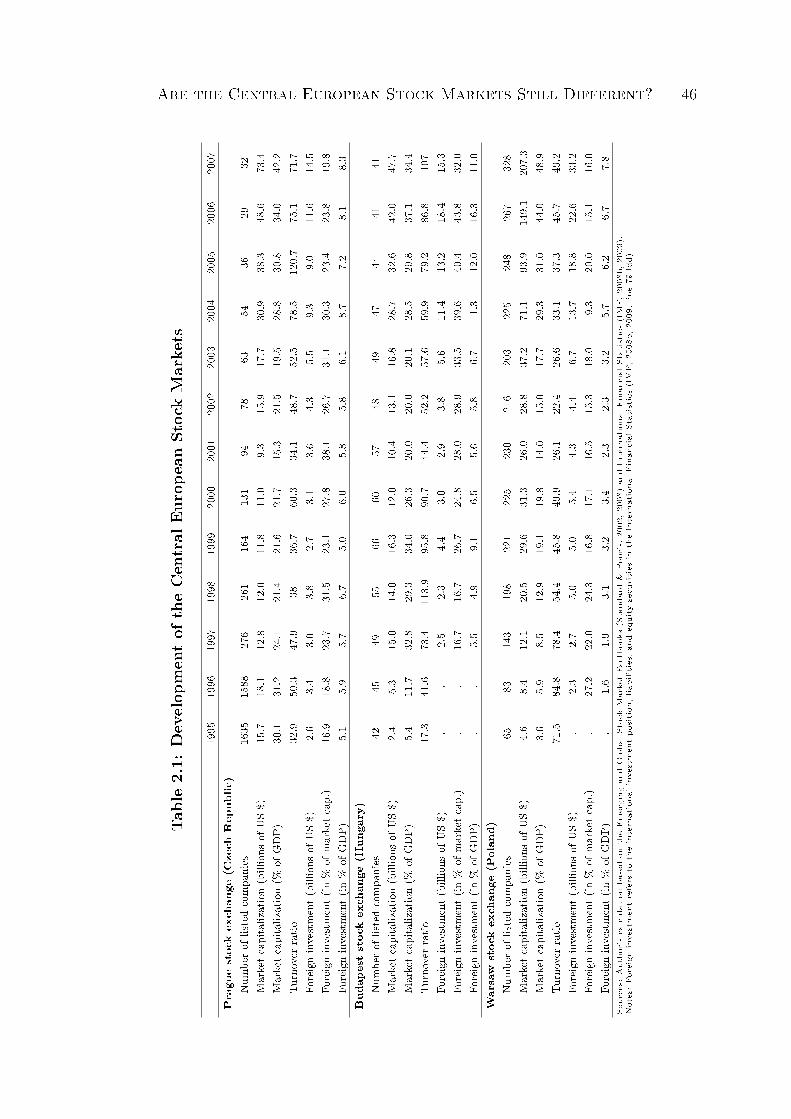
Are the Central European Stock Markets Still Different? 46
Table2.1:
Develop
mentof
theCentral
Europe
anStockMarkets
1995
1996
1997
1998
1999
2000
2001
2002
2003
2004
2005
2006
2007
Pragu
estockexchan
ge(C
zech
Rep
ublic)
Num
berof
listedcompa
nies
1635
1588
276
261
164
131
9478
6354
3629
32Marketcapitaliz
ation(billions
ofUS$)
15.7
18.1
12.8
12.0
11.8
11.0
9.3
15.9
17.7
30.9
38.3
48.6
73.4
Marketcapitaliz
ation(%
ofGDP)
30.1
31.2
24.1
21.4
21.6
21.7
15.3
21.5
19.5
28.8
30.8
34.0
42.2
Turnover
ratio
32.9
50.3
47.9
3836
.760
.334
.148
.752
.578
.512
0.7
75.1
71.7
Foreigninvestment(billions
ofUS$)
2.6
3.4
3.0
3.8
2.7
3.1
3.6
4.3
5.5
9.3
9.0
11.6
14.5
Foreigninvestment(in
%of
marketcap.)
16.9
18.8
23.7
31.5
23.1
27.8
38.1
26.7
31.1
30.3
23.4
23.8
19.8
Foreigninvestment(in
%of
GDP)
5.1
5.9
5.7
6.7
5.0
6.0
5.8
5.8
6.1
8.7
7.2
8.1
8.3
Bud
apeststockexchan
ge(H
ungary)
Num
berof
listedcompa
nies
4245
4955
6660
5748
4947
4441
41Marketcapitaliz
ation(billions
ofUS$)
2.4
5.3
15.0
14.0
16.3
12.0
10.4
13.1
16.8
28.7
32.6
42.0
47.7
Marketcapitaliz
ation(%
ofGDP)
5.4
11.7
32.8
29.3
34.0
26.3
20.0
20.0
20.1
28.5
29.8
37.1
34.4
Turnover
ratio
17.3
41.6
73.4
113.9
95.8
90.7
44.4
52.2
57.6
59.9
79.2
86.8
107
Foreigninvestment(billions
ofUS$)
..
2.5
2.3
4.4
3.0
2.9
3.8
5.6
11.4
13.2
18.4
15.3
Foreigninvestment(in
%of
marketcap.)
..
16.7
16.7
26.7
24.8
28.0
28.9
33.5
39.6
40.4
43.8
32.0
Foreigninvestment(in
%of
GDP)
..
5.5
4.9
9.1
6.5
5.6
5.8
6.7
11.3
12.0
16.3
11.0
Warsaw
stockexchan
ge(P
olan
d)Num
berof
listedcompa
nies
6583
143
198
221
225
230
216
203
225
248
267
328
Marketcapitaliz
ation(billions
ofUS$)
4.6
8.4
12.1
20.5
29.6
31.3
26.0
28.8
37.2
71.1
93.9
149.1
207.3
Marketcapitaliz
ation(%
ofGDP)
3.6
5.9
8.5
12.9
19.1
19.8
14.0
15.0
17.7
29.3
31.0
44.0
48.9
Turnover
ratio
71.5
84.8
78.4
54.4
45.8
49.9
26.1
22.4
26.6
33.1
37.3
45.7
49.2
Foreigninvestment(billions
ofUS$)
.2.3
2.7
5.0
5.0
5.4
4.3
4.4
6.7
13.7
18.8
22.6
33.2
Foreigninvestment(in
%of
marketcap.)
.27
.222
.024
.316
.817
.116
.515
.318
.019
.320
.015
.116
.0Fo
reigninvestment(in
%of
GDP)
.1.6
1.9
3.1
3.2
3.4
2.3
2.3
3.2
5.7
6.2
6.7
7.8
Sources:
Autho
r'scalculationba
sedon
theEmerging
andGloba
lStock
MarketFa
ctbo
oks(Stand
ard&
Poor's,2
002,
2008)an
dInternationa
lFinan
cial
Statistics
(IMF,
2008
b,20
09).
Notes:Fo
reigninvestmentrefers
totheinternationa
linv
estm
entpo
sition
,liabilities,
andequity
secu
rities
intheInternationa
lFinan
cial
Statistics
(IMF,
2008
b,20
09,line79
ldd).
Are the Central European Stock Markets Still Different? 47
to attract signicant foreign capital?
In general, the Central European countries have been receivers of large capitalinows from developed countries. The capital ows to these countries constitutedaround ve to six percent of their GDPs in the period between 19931999. The mainsource of foreign nancing was direct investment, followed by portfolio investment (seeMora, Garibaldi, Sahay, and Zettelmeyer, 2002; Koeke and Schroeder, 2003). In 1995,for instance, Hungary attracted the largest amount of FDI per capita of any countryoutside the developed market economies, and as a result, the share of FDI in its GDPexceeded ten percent (Lankes and Stern, 1999). Most of the capital ows to CentralEurope originated in Western European countries such as Germany or Austria (Marin,2004). Direct investment from Germany accounted for about one third of cumulativeFDI to the broader Eastern European region by 1996, and its majority indeed ew toCentral Europe.
Nevertheless, foreign investment gures in Table 2.1 indicate that foreigners indeedalso held signicant amounts of stock market assets (other than FDI-related holdings).9
In 2007, the value of foreign investment in stock market assets represented around eightpercent of GDP in the Czech Republic and Poland and even eleven percent of GDP inHungary. Especially in Hungary, foreign investment has constituted around 40 percentof market capitalization in recent years, which even exceeds foreign ownership holdingsin some of the developed markets.10
Foreign investment followed the scenario of market capitalization and experienceda sharp one-time increase in 2004. This is very likely a result of increased condenceand willingness of foreign investors to participate in the Central European marketsassociated with the accession of the countries to the EU in 2004. From a legal pointof view, the stock markets had already been open to foreign investors prior to the EUaccession. The restrictions on foreign investment were gradually lifted between 1994to 1999 (see Dvorak and Podpiera, 2006; Syllignakis and Kouretas, 2009). However,the increased interest of foreigners after the EU accession indicates that some foreigninvestors may have refrained from the markets before the EU enlargement in particularbecause of institutional or political risk.
9I follow the work of Koeke and Schroeder (2003) and use the international investment positionin equity securities from the International Financial Statistics (IMF, 2008b, 2009, line 79 ldd) formeasuring foreign investment in the stock markets. This approach might underestimate the trueholdings by foreigners, as some equity holdings are part of FDI.
10The corresponding gures for Austria, Germany, and the US in 2006 were 45, 37, and 14 percent,respectively.
Are the Central European Stock Markets Still Different? 48
The developments of the Central European markets appear to be signicantly in-uenced by their accession to the EU in May 2004. Around this date, a sharp increasein the size as well as in the attractiveness of the markets to foreign investors can beobserved. I turn to investigate in the following whether this date also meant strongerintegration of the markets into the global economy.
2.3 Data
For capturing the stock market movements, I collected data of weekly closing priceindices for the three Central European markets, the Western European market, andthe US and Russian markets. All the data have been obtained from the ThompsonFinancial Datastream database. To avoid the distorting eects of using dierent typesof local stock market indices for the emerging markets, the standardized IFC Investable(IFCI) indices are used for representing the Czech, Hungarian, Polish and Russianmarkets. Moreover, these indices are designed to feature the type of assets that arelegally and practically available to a foreign portfolio investor. Since stronger linkagesbetween the recent and the "old" EU members are expected, the Western Europeancountries are of particular interest for analysis. The limitations regarding a reasonablenumber of markets in the cointegrated VAR model suggest including only a singlerepresentative of the Western European market; thus, the DJ Stoxx 600 is used. TheS&P 500 is chosen to represent the US market.
Following Jochum, Kirchgassner, and Platek (1999) and Voronkova (2004), all in-dices are measured in local currency.11 The data are converted to the natural logarithmsand denoted by LCZ, LHN , LPO, LWE, LUS, and LRU for the Czech, Hungarian,Polish, Western European, US, and Russian markets, respectively.
The data were collected for the time period between October 30, 1998, and May 4,2007. The end of the period is limited by the data availability when starting the anal-ysis, but the sample period still covers three years after the EU enlargement on May 1,2004. The choice of the start of the period is motivated rst by the attempt to avoidthe distorting impacts of the emerging market crises in 1997/1998 and the Russiannancial crises in August/September 1998 and second by the intention to obtain a pe-riod of three years before the EU enlargement when the accession date was still unclear.
11In case of the DJ Stoxx 600, the currency used is Euro.
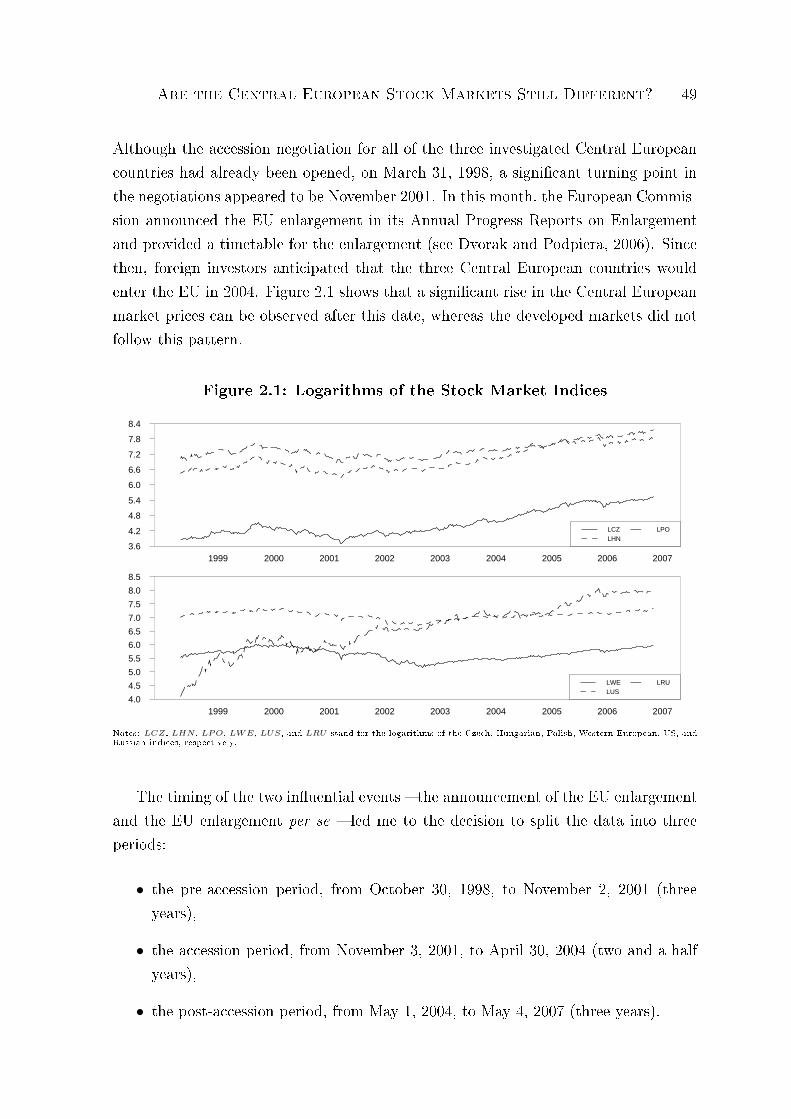
Are the Central European Stock Markets Still Different? 49
Although the accession negotiation for all of the three investigated Central Europeancountries had already been opened, on March 31, 1998, a signicant turning point inthe negotiations appeared to be November 2001. In this month, the European Commis-sion announced the EU enlargement in its Annual Progress Reports on Enlargementand provided a timetable for the enlargement (see Dvorak and Podpiera, 2006). Sincethen, foreign investors anticipated that the three Central European countries wouldenter the EU in 2004. Figure 2.1 shows that a signicant rise in the Central Europeanmarket prices can be observed after this date, whereas the developed markets did notfollow this pattern.
Figure 2.1: Logarithms of the Stock Market Indices
1999 2000 2001 2002 2003 2004 2005 2006 20073.6
4.2
4.8
5.4
6.0
6.6
7.2
7.8
8.4
LCZLHN
LPO
1999 2000 2001 2002 2003 2004 2005 2006 20074.0
4.5
5.0
5.5
6.0
6.5
7.0
7.5
8.0
8.5
LWELUS
LRU
Notes: LCZ, LHN , LPO, LWE, LUS, and LRU stand for the logarithms of the Czech, Hungarian, Polish, Western European, US, andRussian indices, respectively.
The timing of the two inuential events the announcement of the EU enlargementand the EU enlargement per se led me to the decision to split the data into threeperiods:
• the pre-accession period, from October 30, 1998, to November 2, 2001 (threeyears),
• the accession period, from November 3, 2001, to April 30, 2004 (two and a halfyears),
• the post-accession period, from May 1, 2004, to May 4, 2007 (three years).
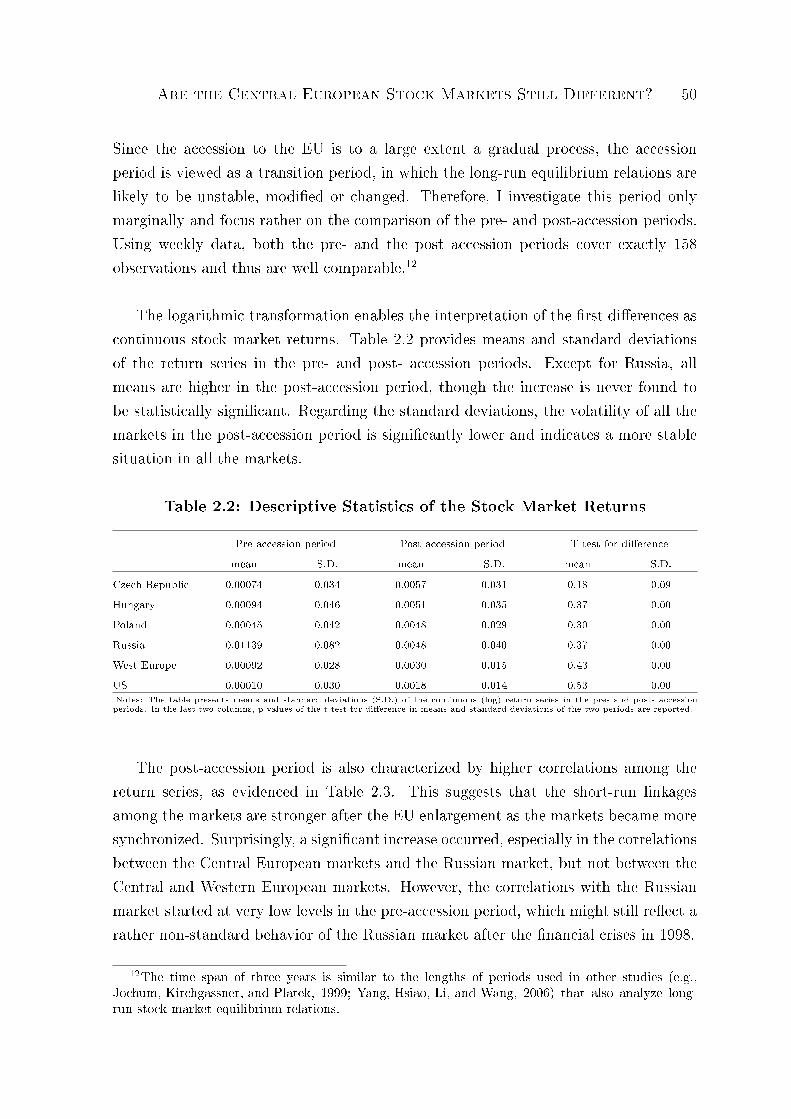
Are the Central European Stock Markets Still Different? 50
Since the accession to the EU is to a large extent a gradual process, the accessionperiod is viewed as a transition period, in which the long-run equilibrium relations arelikely to be unstable, modied or changed. Therefore, I investigate this period onlymarginally and focus rather on the comparison of the pre- and post-accession periods.Using weekly data, both the pre- and the post accession periods cover exactly 158observations and thus are well comparable.12
The logarithmic transformation enables the interpretation of the rst dierences ascontinuous stock market returns. Table 2.2 provides means and standard deviationsof the return series in the pre- and post- accession periods. Except for Russia, allmeans are higher in the post-accession period, though the increase is never found tobe statistically signicant. Regarding the standard deviations, the volatility of all themarkets in the post-accession period is signicantly lower and indicates a more stablesituation in all the markets.
Table 2.2: Descriptive Statistics of the Stock Market Returns
Pre-accession period Post-accession period T-test for dierencemean S.D. mean S.D. mean S.D.
Czech Republic 0.00074 0.034 0.0057 0.031 0.18 0.09Hungary 0.00094 0.046 0.0051 0.035 0.37 0.00Poland 0.00045 0.042 0.0048 0.029 0.30 0.00Russia 0.01139 0.082 0.0048 0.040 0.37 0.00West Europe 0.00092 0.028 0.0030 0.015 0.43 0.00US 0.00010 0.030 0.0018 0.014 0.53 0.00Notes: The table presents means and standard deviations (S.D.) of the continuous (log) return series in the pre- and post- accessionperiods. In the last two columns, p-values of the t-test for dierence in means and standard deviations of the two periods are reported.
The post-accession period is also characterized by higher correlations among thereturn series, as evidenced in Table 2.3. This suggests that the short-run linkagesamong the markets are stronger after the EU enlargement as the markets became moresynchronized. Surprisingly, a signicant increase occurred, especially in the correlationsbetween the Central European markets and the Russian market, but not between theCentral and Western European markets. However, the correlations with the Russianmarket started at very low levels in the pre-accession period, which might still reect arather non-standard behavior of the Russian market after the nancial crises in 1998.
12The time span of three years is similar to the lengths of periods used in other studies (e.g.,Jochum, Kirchgassner, and Platek, 1999; Yang, Hsiao, Li, and Wang, 2006) that also analyze long-run stock market equilibrium relations.
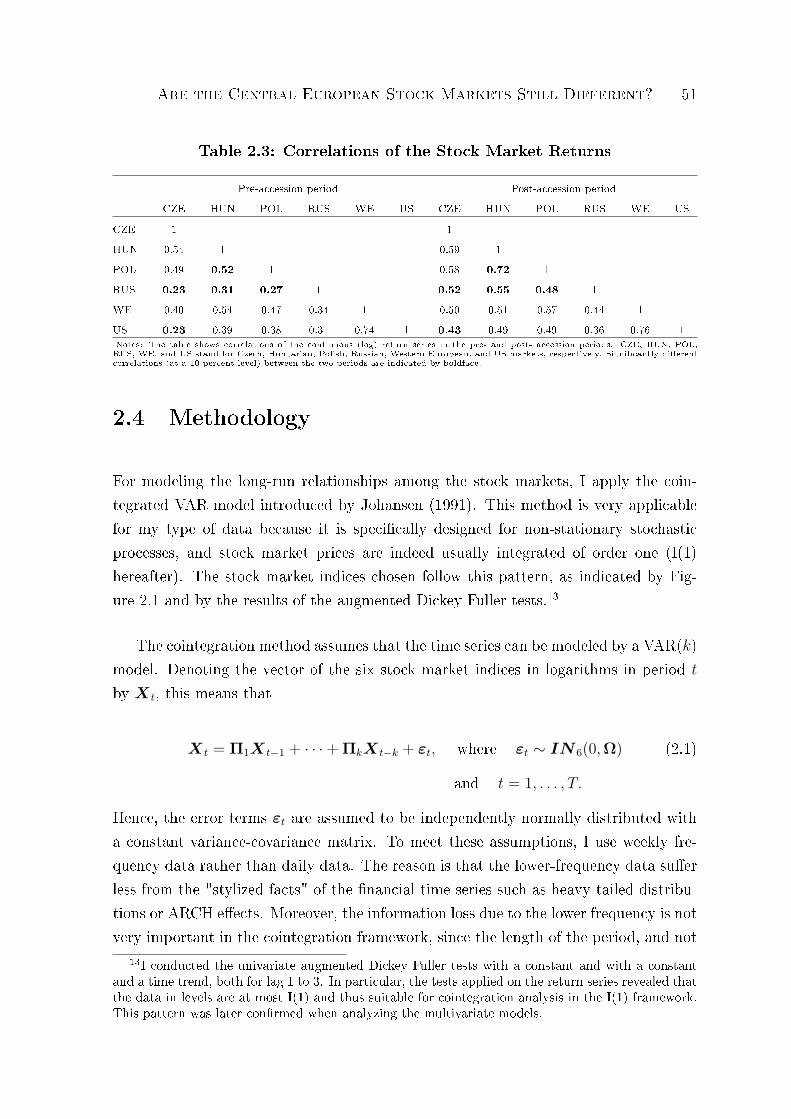
Are the Central European Stock Markets Still Different? 51
Table 2.3: Correlations of the Stock Market Returns
Pre-accession period Post-accession periodCZE HUN POL RUS WE US CZE HUN POL RUS WE US
CZE 1 1HUN 0.54 1 0.59 1POL 0.49 0.52 1 0.58 0.72 1RUS 0.23 0.31 0.27 1 0.52 0.55 0.48 1WE 0.40 0.54 0.47 0.34 1 0.50 0.51 0.57 0.44 1US 0.23 0.39 0.38 0.31 0.74 1 0.43 0.49 0.49 0.36 0.76 1Notes: The table shows correlations of the continuous (log) return series in the pre- and post- accession periods. CZE, HUN, POL,RUS, WE, and US stand for Czech, Hungarian, Polish, Russian, Western European, and US markets, respectively. Signicantly dierentcorrelations (at a 10 percent level) between the two periods are indicated by boldface.
2.4 Methodology
For modeling the long-run relationships among the stock markets, I apply the coin-tegrated VAR model introduced by Johansen (1991). This method is very applicablefor my type of data because it is specically designed for non-stationary stochasticprocesses, and stock market prices are indeed usually integrated of order one (I(1)hereafter). The stock market indices chosen follow this pattern, as indicated by Fig-ure 2.1 and by the results of the augmented Dickey Fuller tests.13
The cointegration method assumes that the time series can be modeled by a VAR(k)model. Denoting the vector of the six stock market indices in logarithms in period t
by X t, this means that
X t = Π1X t−1 + · · ·+ ΠkX t−k + εt, where εt ∼ IN 6(0,Ω) (2.1)
and t = 1, . . . , T.
Hence, the error terms εt are assumed to be independently normally distributed witha constant variance-covariance matrix. To meet these assumptions, I use weekly fre-quency data rather than daily data. The reason is that the lower-frequency data suerless from the "stylized facts" of the nancial time series such as heavy-tailed distribu-tions or ARCH eects. Moreover, the information loss due to the lower frequency is notvery important in the cointegration framework, since the length of the period, and not
13I conducted the univariate augmented Dickey Fuller tests with a constant and with a constantand a time trend, both for lag 1 to 3. In particular, the tests applied on the return series revealed thatthe data in levels are at most I(1) and thus suitable for cointegration analysis in the I(1) framework.This pattern was later conrmed when analyzing the multivariate models.

Are the Central European Stock Markets Still Different? 52
the frequency, is important for the detection of the long-run relations. Furthermore,the disturbing eects of dierent market closing times (European vs. Russian vs. USmarket) are eliminated.
A more convenient way of working with the VAR(k) model in the cointegrationframework is to rewrite the model in the vector equilibrium correction model (VECM)form:
∆X t = ΠX t−1 + Γ1∆X t−1 + · · ·+ Γk−1∆X t−k+1 + εt, (2.2)
where ∆X t = X t −X t−1, Π = −(I −k∑
j=1
Πj), Γi = −k∑
j=i+1
Πj,
and I denotes the identity matrix. This representation allows one to directly dealwith the non-stationary pattern in the data that is now concentrated exclusively inΠX t−1, as it is the only term in levels in Equation (2.2). So the Π matrix captures allinformation about the long-run eects, and its rank r cannot be full. Supposing thatthe rank were full, a stationary process ∆X t would be equal to a non-stationary termΠX t−1 (plus several stationary terms), which leads to a contradiction. Hence, Π canbe partitioned as
Π = αβ′,
where α and β are 6 × r matrices and r < 6. The rank r (or the cointegrationrank) can be determined using the trace test, also called the Johansen test. Thisprocedure discriminates between (r) signicant and (6 − r) insignicant eigenvaluesλi, i = 1, . . . , 6, on which the maximum likelihood estimation of the model is based(see Johansen, 1996, Chapter 6). Consequently, each signicant eigenvalue is relatedto one stationary cointegration relation, which can be viewed as a long-run equilibriumrelation among the markets. The r stationary relations are represented by β′X t−1. Thecoecients of α capture the adjustment of markets to the cointegration relations andare called loadings. The Γi matrices contain information about the short-run linkages.
The model can be extended by the inclusion of deterministic components (a con-stant, a deterministic trend or dierent dummy variables) that are partitioned intothose restricted to enter only the cointegration relations and the unrestricted ones (seeJuselius, 2007, Chapter 6). My modeling strategy is to allow for a relatively rich struc-ture at the beginning of the analysis. Hence, I include an unrestricted constant and,eventually, unrestricted dummy variables. The time trend is restricted to enter only
Are the Central European Stock Markets Still Different? 53
the cointegration relations to avoid a quadratic trend in the level data.14 Later on, I tryto reduce the rich model into a more parsimonious one by examining the signicanceof the corresponding coecients.
In general, the stability of the model can be investigated by several recursive tests.The idea is to choose a baseline period (e.g., the rst year), on which the rst model isestimated, and then recursively test whether additional observations follow the samemodel. In this way, I study the constancy of β and signicant λi estimates as well asthe stability of the full model using the log-likelihood function. In addition, I checkthe validity of imposed restrictions throughout the dierent time periods.
A useful tool for the recursive tests of constancy is to distinguish between two typesof α and β estimates, the rst based on the VECM ("X-form") and the others basedon the concentrated model ("R-form"). The latter model is motivated by the ideaof the Frisch-Waugh Theorem (Frisch and Waugh, 1933) and enables the obtaining of"cleaner" estimates of the long-run structure after the short-run dynamics and thedeterministic components have been concentrated out (see Juselius, 2007, Chapter 7).In particular, if the constancy of the "X-form" coecients is rejected as opposed to the"R-form" coecients, the non-stability is likely to come from the short-run structure.
2.5 Results
2.5.1 Pre-accession Period
I start with the estimation of the VAR(k) model using data for the pre-accessionperiod. The basic model includes an unrestricted constant, a restricted trend, butno dummy variable. As a starting point, I use a lag length of 3. The theoreticalspecication in Equation (2.1) requests two residual assumptions, namely normalityand independence. The results of misspecication tests indicate that both assumptionsare clearly violated for this basic model. To improve the model specication, I includeseveral dummy variables, which turned out to be economically relevant as well asstatistically signicant.
14Although a quadratic trend could improve the t within the sample, it would lead to the implau-sible economic result that the stock markets follow quadratic trends.
Are the Central European Stock Markets Still Different? 54
• An unrestricted transitory shock dummy for the rst two weeks in January 1999(January 8 and 15)15 is related to a stock market over-reaction after the introduc-tion of the Economic and Monetary Union (EMU) on January 1, 1999 in most ofthe "old" EU countries. It corrects particularly for the volatile behavior of theWestern European markets in the rst two weeks in January.
• An unrestricted blip (impulse) dummy on April 14, 200016 captures a temporaldrop of the US market following the burst of the dot-com bubble. Therefore,the corresponding coecient is highly negatively signicant especially for the USmarket.
• Three unrestricted blip dummy variables for three weeks after the September 11terrorist attacks (September 14, 21, and 28, 2001) account for the substantialmarket instability, mainly in the US market, followed by the Western Europeanmarkets.
Furthermore, I exclude insignicant short-run coecients and thus adjust the lag lengthof the model. The resulting model meets the required assumptions and is used in thefollowing (see Appendix 2.A.1 for a more detailed discussion on the specication of themodel).
As an indicator for the number of cointegration relations, I use the trace test (Ta-ble 2.4). Since the model contains a trend in the cointegration relation and severaldummy variables, I do not report the results of the standard test; instead, I simulatean asymptotic trace test distribution by the program developed in Nielsen (2004). Theresults suggest rank 1, because H0 : r = 0 is rejected, but H0 : r = 1 cannot be rejected.In addition, the graphical analysis of the rst cointegration relation in Figure 2.3 inAppendix 2.A.2 proposes stationarity. Hence, the evidence suggests the existence ofone long-run equilibrium relation among the indices in the pre-accession period.
After the rank determination, I examine the stability of the model. All tests ofconstancy in Figures 2.5, 2.6, and 2.7 shown in Appendix 2.A.3 suggest a good stabilityof the model. In particular, Figure 2.7 conrms constancy of the long-run equilibriumrelation. Due to the satisfactory results of these tests, further adjustment of the modelsuch as inclusion of structural breaks does not seem to be necessary.
15A transitory dummy is modeled by the inclusion of dtr = (. . . , 0, 1,−1, 0, . . .) to the explanatoryvariables in the VECM form. 1 and -1 correspond to January 8 and 15, respectively. For more detailson the dummy variables, see Juselius (2007, Chapter 6).
16An impulse dummy is modeled by the inclusion of dp = (. . . , 0, 1, 0, . . .), where 1 corresponds toApril 14.
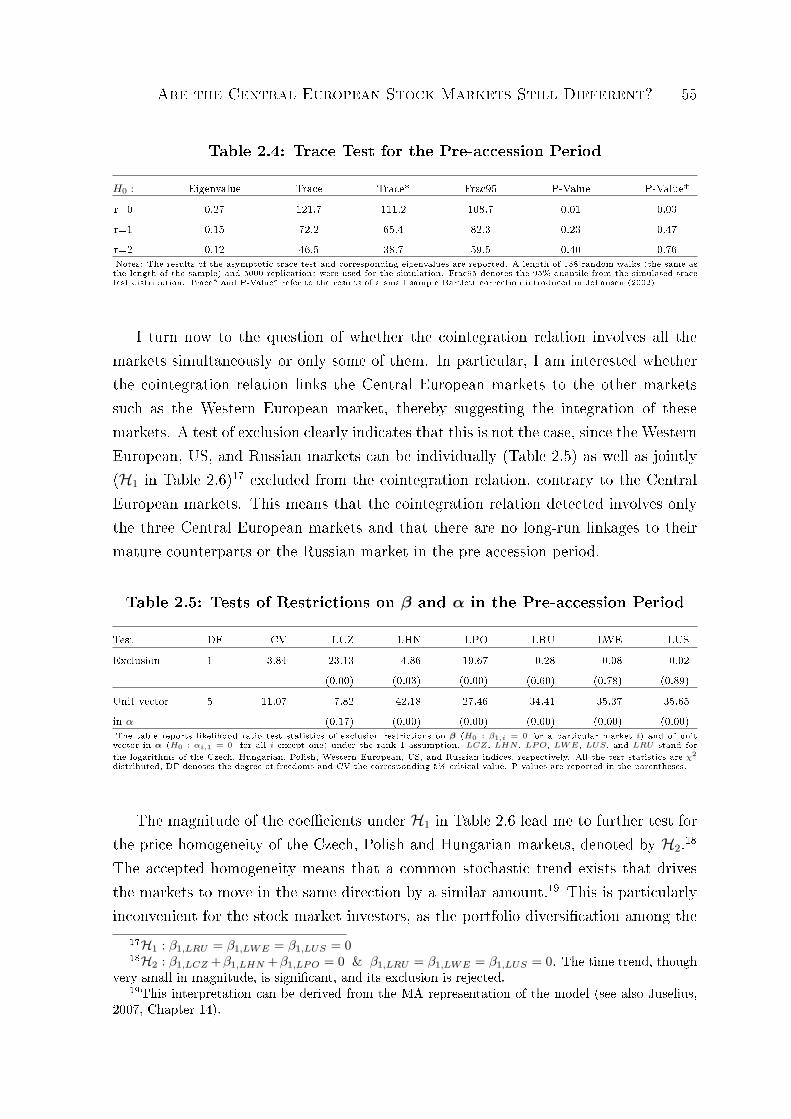
Are the Central European Stock Markets Still Different? 55
Table 2.4: Trace Test for the Pre-accession Period
H0 : Eigenvalue Trace Trace* Frac95 P-Value P-Value*
r=0 0.27 121.7 111.2 108.7 0.01 0.03r=1 0.15 72.2 65.4 82.3 0.23 0.47r=2 0.12 46.5 38.7 59.5 0.40 0.76Notes: The results of the asymptotic trace test and corresponding eigenvalues are reported. A length of 158 random walks (the same asthe length of the sample) and 5000 replications were used for the simulation. Frac95 denotes the 95% quantile from the simulated tracetest distribution. Trace* and P-Value* refer to the results of a small sample Bartlett correction introduced in Johansen (2002).
I turn now to the question of whether the cointegration relation involves all themarkets simultaneously or only some of them. In particular, I am interested whetherthe cointegration relation links the Central European markets to the other marketssuch as the Western European market, thereby suggesting the integration of thesemarkets. A test of exclusion clearly indicates that this is not the case, since the WesternEuropean, US, and Russian markets can be individually (Table 2.5) as well as jointly(H1 in Table 2.6)17 excluded from the cointegration relation, contrary to the CentralEuropean markets. This means that the cointegration relation detected involves onlythe three Central European markets and that there are no long-run linkages to theirmature counterparts or the Russian market in the pre-accession period.
Table 2.5: Tests of Restrictions on β and α in the Pre-accession Period
Test DF CV LCZ LHN LPO LRU LWE LUS
Exclusion 1 3.84 23.13 4.86 19.67 0.28 0.08 0.02(0.00) (0.03) (0.00) (0.60) (0.78) (0.89)
Unit vector 5 11.07 7.82 42.18 27.46 34.41 35.37 35.65in α (0.17) (0.00) (0.00) (0.00) (0.00) (0.00)The table reports likelihood ratio test statistics of exclusion restrictions on β (H0 : β1,i = 0 for a particular market i) and of unitvector in α (H0 : αi,1 = 0 for all i except one) under the rank 1 assumption. LCZ, LHN , LPO, LWE, LUS, and LRU stand forthe logarithms of the Czech, Hungarian, Polish, Western European, US, and Russian indices, respectively. All the test statistics are χ2
distributed, DF denotes the degree of freedoms and CV the corresponding 5% critical value. P-values are reported in the parentheses.
The magnitude of the coecients under H1 in Table 2.6 lead me to further test forthe price homogeneity of the Czech, Polish and Hungarian markets, denoted by H2.18
The accepted homogeneity means that a common stochastic trend exists that drivesthe markets to move in the same direction by a similar amount.19 This is particularlyinconvenient for the stock market investors, as the portfolio diversication among the
17H1 : β1,LRU = β1,LWE = β1,LUS = 018H2 : β1,LCZ +β1,LHN +β1,LPO = 0 & β1,LRU = β1,LWE = β1,LUS = 0. The time trend, though
very small in magnitude, is signicant, and its exclusion is rejected.19This interpretation can be derived from the MA representation of the model (see also Juselius,
2007, Chapter 14).
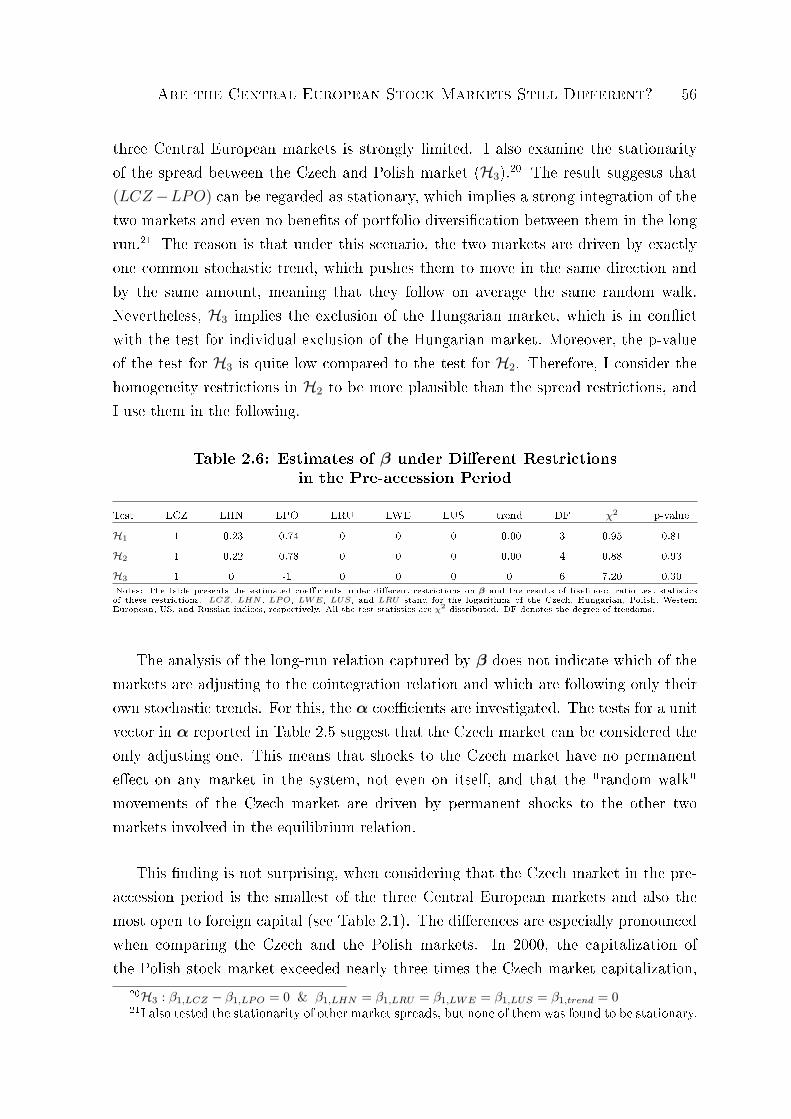
Are the Central European Stock Markets Still Different? 56
three Central European markets is strongly limited. I also examine the stationarityof the spread between the Czech and Polish market (H3).20 The result suggests that(LCZ−LPO) can be regarded as stationary, which implies a strong integration of thetwo markets and even no benets of portfolio diversication between them in the longrun.21 The reason is that under this scenario, the two markets are driven by exactlyone common stochastic trend, which pushes them to move in the same direction andby the same amount, meaning that they follow on average the same random walk.Nevertheless, H3 implies the exclusion of the Hungarian market, which is in conictwith the test for individual exclusion of the Hungarian market. Moreover, the p-valueof the test for H3 is quite low compared to the test for H2. Therefore, I consider thehomogeneity restrictions in H2 to be more plausible than the spread restrictions, andI use them in the following.
Table 2.6: Estimates of β under Dierent Restrictionsin the Pre-accession Period
Test LCZ LHN LPO LRU LWE LUS trend DF χ2 p-value
H1 1 -0.23 -0.74 0 0 0 -0.00 3 0.95 0.81H2 1 -0.22 -0.78 0 0 0 -0.00 4 0.88 0.93H3 1 0 -1 0 0 0 0 6 7.20 0.30Notes: The table presents the estimated coecients under dierent restrictions on β and the results of likelihood ratio test statisticsof these restrictions. LCZ, LHN, LPO, LWE, LUS, and LRU stand for the logarithms of the Czech, Hungarian, Polish, WesternEuropean, US, and Russian indices, respectively. All the test statistics are χ2 distributed. DF denotes the degree of freedoms.
The analysis of the long-run relation captured by β does not indicate which of themarkets are adjusting to the cointegration relation and which are following only theirown stochastic trends. For this, the α coecients are investigated. The tests for a unitvector in α reported in Table 2.5 suggest that the Czech market can be considered theonly adjusting one. This means that shocks to the Czech market have no permanenteect on any market in the system, not even on itself, and that the "random walk"movements of the Czech market are driven by permanent shocks to the other twomarkets involved in the equilibrium relation.
This nding is not surprising, when considering that the Czech market in the pre-accession period is the smallest of the three Central European markets and also themost open to foreign capital (see Table 2.1). The dierences are especially pronouncedwhen comparing the Czech and the Polish markets. In 2000, the capitalization ofthe Polish stock market exceeded nearly three times the Czech market capitalization,
20H3 : β1,LCZ − β1,LPO = 0 & β1,LHN = β1,LRU = β1,LWE = β1,LUS = β1,trend = 021I also tested the stationarity of other market spreads, but none of them was found to be stationary.
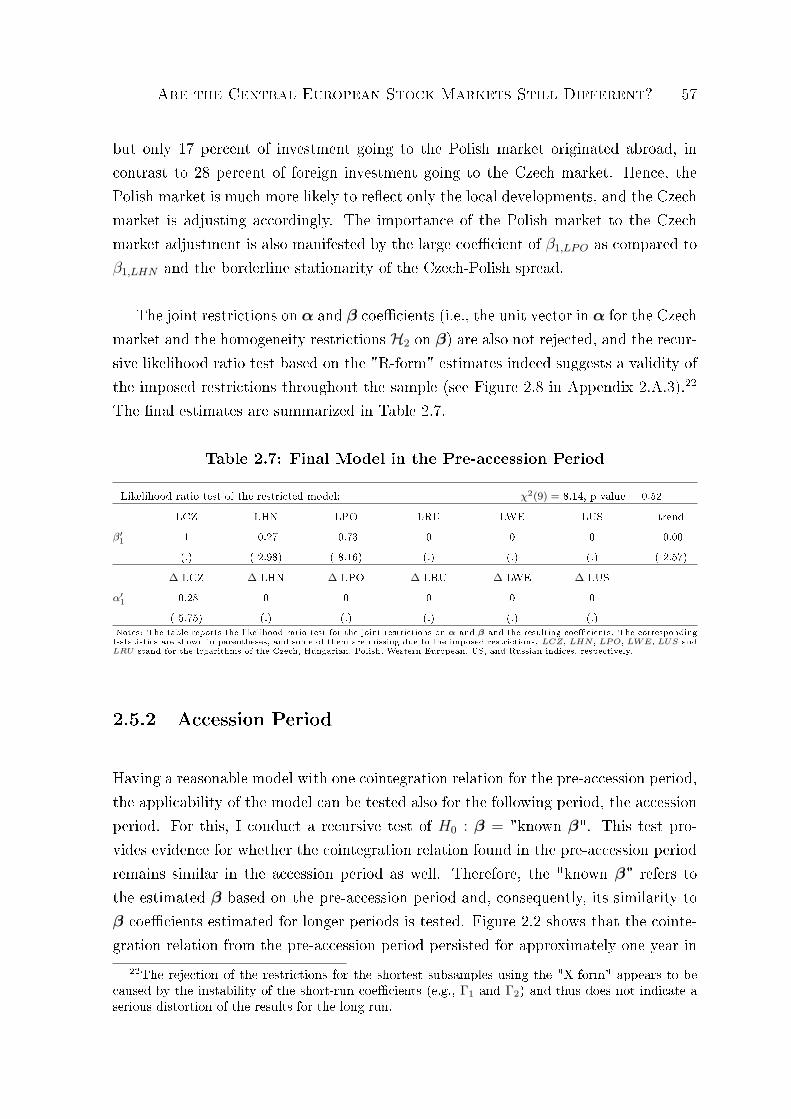
Are the Central European Stock Markets Still Different? 57
but only 17 percent of investment going to the Polish market originated abroad, incontrast to 28 percent of foreign investment going to the Czech market. Hence, thePolish market is much more likely to reect only the local developments, and the Czechmarket is adjusting accordingly. The importance of the Polish market to the Czechmarket adjustment is also manifested by the large coecient of β1,LPO as compared toβ1,LHN and the borderline stationarity of the Czech-Polish spread.
The joint restrictions on α and β coecients (i.e., the unit vector in α for the Czechmarket and the homogeneity restrictions H2 on β) are also not rejected, and the recur-sive likelihood ratio test based on the "R-form" estimates indeed suggests a validity ofthe imposed restrictions throughout the sample (see Figure 2.8 in Appendix 2.A.3).22
The nal estimates are summarized in Table 2.7.
Table 2.7: Final Model in the Pre-accession Period
Likelihood ratio test of the restricted model: χ2(9) = 8.14, p-value = 0.52
LCZ LHN LPO LRU LWE LUS trendβ′1 1 -0.27 -0.73 0 0 0 -0.00
(.) (-2.98) (-8.16) (.) (.) (.) (-2.57)
∆ LCZ ∆ LHN ∆ LPO ∆ LRU ∆ LWE ∆ LUSα′1 -0.28 0 0 0 0 0
(-5.75) (.) (.) (.) (.) (.)Notes: The table reports the likelihood ratio test for the joint restrictions on α and β and the resulting coecients. The correspondingt-statistics are shown in parentheses, and some of them are missing due to the imposed restrictions. LCZ, LHN, LPO, LWE, LUS andLRU stand for the logarithms of the Czech, Hungarian, Polish, Western European, US, and Russian indices, respectively.
2.5.2 Accession Period
Having a reasonable model with one cointegration relation for the pre-accession period,the applicability of the model can be tested also for the following period, the accessionperiod. For this, I conduct a recursive test of H0 : β = "known β". This test pro-vides evidence for whether the cointegration relation found in the pre-accession periodremains similar in the accession period as well. Therefore, the "known β" refers tothe estimated β based on the pre-accession period and, consequently, its similarity toβ coecients estimated for longer periods is tested. Figure 2.2 shows that the cointe-gration relation from the pre-accession period persisted for approximately one year in
22The rejection of the restrictions for the shortest subsamples using the "X-form" appears to becaused by the instability of the short-run coecients (e.g., Γ1 and Γ2) and thus does not indicate aserious distortion of the results for the long run.
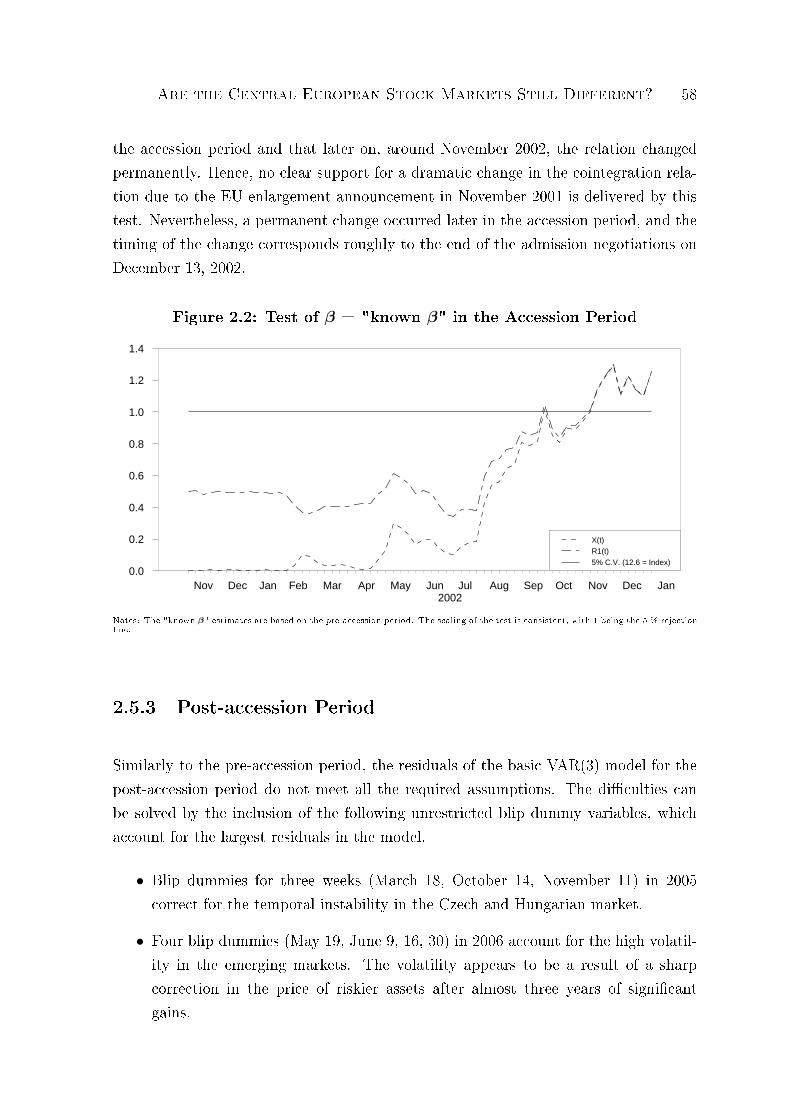
Are the Central European Stock Markets Still Different? 58
the accession period and that later on, around November 2002, the relation changedpermanently. Hence, no clear support for a dramatic change in the cointegration rela-tion due to the EU enlargement announcement in November 2001 is delivered by thistest. Nevertheless, a permanent change occurred later in the accession period, and thetiming of the change corresponds roughly to the end of the admission negotiations onDecember 13, 2002.
Figure 2.2: Test of β = "known β" in the Accession Period
Nov Dec Jan Feb Mar Apr May Jun Jul Aug Sep Oct Nov Dec Jan2002
0.0
0.2
0.4
0.6
0.8
1.0
1.2
1.4
X(t)R1(t)
5% C.V. (12.6 = Index)
Notes: The "known β" estimates are based on the pre-accession period. The scaling of the test is consistent, with 1 being the 5 % rejectionline.
2.5.3 Post-accession Period
Similarly to the pre-accession period, the residuals of the basic VAR(3) model for thepost-accession period do not meet all the required assumptions. The diculties canbe solved by the inclusion of the following unrestricted blip dummy variables, whichaccount for the largest residuals in the model.
• Blip dummies for three weeks (March 18, October 14, November 11) in 2005correct for the temporal instability in the Czech and Hungarian market.
• Four blip dummies (May 19, June 9, 16, 30) in 2006 account for the high volatil-ity in the emerging markets. The volatility appears to be a result of a sharpcorrection in the price of riskier assets after almost three years of signicantgains.
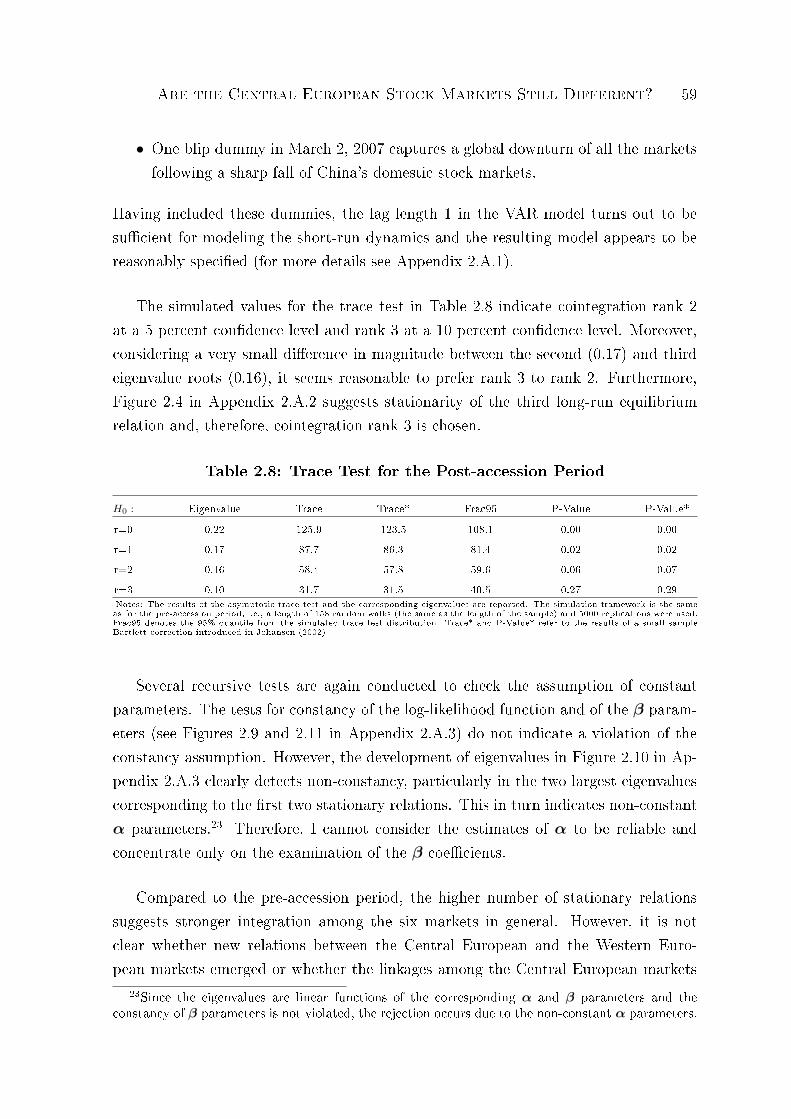
Are the Central European Stock Markets Still Different? 59
• One blip dummy in March 2, 2007 captures a global downturn of all the marketsfollowing a sharp fall of China's domestic stock markets.
Having included these dummies, the lag length 1 in the VAR model turns out to besucient for modeling the short-run dynamics and the resulting model appears to bereasonably specied (for more details see Appendix 2.A.1).
The simulated values for the trace test in Table 2.8 indicate cointegration rank 2at a 5 percent condence level and rank 3 at a 10 percent condence level. Moreover,considering a very small dierence in magnitude between the second (0.17) and thirdeigenvalue roots (0.16), it seems reasonable to prefer rank 3 to rank 2. Furthermore,Figure 2.4 in Appendix 2.A.2 suggests stationarity of the third long-run equilibriumrelation and, therefore, cointegration rank 3 is chosen.
Table 2.8: Trace Test for the Post-accession Period
H0 : Eigenvalue Trace Trace* Frac95 P-Value P-Value*
r=0 0.22 125.9 123.5 108.1 0.00 0.00r=1 0.17 87.7 86.3 81.4 0.02 0.02r=2 0.16 58.4 57.8 59.6 0.06 0.07r=3 0.10 31.7 31.5 40.5 0.27 0.29Notes: The results of the asymptotic trace test and the corresponding eigenvalues are reported. The simulation framework is the sameas for the pre-accession period, i.e., a length of 158 random walks (the same as the length of the sample) and 5000 replications were used.Frac95 denotes the 95% quantile from the simulated trace test distribution. Trace* and P-Value* refer to the results of a small sampleBartlett correction introduced in Johansen (2002).
Several recursive tests are again conducted to check the assumption of constantparameters. The tests for constancy of the log-likelihood function and of the β param-eters (see Figures 2.9 and 2.11 in Appendix 2.A.3) do not indicate a violation of theconstancy assumption. However, the development of eigenvalues in Figure 2.10 in Ap-pendix 2.A.3 clearly detects non-constancy, particularly in the two largest eigenvaluescorresponding to the rst two stationary relations. This in turn indicates non-constantα parameters.23 Therefore, I cannot consider the estimates of α to be reliable andconcentrate only on the examination of the β coecients.
Compared to the pre-accession period, the higher number of stationary relationssuggests stronger integration among the six markets in general. However, it is notclear whether new relations between the Central European and the Western Euro-pean markets emerged or whether the linkages among the Central European markets
23Since the eigenvalues are linear functions of the corresponding α and β parameters and theconstancy of β parameters is not violated, the rejection occurs due to the non-constant α parameters.
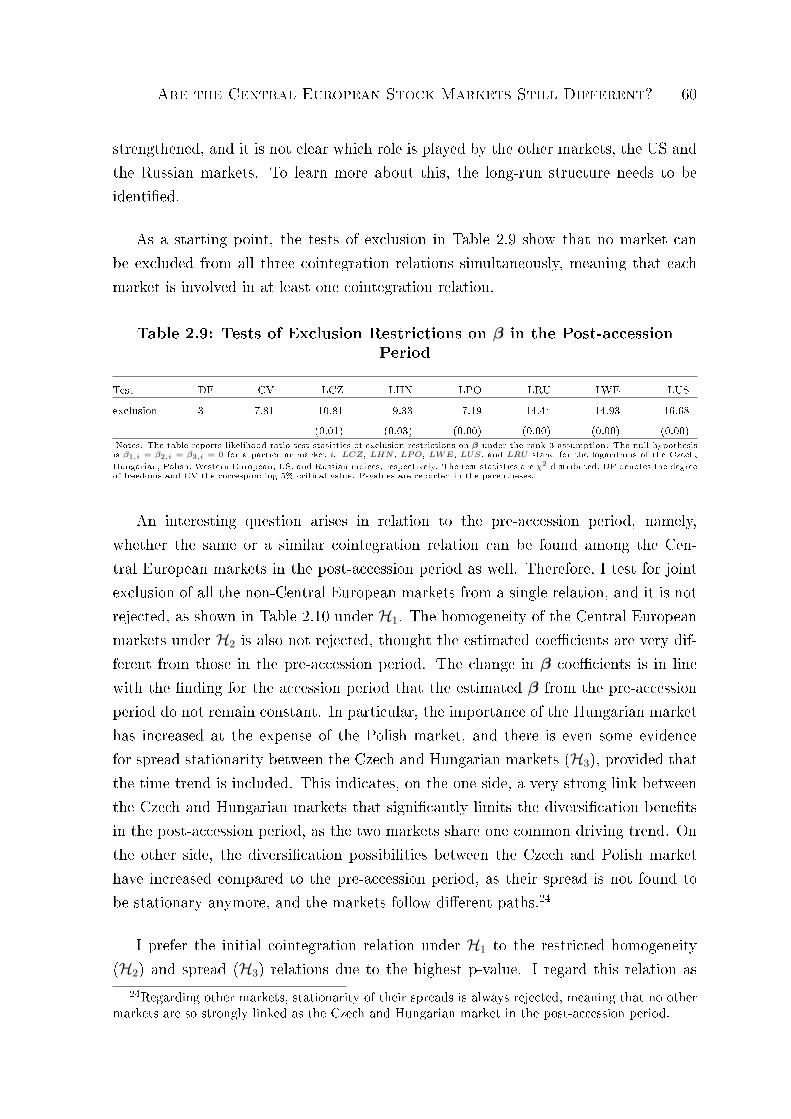
Are the Central European Stock Markets Still Different? 60
strengthened, and it is not clear which role is played by the other markets, the US andthe Russian markets. To learn more about this, the long-run structure needs to beidentied.
As a starting point, the tests of exclusion in Table 2.9 show that no market canbe excluded from all three cointegration relations simultaneously, meaning that eachmarket is involved in at least one cointegration relation.
Table 2.9: Tests of Exclusion Restrictions on β in the Post-accessionPeriod
Test DF CV LCZ LHN LPO LRU LWE LUS
exclusion 3 7.81 10.81 9.33 17.19 14.44 14.93 16.68(0.01) (0.03) (0.00) (0.00) (0.00) (0.00)
Notes: The table reports likelihood ratio test statistics of exclusion restrictions on β under the rank 3 assumption. The null hypothesisis β1,i = β2,i = β3,i = 0 for a particular market i. LCZ, LHN , LPO, LWE, LUS, and LRU stand for the logarithms of the Czech,Hungarian, Polish, Western European, US, and Russian indices, respectively. The test statistics are χ2 distributed, DF denotes the degreeof freedoms and CV the corresponding 5% critical value. P-values are reported in the parentheses.
An interesting question arises in relation to the pre-accession period, namely,whether the same or a similar cointegration relation can be found among the Cen-tral European markets in the post-accession period as well. Therefore, I test for jointexclusion of all the non-Central European markets from a single relation, and it is notrejected, as shown in Table 2.10 under H1. The homogeneity of the Central Europeanmarkets under H2 is also not rejected, thought the estimated coecients are very dif-ferent from those in the pre-accession period. The change in β coecients is in linewith the nding for the accession period that the estimated β from the pre-accessionperiod do not remain constant. In particular, the importance of the Hungarian markethas increased at the expense of the Polish market, and there is even some evidencefor spread stationarity between the Czech and Hungarian markets (H3), provided thatthe time trend is included. This indicates, on the one side, a very strong link betweenthe Czech and Hungarian markets that signicantly limits the diversication benetsin the post-accession period, as the two markets share one common driving trend. Onthe other side, the diversication possibilities between the Czech and Polish markethave increased compared to the pre-accession period, as their spread is not found tobe stationary anymore, and the markets follow dierent paths.24
I prefer the initial cointegration relation under H1 to the restricted homogeneity(H2) and spread (H3) relations due to the highest p-value. I regard this relation as
24Regarding other markets, stationarity of their spreads is always rejected, meaning that no othermarkets are so strongly linked as the Czech and Hungarian market in the post-accession period.
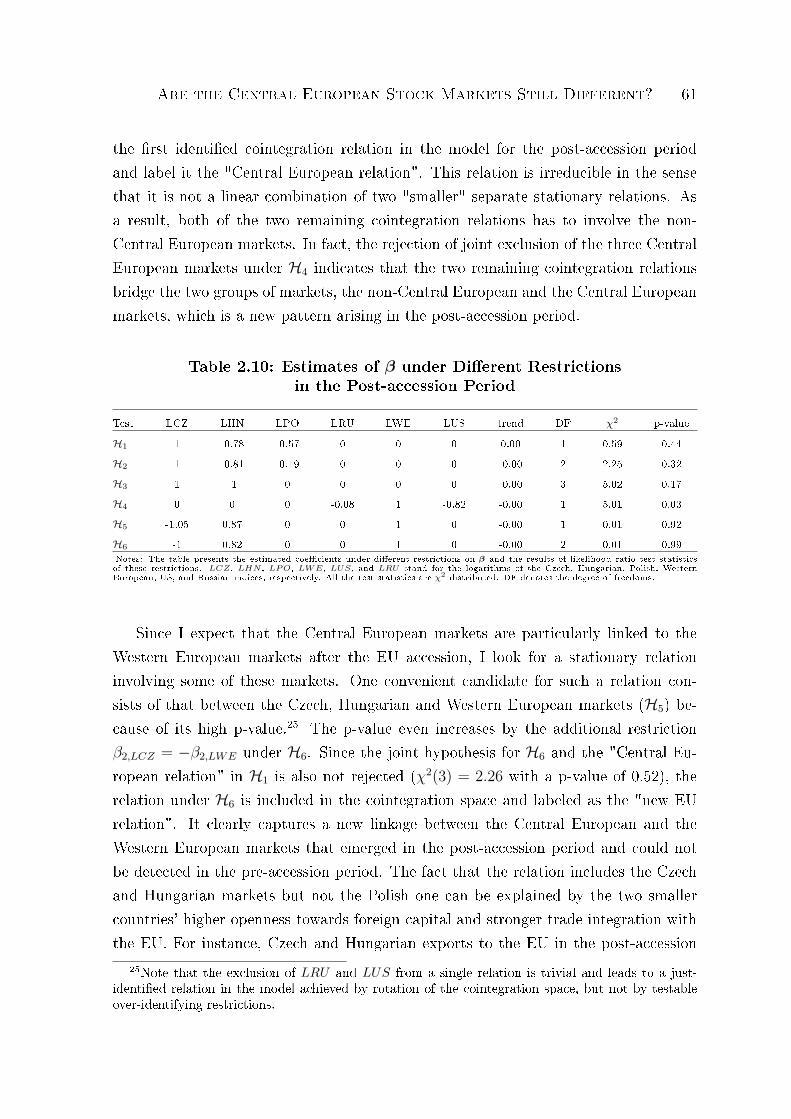
Are the Central European Stock Markets Still Different? 61
the rst identied cointegration relation in the model for the post-accession periodand label it the "Central European relation". This relation is irreducible in the sensethat it is not a linear combination of two "smaller" separate stationary relations. Asa result, both of the two remaining cointegration relations has to involve the non-Central European markets. In fact, the rejection of joint exclusion of the three CentralEuropean markets under H4 indicates that the two remaining cointegration relationsbridge the two groups of markets, the non-Central European and the Central Europeanmarkets, which is a new pattern arising in the post-accession period.
Table 2.10: Estimates of β under Dierent Restrictionsin the Post-accession Period
Test LCZ LHN LPO LRU LWE LUS trend DF χ2 p-value
H1 1 -0.78 -0.57 0 0 0 0.00 1 0.59 0.44H2 1 -0.81 -0.19 0 0 0 -0.00 2 2.25 0.32H3 1 -1 0 0 0 0 -0.00 3 5.02 0.17H4 0 0 0 -0.08 1 -0.82 -0.00 1 5.01 0.03H5 -1.05 0.87 0 0 1 0 -0.00 1 0.01 0.92H6 -1 0.82 0 0 1 0 -0.00 2 0.01 0.99Notes: The table presents the estimated coecients under dierent restrictions on β and the results of likelihood ratio test statisticsof these restrictions. LCZ, LHN, LPO, LWE, LUS, and LRU stand for the logarithms of the Czech, Hungarian, Polish, WesternEuropean, US, and Russian indices, respectively. All the test statistics are χ2 distributed. DF denotes the degree of freedoms.
Since I expect that the Central European markets are particularly linked to theWestern European markets after the EU accession, I look for a stationary relationinvolving some of these markets. One convenient candidate for such a relation con-sists of that between the Czech, Hungarian and Western European markets (H5) be-cause of its high p-value.25 The p-value even increases by the additional restrictionβ2,LCZ = −β2,LWE under H6. Since the joint hypothesis for H6 and the "Central Eu-ropean relation" in H1 is also not rejected (χ2(3) = 2.26 with a p-value of 0.52), therelation under H6 is included in the cointegration space and labeled as the "new EUrelation". It clearly captures a new linkage between the Central European and theWestern European markets that emerged in the post-accession period and could notbe detected in the pre-accession period. The fact that the relation includes the Czechand Hungarian markets but not the Polish one can be explained by the two smallercountries' higher openness towards foreign capital and stronger trade integration withthe EU. For instance, Czech and Hungarian exports to the EU in the post-accession
25Note that the exclusion of LRU and LUS from a single relation is trivial and leads to a just-identied relation in the model achieved by rotation of the cointegration space, but not by testableover-identifying restrictions.
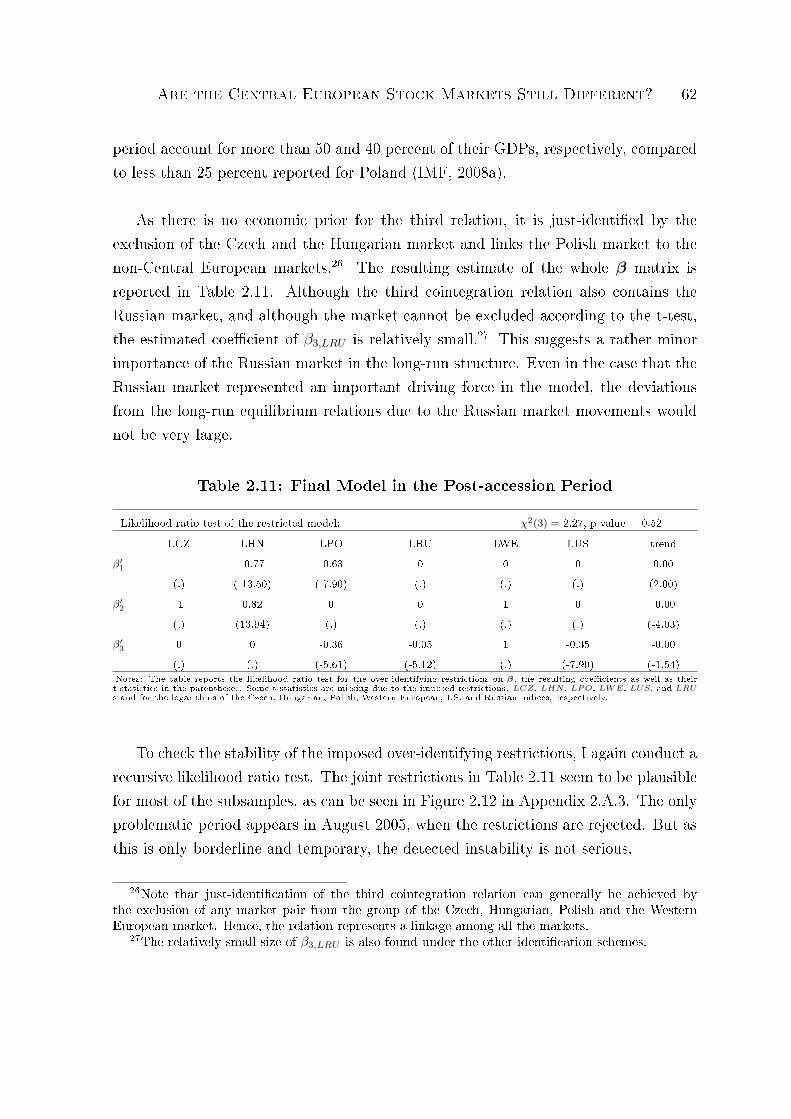
Are the Central European Stock Markets Still Different? 62
period account for more than 50 and 40 percent of their GDPs, respectively, comparedto less than 25 percent reported for Poland (IMF, 2008a).
As there is no economic prior for the third relation, it is just-identied by theexclusion of the Czech and the Hungarian market and links the Polish market to thenon-Central European markets.26 The resulting estimate of the whole β matrix isreported in Table 2.11. Although the third cointegration relation also contains theRussian market, and although the market cannot be excluded according to the t-test,the estimated coecient of β3,LRU is relatively small.27 This suggests a rather minorimportance of the Russian market in the long-run structure. Even in the case that theRussian market represented an important driving force in the model, the deviationsfrom the long-run equilibrium relations due to the Russian market movements wouldnot be very large.
Table 2.11: Final Model in the Post-accession Period
Likelihood ratio test of the restricted model: χ2(3) = 2.27, p-value = 0.52
LCZ LHN LPO LRU LWE LUS trendβ′1 1 -0.77 -0.63 0 0 0 0.00
(.) (-13.50) (-7.90) (.) (.) (.) (2.00)β′2 -1 0.82 0 0 1 0 -0.00
(.) (13.94) (.) (.) (.) (.) (-4.03)β′3 0 0 -0.36 -0.05 1 -0.35 -0.00
(.) (.) (-5.61) (-5.12) (.) (-7.90) (-1.54)Notes: The table reports the likelihood ratio test for the over-identifying restrictions on β, the resulting coecients as well as theirt-statistics in the parentheses. Some t-statistics are missing due to the imposed restrictions. LCZ, LHN , LPO, LWE, LUS, and LRUstand for the logarithms of the Czech, Hungarian, Polish, Western European, US, and Russian indices, respectively.
To check the stability of the imposed over-identifying restrictions, I again conduct arecursive likelihood ratio test. The joint restrictions in Table 2.11 seem to be plausiblefor most of the subsamples, as can be seen in Figure 2.12 in Appendix 2.A.3. The onlyproblematic period appears in August 2005, when the restrictions are rejected. But asthis is only borderline and temporary, the detected instability is not serious.
26Note that just-identication of the third cointegration relation can generally be achieved bythe exclusion of any market pair from the group of the Czech, Hungarian, Polish and the WesternEuropean market. Hence, the relation represents a linkage among all the markets.
27The relatively small size of β3,LRU is also found under the other identication schemes.
Are the Central European Stock Markets Still Different? 63
2.5.4 Robustness Checks
To see if important information is lost by using weekly instead of daily data, I replicatethe models with the Tuesday closing prices instead of the Friday closing prices. I adjustonly the inclusion of dummies. For instance, since September 11, 2001 was Tuesday,the corresponding dummy is shifted 3 days ahead from Friday to Tuesday. The resultsshow that the cointegration rank and the identied long-run relations are robust to theday of the week used in both the pre- and post-accession periods. More specically,the same restrictions on the β coecients are not rejected, and the magnitudes ofthe estimated coecients remain similar. Certain dierences are found only in theestimated α coecients, since the Hungarian market in the pre-accession period issuggested to be adjusting to the long-run relation in addition to the Czech market.Considering the similarity of the Hungarian and Czech markets in terms of their sizeand openness, this nding appears to be plausible and underlines the importance ofPolish market movements for the whole Central European region. The α estimatesin the post-accession period are found to be unstable as in the case of the Fridaydata. To further investigate the choice of the data, I also use data in US dollarsinstead of the local currencies. My analysis conrms the ndings in Yang et al. (2006),Koch and Koch (1991) and Bessler and Yang (2003) that the results do not dependsubstantially on the currency used. In particular, the number of detected equilibriumrelations is found to be the same regarding both periods.
As a last robustness check, I examine alternative model specications. Includingthe three dummies for the instability after September 11, 2001, the characteristics ofthe long-run relation in the pre-accession period do not substantially depend on thelag length of the model or on additional dummies used. Nevertheless, the results forthe post-accession period are found to be more sensible to the choice of lag lengthor the inclusion of dummy variables. Under alternative model specications, I ndstronger support for preferring rank 2 to rank 3 according to the trace test. The twoequilibrium relations detected still bridge the Central European and the non-CentralEuropean markets, but the "pure Central European relation" is no longer found to bestationary. Hence, the main result that new linkages between the Central Europeanand the other markets emerge in the post-accession period remains unchanged. Onthe contrary, the degree of cointegration between the Central European markets seemsto decrease using some of the dierent model specications. However, most of thesespecications seriously violate the residual or constancy assumptions and thus does notappear to be reliable. The detected dierences in the results deliver further evidence
Are the Central European Stock Markets Still Different? 64
about the importance of fullled model assumptions for statistical inference.
2.6 Conclusions
The Central European countries have been the leaders of the transition process fromcentrally planned towards free market economies. A substantial role in the process oftransition has been played by developed countries, especially those in Western Europe.For instance, large capital inows, especially in the form of FDI, have representedone important channel for tightening economic relations. Consequently, the CentralEuropean countries became members of the EU in May 2004.
This study shows that the EU accession resulted also in stronger nancial inte-gration of these countries with the global economy in general and with the "old" EUcountries in particular. Based on a cointegration analysis applied on stock marketmovements, this is evidenced by the emergence of two new equilibrium relations inthe post-accession period that link the movements of the Central European markets tothe movements of the Western European, US, and Russian markets, whereas no suchrelations can be detected before the EU enlargement. One new long-run relation couldbe identied as the "new EU relation" because it connects the developments of theCzech and the Hungarian market to the development of the Western European marketrepresenting the "old" EU. The accepted exclusion of the Polish market from this re-lation can be explained by less openness towards foreign investment and weaker tradeintegration of the Polish market with the EU compared to the two smaller CentralEuropean markets. The second new equilibrium relation represents a linkage amongthe Western European, US and Russian markets as well as the Central European mar-kets, though the role of the Russian market is found to be relatively limited. Hence,the existence of the relation points to the importance of the US stock market to theCentral European markets, in addition to the inuence from the Western Europeanmarket, detected after the EU enlargement.
Considering only the three Central European markets, their degree of integration isfound to be the same in the period before and after the EU enlargement, since I detectone cointegration relation linking the three Central European markets in both periods.However, the characteristics of the relation changed over time. Between November
Are the Central European Stock Markets Still Different? 65
1998 and October 2001, this relation can be characterized by a strong adjustment ofthe Czech market to movements of the Polish market. Using an alternative day of theweek, I also nd some evidence for adjustment of the Hungarian market to the Polishmarket movements. These results suggest a major importance of the Polish market forthe Central European region before the EU enlargement. This is not surprising as thePolish market represented the largest stock market in the region, whose movementswere likely to reect especially local market events, because only a relatively low frac-tion of investment to the market originated abroad. Nevertheless, the characteristics ofthe relation changed permanently around November 2002, which roughly correspondsto the end of the EU admission negotiations on December 13, 2002. In particular, theimportance of the Polish market is indicated to be smaller after the EU accession in2004, since a strong link between the Czech and Hungarian markets is found. Con-sidering the rich long-run structure in the post-accession period, the Polish market asan initial driving force of the "Central European relation" in the pre-accession periodwas likely to be substituted later on by the stochastic trends of the mature markets,in particular by the Western European market. Unfortunately, recursive tests of pa-rameter constancy detect serious instability of the α coecients, which impedes theconrmation of this hypothesis by the data.
This study nds evidence for a signicantly stronger nancial integration of theCentral European markets with the global economy after the EU enlargement in 2004,particularly with the "old" EU. I have shown that new long-run linkages between theCentral European markets and the developed markets in Western Europe and the USemerged after the EU accession, though no such relation could be found before theEU enlargement. The increased linkages among the markets mean that the CentralEuropean stock markets became more vulnerable to shocks hitting developed economieson the one hand but more resistant to shocks originating domestically on the otherhand. From the perspective of stock market investors, the results suggest that thebenets of long-run portfolio diversication between the developed and the CentralEuropean markets were reduced.
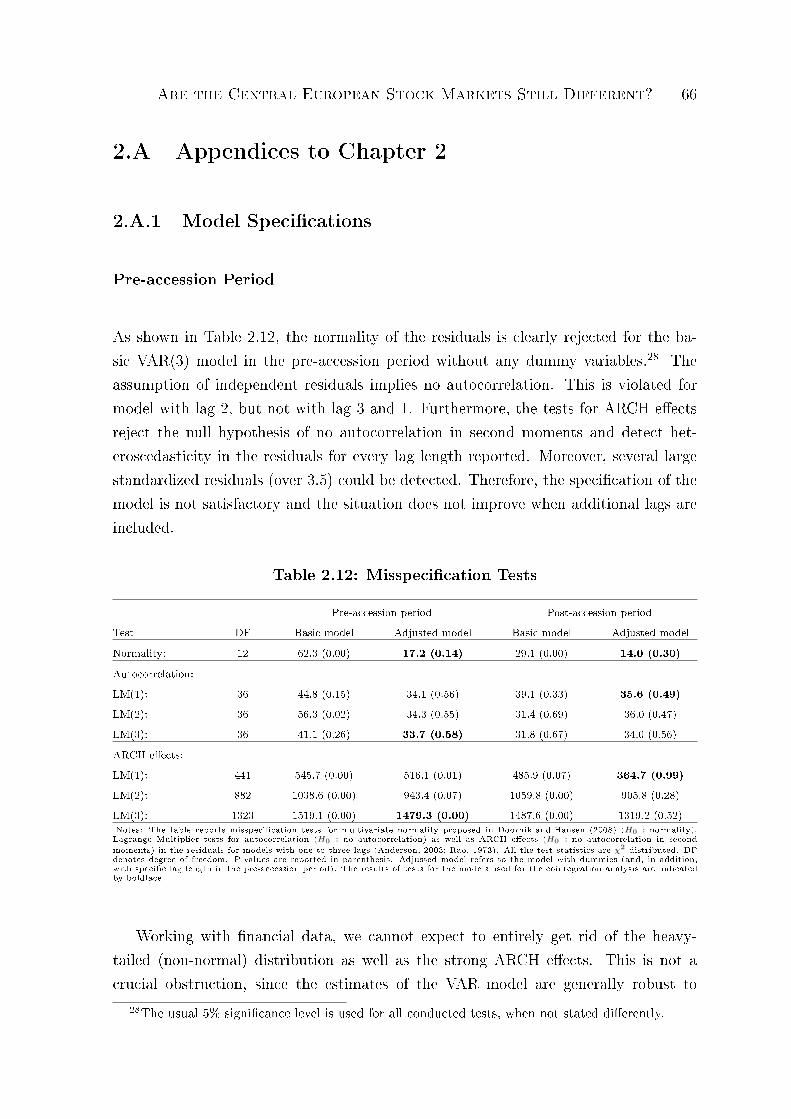
Are the Central European Stock Markets Still Different? 66
2.A Appendices to Chapter 2
2.A.1 Model Specications
Pre-accession Period
As shown in Table 2.12, the normality of the residuals is clearly rejected for the ba-sic VAR(3) model in the pre-accession period without any dummy variables.28 Theassumption of independent residuals implies no autocorrelation. This is violated formodel with lag 2, but not with lag 3 and 1. Furthermore, the tests for ARCH eectsreject the null hypothesis of no autocorrelation in second moments and detect het-eroscedasticity in the residuals for every lag length reported. Moreover, several largestandardized residuals (over 3.5) could be detected. Therefore, the specication of themodel is not satisfactory and the situation does not improve when additional lags areincluded.
Table 2.12: Misspecication Tests
Pre-accession period Post-accession periodTest DF Basic model Adjusted model Basic model Adjusted model
Normality: 12 62.3 (0.00) 17.2 (0.14) 29.1 (0.00) 14.0 (0.30)Autocorrelation:LM(1): 36 44.8 (0.15) 34.1 (0.56) 39.1 (0.33) 35.6 (0.49)LM(2): 36 56.3 (0.02) 34.3 (0.55) 31.4 (0.69) 36.0 (0.47)LM(3): 36 41.1 (0.26) 33.7 (0.58) 31.8 (0.67) 34.0 (0.56)
ARCH eects:LM(1): 441 545.7 (0.00) 516.1 (0.01) 485.9 (0.07) 364.7 (0.99)LM(2): 882 1038.6 (0.00) 943.4 (0.07) 1059.8 (0.00) 905.8 (0.28)LM(3): 1323 1519.1 (0.00) 1479.3 (0.00) 1487.6 (0.00) 1319.2 (0.52)Notes: The table reports misspecication tests for multivariate normality proposed in Doornik and Hansen (2008) (H0 : normality),Lagrange Multiplier tests for autocorrelation (H0 : no autocorrelation) as well as ARCH eects (H0 : no autocorrelation in secondmoments) in the residuals for models with one to three lags (Anderson, 2003; Rao, 1973). All the test statistics are χ2 distributed. DFdenotes degree of freedom. P-values are reported in parenthesis. Adjusted model refers to the model with dummies (and, in addition,with specic lag length in the pre-accession period). The results of tests for the models used for the cointegration analysis are indicatedby boldface.
Working with nancial data, we cannot expect to entirely get rid of the heavy-tailed (non-normal) distribution as well as the strong ARCH eects. This is not acrucial obstruction, since the estimates of the VAR model are generally robust to
28The usual 5% signicance level is used for all conducted tests, when not stated dierently.
Are the Central European Stock Markets Still Different? 67
deviations from normality (Juselius, 2007, page 128) and presence of ARCH eects(Gonzalo, 1994; Lee and Tse, 1996). However, appropriate dummy variables mightmitigate autocorrelation by the elimination of large residuals and improve the skewnessand kurtosis of the residual distribution. Therefore, I include several dummies, as listedin Section 2.5.1.
I further adjust the lag length of the model. Generally, it is set to 3, because noautocorrelation in residuals is rejected for the VAR(2) model, but not for the VAR(3)model. A longer lag structure appears to be redundant, and a shorter structure isrejected by the tests for lag reduction. Nevertheless, the examination of the coecientsof the Γ1 and Γ2 matrices in the VECM specication29 indicates that the columnsΓ1,LRU , Γ2,LWE and Γ2,LUS contain only insignicant coecients and can be individuallyas well as jointly excluded. For instance, the likelihood ratio test statistic of the jointhypothesis of exclusion is LR = 2(3333.8 − 3322.7) = 11.1, which is smaller than thecritical value χ2
0.95(18) = 28.9. Therefore, I use this more parsimonious structure oflags.
The misspecication tests for the resulting model (Table 2.12, Adjusted model)show that both no autocorrelation and normality of the residuals have improved sub-stantially. Hence, the extended model is preferred to the basic one.
Post-accession Period
The basic VAR model for the post-accession period surprisingly does not suer fromautocorrelation in residuals (using any lag of 1 to 3). However, non-normality, ARCHeects and large residuals are still detected (Table 2.12, Basic model). The inclusionof the dummies introduced in Section 2.5.3 improve the model substantially (see Ta-ble 2.12, Adjusted model). Furthermore, the lag length is set to 1 for two reasons.First, the likelihood ratio tests for reducing lag length from 3 to 1 (χ2(72) = 82.9 witha p-value 0.18) and from 2 to 1 (χ2(36) = 39.98 with a p-value 0.30) do not reject thehypothesis of the sub-model with lag length 1. Second, the misspecication tests forthis model do not detect any residual autocorrelation, non-normality or even presenceof ARCH eects and thus the model is used for the following cointegration analysis.
29Note that the lag length of 3 in the VAR form corresponds to the lag length of 2 in the VECMform and, thus, to only two "Γ" matrices.
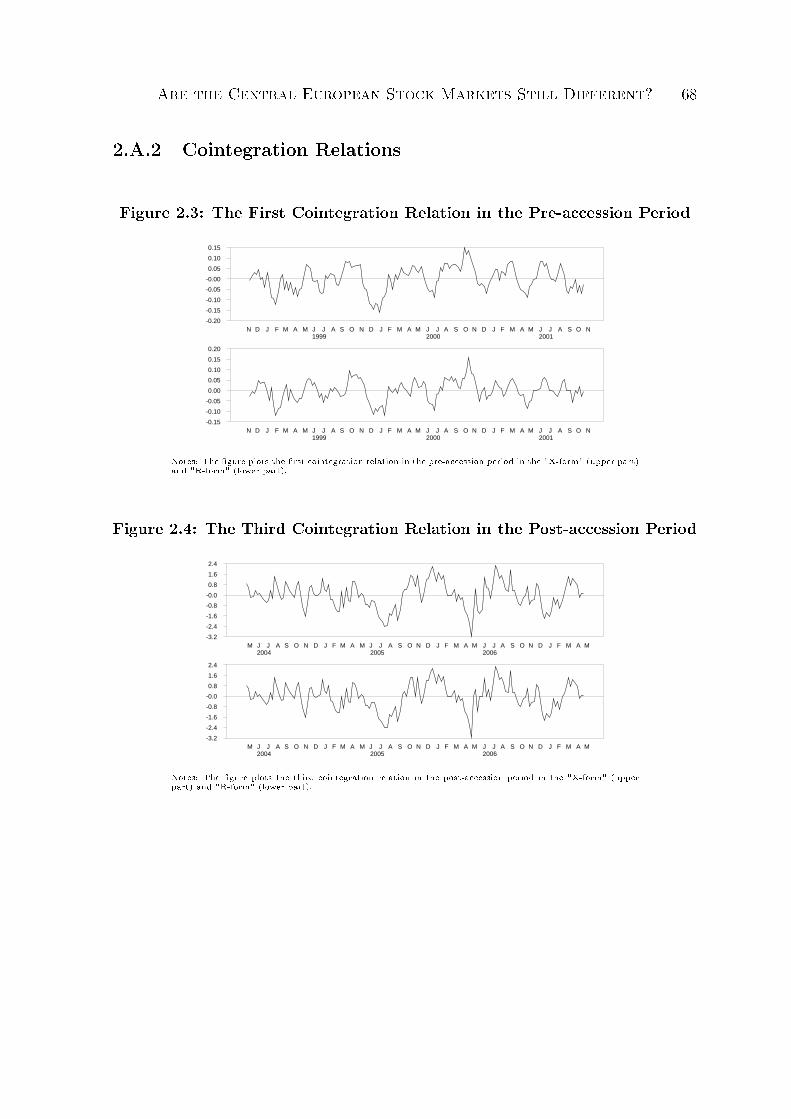
Are the Central European Stock Markets Still Different? 68
2.A.2 Cointegration Relations
Figure 2.3: The First Cointegration Relation in the Pre-accession Period
N D J F M A M J J A S O N D J F M A M J J A S O N D J F M A M J J A S O N1999 2000 2001
-0.20
-0.15
-0.10
-0.05
-0.00
0.05
0.10
0.15
N D J F M A M J J A S O N D J F M A M J J A S O N D J F M A M J J A S O N1999 2000 2001
-0.15
-0.10
-0.05
0.00
0.05
0.10
0.15
0.20
Notes: The gure plots the rst cointegration relation in the pre-accession period in the "X-form" (upper part)and "R-form" (lower part).
Figure 2.4: The Third Cointegration Relation in the Post-accession Period
M J J A S O N D J F M A M J J A S O N D J F M A M J J A S O N D J F M A M2004 2005 2006
-3.2
-2.4
-1.6
-0.8
-0.0
0.8
1.6
2.4
M J J A S O N D J F M A M J J A S O N D J F M A M J J A S O N D J F M A M2004 2005 2006
-3.2
-2.4
-1.6
-0.8
-0.0
0.8
1.6
2.4
Notes: The gure plots the third cointegration relation in the post-accession period in the "X-form" (upperpart) and "R-form" (lower part).
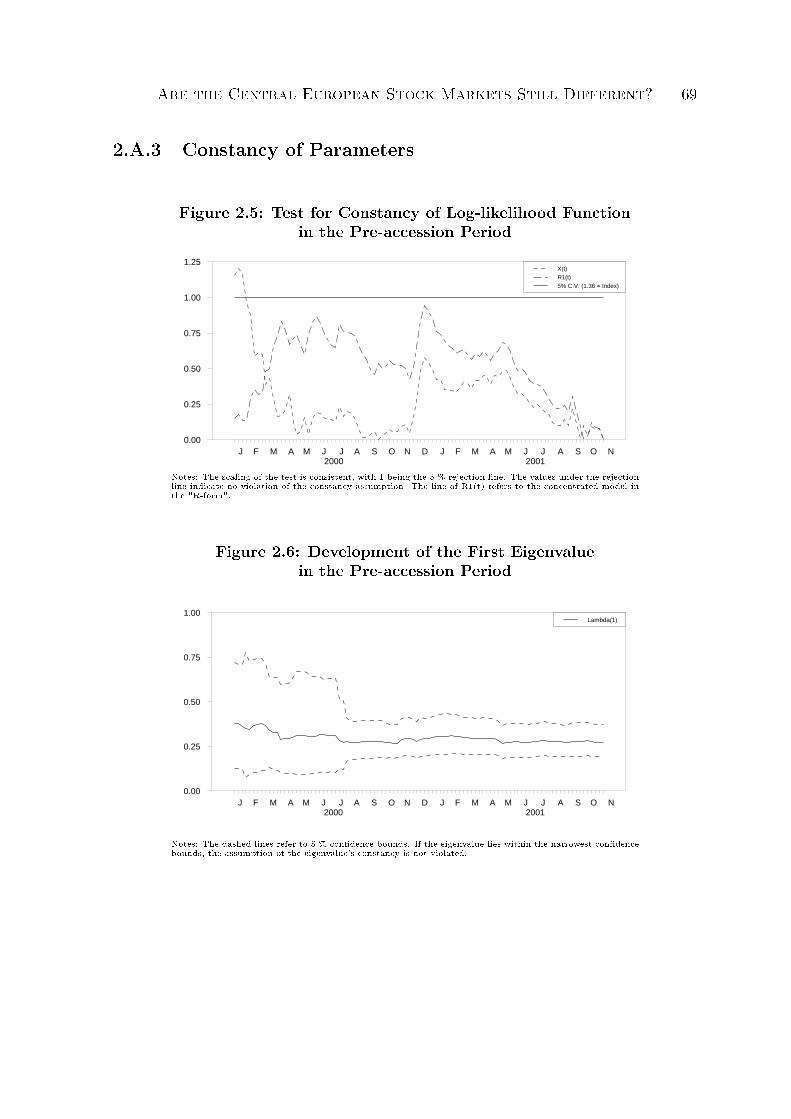
Are the Central European Stock Markets Still Different? 69
2.A.3 Constancy of Parameters
Figure 2.5: Test for Constancy of Log-likelihood Functionin the Pre-accession Period
J F M A M J J A S O N D J F M A M J J A S O N2000 2001
0.00
0.25
0.50
0.75
1.00
1.25X(t)R1(t)5% C.V. (1.36 = Index)
Notes: The scaling of the test is consistent, with 1 being the 5 % rejection line. The values under the rejectionline indicate no violation of the constancy assumption. The line of R1(t) refers to the concentrated model inthe "R-form".
Figure 2.6: Development of the First Eigenvaluein the Pre-accession Period
J F M A M J J A S O N D J F M A M J J A S O N2000 2001
0.00
0.25
0.50
0.75
1.00Lambda(1)
Notes: The dashed lines refer to 5 % condence bounds. If the eigenvalue lies within the narrowest condencebounds, the assumption of the eigenvalue's constancy is not violated.
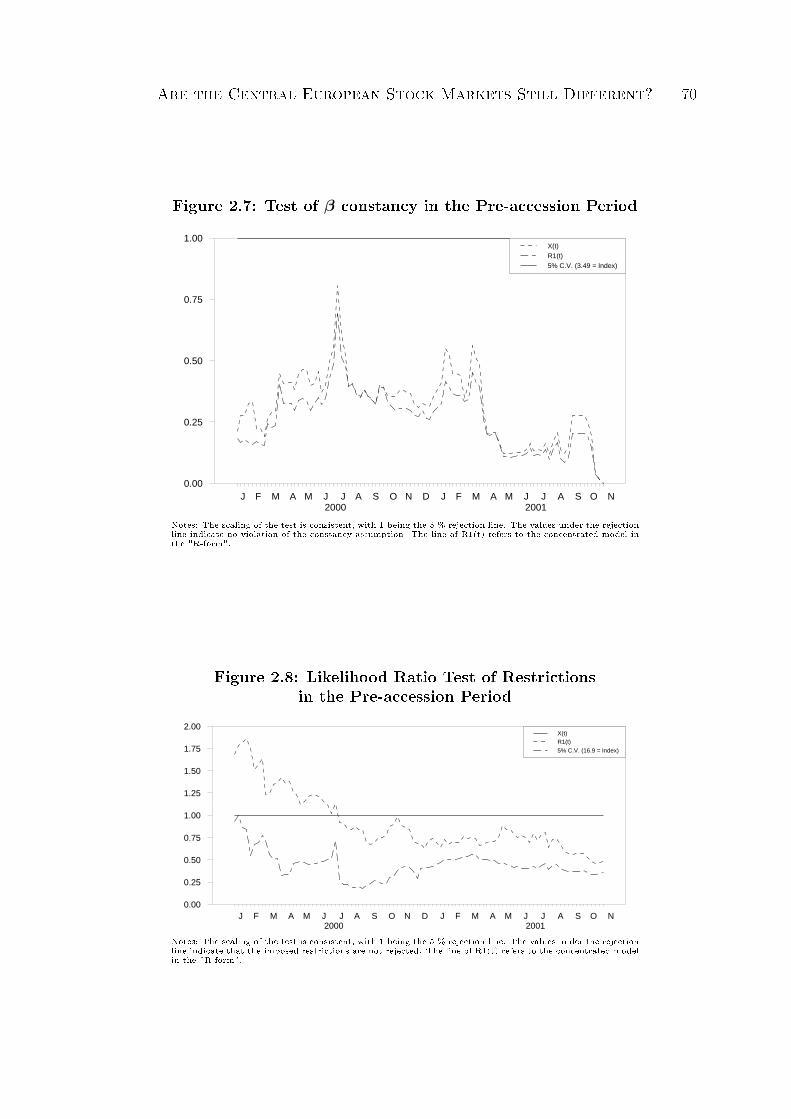
Are the Central European Stock Markets Still Different? 70
Figure 2.7: Test of β constancy in the Pre-accession Period
J F M A M J J A S O N D J F M A M J J A S O N2000 2001
0.00
0.25
0.50
0.75
1.00X(t)R1(t)5% C.V. (3.49 = Index)
Notes: The scaling of the test is consistent, with 1 being the 5 % rejection line. The values under the rejectionline indicate no violation of the constancy assumption. The line of R1(t) refers to the concentrated model inthe "R-form".
Figure 2.8: Likelihood Ratio Test of Restrictionsin the Pre-accession Period
J F M A M J J A S O N D J F M A M J J A S O N2000 2001
0.00
0.25
0.50
0.75
1.00
1.25
1.50
1.75
2.00X(t)R1(t)5% C.V. (16.9 = Index)
Notes: The scaling of the test is consistent, with 1 being the 5 % rejection line. The values under the rejectionline indicate that the imposed restrictions are not rejected. The line of R1(t) refers to the concentrated modelin the "R-form".
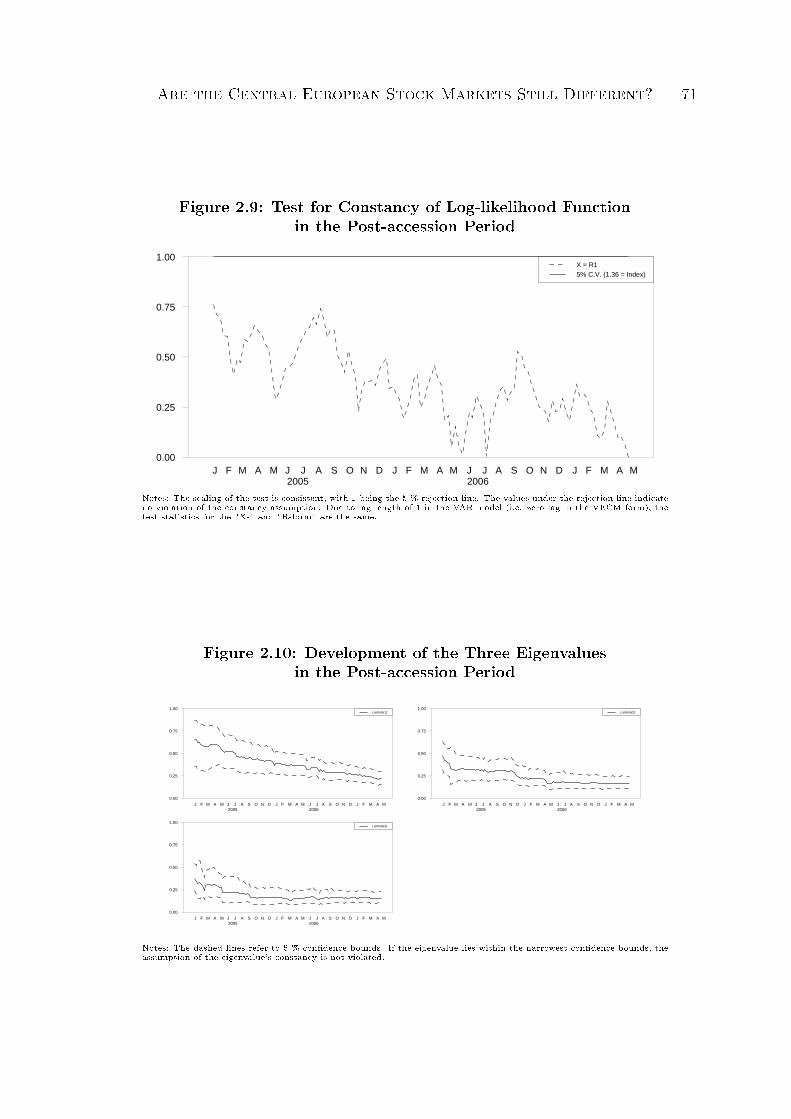
Are the Central European Stock Markets Still Different? 71
Figure 2.9: Test for Constancy of Log-likelihood Functionin the Post-accession Period
J F M A M J J A S O N D J F M A M J J A S O N D J F M A M2005 2006
0.00
0.25
0.50
0.75
1.00X = R15% C.V. (1.36 = Index)
Notes: The scaling of the test is consistent, with 1 being the 5 % rejection line. The values under the rejection line indicateno violation of the constancy assumption. Due to lag length of 1 in the VAR model (i.e. zero lag in the VECM form), thetest statistics for the "X-" and "R-form" are the same.
Figure 2.10: Development of the Three Eigenvaluesin the Post-accession Period
J F M A M J J A S O N D J F M A M J J A S O N D J F M A M2005 2006
0.00
0.25
0.50
0.75
1.00Lambda(1)
J F M A M J J A S O N D J F M A M J J A S O N D J F M A M2005 2006
0.00
0.25
0.50
0.75
1.00Lambda(2)
J F M A M J J A S O N D J F M A M J J A S O N D J F M A M2005 2006
0.00
0.25
0.50
0.75
1.00Lambda(3)
Notes: The dashed lines refer to 5 % condence bounds. If the eigenvalue lies within the narrowest condence bounds, theassumption of the eigenvalue's constancy is not violated.
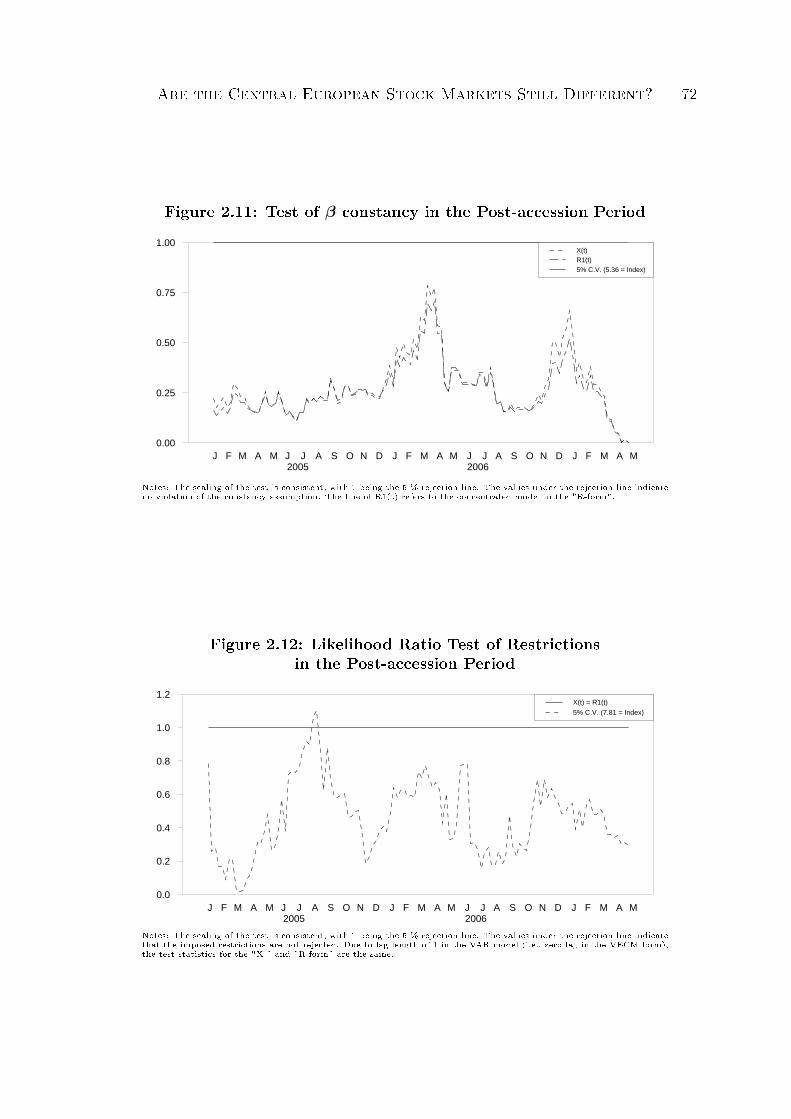
Are the Central European Stock Markets Still Different? 72
Figure 2.11: Test of β constancy in the Post-accession Period
J F M A M J J A S O N D J F M A M J J A S O N D J F M A M2005 2006
0.00
0.25
0.50
0.75
1.00X(t)R1(t)5% C.V. (5.36 = Index)
Notes: The scaling of the test is consistent, with 1 being the 5 % rejection line. The values under the rejection line indicateno violation of the constancy assumption. The line of R1(t) refers to the concentrated model in the "R-form".
Figure 2.12: Likelihood Ratio Test of Restrictionsin the Post-accession Period
J F M A M J J A S O N D J F M A M J J A S O N D J F M A M2005 2006
0.0
0.2
0.4
0.6
0.8
1.0
1.2X(t) = R1(t)
5% C.V. (7.81 = Index)
Notes: The scaling of the test is consistent, with 1 being the 5 % rejection line. The values under the rejection line indicatethat the imposed restrictions are not rejected. Due to lag length of 1 in the VAR model (i.e., zero lag in the VECM form),the test statistics for the "X-" and "R-form" are the same.
References
Anderson, T. W., 2003. An Introduction to Multivariate Statistical Analysis, 3rd Edi-tion. John Wiley and Sons.
Bessler, D. A., Yang, J., 2003. The Structure of Interdependence in International StockMarkets. Journal of International Money and Finance 22, 261287.
Buiter, W., 2004. To Purgatory and Beyond: When and How Should the AccessionCountries from the Central and Eastern Europe Become Full Members of the EMU?CEPR Discussion Paper 4342, Centre for Economic Policy Research, London.
Buiter, W., Grafe, C., 2002. Anchor, Float or Abandoned Ship: Exchange RateRegimes for Accession Countries. CEPR Discussion Paper 3184, Centre for Eco-nomic Policy Research, London.
Doornik, J., Hansen, H., 2008. An Omnibus Test for Univariate and Multivariate Nor-mality. Oxford Bulletin of Economics and Statistics 70, 927939.
Dvorak, T., Podpiera, R., 2006. European Union Enlargement and Equity Markets inAccession Countries. Emerging Markets Review 7 (2), 129146.
Egert, B., Kocenda, E., 2007. Interdependence between Eastern and Western EuropeanStock Markets: Evidence from Intraday Data. Economic Systems 31 (2), 184203.
Eun, C. S., Shim, S., 1989. International Transmission of Stock Market Movements.Journal of Financial and Quantitative Analysis 24, 241256.
Frisch, R., Waugh, F., 1933. Partial Time Regressions as Compared with IndividualTrends. Econometrica 45, 939953.
Gilmore, C. G., McManus, G. M., 2002. International Portfolio Diversication: US andCentral European Equity Markets. Emerging Markets Review 3, 6983.
Are the Central European Stock Markets Still Different? 74
Gilmore, C. G., McManus, G. M., 2003. Bilateral and Multilateral Cointegration Prop-erties between the German and Central European Equity Markets. Studies in Eco-nomics and Finance 21, 4053.
Gonzalo, J., 1994. Five Alternative Methods of Estimating a Long Run Relationship.Journal of Econometrics 60, 203233.
Hanousek, J., Kocenda, E., Svejnar, J., 2009. Divestitures, Privatization and CorporatePerformance in Emerging Markets. The Economics of Transition 17 (1), 4373.
IMF, 2008a. Direction of Trade Statistics, Yearbook. Washington, DC.
IMF, 2008b. International Financial Statistics, Yearbook. Washington, DC.
IMF, 2009. International Financial Statistics, Monthly Issue June. Washington, DC.
Jochum, C., Kirchgassner, G., Platek, M., 1999. A Long-run Relationship betweenEastern European Stock Markets? Cointegration and the 1997/1998 Crises in Emerg-ing Markets. Review of World Economics 135, 454479.
Johansen, S., 1991. Estimation and Hypothesis Testing of Cointegration Vectors inGaussian Vector Autoregressive Models. Econometrica 59, 15511580.
Johansen, S., 1996. Likelihood Based Inference in Cointegrated Vector AutoregressiveModels, 2nd Edition. Advanced Texts in Econometrics. Oxford University Press.
Johansen, S., 2002. A Small Sample Correction of the Test for Cointegration Rank inthe Vector Autoregressive Model. Econometrica 70, 19291961.
Juselius, K., 2007. The Cointegrated VAR Model: Methodology and Applications.Oxford University Press.
Kasa, K., 1992. Common Stochastic Trends in International Stock Markets. Journal ofMonetary Economics 29, 95124.
Kocenda, E., Kutan, A. M., Yigit, T. M., 2006. Pilgrims to the Eurozone: How far,how fast? Economic systems 30, 311327.
Koch, P. D., Koch, T. W., 1991. Evolution in Dynamic Linkages across Daily NationalStock Indexes. Journal of International Money and Finance 10, 231251.
Koeke, J., Schroeder, M., 2003. The Prospects of Capital Markets in Central andEastern Europe. Eastern European Economics 41 (4), 537.
Are the Central European Stock Markets Still Different? 75
Lankes, H. P., Stern, N., 1999. Capital Flows to Eastern Europe. In: Feldstein, M.(Ed.), International Capital Flows. National Bureau of Economic Research, pp. 5796.
Lee, T., Tse, Y., 1996. Cointegration Tests with Conditional Heteroscedasticity. Journalof Econometrics 73, 401410.
Longin, F., Solnik, B., 1995. Is the Correlation of International Equity Returns Con-stant? Journal of International Money and Finance 14, 326.
Marin, D., 2004. A Nation of Poets and Thinkers: Less So with Eastern Enlargement?Austria and Germany. CEPR Discussion Paper 4358, Centre for Economic PolicyResearch, London.
Masih, A. M. M., Masih, R., 1992. A Comparative Analysis of the Propagation of StockMarket Fluctuations in Alternative Models of Dynamic Causal Linkages. AppliedFinancial Economics 7, 5974.
McKinnon, R., 1999. Toward Virtual Exchange-rate Stability in Western and EasternEurope with the Advent of the EMU. In: Blejer, M. I., kreb, M. (Eds.), Balance ofPayments, Exchange Rates, and Competitiveness in Transition Economies. SpringerUnited States, pp. 131158.
Mora, N., Garibaldi, P., Sahay, R., Zettelmeyer, J., 2002. What Moves Capital toTransition Economies? IMF Working Papers 02/64, International Monetary Fund,Washington, DC.
Nielsen, H. B., 2004. UK Money Demand 1873-2001: A Cointegrated VAR Analysiswith Additive Data Corrections. Discussion Papers 04-21, University of Copenhagen,Department of Economics, Copenhagen.
Rao, C. R., 1973. Linear Statistical Inference and its Applications, 2nd Edition. JohnWiley and Sons.
Standard & Poor's, 2002. Emerging Stock Markets Factbook. New York.
Standard & Poor's, 2008. Global Stock Markets Factbook. New York.
Syllignakis, M. N., Kouretas, G. P., 2009. German, US and Central and Eastern Euro-pean Stock Market Integration. Open Economies Review, Online First.
Do Multinationals Transplant their Business Model? 76
Syrioupoulus, T., 2006. Risk and Return Implications from Investing in EmergingEuropean Stock Markets. Journal of International Financial Markets, Institutionsand Money 16, 283299.
Taylor, M. P., Tonks, I., 1989. The Internationalisation of Stock Markets and theAbolition of U. K. Exchange Control. The Review of Economics and Statistics 71,332336.
Voronkova, S., 2004. Equity Market Integration in Central European Emerging Mar-kets: A Cointegration Analysis with Shifting Regimes. International Review of Fi-nancial Analysis 13, 633647.
Yang, J., Hsiao, C., Li, Q., Wang, Z., 2006. The Emerging Market Crises and StockMarket Linkages: Further Evidence. Journal of Applied Econometrics 21, 727744.
Chapter 3
Do Multinationals Transplant theirBusiness Model?∗
3.1 Introduction
Recent literature on international trade has established that the most productive rmsof a country tend to become multinationals.1 One reason is that more productiverms appear to be better able to cover the large xed costs of entering a foreigncountry. How much, however, of this productivity advantage of multinational rmsis translated to the host countries in which these rms invest? Marin (2004) ndsthat German multinationals increase the productivity level of their subsidiaries inCentral Eastern Europe (including Russia, Ukraine and other former Soviet Unioncountries) to, on average, 60 percent of their parent rms in Germany compared withnational rms in Central Eastern Europe which produce 23 percent of the productiv-ity level of German rms during the late 1990s. Austrian multinationals in EasternEurope reach 32 percent of the productivity level of parent rms in Austria. Similarly,Bloom, Sadun, and van Reenen (2007) nd that US multinationals are more produc-tive than non-US multinationals and national rms in the UK. They attribute this tothe better management practices and the more decentralized internal organization ofUS rms (see Bloom, Sadun, and van Reenen, 2009).
Figure 3.1, however, reveals a surprisingly wide variation in productivity levels ofGerman and Austrian subsidiaries in Eastern Europe relative to their parent rmsin Germany and Austria, suggesting that the ability of multinational rms to trans-
∗This chapter is based on joint work with Dalia Marin, University of Munich.1See Helpman, Melitz, and Yeaple (2004); Antras and Helpman (2004).
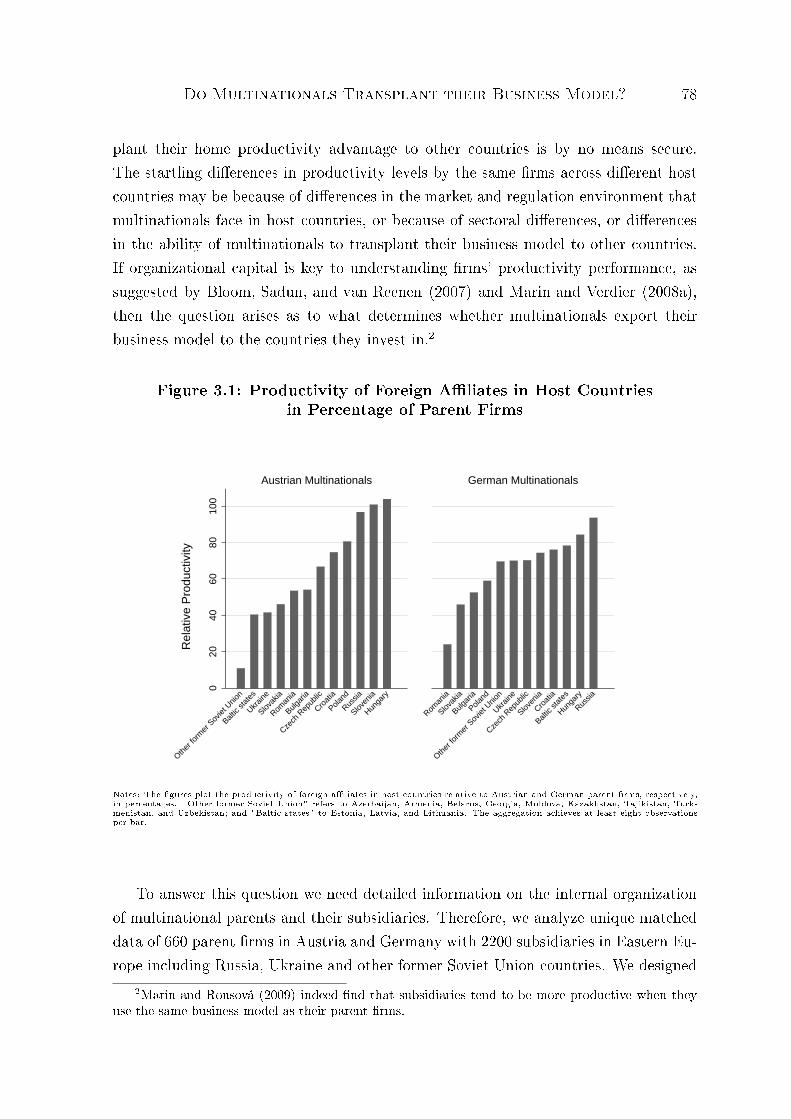
Do Multinationals Transplant their Business Model? 78
plant their home productivity advantage to other countries is by no means secure.The startling dierences in productivity levels by the same rms across dierent hostcountries may be because of dierences in the market and regulation environment thatmultinationals face in host countries, or because of sectoral dierences, or dierencesin the ability of multinationals to transplant their business model to other countries.If organizational capital is key to understanding rms' productivity performance, assuggested by Bloom, Sadun, and van Reenen (2007) and Marin and Verdier (2008a),then the question arises as to what determines whether multinationals export theirbusiness model to the countries they invest in.2
Figure 3.1: Productivity of Foreign Aliates in Host Countriesin Percentage of Parent Firms
020
4060
8010
0
Other
form
er S
oviet
Unio
n
Baltic
state
s
Ukrain
e
Slovak
ia
Roman
ia
Bulgar
ia
Czech
Rep
ublic
Croat
ia
Poland
Russia
Sloven
ia
Hunga
ry
Roman
ia
Slovak
ia
Bulgar
ia
Poland
Other
form
er S
oviet
Unio
n
Ukrain
e
Czech
Rep
ublic
Sloven
ia
Croat
ia
Baltic
state
s
Hunga
ry
Russia
Austrian Multinationals German Multinationals
Rel
ativ
e P
rodu
ctiv
ity
Notes: The gures plot the productivity of foreign aliates in host countries relative to Austrian and German parent rms, respectively,in percentages. "Other former Soviet Union" refers to Azerbaijan, Armenia, Belarus, Georgia, Moldova, Kazakhstan, Tajikistan, Turk-menistan, and Uzbekistan; and "Baltic states" to Estonia, Latvia, and Lithuania. The aggregation achieves at least eight observationsper bar.
To answer this question we need detailed information on the internal organizationof multinational parents and their subsidiaries. Therefore, we analyze unique matcheddata of 660 parent rms in Austria and Germany with 2200 subsidiaries in Eastern Eu-rope including Russia, Ukraine and other former Soviet Union countries. We designed
2Marin and Rousová (2009) indeed nd that subsidiaries tend to be more productive when theyuse the same business model as their parent rms.
Do Multinationals Transplant their Business Model? 79
and collected these data from a full population of rms in Austria and Germany in-vesting in Eastern Europe in the years between 1990 and 2001. The sample represents80 percent of German foreign direct investment and 100 percent of Austrian foreigndirect investment in Eastern Europe between 1998 and 2000.
As a measure of internal organization of parent and subsidiary rms we use thelevel of decentralization of thirteen corporate decisions such as decisions on acquisi-tions, new strategy, transfer prices or budget (see Table 3.14 in Appendix 3.A.2 for afull list of corporate decisions for which we have information on the hierarchical levelat which these decisions are taken). Furthermore, we use two proxies for the trans-plantation of business culture of multinationals to their subsidiaries, one via taking therm organization abroad and one via taking the CEO abroad. More specically, weuse a similarity measure counting the number of corporate decisions which are taken atthe same hierarchical level in parent and subsidiary rms and we use the informationwhether or not parent rms send one or more managers from the home country to runthe subsidiary.
Table 3.1 takes a rst look at whether or not multinationals in Austria and Germanytransplant their organization to the host countries. Some 50 per cent of multinationalsdo not transplant (the responsibility for ve or more corporate decisions is allocated todierent hierarchical levels in subsidiaries compared with parent rms), 27 percent ofthese rms transplant partially (the allocation of power diers for two to four corporatedecisions between subsidiaries and parents) and 24 percent of rms transplant fully (allcorporate decisions have the same allocation in subsidiaries as in parent rms or theallocation of one corporate decision diers).
Furthermore, the table looks at whether the organizational mode of multinationalparent rms signicantly aects their ability to transplant their organization to anothercountry. It appears that decentralized parent rms transplant their organization signif-icantly more often than centralized parent rms. Some 37 percent of foreign aliatesuse the same business model as parent rms when their parent rms are decentralizedcompared with 24 percent of subsidiaries for all parent rms and 67 percent of sub-sidiaries use a dierent business model from parent rms when their parent rms arecentralized compared with 50 percent of subsidiaries for all parent rms.
As a result the average levels of decentralization dier between parent rms andtheir subsidiaries as shown in Table 3.2, which looks at whether multinational parent
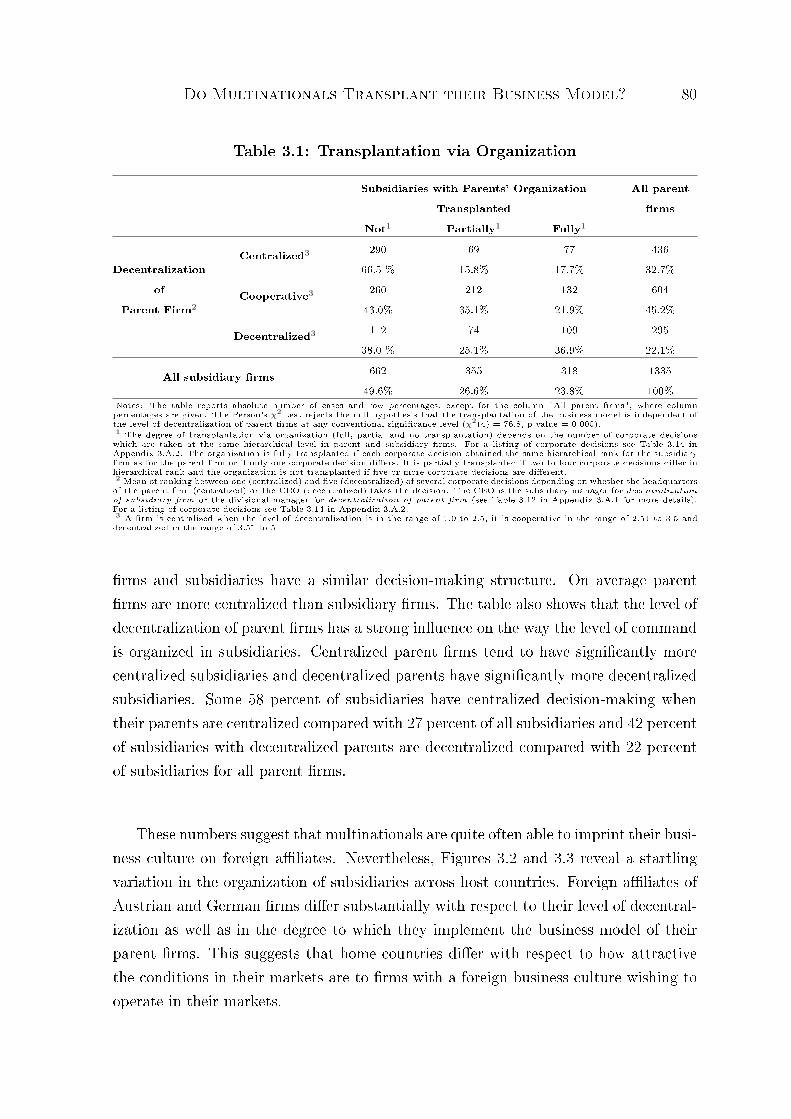
Do Multinationals Transplant their Business Model? 80
Table 3.1: Transplantation via Organization
Subsidiaries with Parents' Organization All parentTransplanted rms
Not1 Partially1 Fully1
Centralized3 290 69 77 436Decentralization 66.5 % 15.8% 17.7% 32.7%
of Cooperative3 260 212 132 604Parent Firm2 43.0% 35.1% 21.9% 45.2%
Decentralized3 112 74 109 29538.0 % 25.1% 36.9% 22.1%
All subsidiary rms 662 355 318 133549.6% 26.6% 23.8% 100%
Notes: The table reports absolute number of cases and row percentages, except for the column "All parent rms", where columnpercentages are given. The Person's χ2 test rejects the null hypothesis that the transplantation of the business model is independent ofthe level of decentralization of parent rms at any conventional signicance level (χ2(4) = 76.8, p-value = 0.000).1 The degree of transplantation via organization (full, partial and no transplantation) depends on the number of corporate decisionswhich are taken at the same hierarchical level in parent and subsidiary rms. For a listing of corporate decisions see Table 3.14 inAppendix 3.A.2. The organization is fully transplanted if each corporate decision obtained the same hierarchical rank for the subsidiaryrm as for the parent rm or if only one corporate decision diers. It is partially transplanted if two to four corporate decisions dier inhierarchical rank and the organization is not transplanted if ve or more corporate decisions are dierent.2 Mean of ranking between one (centralized) and ve (decentralized) of several corporate decisions depending on whether the headquartersof the parent rm (centralized) or the CEO (decentralized) takes the decision. The CEO is the subsidiary manager for decentralizationof subsidiary rm or the divisional manager for decentralization of parent rm (see Table 3.12 in Appendix 3.A.1 for more details).For a listing of corporate decisions see Table 3.14 in Appendix 3.A.2.3 A rm is centralized when the level of decentralization is in the range of 1.0 to 2.5, it is cooperative in the range of 2.51 to 3.5 anddecentralized in the range of 3.51 to 5.
rms and subsidiaries have a similar decision-making structure. On average parentrms are more centralized than subsidiary rms. The table also shows that the level ofdecentralization of parent rms has a strong inuence on the way the level of commandis organized in subsidiaries. Centralized parent rms tend to have signicantly morecentralized subsidiaries and decentralized parents have signicantly more decentralizedsubsidiaries. Some 58 percent of subsidiaries have centralized decision-making whentheir parents are centralized compared with 27 percent of all subsidiaries and 42 percentof subsidiaries with decentralized parents are decentralized compared with 22 percentof subsidiaries for all parent rms.
These numbers suggest that multinationals are quite often able to imprint their busi-ness culture on foreign aliates. Nevertheless, Figures 3.2 and 3.3 reveal a startlingvariation in the organization of subsidiaries across host countries. Foreign aliates ofAustrian and German rms dier substantially with respect to their level of decentral-ization as well as in the degree to which they implement the business model of theirparent rms. This suggests that home countries dier with respect to how attractivethe conditions in their markets are to rms with a foreign business culture wishing tooperate in their markets.
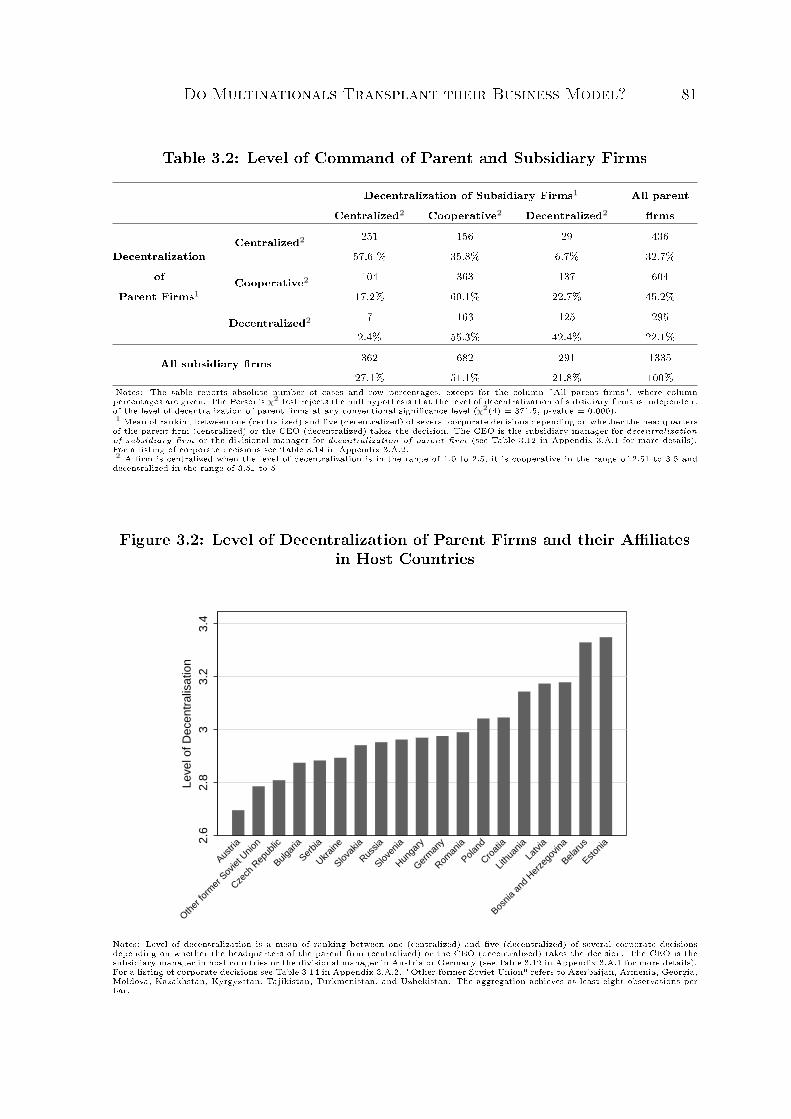
Do Multinationals Transplant their Business Model? 81
Table 3.2: Level of Command of Parent and Subsidiary Firms
Decentralization of Subsidiary Firms1 All parentCentralized2 Cooperative2 Decentralized2 rms
Centralized2 251 156 29 436Decentralization 57.6 % 35.8% 6.7% 32.7%
of Cooperative2 104 363 137 604Parent Firms1 17.2% 60.1% 22.7% 45.2%
Decentralized2 7 163 125 2952.4% 55.3% 42.4% 22.1%
All subsidiary rms 362 682 291 133527.1% 51.1% 21.8% 100%
Notes: The table reports absolute number of cases and row percentages, except for the column "All parent rms", where columnpercentages are given. The Person's χ2 test rejects the null hypothesis that the level of decentralization of subsidiary rms is independentof the level of decentralization of parent rms at any conventional signicance level (χ2(4) = 371.5, p-value = 0.000).1 Mean of ranking between one (centralized) and ve (decentralized) of several corporate decisions depending on whether the headquartersof the parent rm (centralized) or the CEO (decentralized) takes the decision. The CEO is the subsidiary manager for decentralizationof subsidiary rm or the divisional manager for decentralization of parent rm (see Table 3.12 in Appendix 3.A.1 for more details).For a listing of corporate decisions see Table 3.14 in Appendix 3.A.2.2 A rm is centralized when the level of decentralization is in the range of 1.0 to 2.5, it is cooperative in the range of 2.51 to 3.5 anddecentralized in the range of 3.51 to 5.
Figure 3.2: Level of Decentralization of Parent Firms and their Aliatesin Host Countries
2.6
2.8
33.
23.
4Le
vel o
f Dec
entr
alis
atio
n
Austri
a
Other
form
er S
oviet
Unio
n
Czech
Rep
ublic
Bulgar
ia
Serbia
Ukrain
e
Slovak
ia
Russia
Sloven
ia
Hunga
ry
Germ
any
Roman
ia
Poland
Croat
ia
Lithu
ania
Latvi
a
Bosnia
and
Her
zego
vina
Belaru
s
Estonia
Notes: Level of decentralization is a mean of ranking between one (centralized) and ve (decentralized) of several corporate decisionsdepending on whether the headquarters of the parent rm (centralized) or the CEO (decentralized) takes the decision. The CEO is thesubsidiary manager in host countries or the divisional manager in Austria or Germany (see Table 3.12 in Appendix 3.A.1 for more details).For a listing of corporate decisions see Table 3.14 in Appendix 3.A.2. "Other former Soviet Union" refers to Azerbaijan, Armenia, Georgia,Moldova, Kazakhstan, Kyrgyzstan, Tajikistan, Turkmenistan, and Uzbekistan. The aggregation achieves at least eight observations perbar.
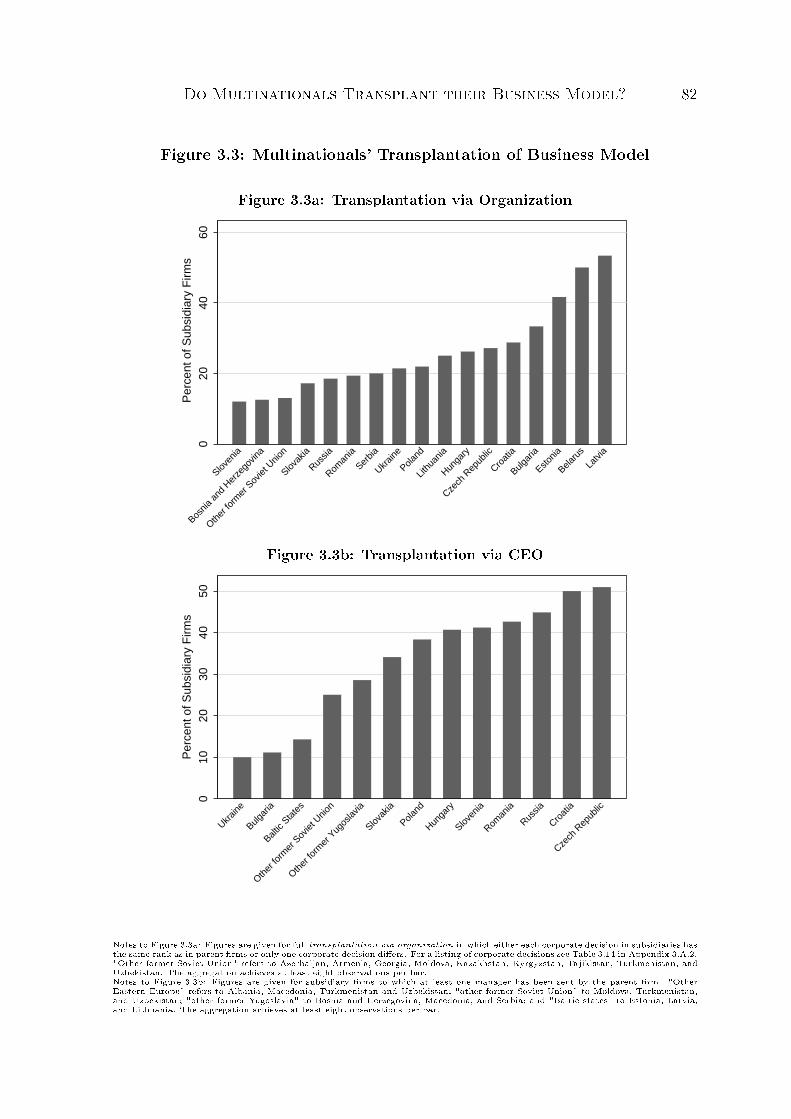
Do Multinationals Transplant their Business Model? 82
Figure 3.3: Multinationals' Transplantation of Business Model
Figure 3.3a: Transplantation via Organization0
2040
60P
erce
nt o
f Sub
sidi
ary
Firm
s
Sloven
ia
Bosnia
and
Her
zego
vina
Other
form
er S
oviet
Unio
n
Slovak
ia
Russia
Roman
ia
Serbia
Ukrain
e
Poland
Lithu
ania
Hunga
ry
Czech
Rep
ublic
Croat
ia
Bulgar
ia
Estonia
Belaru
s
Latvi
a
Figure 3.3b: Transplantation via CEO
010
2030
4050
Per
cent
of S
ubsi
diar
y F
irms
Ukrain
e
Bulgar
ia
Baltic
State
s
Other
form
er S
oviet
Unio
n
Other
form
er Y
ugos
lavia
Slovak
ia
Poland
Hunga
ry
Sloven
ia
Roman
ia
Russia
Croat
ia
Czech
Rep
ublic
Notes to Figure 3.3a: Figures are given for full transplantation via organization in which either each corporate decision in subsidiaries hasthe same rank as in parent rms or only one corporate decision diers. For a listing of corporate decisions see Table 3.14 in Appendix 3.A.2."Other former Soviet Union" refers to Azerbaijan, Armenia, Georgia, Moldova, Kazakhstan, Kyrgyzstan, Tajikistan, Turkmenistan, andUzbekistan. The aggregation achieves at least eight observations per bar.Notes to Figure 3.3b: Figures are given for subsidiary rms to which at least one manager has been sent by the parent rm. "OtherEastern Europe" refers to Albania, Macedonia, Turkmenistan and Uzbekistan; "other former Soviet Union" to Moldova, Turkmenistan,and Uzbekistan; "other former Yugoslavia" to Bosnia and Herzegovina, Macedonia, and Serbia; and "Baltic states" to Estonia, Latvia,and Lithuania. The aggregation achieves at least eight observations per bar.
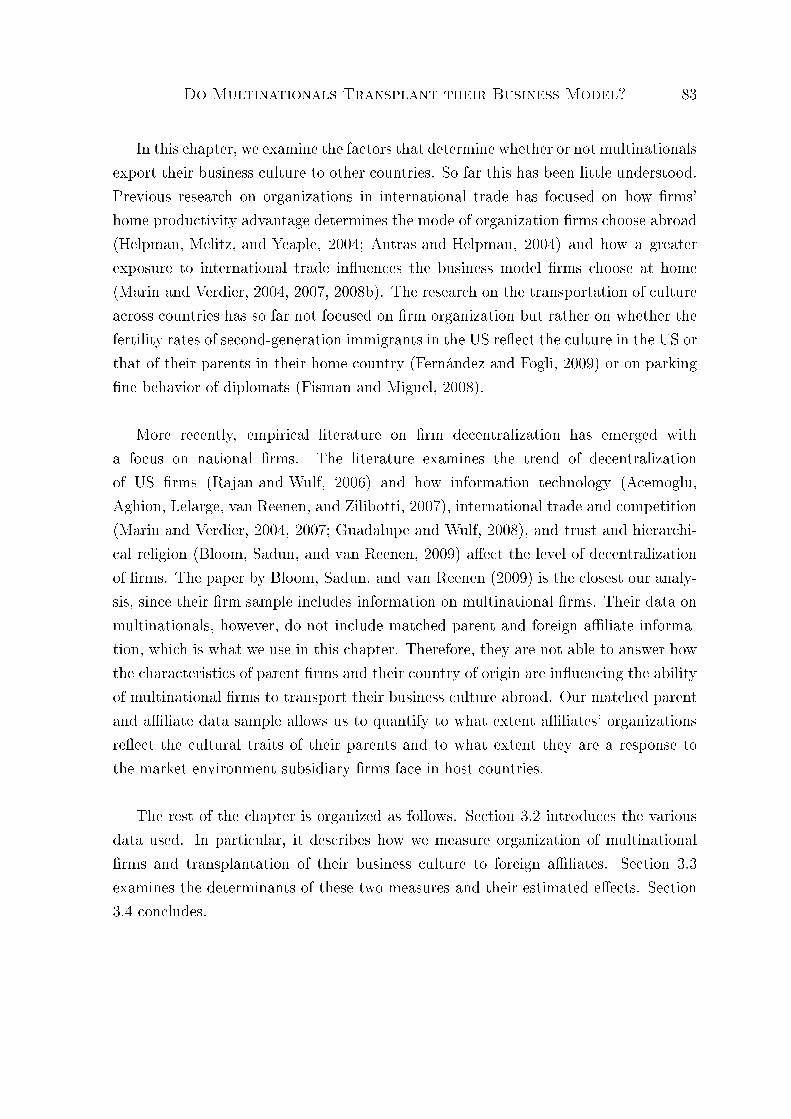
Do Multinationals Transplant their Business Model? 83
In this chapter, we examine the factors that determine whether or not multinationalsexport their business culture to other countries. So far this has been little understood.Previous research on organizations in international trade has focused on how rms'home productivity advantage determines the mode of organization rms choose abroad(Helpman, Melitz, and Yeaple, 2004; Antras and Helpman, 2004) and how a greaterexposure to international trade inuences the business model rms choose at home(Marin and Verdier, 2004, 2007, 2008b). The research on the transportation of cultureacross countries has so far not focused on rm organization but rather on whether thefertility rates of second-generation immigrants in the US reect the culture in the US orthat of their parents in their home country (Fernández and Fogli, 2009) or on parkingne behavior of diplomats (Fisman and Miguel, 2008).
More recently, empirical literature on rm decentralization has emerged witha focus on national rms. The literature examines the trend of decentralizationof US rms (Rajan and Wulf, 2006) and how information technology (Acemoglu,Aghion, Lelarge, van Reenen, and Zilibotti, 2007), international trade and competition(Marin and Verdier, 2004, 2007; Guadalupe and Wulf, 2008), and trust and hierarchi-cal religion (Bloom, Sadun, and van Reenen, 2009) aect the level of decentralizationof rms. The paper by Bloom, Sadun, and van Reenen (2009) is the closest our analy-sis, since their rm sample includes information on multinational rms. Their data onmultinationals, however, do not include matched parent and foreign aliate informa-tion, which is what we use in this chapter. Therefore, they are not able to answer howthe characteristics of parent rms and their country of origin are inuencing the abilityof multinational rms to transport their business culture abroad. Our matched parentand aliate data sample allows us to quantify to what extent aliates' organizationsreect the cultural traits of their parents and to what extent they are a response tothe market environment subsidiary rms face in host countries.
The rest of the chapter is organized as follows. Section 3.2 introduces the variousdata used. In particular, it describes how we measure organization of multinationalrms and transplantation of their business culture to foreign aliates. Section 3.3examines the determinants of these two measures and their estimated eects. Section3.4 concludes.
Do Multinationals Transplant their Business Model? 84
3.2 Data
We collected survey data for 660 multinational corporations in Austria (200) and Ger-many (460) with 2200 subsidiaries in Eastern Europe including the former Soviet Unioncountries during the period 1990 to 2001. The survey questions refer typically to theyears 1998 and 1999, when the data represented 100 percent of Austrian and 80 per-cent of German direct investment in Eastern Europe. This dataset is unique, since itincludes matched information on the organization of 600 parent rms in Austria andGermany and 2200 of their subsidiaries in Eastern Europe.3 In particular, we haveinformation about the level of decentralization of parent rms and their subsidiarieswhich is measured by the level of decision-making within the corporation. This in turnenables us to study when the business model of parent rms is transplanted to theirsubsidiaries.
3.2.1 Measuring Organization
Measuring Decentralization
Our measure of decentralization of parent rms is based on the survey question: "Whodecides on the following issues concerning your corporation: the headquarters or thedivisional manager?" The issues involve thirteen corporate decisions for Austrian andGerman parent rms, i.e. decisions on acquisitions, nances, new strategy, wage in-crease, R&D expenditure, budget, transfer and product prices, introducing a new prod-uct, changing a supplier, hiring two and 20 new workers as well as a new secretary. Seealso Table 3.14 in Appendix 3.A.2 for the listing of the decisions. Responses rangedbetween one and ve with one as a centralized decision, taken entirely at headquarters,and ve as a decentralized decision, taken at the divisional level. We use a simple meanof the available ranking to measure the overall level of decentralization of the rm andcall it the decentralization of parent rm. A counterpart, decentralization of subsidiaryrm, is obtained from answers to the question "Who decides on the following issuesconcerning your corporation: the headquarters of the parent rm or the manager ofthe subsidiary rm in the host country?"
3For a detailed overview of all variables and their descriptive statistics see Tables 3.12 and 3.13,respectively, in Appendix 3.A.1.
Do Multinationals Transplant their Business Model? 85
Table 3.14 in Appendix 3.A.2 shows that the most centralized decision is the decisionon acquisitions with a mean ranking of 1.34 and 1.41 for parent and subsidiary rms,respectively, followed by the decision on a new strategy (with a respective mean rankingof 1.90 and 1.88). Not surprisingly, the most decentralized decisions tend to be thedecision on hiring a secretary (mean ranking of 4.15 and 4.65) and the decision onhiring two new workers, whereas the decision on R&D and the decision to introducea new product tend to be taken cooperatively between headquarters and subsidiarymanagers in the host country (with a respective mean ranking of 2.58 and 2.80).
Measuring Transplantation
We use two indicators to proxy for the transplantation of the business model fromparent rms to foreign aliates. The rst proxy is a dummy variable transplantationvia organization which indicates whether or not the organization of the parent rm isfully transplanted to the subsidiary. It takes a value of one if each individual corporatedecision has the same hierarchical rank or if one of the decisions diers in hierarchicalrank between parent and subsidiary rms.
Table 3.15 in Appendix 3.A.2 looks at the similarity in the hierarchical levels ofcorporate decisions in parent and subsidiary rms. The hierarchical level ranges be-tween one (centralized) and ve (decentralized) in subsidiaries and parent rms foreach of the corporate decisions individually. When parent and subsidiaries allocatean individual decision at the same hierarchical level, we consider the decision to befully transplanted to the subsidiary and the similarity index in Panel A becomes zero,otherwise it takes values in the interval (-4,4). We obtain this measure by subtractingthe hierarchical level of the subsidiary rm from that of the parent rm.
Panel A gives a quantitative measure of transplantation by providing the percent-ages of subsidiaries where a particular decision is taken at the same hierarchical levelas in parent rms (= 0) and at dierent hierarchical levels ( 6= 0). It shows that themost centralized and the most decentralized corporate decisions tend to be transplantedmost often to foreign aliates (compare Tables 3.14 and 3.15 in Appendix 3.A.2). In 78percent, 70 percent, and 64 percent of the aliates the decision on acquisitions, hiringa secretary, and hiring two new workers, respectively, are taken at the same hierarchicallevel in foreign aliates as in parent rms. The least often transplanted decisions tendto be in the middle of the corporate ladder such as the decision on nances and R&D.
Do Multinationals Transplant their Business Model? 86
Only in about half of the aliates are these two decisions at the same hierarchical levelin subsidiaries as in parent rms.
Panel B gives a qualitative measure of transplantation by listing in addition whichcorporate decisions in the subsidiary are more (> 0) or less decentralized (< 0) thanin the parent rm. As can be seen from Panel B, when subsidiaries deviate in theallocation of decision power from their parent rms they tend to decentralize more thantheir parent rms. One exception is the decision on R&D which is more decentralizedin parent rms than in subsidiary rms. Of the 49 percent of foreign aliates whichdier in their allocation of decision power over R&D from their parent rms, 30 percentof subsidiaries are more centralized compared with parent rms (< 0) and 19 percentare more decentralized (> 0).
Finally, Panel C reports the degree of transplantation by listing the degree to whichthe decisions in foreign aliates deviate from their parent rms. When aliates dierin their decision-making from their parent rms they do not choose a radical departurefrom their parent rms. Mostly, they tend to decentralize or to centralize by one ortwo hierarchical levels more compared with their parent rms.
As a second proxy for the transplantation of parent rms' business model we use adummy variable transplantation via CEO. It takes a value of one if at least one manageris sent from the parent rm to the subsidiary in the host country. The idea here is thatparent rms use their own managers to implement the corporation's business culturein the subsidiary abroad. The dummy is constructed from the survey question "Howmany of your managers from the parent rm are sent to the subsidiary rm?" In morethan 40 percent of foreign aliates the parent rm has sent at least one manager torun the subsidiary and to transfer the organizational knowledge. This high frequencyof transplantation via CEO suggests that the two proxies for the transplantation of thebusiness model are complements rather than substitutes. We indeed nd that the twomeasures are weakly positively correlated (see Table 3.3).
Other Organizational Information
Our sample provides additional information on the organizational structure of themultinational corporation. We construct dummy variables to distinguish four dierentcategories of the parent rms' organization: when the parent rm is a family rm
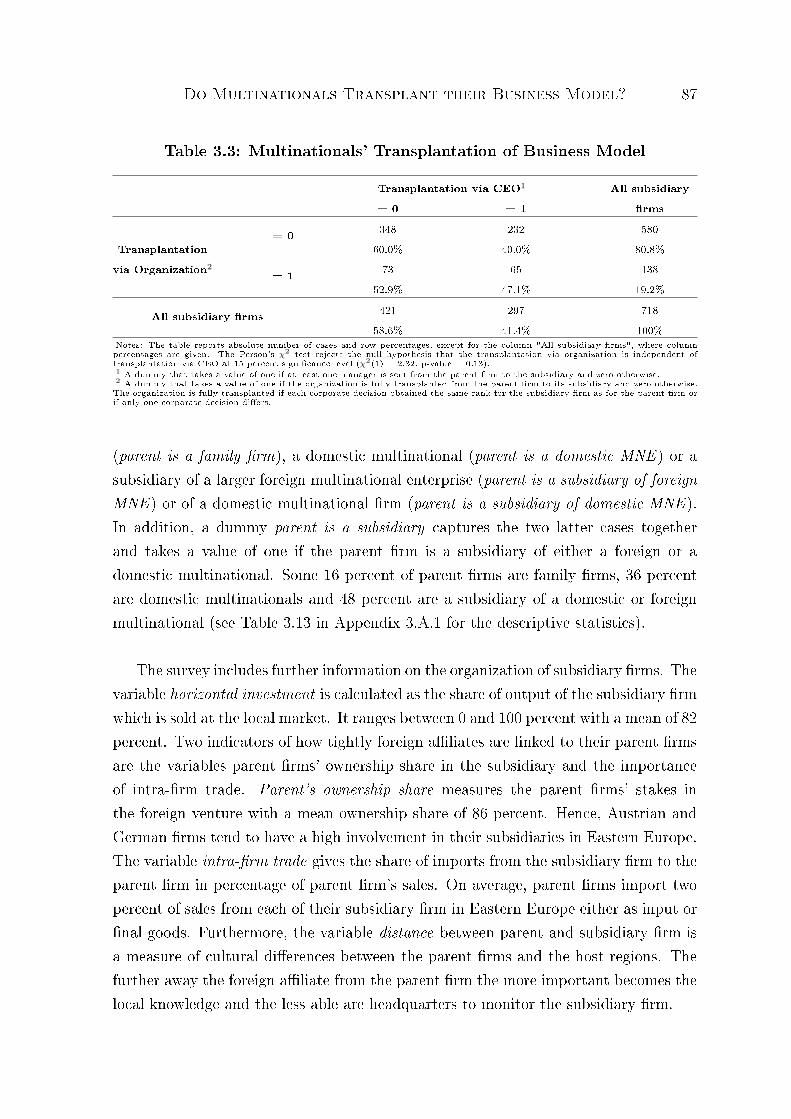
Do Multinationals Transplant their Business Model? 87
Table 3.3: Multinationals' Transplantation of Business Model
Transplantation via CEO1 All subsidiary= 0 = 1 rms
= 0 348 232 580Transplantation 60.0% 40.0% 80.8%via Organization2
= 1 73 65 13852.9% 47.1% 19.2%
All subsidiary rms 421 297 71858.6% 41.4% 100%
Notes: The table reports absolute number of cases and row percentages, except for the column "All subsidiary rms", where columnpercentages are given. The Person's χ2 test rejects the null hypothesis that the transplantation via organization is independent oftransplantation via CEO at 15 percent signicance level (χ2(1) = 2.32, p-value = 0.13).1 A dummy that takes a value of one if at least one manager is sent from the parent rm to the subsidiary and zero otherwise.2 A dummy that takes a value of one if the organization is fully transplanted from the parent rm to its subsidiary and zero otherwise.The organization is fully transplanted if each corporate decision obtained the same rank for the subsidiary rm as for the parent rm orif only one corporate decision diers.
(parent is a family rm), a domestic multinational (parent is a domestic MNE ) or asubsidiary of a larger foreign multinational enterprise (parent is a subsidiary of foreignMNE ) or of a domestic multinational rm (parent is a subsidiary of domestic MNE ).In addition, a dummy parent is a subsidiary captures the two latter cases togetherand takes a value of one if the parent rm is a subsidiary of either a foreign or adomestic multinational. Some 16 percent of parent rms are family rms, 36 percentare domestic multinationals and 48 percent are a subsidiary of a domestic or foreignmultinational (see Table 3.13 in Appendix 3.A.1 for the descriptive statistics).
The survey includes further information on the organization of subsidiary rms. Thevariable horizontal investment is calculated as the share of output of the subsidiary rmwhich is sold at the local market. It ranges between 0 and 100 percent with a mean of 82percent. Two indicators of how tightly foreign aliates are linked to their parent rmsare the variables parent rms' ownership share in the subsidiary and the importanceof intra-rm trade. Parent's ownership share measures the parent rms' stakes inthe foreign venture with a mean ownership share of 86 percent. Hence, Austrian andGerman rms tend to have a high involvement in their subsidiaries in Eastern Europe.The variable intra-rm trade gives the share of imports from the subsidiary rm to theparent rm in percentage of parent rm's sales. On average, parent rms import twopercent of sales from each of their subsidiary rm in Eastern Europe either as input ornal goods. Furthermore, the variable distance between parent and subsidiary rm isa measure of cultural dierences between the parent rms and the host regions. Thefurther away the foreign aliate from the parent rm the more important becomes thelocal knowledge and the less able are headquarters to monitor the subsidiary rm.
Do Multinationals Transplant their Business Model? 88
Finally, we have information on how innovative the technology is that the parentrm transfers to the subsidiary rm. The innovativeness of the technology is capturedby a dummy technology is innovative which takes a value of one if the technology isnew, a dummy technology is established with value of one if the technology is relativelyestablished and a dummy technology is outdated refers to a fully established or evenoutdated technology. The size of the multinational corporation is measured by thenumber of employees as the size of parent rm and the size of subsidiary rm. Anothermeasure of size is the total number of aliates in Eastern Europe which is recordedfor each parent rm, though we put nine and more aliates into one category to avoidoutliers.
3.2.2 Measuring Competition and Trade
We use several data sources to measure product market competition and exposureto international trade. First we obtain from our survey data of 660 Austrian andGerman multinationals with their 2200 foreign aliates two subjective measures ofcompetition as perceived by parent and subsidiary rms. They are dummy variablesindicating for each parent or subsidiary rm whether the rm faces many domesticcompetitors and many world competitors rather than few competitors, respectively.Second, we use the AMADEUS database from Bureau van Dijk (2005) to calculatethe Lerner index of competition based on a large number of rms in the two homecountries of the headquarters of multinational rms and in all host countries of theiraliates at the three-digit ISIC industry level. The Lerner index is dened as (1- average prots/sales), where the average is taken, rst, across all rms availablein a three-digit industry in a specic country and, second, over the years 1996 to2000. Finally, we use trade and tari data from the WITS UN COMTRADE andTRAINS databases (World Bank, 2009) as well as data on domestic production fromthe INDSTAT 4 (UNIDO, 2008) and STAN (OECD, 2009) databases to proxy for theexposure to international trade of the sector of parent and subsidiary rms. Fromthese types of data, we calculate the import share (dened as total imports divided bydomestic production), the export share (dened as total exports divided by domesticproduction), and the average eective tari rates on imports. These variables arecalculated for each country at the three-digit industry level. If data at the three-digitindustry level are missing, the two-digit level is used.
Do Multinationals Transplant their Business Model? 89
3.2.3 Social Capital in Host Countries
We consider additional characteristics of the subsidiaries' market environment. Inparticular, the variable contract enforcement reects the perception by parent rmsof ten possible risk factors that the subsidiary faces in host countries. The variable iscalculated as the mean of ranking between one and ve with one as a very importantand ve as an unimportant risk factor. The risk factors include the risk of prottransfer, exchange rate volatility, expropriation, changes in taxes or taris, propertyrights, macro-economic instability, political turnaround, corruption, crime and maa,and banking sector collapse.
Further characteristics of the market environment of host countries are captured bythe variables trust and hierarchical religion. Trust measures the proportion of peoplewho answer "Most people can be trusted" to the question: "Generally speaking, wouldyou say that most people can be trusted, or that you can't be too careful in dealing withpeople?" Hierarchical religion captures the proportion of the population belonging toa "hierarchical religion" such as Roman and Greek Catholic, Orthodox, Gregorian andArmenian Apostolic Church, or Islam. Both sets of data come from the World ValueSurvey undertaken by the WVS Organization (2009).
3.3 Empirical Specication and Results
We are interested in two dierent, though inter-linked questions: What favors decen-tralization of the subsidiary rm? What determines the transplantation of the businessmodel from the parent rm to the subsidiary rm? We start with the rst question.
3.3.1 What Favors Decentralization in Foreign Aliates ofMultinationals?
The Organization of the Multinational Corporation
We rst look in Table 3.4 at the baseline model which examines how the organization ofthe multinational corporation inuences the level of decentralization of foreign aliates
Do Multinationals Transplant their Business Model? 90
as measured by decentralization of subsidiary rm. We start with the organization ofparent rms. As can be seen from Table 3.4, subsidiary rms are more decentralizedwhen their parent rms are more decentralized, when parent rms themselves are asubsidiary of a domestic multinational (with parent is a family rm as the omittedcategory) and when parent rms have more aliates in other countries, though the ef-fect is nonlinear. Subsidiary rms will, however, be more centralized when their parentrms are larger and located in Germany and when they are themselves a subsidiary ofa foreign multinational. The signicant and positive coecient of decentralization ofparent of 0.42 suggests that when parent rms become more decentralized by one rank(a 25 percent increase in the possible range of the level of decentralization) the level ofdecentralization of subsidiary rms increases by 10.5 percent. We obtain this numberby multiplying 1 (an increase of one rank) with the coecient of 0.42 resulting in anincrease of the level of decentralization in the subsidiary of 0.42, which is 10.5 percentof the possible range of levels of decentralization of subsidiaries. Hence, the level ofdecentralization of parent rms is an economically important variable determining howdecentralized the subsidiary is.
The organization of subsidiary rms also matters for the level of decentralization.Subsidiaries tend to be more decentralized when they are a horizontal foreign invest-ment in which they sell mostly at the local market, when they are larger and furtheraway from headquarters. Subsidiaries are, however, more centralized when they aremore tightly linked to their parent rms. This is the case when headquarters has alarger ownership stake in subsidiaries and when the subsidiary is part of a global supplychain (measured by the volume of intra-rm trade) when it primarily provides inputsand nal goods to headquarters.
All estimated coecients are mostly signicant at conventional levels and robustto the inclusion of host country and industry xed eects. The inclusion of industryxed eects substantially contributes to the explanatory power of the regression incolumns (3) and (4) as the R2 increases from 0.28 to 0.46. The inclusion of hostcountry xed eects appears less important (column (2)). We include both types ofxed eects in the following analysis. The organizational variables together accountfor about 50 percent of the variation in the level of decentralization of foreign aliates(column (9)) which leaves room for other variables to play a role.

Do Multinationals Transplant their Business Model? 91Ta
ble3.4:
Levelo
fDecentralizationin
Subsidiary
Firm
sThe
Basic
Mod
el
Dep
ende
ntVa
riable
Decentralizationof
Subsidiary
Firm
1
(1)
(2)
(3)
(4)
(5)
(6)
(7)
(8)
(9)
Decentralizationof
parent
rm
10.42
***
0.40
***
0.43
***
0.42
***
0.43
***
0.42
***
0.42
***
0.41
***
0.41
***
(0.00)
(0.00)
(0.00)
(0.00)
(0.00)
(0.00)
(0.00)
(0.00)
(0.00)
Parent
islocatedin
German
y-0.11*
**-0.12*
**-0.19*
**-0.19*
**-0.17*
**-0.20*
**-0.23*
**-0.24*
**-0.29*
**(0.00)
(0.00)
(0.00)
(0.00)
(0.00)
(0.00)
(0.00)
(0.00)
(0.00)
Parent
isasubsidiary
offoreignMNE2
-0.049
-0.059
-0.12*
-0.12*
-0.16*
*-0.12*
-0.13*
*-0.12*
-0.13*
*(0.37)
(0.29)
(0.07)
(0.06)
(0.02)
(0.06)
(0.05)
(0.06)
(0.04)
Parent
isasubsidiary
ofdo
mestic
MNE2
0.10
**0.09
0*0.13
**0.13
**0.04
30.13
**0.12
**0.14
***
0.14
***
(0.04)
(0.07)
(0.01)
(0.01)
(0.42)
(0.01)
(0.02)
(0.01)
(0.01)
Parent
isado
mestic
MNE2
-0.042
-0.046
-0.020
-0.008
9-0.036
-0.014
-0.019
-0.031
-0.045
(0.41)
(0.37)
(0.73)
(0.87)
(0.53)
(0.80)
(0.74)
(0.58)
(0.43)
Log(Sizeof
parent
rm)
-0.042
***
-0.040
***
-0.039
***
-0.039
***
-0.046
***
-0.035
***
-0.040
***
-0.029
**-0.027
**(0.00)
(0.00)
(0.00)
(0.00)
(0.00)
(0.00)
(0.00)
(0.02)
(0.03)
Log(Sizeof
subsidiary
rm)
0.02
3*0.03
3**
0.04
5***
0.05
9***
0.05
0***
0.05
6***
0.05
9***
0.06
3***
0.06
0***
(0.06)
(0.02)
(0.00)
(0.00)
(0.00)
(0.00)
(0.00)
(0.00)
(0.00)
Num
berof
alia
tes
0.11
***
0.11
***
0.09
8**
0.09
5**
0.11
**0.09
3**
0.09
9**
0.08
3*0.08
8*(0.00)
(0.01)
(0.03)
(0.04)
(0.02)
(0.04)
(0.03)
(0.07)
(0.06)
(Num
berof
alia
tes)
2-0.009
3***
-0.009
5***
-0.009
0**
-0.009
1**
-0.011
***
-0.008
8**
-0.009
4**
-0.008
2**
-0.008
4**
(0.00)
(0.00)
(0.02)
(0.02)
(0.01)
(0.02)
(0.02)
(0.04)
(0.03)
Intra-rm
trad
e-0.21
(0.43)
Parent's
owne
rshipshare
-0.23*
**-0.18*
*(0.00)
(0.03)
Log(D
istan
ce)
0.06
8*0.06
5*(0.06)
(0.08)
Horizon
talinv
estm
ent
0.27
***
0.25
***
(0.00)
(0.01)
Cou
ntry
dummies
NO
YES
NO
YES
YES
YES
YES
YES
YES
Indu
stry
dummies(3d)
NO
NO
YES
YES
YES
YES
YES
YES
YES
Observatio
ns11
5711
5711
5711
5710
7811
5411
5711
1111
08Adjusted
R2
0.28
0.28
0.46
0.47
0.50
0.47
0.47
0.49
0.49
*sign
icant
at10
%,*
*sign
icant
at5%
,***
sign
icant
at1%
Notes:Coecients
obtained
byOLS
withrobu
ststan
dard
errors.P-value
srepo
rted
inpa
renthe
ses.
SeeTa
ble3.12
inApp
endix3.A.1
forthede
nitionof
variab
les.
1Meanof
rank
ingbe
tweenon
e(centralized
)an
dv
e(decentralized
)of
severalc
orpo
rate
decision
sde
pend
ingon
whe
ther
thehe
adqu
arters
ofthepa
rent
rm
(centralized
)or
theCEO
(decentralized
)takes
thede
cision
.The
CEO
isthesubsidiary
man
ager
fordecentralizationof
subsidiary
rm
orthedivision
alman
ager
fordecentralizationof
parent
rm
(see
Table3.12
inApp
endix3.A.1
formorede
tails).
Foralisting
ofcorporatede
cision
sseeTa
ble3.14
inApp
endix3.A.2.
2Parentis
afamily
rm
istheom
ittedcatego
ryof
parent
rm's
organization
.
Do Multinationals Transplant their Business Model? 92
Market Competition and International Trade
Next, we turn to the inuence of the market environment in host countries on theability of foreign aliates to decentralize. We start with the role of competition andinternational trade in Table 3.5. In their theory of decentralization Marin and Verdier(2004, 2007, 2008b) suggest that the level of competition and international trade needsto reach a critical level before rms start to decentralize. Firms trade o the prot gainfrom having control against the prot loss from losing the initiative of middle managers.When competition becomes suciently strong the latter eect on prots dominates andrms decentralize to empower middle managers. In contrast to the previous empiricalliterature on the decentralization of national rms (Marin and Verdier, 2007; Marin,2008; Guadalupe and Wulf, 2008; Bloom, Sadun, and van Reenen, 2009) we nd thatforeign aliates of multinational corporations tend to centralize in response to morecompetition in host countries. Column (1) shows that the level of decentralization ofsubsidiaries declines with many domestic competitors rather than few competitors (theomitted category). When subsidiaries face many domestic competitors rather than fewcompetitors they reduce the level of decentralization by a rank of 0.11 which is 2.75percent.
One problem with the subjective rm level measure of competition is that it maysuer from reverse causality. More decentralized rms may face less tough competi-tion (because they may empower their knowledge workers to bring new ideas to therm resulting in higher quality of products) rather than that rms facing less toughcompetition decentralize more, as we postulate here. To prevent the possibility of asingle rm inuencing the market outcome we introduce a more exogenous measureof competition at the sectoral level for the host country markets given by the Lernerindex. Column (2) reports the results and shows that the previous result in column(1) is robust to the measure of competition as subsidiaries tend to centralize with anincrease in the Lerner index. An increase in the Lerner index in the aliates' marketsby ten percent reduces the level of decentralization in aliates by a rank of 0.14 whichis 3.5 percent.
A possible explanation for the contrasting results with the empirical literature onnational rms is that subsidiaries in host countries of Eastern Europe (including theformer Soviet Union) may face less competition compared with rms in developedmarket economies and hence they do not reach the threshold level of competitionsuggested by Marin and Verdier (2007) and they stay centralized. A comparison of
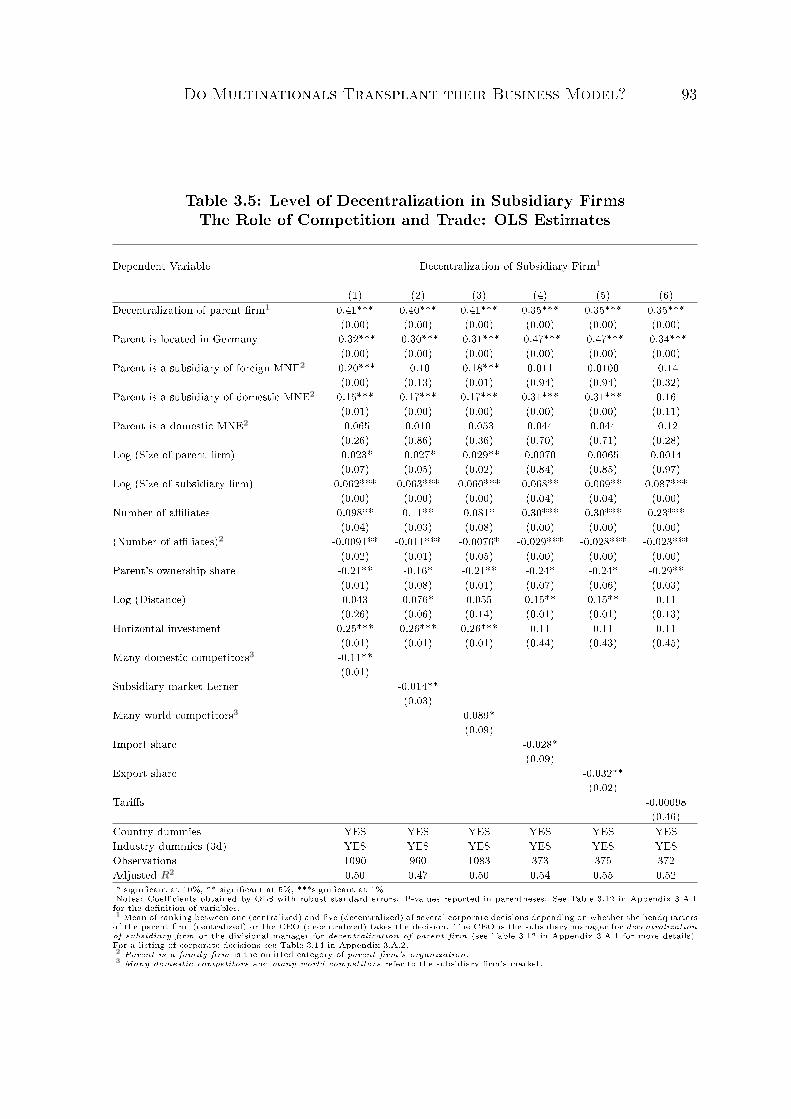
Do Multinationals Transplant their Business Model? 93
Table 3.5: Level of Decentralization in Subsidiary FirmsThe Role of Competition and Trade: OLS Estimates
Dependent Variable Decentralization of Subsidiary Firm1
(1) (2) (3) (4) (5) (6)Decentralization of parent rm1 0.41*** 0.40*** 0.41*** 0.35*** 0.35*** 0.35***
(0.00) (0.00) (0.00) (0.00) (0.00) (0.00)Parent is located in Germany -0.32*** -0.30*** -0.31*** -0.47*** -0.47*** -0.34***
(0.00) (0.00) (0.00) (0.00) (0.00) (0.00)Parent is a subsidiary of foreign MNE2 -0.20*** -0.10 -0.18*** 0.011 0.0100 -0.14
(0.00) (0.13) (0.01) (0.94) (0.94) (0.32)Parent is a subsidiary of domestic MNE2 0.15*** 0.17*** 0.17*** 0.31*** 0.31*** 0.16
(0.01) (0.00) (0.00) (0.00) (0.00) (0.11)Parent is a domestic MNE2 -0.065 0.010 -0.053 0.044 0.044 -0.12
(0.26) (0.86) (0.36) (0.70) (0.71) (0.28)Log (Size of parent rm) -0.023* -0.027* -0.029** 0.0070 0.0065 0.0014
(0.07) (0.05) (0.02) (0.84) (0.85) (0.97)Log (Size of subsidiary rm) 0.062*** 0.063*** 0.060*** 0.068** 0.069** 0.087***
(0.00) (0.00) (0.00) (0.04) (0.04) (0.00)Number of aliates 0.098** 0.11** 0.081* 0.30*** 0.30*** 0.23***
(0.04) (0.03) (0.08) (0.00) (0.00) (0.00)(Number of aliates)2 -0.0091** -0.011*** -0.0076* -0.029*** -0.028*** -0.023***
(0.02) (0.01) (0.05) (0.00) (0.00) (0.00)Parent's ownership share -0.21** -0.16* -0.21** -0.24* -0.24* -0.29**
(0.01) (0.08) (0.01) (0.07) (0.06) (0.03)Log (Distance) 0.043 0.076* 0.055 0.15** 0.15** 0.11
(0.26) (0.06) (0.14) (0.01) (0.01) (0.13)Horizontal investment 0.25*** 0.26*** 0.26*** 0.11 0.11 0.11
(0.01) (0.01) (0.01) (0.44) (0.43) (0.45)Many domestic competitors3 -0.11**
(0.01)Subsidiary market Lerner -0.014**
(0.03)Many world competitors3 0.089*
(0.09)Import share -0.028*
(0.09)Export share -0.032**
(0.02)Taris -0.00098
(0.46)Country dummies YES YES YES YES YES YESIndustry dummies (3d) YES YES YES YES YES YESObservations 1090 960 1083 373 375 372Adjusted R2 0.50 0.47 0.50 0.54 0.55 0.52* signicant at 10%, ** signicant at 5%, ***signicant at 1%Notes: Coecients obtained by OLS with robust standard errors. P-values reported in parentheses. See Table 3.12 in Appendix 3.A.1for the denition of variables.1 Mean of ranking between one (centralized) and ve (decentralized) of several corporate decisions depending on whether the headquartersof the parent rm (centralized) or the CEO (decentralized) takes the decision. The CEO is the subsidiary manager for decentralizationof subsidiary rm or the divisional manager for decentralization of parent rm (see Table 3.12 in Appendix 3.A.1 for more details).For a listing of corporate decisions see Table 3.14 in Appendix 3.A.2.2 Parent is a family rm is the omitted category of parent rm's organization.3 Many domestic competitors and many world competitors refer to the subsidiary rm's market.
Do Multinationals Transplant their Business Model? 94
the Lerner index and the rm level measure of domestic competition in Austria andGermany with those in host countries (see Tables 3.13, 3.16 and 3.17 in Appendix 3.A.3)reveals, however, that competition does not seem to be weaker in host countries. Itappears then that the results are driven by the fact that the rms in our data sample aremultinational rather than national rms. Austrian and German multinationals relocateactivities to Eastern Europe and the former Soviet Union in order to exploit the lowerlabor costs there. When competition intensies in host countries the level of costsmatters more for prots and hence multinationals centralize foreign aliates to avoidthe possibility that subsidiary managers choose activities which are more favorable tothem than to the prots of the rm. The prot gain from having control dominatesthe prot loss from losing the initiative of subsidiary managers when multinationalsrelocate activities to low-cost host countries to save labor costs.
Furthermore, we nd that subsidiaries centralize their organization in response toa greater exposure to international trade as measured by the import and export ratiosat the sectoral level given in columns (4) and (5). The eect of a change in the traderatios on the level of command in aliates is, however, almost negligible. An increasein the trade ratios in host countries by ten percentage points reduces the level ofdecentralization in foreign aliates by a rank of approximately 0.003 which is 0.08percent. The negligible eect of the trade ratios on the level of decentralization ofaliates is, however, not surprising. The average trade ratio of a sector hides the trueexposure to trade of individual rms. As suggested by recent literature on trade andrm heterogeneity (see Melitz, 2003; Bernard, Jensen, Redding, and Schott, 2007) thedistribution of individual rms' trade exposure in a sector is particularly skewed. Onlya small proportion of rms in a sector engage in trade activities (the extensive marginof trade) and produce a signicant share of their output for the world market (theintensive margin of trade). Therefore, an increase in the trade ratio of the sector doesnot expose the mass of subsidiary rms in the sector to the critical level of internationalcompetition as is suggested by Marin and Verdier (2007) and thus aliate rms do notsignicantly change the level of decentralization.
We introduce the rm level measure of trade many world competitors which is sup-posed to be better able to capture rms' true exposure to trade. Interestingly, we ndthat many world competitors is positively associated with the level of decentralizationof aliates (column (3)). When subsidiaries are faced with many foreign competitorsrather than a few, they increase the level of decentralization by a rank of 0.09 whichis 2.25 percent. We interpret the contrasting results of the two measures of trade as
Do Multinationals Transplant their Business Model? 95
suggesting that aliates with a large number of foreign competitors reach the criticallevel of international competition and thus decentralize, whereas an increase in thetrade ratio of the sector does not expose a sucient number of rms in the sector tothis critical level of trade and thus they remain centralized.4
Note that the estimated coecients of the organizational variables do not changewith the inclusion of the dierent measures of competition. The size of the estimatedcoecients does, however, change with the inclusion of the trade ratios. This is, nev-ertheless, a result of a substantial drop in the sample size owing to the unavailabilityof data on trade shares for some of the Eastern European countries.
Surprisingly, the eective tari rates on imports have no signicant eect on thelevel of decentralization of foreign aliates. A closer inspection of the data reveals,however, that Eastern European countries tend to have higher taris on imports inless productive sectors with lower prots. Hence, import taris and prots tend to benegatively (rather than positively) correlated.
Endogeneity
We proceed next to address the problem of endogeneity associated with using the levelof decentralization of parent rms as a determinant of the level of decentralization offoreign aliates. It could be argued that the level of decentralization of subsidiaryrms may inuence the level of command in parent rms rather than the other wayaround. Parent rms' involvement in foreign aliates may crowd out the CEO's abilityto monitor and control at headquarters. This trade-o between monitoring at home andabroad may then force parent rms to decentralize. In this case we would underestimatethe true eect of the parents' level of decentralization on subsidiary rms. We addressthe potential endogeneity problem in Table 3.6.
We introduce the toughness of competition at the headquarters' rms' marketsas an instrument for the level of decentralization of parent rms. The relevance ofthis instrument is motivated by the theory of decentralization of rms suggested by
4When we aggregate the rm level measure of trade many world competitors over all host countriesand compare it with the rm level measure of trade for the two home countries Austria and Germany,we indeed nd that host countries are on average much less exposed to international competition.About 30 percent of subsidiaries in host countries face many world competitors compared with 73percent of parent rms in Austria and Germany. See Table 3.13 in Appendix 3.A.1.
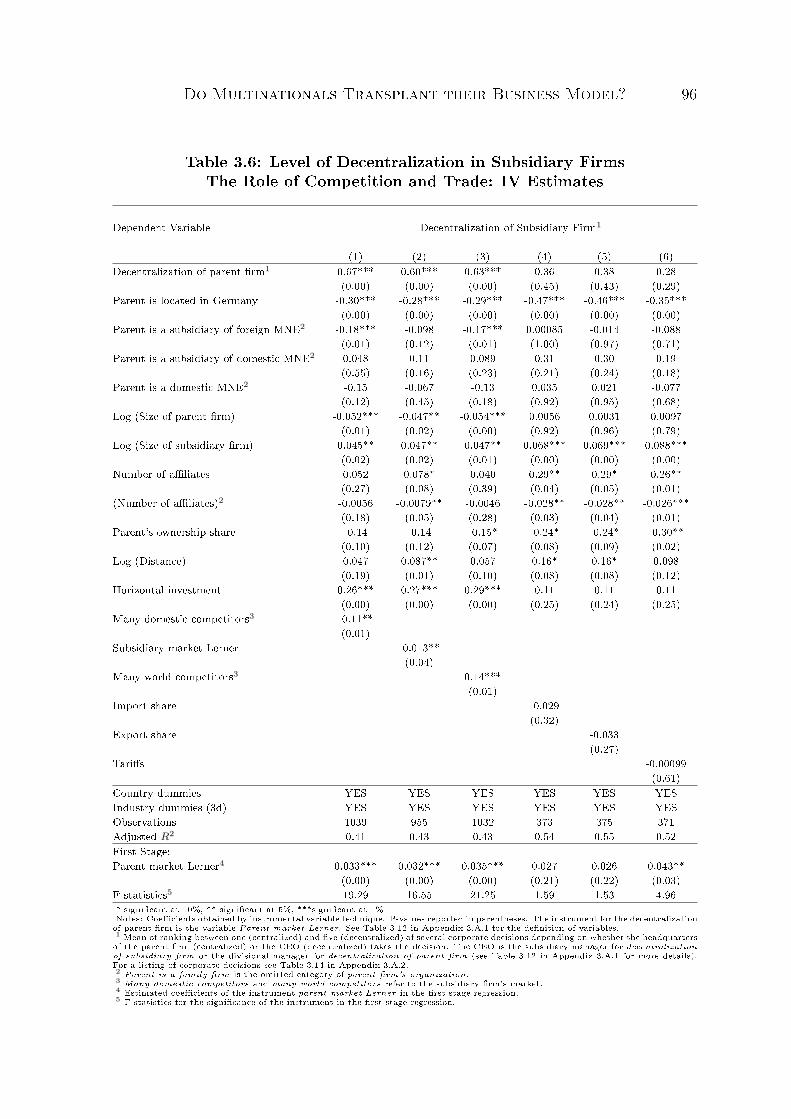
Do Multinationals Transplant their Business Model? 96
Table 3.6: Level of Decentralization in Subsidiary FirmsThe Role of Competition and Trade: IV Estimates
Dependent Variable Decentralization of Subsidiary Firm1
(1) (2) (3) (4) (5) (6)Decentralization of parent rm1 0.67*** 0.60*** 0.63*** 0.36 0.38 0.28
(0.00) (0.00) (0.00) (0.45) (0.43) (0.29)Parent is located in Germany -0.30*** -0.28*** -0.29*** -0.47*** -0.46*** -0.35***
(0.00) (0.00) (0.00) (0.00) (0.00) (0.00)Parent is a subsidiary of foreign MNE2 -0.18*** -0.098 -0.17*** 0.00085 -0.014 -0.088
(0.01) (0.12) (0.01) (1.00) (0.97) (0.71)Parent is a subsidiary of domestic MNE2 0.048 0.11 0.089 0.31 0.30 0.19
(0.55) (0.16) (0.23) (0.21) (0.24) (0.18)Parent is a domestic MNE2 -0.15 -0.067 -0.13 0.035 0.021 -0.077
(0.12) (0.45) (0.18) (0.92) (0.95) (0.68)Log (Size of parent rm) -0.052*** -0.047** -0.054*** 0.0056 0.0031 0.0097
(0.01) (0.02) (0.00) (0.92) (0.96) (0.79)Log (Size of subsidiary rm) 0.045** 0.047** 0.047** 0.068*** 0.069*** 0.088***
(0.02) (0.02) (0.01) (0.00) (0.00) (0.00)Number of aliates 0.052 0.078* 0.040 0.29** 0.29* 0.26**
(0.27) (0.08) (0.39) (0.04) (0.05) (0.01)(Number of aliates)2 -0.0056 -0.0079** -0.0046 -0.028** -0.028** -0.026***
(0.18) (0.05) (0.28) (0.03) (0.04) (0.01)Parent's ownership share -0.14 -0.14 -0.15* -0.24* -0.24* -0.30**
(0.10) (0.12) (0.07) (0.08) (0.09) (0.02)Log (Distance) 0.047 0.087** 0.057 0.16* 0.16* 0.098
(0.19) (0.01) (0.10) (0.08) (0.08) (0.12)Horizontal investment 0.26*** 0.27*** 0.29*** 0.11 0.11 0.11
(0.00) (0.00) (0.00) (0.25) (0.24) (0.25)Many domestic competitors3 -0.11**
(0.01)Subsidiary market Lerner -0.013**
(0.04)Many world competitors3 0.14***
(0.01)Import share -0.029
(0.32)Export share -0.033
(0.27)Taris -0.00099
(0.61)Country dummies YES YES YES YES YES YESIndustry dummies (3d) YES YES YES YES YES YESObservations 1039 955 1032 373 375 371Adjusted R2 0.41 0.43 0.43 0.54 0.55 0.52First Stage:Parent market Lerner4 0.033*** 0.032*** 0.035*** 0.027 0.026 0.043**
(0.00) (0.00) (0.00) (0.21) (0.22) (0.03)F-statistics5 19.29 16.55 21.25 1.59 1.53 4.96* signicant at 10%, ** signicant at 5%, ***signicant at 1%Notes: Coecients obtained by instrumental variable technique. P-values reported in parentheses. The instrument for the decentralizationof parent rm is the variable Parent market Lerner. See Table 3.12 in Appendix 3.A.1 for the denition of variables.1 Mean of ranking between one (centralized) and ve (decentralized) of several corporate decisions depending on whether the headquartersof the parent rm (centralized) or the CEO (decentralized) takes the decision. The CEO is the subsidiary manager for decentralizationof subsidiary rm or the divisional manager for decentralization of parent rm (see Table 3.12 in Appendix 3.A.1 for more details).For a listing of corporate decisions see Table 3.14 in Appendix 3.A.2.2 Parent is a family rm is the omitted category of parent rm's organization.3 Many domestic competitors and many world competitors refer to the subsidiary rm's market.4 Estimated coecients of the instrument parent market Lerner in the rst stage regression.5 F-statistics for the signicance of the instrument in the rst stage regression.
Do Multinationals Transplant their Business Model? 97
Marin and Verdier (2007). They argue that the level of decentralization of rms willbe governed by the toughness of competition in the market and they indeed nd thatthe intensity of competition has a statistically signicant eect on the level of decen-tralization of Austrian and German rms. We measure the instrument toughness ofcompetition in headquarters' rms' markets by the Lerner index and denote it as parentmarket Lerner. The instrument can be considered as exogenous to the decentralizationof subsidiary rms as it reects the competitive conditions in parent rms' marketsrather than in subsidiaries' rms' markets and the Lerner index for the headquarters'rms' markets is based on a large sample of rms at the three-digit ISIC level from theAMADEUS data. Therefore, we can safely exclude feedback eects from the level ofdecentralization of subsidiaries on the intensity of competition in parent rms' markets.
In Table 3.6 we indeed nd that the level of competition in parent rms' marketsis a relevant instrument as more competition is estimated to signicantly increase thelevel of decentralization of parent rms in the rst stage regressions (columns (1) to(3)). Moreover, the estimated eect of the parent rms' decentralization on the level ofcommand in subsidiaries indeed turns out to be underestimated in the OLS regressionsas the estimated coecients increase now to over 0.6 compared with 0.4 before. Inthe IV regressions in columns (1) to (3) some of the other organizational variablesnow become insignicant or weakly signicant, whereas the rm level measure of trademany world competitors now has a much stronger eect on the level of decentralizationof subsidiaries. Turning to the results with the sectoral measures of trade in columns(4) to (6), we nd that the Lerner index of headquarters' rms' markets is only aweak instrument and the level of decentralization of parent rms as well as the traderatios becomes insignicant. We do not, however, have the same condence in theseregressions since the sample size drops to one-third and the sectoral trade ratios are lessable to capture rms' true exposure to trade. Still, the sign of the estimated coecientsremains the same as in the OLS regressions and thus the direction of the estimatedeects appears robust to the use of the alternative estimation technique.
Social Capital: Contract Enforcement, Trust, and Religion
Finally, we turn to other characteristics of the market environment which may havehelped foreign aliates to decentralize. Bloom, Sadun, and van Reenen (2009) havefound that social capital as proxied by trust and the rule of law are positively associatedwith the level of decentralization in 4000 rms in the US, Europe, and Asia. We expect
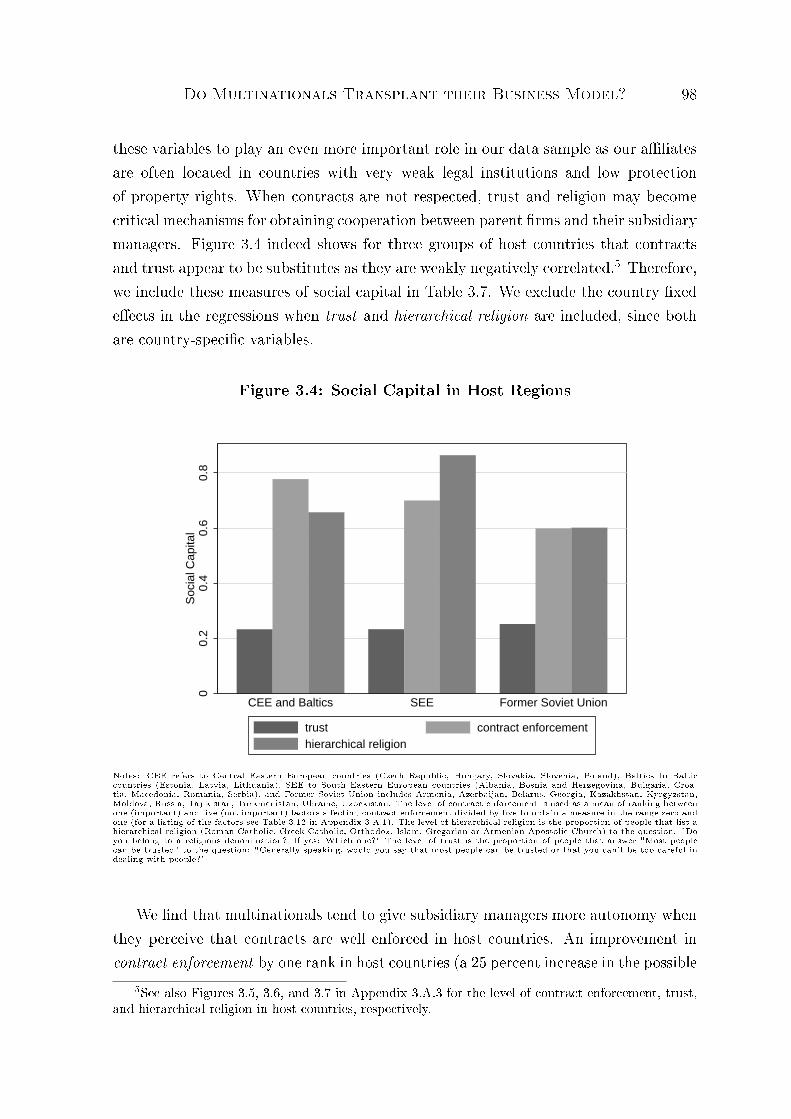
Do Multinationals Transplant their Business Model? 98
these variables to play an even more important role in our data sample as our aliatesare often located in countries with very weak legal institutions and low protectionof property rights. When contracts are not respected, trust and religion may becomecritical mechanisms for obtaining cooperation between parent rms and their subsidiarymanagers. Figure 3.4 indeed shows for three groups of host countries that contractsand trust appear to be substitutes as they are weakly negatively correlated.5 Therefore,we include these measures of social capital in Table 3.7. We exclude the country xedeects in the regressions when trust and hierarchical religion are included, since bothare country-specic variables.
Figure 3.4: Social Capital in Host Regions
00.
20.
60.
40.
8S
ocia
l Cap
ital
CEE and Baltics SEE Former Soviet Union
trust contract enforcementhierarchical religion
Notes: CEE refers to Central Eastern European countries (Czech Republic, Hungary, Slovakia, Slovenia, Poland), Baltics to Balticcountries (Estonia, Latvia, Lithuania), SEE to South Eastern European countries (Albania, Bosnia and Herzegovina, Bulgaria, Croa-tia, Macedonia, Romania, Serbia), and Former Soviet Union includes Armenia, Azerbaijan, Belarus, Georgia, Kazakhstan, Kyrgyzstan,Moldova, Russia, Tajikistan, Turkmenistan, Ukraine, Uzbekistan. The level of contract enforcement is used as a mean of ranking betweenone (important) and ve (not important) factors aecting contract enforcement divided by ve to obtain a measure in the range zero andone (for a listing of the factors see Table 3.12 in Appendix 3.A.1). The level of hierarchical religion is the proportion of people that list ahierarchical religion (Roman Catholic, Greek Catholic, Orthodox, Islam, Gregorian or Armenian Apostolic Church) to the question: "Doyou belong to a religious denomination? If yes: Which one?" The level of trust is the proportion of people that answer "Most peoplecan be trusted" to the question: "Generally speaking, would you say that most people can be trusted or that you can't be too careful indealing with people?"
We nd that multinationals tend to give subsidiary managers more autonomy whenthey perceive that contracts are well enforced in host countries. An improvement incontract enforcement by one rank in host countries (a 25 percent increase in the possible
5See also Figures 3.5, 3.6, and 3.7 in Appendix 3.A.3 for the level of contract enforcement, trust,and hierarchical religion in host countries, respectively.
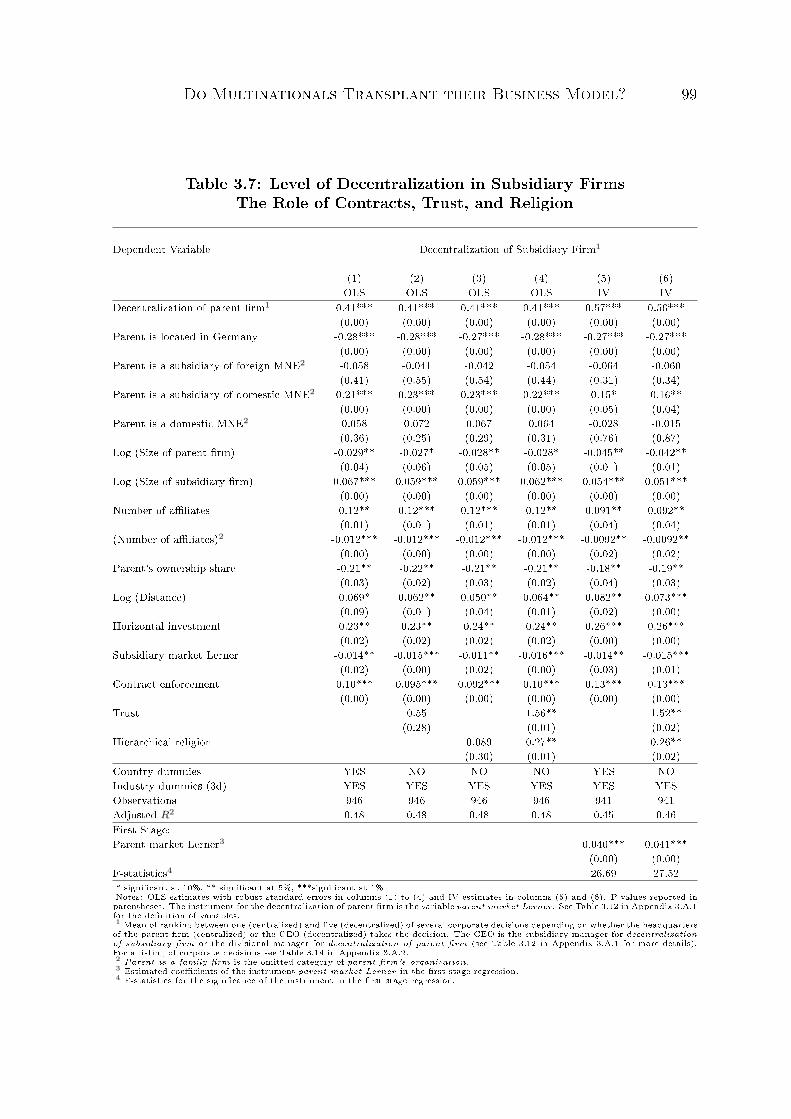
Do Multinationals Transplant their Business Model? 99
Table 3.7: Level of Decentralization in Subsidiary FirmsThe Role of Contracts, Trust, and Religion
Dependent Variable Decentralization of Subsidiary Firm1
(1) (2) (3) (4) (5) (6)OLS OLS OLS OLS IV IV
Decentralization of parent rm1 0.41*** 0.41*** 0.41*** 0.41*** 0.57*** 0.56***(0.00) (0.00) (0.00) (0.00) (0.00) (0.00)
Parent is located in Germany -0.28*** -0.28*** -0.27*** -0.28*** -0.27*** -0.27***(0.00) (0.00) (0.00) (0.00) (0.00) (0.00)
Parent is a subsidiary of foreign MNE2 -0.058 -0.041 -0.042 -0.054 -0.064 -0.060(0.41) (0.55) (0.54) (0.44) (0.31) (0.34)
Parent is a subsidiary of domestic MNE2 0.21*** 0.23*** 0.23*** 0.22*** 0.15* 0.16**(0.00) (0.00) (0.00) (0.00) (0.05) (0.04)
Parent is a domestic MNE2 0.058 0.072 0.067 0.064 -0.028 -0.015(0.36) (0.25) (0.29) (0.31) (0.76) (0.87)
Log (Size of parent rm) -0.029** -0.027* -0.028** -0.028* -0.045** -0.042**(0.04) (0.06) (0.05) (0.05) (0.01) (0.01)
Log (Size of subsidiary rm) 0.067*** 0.059*** 0.059*** 0.062*** 0.054*** 0.051***(0.00) (0.00) (0.00) (0.00) (0.00) (0.00)
Number of aliates 0.12** 0.12*** 0.12*** 0.12** 0.091** 0.092**(0.01) (0.01) (0.01) (0.01) (0.04) (0.04)
(Number of aliates)2 -0.012*** -0.012*** -0.012*** -0.012*** -0.0092** -0.0092**(0.00) (0.00) (0.00) (0.00) (0.02) (0.02)
Parent's ownership share -0.21** -0.22** -0.21** -0.21** -0.18** -0.19**(0.03) (0.02) (0.03) (0.02) (0.04) (0.03)
Log (Distance) 0.069* 0.062** 0.050** 0.064** 0.082** 0.073***(0.09) (0.01) (0.04) (0.01) (0.02) (0.00)
Horizontal investment 0.23** 0.23** 0.24** 0.24** 0.26*** 0.26***(0.02) (0.02) (0.02) (0.02) (0.00) (0.00)
Subsidiary market Lerner -0.014** -0.015*** -0.011** -0.016*** -0.014** -0.015***(0.02) (0.00) (0.02) (0.00) (0.03) (0.01)
Contract enforcement 0.10*** 0.095*** 0.092*** 0.10*** 0.13*** 0.13***(0.00) (0.00) (0.00) (0.00) (0.00) (0.00)
Trust 0.55 1.56** 1.52**(0.28) (0.01) (0.02)
Hierarchical religion 0.089 0.27** 0.26**(0.30) (0.01) (0.02)
Country dummies YES NO NO NO YES NOIndustry dummies (3d) YES YES YES YES YES YESObservations 946 946 946 946 941 941Adjusted R2 0.48 0.48 0.48 0.48 0.45 0.46First Stage:Parent market Lerner3 0.040*** 0.041***
(0.00) (0.00)F-statistics4 26.69 27.52* signicant at 10%, ** signicant at 5%, ***signicant at 1%Notes: OLS estimates with robust standard errors in columns (1) to (4) and IV estimates in columns (5) and (6). P-values reported inparentheses. The instrument for the decentralization of parent rm is the variable parent market Lerner. See Table 3.12 in Appendix 3.A.1for the denition of variables.1 Mean of ranking between one (centralized) and ve (decentralized) of several corporate decisions depending on whether the headquartersof the parent rm (centralized) or the CEO (decentralized) takes the decision. The CEO is the subsidiary manager for decentralizationof subsidiary rm or the divisional manager for decentralization of parent rm (see Table 3.12 in Appendix 3.A.1 for more details).For a listing of corporate decisions see Table 3.14 in Appendix 3.A.2.2 Parent is a family rm is the omitted category of parent rm's organization.3 Estimated coecients of the instrument parent market Lerner in the rst stage regression.4 F-statistics for the signicance of the instrument in the rst stage regression.
Do Multinationals Transplant their Business Model? 100
range between one and ve) induces aliates to decentralize by a rank of 0.13 whichis 3.25 percent. In other words, multinational parent rms in Austria and Germanyappear not to delegate responsibility in decision-making to their subsidiary managersin host countries with weak legal institutions, because they may fear that subsidiarymanagers will exploit the opportunity and misuse the rms' assets under their controlwhen the likelihood of punishment by the legal system is low. Similarly, we nd thattrust facilitates decentralization. A ten percentage point increase in the share of peoplewho trust others leads to an increase in the level of decentralization of 0.16 rankswhich is four percent. The estimated coecient of hierarchical religion contradicts thendings of Bloom, Sadun, and van Reenen (2009). We nd that a larger proportion ofthe population in a country belonging to a hierarchical religion (believing in authority)favors decentralization rather than centralization. One possible explanation is that non-hierarchical religions such as the Protestant Christian church are not very prevalentin Eastern Europe and the former Soviet Union. Therefore, the variable hierarchicalreligion may capture the total proportion of religious people in a country. In our sample,the correlation between these two variables is indeed 0.93. Note, however, that whenthe two variables are included separately in the estimation they cease to be signicant.
Lastly, we show in columns (5) and (6) that the estimated coecients of the vari-ables on social capital are robust, when we instrument for parent rms' decentralization.
3.3.2 When Does Transplantation Happen?
The previous section has shown that multinationals are often able to imprint the levelof decentralization on their foreign aliates. At the same time, however, Table 3.1shows that only 24 percent of foreign aliates use the same organization as theirparent rms. Why do multinationals transplant so infrequently? What determineswhether or not multinationals transplant their business model across countries? Doesthis depend on "home-made", "host-made" or "organization-made" factors? In otherwords, are German rms by being located in a larger more competitive domestic marketthan Austrian rms better able to export their business culture abroad? Or is it theother way around and the likelihood to transplant does not depend on the naturaladvantage of the home market of multinationals but rather on how favorable hostcountries' markets are toward foreign aliates with a dierent business model from that
Do Multinationals Transplant their Business Model? 101
of domestic rms?6 Or is the ability or willingness to transplant driven by the globalbusiness organization of the multinational corporation rather than the characteristicsof home and host countries' markets? We examine these questions in Tables 3.8 to3.11.
Transplantation via Organization
In Table 3.8 we estimate the probability of transplantation in a Probit model in whichthe dependent variable is a dummy variable transplantation via organization. Thedummy takes a value of one if each corporate decision has the same hierarchical rankin foreign aliates as in parent rms or if one corporate decision diers in rank. In thiscase the organization is fully transplanted, otherwise (when more than one corporatedecision diers in hierarchical rank) we consider the organization as not transplanted.7
In column (1) we estimate the baseline model including all variables determining theglobal business organization of the multinational corporation such as the level of decen-tralization of parent and subsidiary rms, parent is subsidiary, number of aliates, sizeof subsidiary, parent rms' ownership share in the foreign aliate and distance. Wend that multinationals are more likely to transplant their business model to foreignaliates in host countries when parent rms are more decentralized, the aliates arelarger and when multinationals have a larger number of aliates (although the eectis nonlinear). Multinationals are, however, less likely to transplant when the aliatesare more decentralized and further away, when the parent rm is itself a subsidiaryand when it has a larger stake in the subsidiary. The level of decentralization of theparent rm has an economically important eect on the likelihood to transplant. Whenthe level of decentralization increases by one rank (the parent rm becomes more de-centralized by 25 percent) then the probability to transplant the business model tothe foreign aliate increases by about 16 percentage points (for the partial eects ofTable 3.8 see Table 3.9).
One variable stands out by virtue of its importance in the likelihood to transplantvia organization, namely, the level of innovation of the technology transferred to foreign
6Bloom, Sadun, and van Reenen (2009) indeed nd that multinationals tend to operate with adierent business model by being more decentralized than national rms.
7As a robustness check we also use softer versions of full transplantation of organization with verysimilar results.
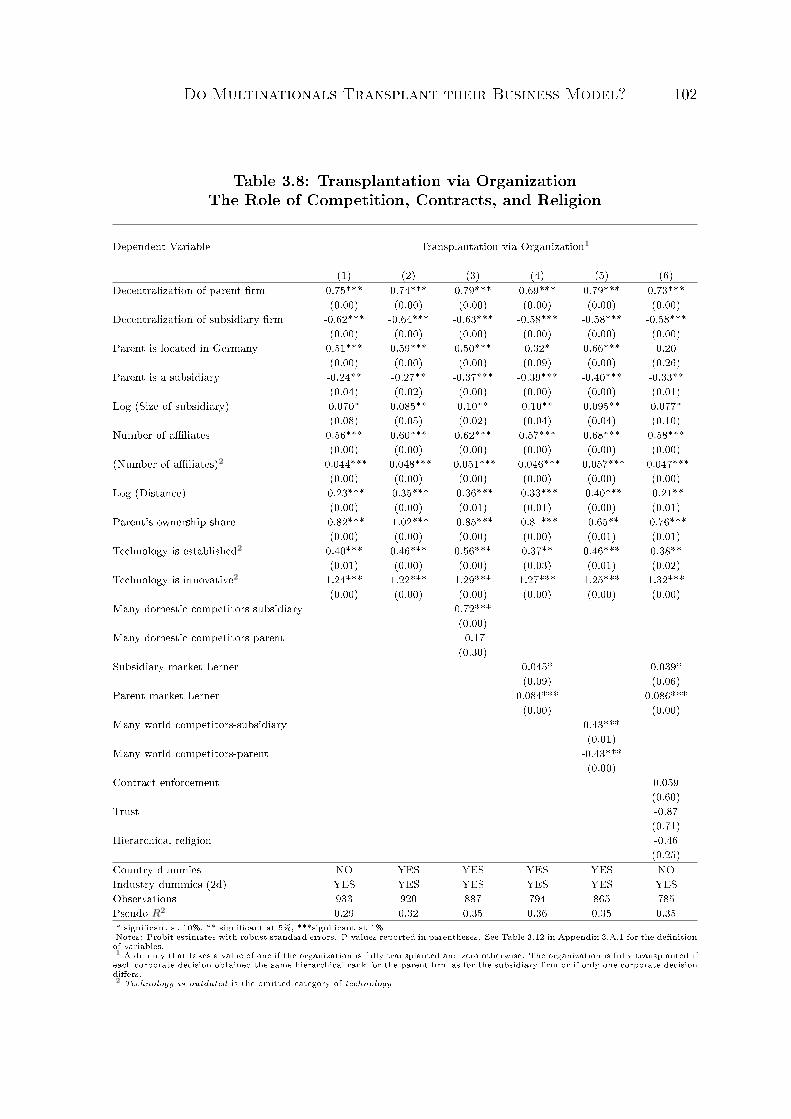
Do Multinationals Transplant their Business Model? 102
Table 3.8: Transplantation via OrganizationThe Role of Competition, Contracts, and Religion
Dependent Variable Transplantation via Organization1
(1) (2) (3) (4) (5) (6)Decentralization of parent rm 0.75*** 0.74*** 0.79*** 0.69*** 0.79*** 0.73***
(0.00) (0.00) (0.00) (0.00) (0.00) (0.00)Decentralization of subsidiary rm -0.62*** -0.64*** -0.63*** -0.58*** -0.58*** -0.58***
(0.00) (0.00) (0.00) (0.00) (0.00) (0.00)Parent is located in Germany 0.51*** 0.59*** 0.50*** 0.32* 0.66*** 0.20
(0.00) (0.00) (0.00) (0.09) (0.00) (0.26)Parent is a subsidiary -0.24** -0.27** -0.37*** -0.39*** -0.40*** -0.33**
(0.04) (0.02) (0.00) (0.00) (0.00) (0.01)Log (Size of subsidiary) 0.070* 0.085** 0.10** 0.10** 0.095** 0.077*
(0.08) (0.05) (0.02) (0.04) (0.04) (0.10)Number of aliates 0.56*** 0.60*** 0.62*** 0.57*** 0.68*** 0.58***
(0.00) (0.00) (0.00) (0.00) (0.00) (0.00)(Number of aliates)2 -0.044*** -0.048*** -0.051*** -0.046*** -0.057*** -0.047***
(0.00) (0.00) (0.00) (0.00) (0.00) (0.00)Log (Distance) -0.23*** -0.35*** -0.36*** -0.33*** -0.40*** -0.21**
(0.00) (0.00) (0.01) (0.01) (0.00) (0.01)Parent's ownership share -0.82*** -1.02*** -0.85*** -0.81*** -0.65** -0.76***
(0.00) (0.00) (0.00) (0.00) (0.01) (0.01)Technology is established2 0.40*** 0.46*** 0.56*** 0.37** 0.46*** 0.38**
(0.01) (0.00) (0.00) (0.03) (0.01) (0.02)Technology is innovative2 1.24*** 1.22*** 1.29*** 1.27*** 1.25*** 1.32***
(0.00) (0.00) (0.00) (0.00) (0.00) (0.00)Many domestic competitors-subsidiary 0.72***
(0.00)Many domestic competitors-parent -0.17
(0.30)Subsidiary market Lerner 0.045* 0.039*
(0.09) (0.06)Parent market Lerner 0.084*** 0.086***
(0.00) (0.00)Many world competitors-subsidiary 0.43***
(0.01)Many world competitors-parent -0.43***
(0.00)Contract enforcement 0.059
(0.60)Trust -0.87
(0.71)Hierarchical religion -0.46
(0.25)Country dummies NO YES YES YES YES NOIndustry dummies (2d) YES YES YES YES YES YESObservations 933 920 887 794 865 785Pseudo R2 0.29 0.32 0.35 0.36 0.35 0.35* signicant at 10%, ** signicant at 5%, ***signicant at 1%Notes: Probit estimates with robust standard errors. P-values reported in parentheses. See Table 3.12 in Appendix 3.A.1 for the denitionof variables.1 A dummy that takes a value of one if the organization is fully transplanted and zero otherwise. The organization is fully transplanted ifeach corporate decision obtained the same hierarchical rank for the parent rm as for the subsidiary rm or if only one corporate decisiondiers.2 Technology is outdated is the omitted category of technology.
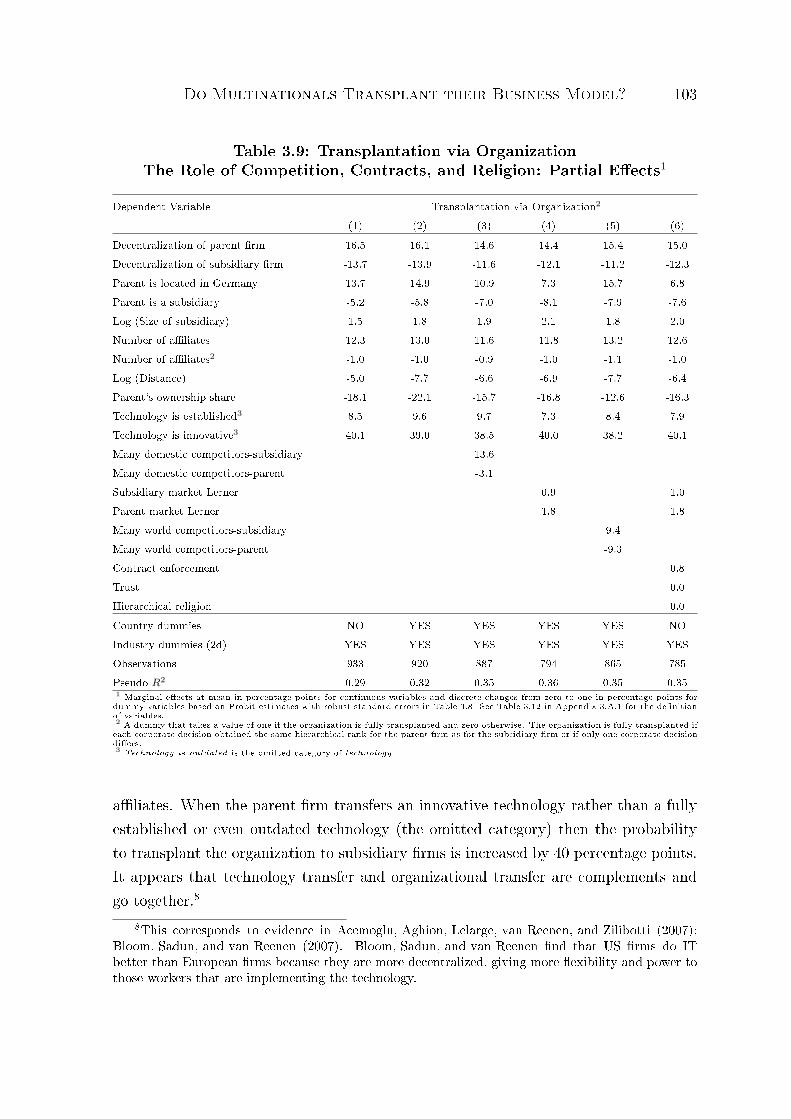
Do Multinationals Transplant their Business Model? 103
Table 3.9: Transplantation via OrganizationThe Role of Competition, Contracts, and Religion: Partial Eects1
Dependent Variable Transplantation via Organization2
(1) (2) (3) (4) (5) (6)Decentralization of parent rm 16.5 16.1 14.6 14.4 15.4 15.0Decentralization of subsidiary rm -13.7 -13.9 -11.6 -12.1 -11.2 -12.3Parent is located in Germany 13.7 14.9 10.9 7.3 15.7 6.8Parent is a subsidiary -5.2 -5.8 -7.0 -8.1 -7.9 -7.6Log (Size of subsidiary) 1.5 1.8 1.9 2.1 1.8 2.0Number of aliates 12.3 13.0 11.6 11.8 13.2 12.6Number of aliates2 -1.0 -1.0 -0.9 -1.0 -1.1 -1.0Log (Distance) -5.0 -7.7 -6.6 -6.9 -7.7 -6.4Parent's ownership share -18.1 -22.1 -15.7 -16.8 -12.6 -16.3Technology is established3 8.5 9.6 9.7 7.3 8.4 7.9Technology is innovative3 40.1 39.0 38.5 40.0 38.2 40.1Many domestic competitors-subsidiary 13.6Many domestic competitors-parent -3.1Subsidiary market Lerner 0.9 1.0Parent market Lerner 1.8 1.8Many world competitors-subsidiary 9.4Many world competitors-parent -9.3Contract enforcement 0.8Trust 0.0Hierarchical religion 0.0Country dummies NO YES YES YES YES NOIndustry dummies (2d) YES YES YES YES YES YESObservations 933 920 887 794 865 785Pseudo R2 0.29 0.32 0.35 0.36 0.35 0.351 Marginal eects at mean in percentage points for continuous variables and discrete changes from zero to one in percentage points fordummy variables based on Probit estimates with robust standard errors in Table 3.8. See Table 3.12 in Appendix 3.A.1 for the denitionof variables.2 A dummy that takes a value of one if the organization is fully transplanted and zero otherwise. The organization is fully transplanted ifeach corporate decision obtained the same hierarchical rank for the parent rm as for the subsidiary rm or if only one corporate decisiondiers.3 Technology is outdated is the omitted category of technology.
aliates. When the parent rm transfers an innovative technology rather than a fullyestablished or even outdated technology (the omitted category) then the probabilityto transplant the organization to subsidiary rms is increased by 40 percentage points.It appears that technology transfer and organizational transfer are complements andgo together.8
8This corresponds to evidence in Acemoglu, Aghion, Lelarge, van Reenen, and Zilibotti (2007);Bloom, Sadun, and van Reenen (2007). Bloom, Sadun, and van Reenen nd that US rms do ITbetter than European rms because they are more decentralized, giving more exibility and power tothose workers that are implementing the technology.
Do Multinationals Transplant their Business Model? 104
Taken together the "organization-made" factors appear to be most important forthe probability determining whether or not multinationals transplant their businessmodel to foreign aliates.
The positive and signicant coecient of the home country dummy parent is locatedin Germany rather than Austria does support the notion that "home-made" factors arealso important for the likelihood to transplant. Multinational rms located in Germanyrather than Austria are by some 15 percentage points more likely to transplant. Thiseect acts beyond and above the fact that German parent rms tend to be moredecentralized than Austrian parent rms (which is already captured by the positivecoecient of decentralization of parent in the regression). Another important "home-made" factor is the level of competition and the exposure to trade in the home marketswhere headquarters' rms are located. It appears that more domestic competition inthe parent rms' market increases the likelihood that transplantation takes place (asis suggested by parent market Lerner, but the rm level measure of competition manydomestic competitors in the parent market is not signicant at conventional levels). Anincrease of parent market Lerner by ten percentage points increases the probability totransplant by eighteen percentage points. This eect of competition on the probabilityto transplant is beyond and above the eect of decentralization of parent rms onthe probability to transplant. This result indeed suggests that Germany is the morefavorable home market for transplantation.9 Furthermore, we nd that when parentrms face many world competitors rather than a few they are less likely to transplantby nine percentage points.
We turn now to the inuence of "host-made" factors on the probability to trans-plant the organization to subsidiary rms in host countries. In column (2) of Table 3.8we include the host country dummies in the regression which increase the pseudo R2
from 0.29 to 0.32, suggesting that "host-made" factors do play a role in explainingthe probability to transplant. As in home countries, we expect the level of competi-tion and trade in host countries to be important for the ability of multinationals totransplant. We indeed nd this. The Lerner index and the rm level measure of do-mestic competition as well as world competition for the subsidiaries markets all indicatethat transplantation is more likely when competition is tougher and trade exposure isstronger in host countries. An increase in the subsidiary market Lerner by ten per-centage points increases the likelihood to transplant by nine percentage points and the
9Marin and Verdier (2007) show that more intense competition in the parents' markets has ledparent rms to decentralize their organization. This nding is also in line with our rst stage regressionresults in Table 3.6.
Do Multinationals Transplant their Business Model? 105
probability to transplant is fourteen and nine percentage points, respectively, largerwhen the subsidiary rm faces many rather than few domestic and foreign competitors(see columns (3) to (5) of Table 3.9).
Interestingly, contracts, trust, and hierarchical religion appear not to aect theprobability to transplant via organization (column (6)).
Transplantation via CEO
Alternatively to transplanting via organization, the multinational rm may aect thebusiness culture of the subsidiary rm by sending one or more managers from theparent rm to the host country to run the foreign aliate. This seems to be a commonpractice, since more than 40 percent of foreign aliates are run by CEOs of parentrms (see Table 3.1). We examine the probability of sending at least one manager tothe foreign aliate in Tables 3.10 and 3.11.
We run Probit regressions with the dependent variable transplantation via CEOwhich takes a value of one if at least one manager is sent from the parent rm to itssubsidiary rm. Parent rms are more likely to send their own managers to run thealiate rm when the parent and subsidiary rm is larger, when the parent rm islocated in Austria rather than Germany, when the subsidiary rm is centralized andhas little autonomy, when the multinational rm does not have too many aliates andwhen the technology transferred to the foreign aliate is innovative. Among thesedeterminants, being an Austrian multinational which transfers a new technology toa foreign aliate with little autonomy from the parent rm maximizes the chancesthat the multinational rm will send one or more CEOs to its foreign aliate (see Ta-ble 3.11). As sending a manager is more likely when the subsidiary has little autonomyfrom the parent rm, the two ways of transplanting appear to be complements whichreinforce each other in helping the parent rm to exert control over its subsidiary rm.In addition, it appears that Austrian multinationals are less likely to transplant viaorganization but rather imprint their business culture on their subsidiaries by sendingCEOs.
We now turn to the inuence of the market environment on the probability ofsending a CEO to the subsidiary given in columns (2) to (4) of Tables 3.10 and 3.11.
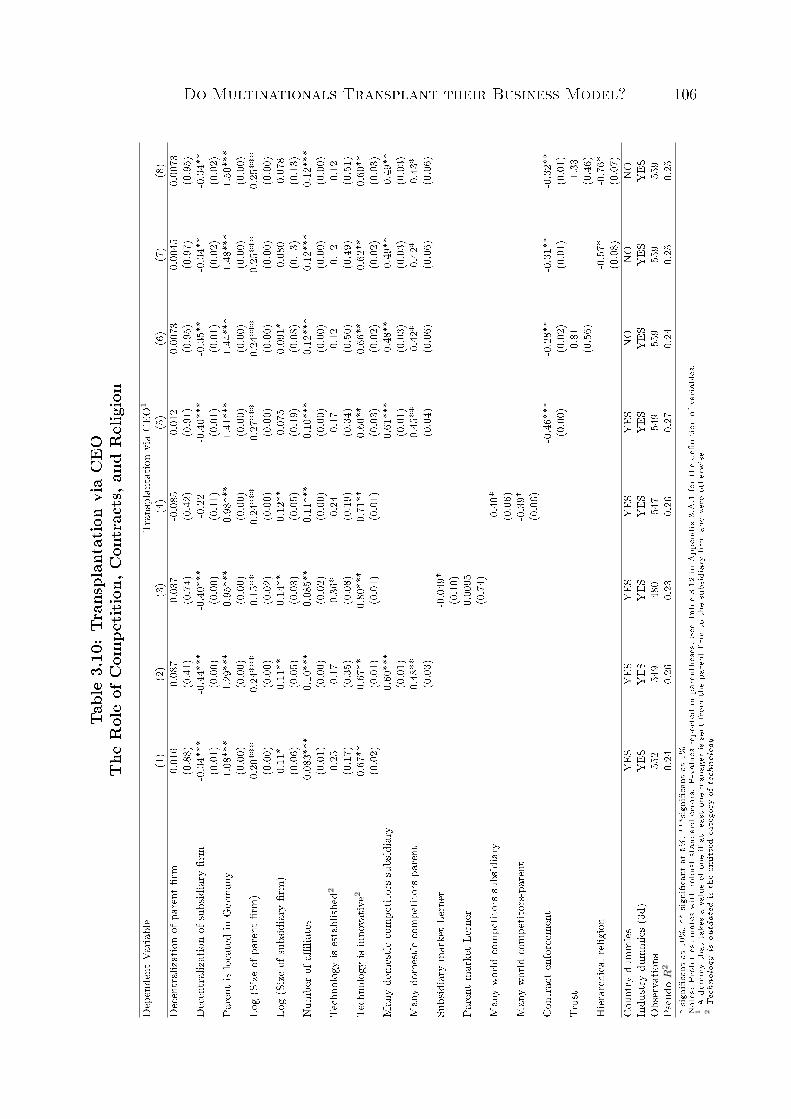
Do Multinationals Transplant their Business Model? 106Ta
ble3.10
:Tr
ansplantationviaCEO
The
Roleof
Com
petit
ion,
Con
tracts,a
ndReligion
Dep
ende
ntVa
riable
Tran
splantationviaCEO
1
(1)
(2)
(3)
(4)
(5)
(6)
(7)
(8)
Decentralizationof
parent
rm
0.01
60.08
70.03
7-0.085
0.01
20.00
730.00
450.00
73(0.88)
(0.41)
(0.74)
(0.42)
(0.91)
(0.95)
(0.97)
(0.95)
Decentralizationof
subsidiary
rm
-0.34*
**-0.44*
**-0.40*
**-0.22
-0.40*
**-0.35*
*-0.34*
*-0.34*
*(0.01)
(0.00)
(0.00)
(0.11)
(0.01)
(0.01)
(0.02)
(0.02)
Parent
islocatedin
German
y-1.08*
**-1.29*
**-0.95*
**-0.98*
**-1.41*
**-1.44*
**-1.48*
**-1.50*
**(0.00)
(0.00)
(0.00)
(0.00)
(0.00)
(0.00)
(0.00)
(0.00)
Log(Sizeof
parent
rm)
0.20
***
0.24
***
0.15
**0.24
***
0.27
***
0.24
***
0.25
***
0.25
***
(0.00)
(0.00)
(0.02)
(0.00)
(0.00)
(0.00)
(0.00)
(0.00)
Log(Sizeof
subsidiary
rm)
0.11
*0.11
**0.14
**0.12
**0.07
50.09
1*0.08
00.07
8(0.06)
(0.05)
(0.03)
(0.05)
(0.19)
(0.08)
(0.13)
(0.13)
Num
berof
alia
tes
-0.083
***
-0.10*
**-0.085
**-0.11*
**-0.10*
**-0.12*
**-0.12*
**-0.12*
**(0.01)
(0.00)
(0.02)
(0.00)
(0.00)
(0.00)
(0.00)
(0.00)
Techno
logy
isestablish
ed2
0.25
0.17
0.36
*0.24
0.17
0.12
0.12
0.12
(0.17)
(0.35)
(0.08)
(0.19)
(0.34)
(0.50)
(0.49)
(0.51)
Techno
logy
isinno
vativ
e20.67
**0.67
**0.80
***
0.71
**0.60
**0.66
**0.62
**0.60
**(0.02)
(0.01)
(0.01)
(0.01)
(0.03)
(0.02)
(0.02)
(0.03)
Man
ydo
mestic
compe
titors-subsidiary
-0.60*
**-0.61*
**-0.48*
*-0.49*
*-0.49*
*(0.01)
(0.01)
(0.03)
(0.03)
(0.03)
Man
ydo
mestic
compe
titors-pa
rent
0.48
**0.45
**0.42
*0.42
*0.43
*(0.03)
(0.04)
(0.06)
(0.06)
(0.06)
Subsidiary
marketLe
rner
-0.049
*(0.10)
Parent
marketLe
rner
0.00
95(0.74)
Man
ywo
rldcompe
titors-subsidiary
-0.40*
(0.06)
Man
ywo
rldcompe
titors-pa
rent
-0.39*
(0.06)
Con
tracten
forcem
ent
-0.46*
**-0.28*
*-0.31*
*-0.32*
*(0.00)
(0.02)
(0.01)
(0.01)
Trust
0.81
-1.33
(0.56)
(0.46)
Hierarchicalr
eligion
-0.57*
-0.76*
(0.08)
(0.07)
Cou
ntry
dummies
YES
YES
YES
YES
YES
NO
NO
NO
Indu
stry
dummies(3d)
YES
YES
YES
YES
YES
YES
YES
YES
Observatio
ns55
254
948
054
754
955
955
955
9Ps
eudo
R2
0.24
0.26
0.23
0.26
0.27
0.24
0.25
0.25
*sign
icant
at10
%,*
*sign
icant
at5%
,***
sign
icant
at1%
Notes:Probitestimates
withrobu
ststan
dard
errors.P-value
srepo
rted
inpa
renthe
ses.
SeeTa
ble3.12
inApp
endix3.A.1
forthede
nitionof
variab
les.
1A
dummythat
takesavalueof
oneifat
leaston
eman
ager
issent
from
thepa
rent
rm
tothesubsidiary
rm
andzero
othe
rwise.
2Techn
ologyis
outdated
istheom
ittedcatego
ryof
techno
logy
.
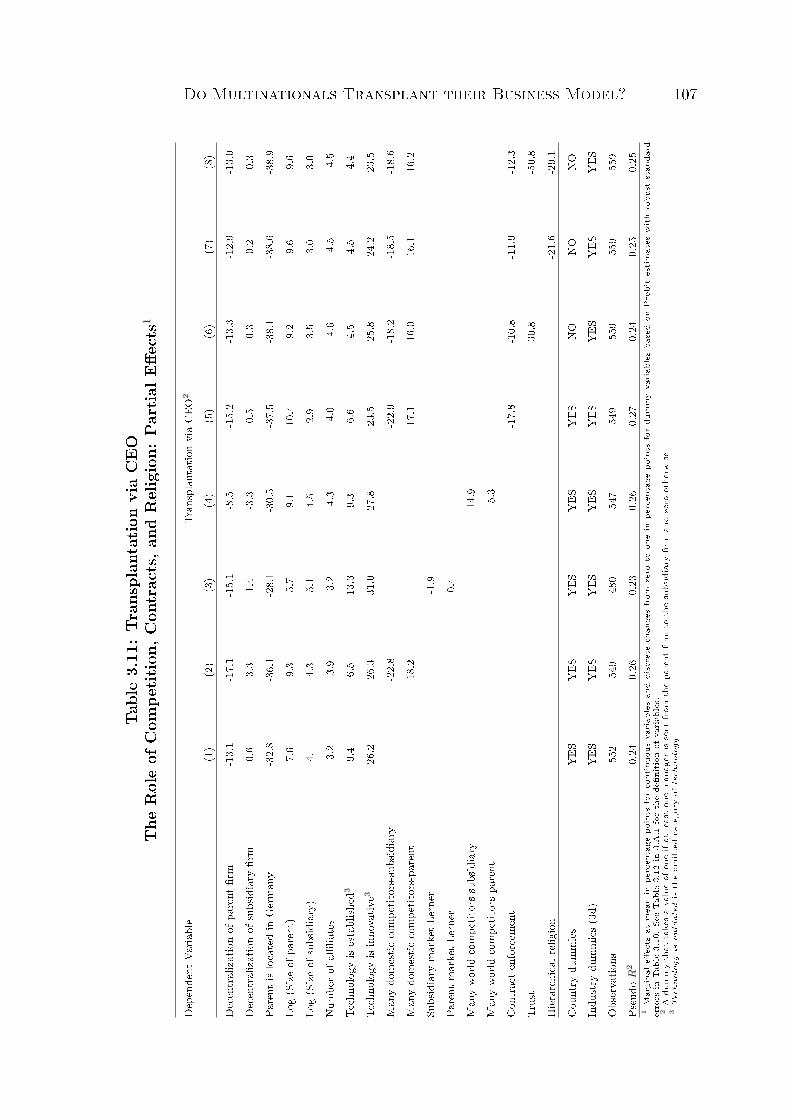
Do Multinationals Transplant their Business Model? 107
Table3.11
:Tr
ansplantationviaCEO
The
Roleof
Com
petit
ion,
Con
tracts,a
ndReligion:
PartialE
ects1
Dep
ende
ntVa
riable
Tran
splantationviaCEO
2
(1)
(2)
(3)
(4)
(5)
(6)
(7)
(8)
Decentralizationof
parent
rm
-13.1
-17.1
-15.1
-8.5
-15.2
-13.3
-12.9
-13.0
Decentralizationof
subsidiary
rm
0.6
3.3
1.4
-3.3
0.5
0.3
0.2
0.3
Parent
islocatedin
German
y-32.8
-36.1
-28.1
-30.5
-37.5
-38.1
-38.6
-38.9
Log(Sizeof
parent)
7.6
9.3
5.7
9.1
10.4
9.2
9.6
9.6
Log(Sizeof
subsidiary)
4.1
4.3
5.1
4.5
2.9
3.5
3.0
3.0
Num
berof
alia
tes
-3.2
-3.9
-3.2
-4.3
-4.0
-4.6
-4.5
-4.5
Techno
logy
isestablish
ed3
9.4
6.5
13.3
9.3
6.6
4.5
4.5
4.4
Techno
logy
isinno
vativ
e326
.226
.331
.027
.823
.525
.824
.223
.5Man
ydo
mestic
compe
titors-subsidiary
-22.8
-22.9
-18.2
-18.5
-18.6
Man
ydo
mestic
compe
titors-pa
rent
18.2
17.1
16.0
16.1
16.2
Subsidiary
marketLe
rner
-1.9
Parent
marketLe
rner
0.4
Man
ywo
rldcompe
titors-subsidiary
-14.9
Man
ywo
rldcompe
titors-pa
rent
-15.3
Con
tracten
forcem
ent
-17.8
-10.8
-11.9
-12.3
Trust
30.8
-50.8
Hierarchicalr
eligion
-21.6
-29.1
Cou
ntry
dummies
YES
YES
YES
YES
YES
NO
NO
NO
Indu
stry
dummies(3d)
YES
YES
YES
YES
YES
YES
YES
YES
Observatio
ns55
254
948
054
754
955
955
955
9Ps
eudo
R2
0.24
0.26
0.23
0.26
0.27
0.24
0.25
0.25
1Margina
le
ects
atmeanin
percentage
points
forcontinuo
usvariab
lesan
ddiscrete
chan
gesfrom
zero
toon
ein
percentage
points
fordu
mmyvariab
lesba
sedon
Probitestimates
withrobu
ststan
dard
errors
inTa
ble3.10.Se
eTa
ble3.12
in3.A.1
forthede
nitionof
variab
les.
2A
dummythat
takesavalueof
oneifat
leaston
eman
ager
issent
from
thepa
rent
rm
tothesubsidiary
rm
andzero
othe
rwise.
3Techn
ologyis
outdated
istheom
ittedcatego
ryof
techno
logy
.
Do Multinationals Transplant their Business Model? 108
We start with the host countries' markets. More domestic competition in the sub-sidiary rms' markets (given by the subsidiary market Lerner and by the rm levelmeasure many domestic competitors) as well as a stronger exposure to trade (mea-sured by many world competitors) makes it less likely that the parent rms will sendtheir own managers to run the subsidiary. A possible explanation is that when thesubsidiary is faced with tough domestic and foreign competition, the local knowledgeof the market becomes more important and hence local rather than foreign CEOs tendto be employed to run the subsidiary. Turning to the parent rms' markets, we ndthat more domestic competition favors engaging the parent rm's CEO in the foreignaliate (at least according to the rm level measure of domestic competition), whereasa greater exposure to trade of the parent rm tends to make it less likely that themultinational will send its manager to the aliate. A possible explanation for thelatter result is given by the model of Marin and Verdier (2004) and the evidence inMarin (2009). With a greater exposure to trade in the parent rms' market a "warfor manager talent" may be leading foreign rms to compete with incumbent rmsfor manager talent, making the available managers in the parent rms' market morescarce. This trade-induced scarcity of managers in the parent rms' market makes itless likely that parent rms will send additional managers to their aliates in hostcountries. The parent and subsidiary rm's market conditions are economically im-portant for the probability of sending a CEO. Many world competitors at the parentmarket or many domestic competitors at the subsidiary market rather than few makeit less likely by 15 to 23 percentage points that a manager is sent to the aliate.
Interestingly, although the social capital variables do not change the probabilityto transplant the organization to the aliate, they do aect the probability to senda manager to the aliate. In host countries with working legal institutions and goodcontract enforcement it is less likely (and probably less important) that the multina-tional rm will send its own manager to control the subsidiary. A larger proportionof the population in the host countries belonging to hierarchical religion and thus be-lieving in authority makes it also less likely that a parent rm's manager is employedin the subsidiary. One possible reason is that the belief in authority does not extendto foreign managers. Another possible explanation is that in countries with a largerproportion of religious people in the population it is less likely that workers shirk theirduty and hence it is less important to exert control.
Do Multinationals Transplant their Business Model? 109
3.4 Conclusions
In this chapter we investigate with unique data on 660 headquarters' rms in Austriaand Germany with their 2200 foreign aliates in Eastern Europe including the formerSoviet Union countries the conditions under which foreign aliates decentralize theirdecision-making and implement the business model of their multinational parent rms.
We nd that one variable stands out in terms of importance for the level of decen-tralization of subsidiary rms, namely the level of decentralization of parent rms. Wealso identify other organizational variables as central in the decision to decentralize thesubsidiary such as the size of the multinational corporation and whether the foreignaliate is a horizontal rather than a vertical foreign direct investment. In addition,the competitive and trading environments in host countries play a role in the level ofdecentralization of subsidiaries. Interestingly, we nd in contrast to the available em-pirical literature on national rms that multinational rms centralize their subsidiarieswith more competition than national rms. The trade exposure, in turn, turns out tofavor decentralization of the subsidiary. The eect of competition on the level of decen-tralization of the subsidiaries is robust to dierent measures of competition. Moreover,the results remain unchanged when we deal with the possible problem of endogeneityof the parent's rm organization. We use the parent rms' level of competition in theirhome market as an instrument for their organization. Finally, we somewhat conrmthe results of the importance of social capital for the level of decentralization found ina previous paper on national rms, namely, that trust and contract enforcement tendto facilitate decentralization.
In contrast to the decision to decentralize, the decision to transplant the businessmodel to the foreign aliate is more strongly aected by the market conditions in boththe home and host country, whereas trust, contracts and religion in host countriesappear to be less decisive. We examine two ways of transplanting the multinationalbusiness model to the foreign aliate, one via transplanting the organization and onevia transplanting the CEO. We nd that tougher domestic and foreign competitionin the subsidiary markets favors transplantation via organization but hinders trans-plantation via manager. Tougher domestic competition in the parent market, however,favors both types of transplantation whereas foreign competition in parent marketsdecreases the likelihood that multinationals transplant via organization as well as viaCEO. Transplantation of organization and of CEO appear to be weak complements

Do Multinationals Transplant their Business Model? 110
although German multinationals tend to go for transplanting via the organization andAustrian multinationals for transplanting via the CEO.
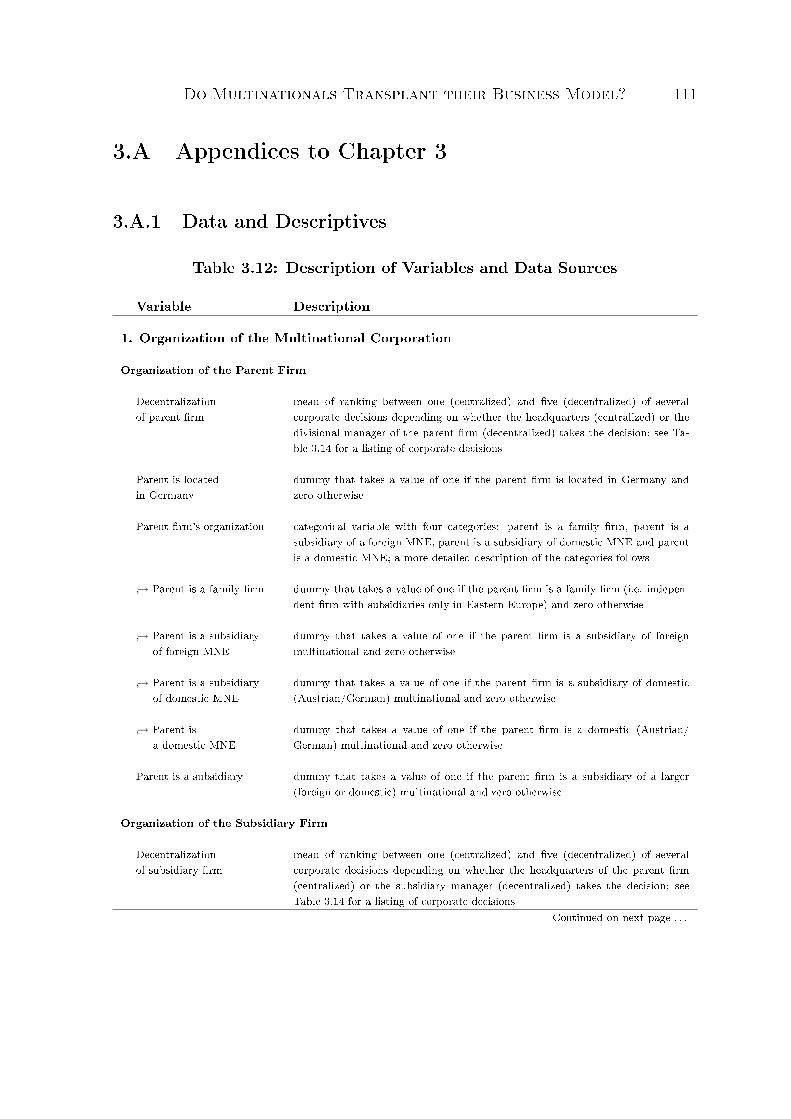
Do Multinationals Transplant their Business Model? 111
3.A Appendices to Chapter 3
3.A.1 Data and Descriptives
Table 3.12: Description of Variables and Data Sources
Variable Description
1. Organization of the Multinational Corporation
Organization of the Parent Firm
Decentralizationof parent rm
mean of ranking between one (centralized) and ve (decentralized) of severalcorporate decisions depending on whether the headquarters (centralized) or thedivisional manager of the parent rm (decentralized) takes the decision; see Ta-ble 3.14 for a listing of corporate decisions
Parent is locatedin Germany
dummy that takes a value of one if the parent rm is located in Germany andzero otherwise
Parent rm's organization categorical variable with four categories: parent is a family rm, parent is asubsidiary of a foreign MNE, parent is a subsidiary of domestic MNE and parentis a domestic MNE; a more detailed description of the categories follows
→ Parent is a family rm dummy that takes a value of one if the parent rm is a family rm (i.e. indepen-dent rm with subsidiaries only in Eastern Europe) and zero otherwise
→ Parent is a subsidiaryof foreign MNE
dummy that takes a value of one if the parent rm is a subsidiary of foreignmultinational and zero otherwise
→ Parent is a subsidiaryof domestic MNE
dummy that takes a value of one if the parent rm is a subsidiary of domestic(Austrian/German) multinational and zero otherwise
→ Parent isa domestic MNE
dummy that takes a value of one if the parent rm is a domestic (Austrian/German) multinational and zero otherwise
Parent is a subsidiary dummy that takes a value of one if the parent rm is a subsidiary of a larger(foreign or domestic) multinational and zero otherwise
Organization of the Subsidiary Firm
Decentralizationof subsidiary rm
mean of ranking between one (centralized) and ve (decentralized) of severalcorporate decisions depending on whether the headquarters of the parent rm(centralized) or the subsidiary manager (decentralized) takes the decision; seeTable 3.14 for a listing of corporate decisions
Continued on next page . . .
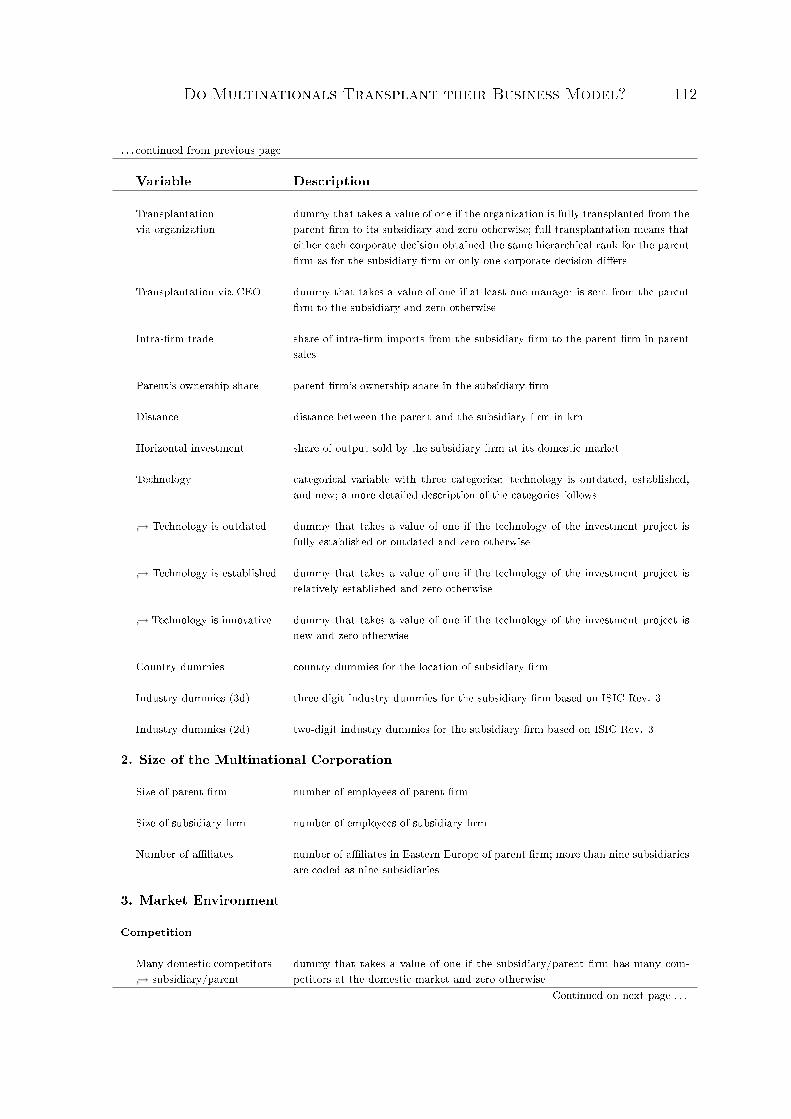
Do Multinationals Transplant their Business Model? 112
. . . continued from previous page
Variable Description
Transplantationvia organization
dummy that takes a value of one if the organization is fully transplanted from theparent rm to its subsidiary and zero otherwise; full transplantation means thateither each corporate decision obtained the same hierarchical rank for the parentrm as for the subsidiary rm or only one corporate decision diers
Transplantation via CEO dummy that takes a value of one if at least one manager is sent from the parentrm to the subsidiary and zero otherwise
Intra-rm trade share of intra-rm imports from the subsidiary rm to the parent rm in parentsales
Parent's ownership share parent rm's ownership share in the subsidiary rm
Distance distance between the parent and the subsidiary rm in km
Horizontal investment share of output sold by the subsidiary rm at its domestic market
Technology categorical variable with three categories: technology is outdated, established,and new; a more detailed description of the categories follows
→ Technology is outdated dummy that takes a value of one if the technology of the investment project isfully established or outdated and zero otherwise
→ Technology is established dummy that takes a value of one if the technology of the investment project isrelatively established and zero otherwise
→ Technology is innovative dummy that takes a value of one if the technology of the investment project isnew and zero otherwise
Country dummies country dummies for the location of subsidiary rm
Industry dummies (3d) three-digit industry dummies for the subsidiary rm based on ISIC Rev. 3
Industry dummies (2d) two-digit industry dummies for the subsidiary rm based on ISIC Rev. 3
2. Size of the Multinational Corporation
Size of parent rm number of employees of parent rm
Size of subsidiary rm number of employees of subsidiary rm
Number of aliates number of aliates in Eastern Europe of parent rm; more than nine subsidiariesare coded as nine subsidiaries
3. Market Environment
Competition
Many domestic competitors→ subsidiary/parent
dummy that takes a value of one if the subsidiary/parent rm has many com-petitors at the domestic market and zero otherwise
Continued on next page . . .
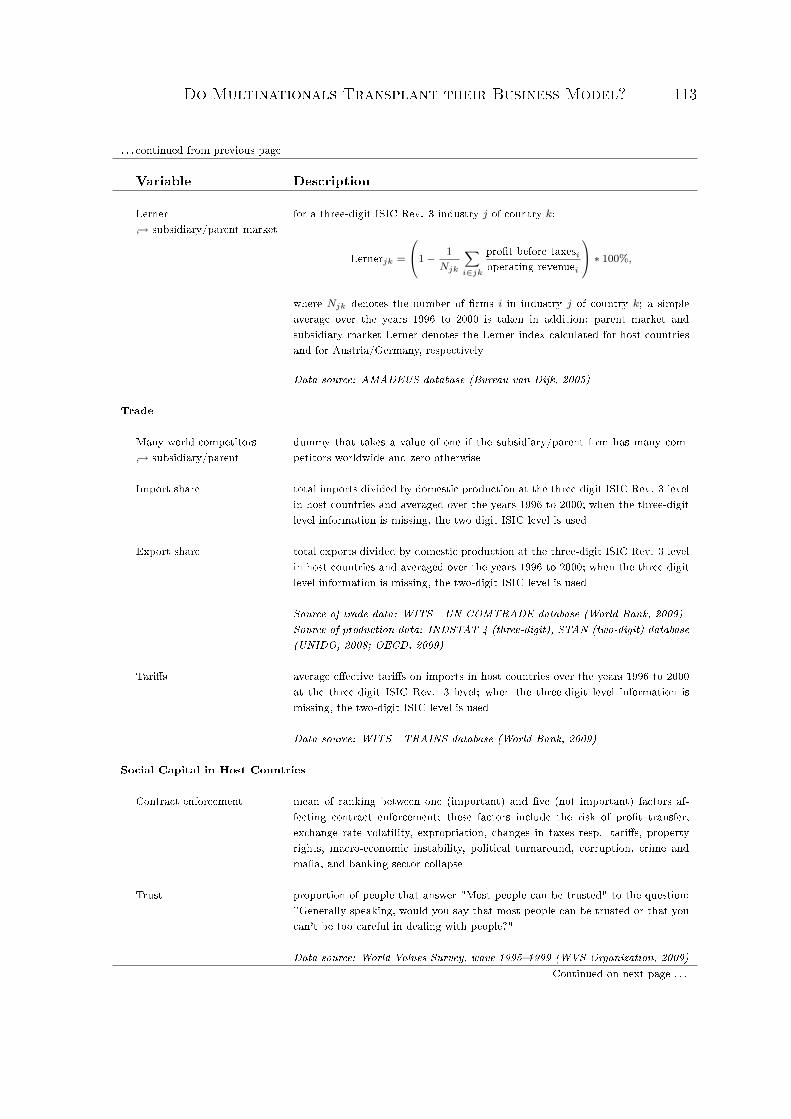
Do Multinationals Transplant their Business Model? 113
. . . continued from previous page
Variable Description
Lerner→ subsidiary/parent market
for a three-digit ISIC Rev. 3 industry j of country k:
Lernerjk =
1− 1
Njk
∑
i∈jk
prot before taxesioperating revenuei
∗ 100%,
where Njk denotes the number of rms i in industry j of country k; a simpleaverage over the years 1996 to 2000 is taken in addition; parent market andsubsidiary market Lerner denotes the Lerner index calculated for host countriesand for Austria/Germany, respectively
Data source: AMADEUS database (Bureau van Dijk, 2005)
Trade
Many world competitors→ subsidiary/parent
dummy that takes a value of one if the subsidiary/parent rm has many com-petitors worldwide and zero otherwise
Import share total imports divided by domestic production at the three-digit ISIC Rev. 3 levelin host countries and averaged over the years 1996 to 2000; when the three-digitlevel information is missing, the two-digit ISIC level is used
Export share total exports divided by domestic production at the three-digit ISIC Rev. 3 levelin host countries and averaged over the years 1996 to 2000; when the three-digitlevel information is missing, the two-digit ISIC level is used
Source of trade data: WITS - UN COMTRADE database (World Bank, 2009)Source of production data: INDSTAT 4 (three-digit), STAN (two-digit) database(UNIDO, 2008; OECD, 2009)
Taris average eective taris on imports in host countries over the years 1996 to 2000at the three-digit ISIC Rev. 3 level; when the three-digit level information ismissing, the two-digit ISIC level is used
Data source: WITS - TRAINS database (World Bank, 2009)
Social Capital in Host Countries
Contract enforcement mean of ranking between one (important) and ve (not important) factors af-fecting contract enforcement; these factors include the risk of prot transfer,exchange rate volatility, expropriation, changes in taxes resp. taris, propertyrights, macro-economic instability, political turnaround, corruption, crime andmaa, and banking sector collapse
Trust proportion of people that answer "Most people can be trusted" to the question:"Generally speaking, would you say that most people can be trusted or that youcan't be too careful in dealing with people?"
Data source: World Values Survey, wave 19951999 (WVS Organization, 2009)Continued on next page . . .

Do Multinationals Transplant their Business Model? 114
. . . continued from previous page
Variable Description
Hierarchical religion proportion of people that list a hierarchical religion (Roman Catholic, GreekCatholic, Orthodox, Islam, Gregorian or Armenian Apostolic Church) to thequestion: "Do you belong to a religious denomination? If yes: Which one?"
Data source: World Values Survey, wave 19951999 (WVS Organization, 2009)
Notes: If not reported otherwise, the data come from a survey of 660 German and Austrian rms with 2200 investment projects inEastern Europe, conducted by the Chair of International Economics at the University of Munich.
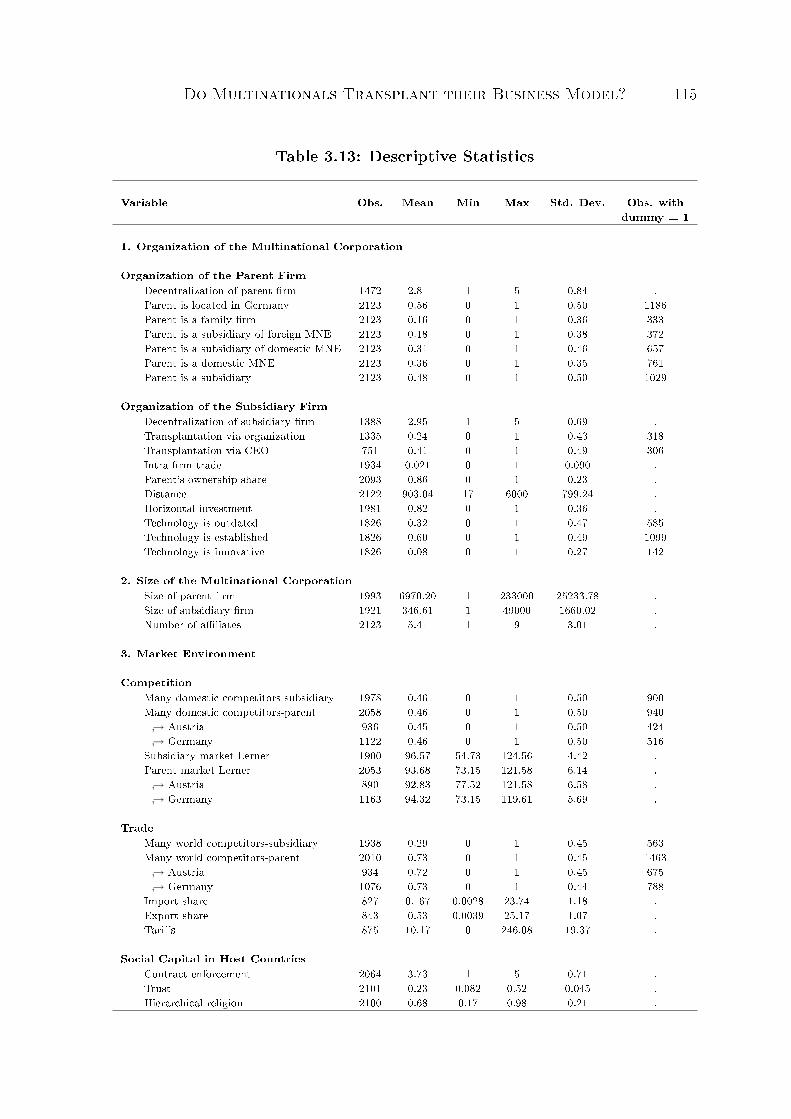
Do Multinationals Transplant their Business Model? 115
Table 3.13: Descriptive Statistics
Variable Obs. Mean Min Max Std. Dev. Obs. withdummy = 1
1. Organization of the Multinational Corporation
Organization of the Parent FirmDecentralization of parent rm 1472 2.81 1 5 0.84 .Parent is located in Germany 2123 0.56 0 1 0.50 1186Parent is a family rm 2123 0.16 0 1 0.36 333Parent is a subsidiary of foreign MNE 2123 0.18 0 1 0.38 372Parent is a subsidiary of domestic MNE 2123 0.31 0 1 0.46 657Parent is a domestic MNE 2123 0.36 0 1 0.35 761Parent is a subsidiary 2123 0.48 0 1 0.50 1029
Organization of the Subsidiary FirmDecentralization of subsidiary rm 1388 2.95 1 5 0.69 .Transplantation via organization 1335 0.24 0 1 0.43 318Transplantation via CEO 751 0.41 0 1 0.49 306Intra-rm trade 1934 0.021 0 1 0.090 .Parent's ownership share 2093 0.86 0 1 0.23 .Distance 2122 903.04 17 6000 799.24 .Horizontal investment 1981 0.82 0 1 0.36 .Technology is outdated 1826 0.32 0 1 0.47 585Technology is established 1826 0.60 0 1 0.49 1099Technology is innovative 1826 0.08 0 1 0.27 142
2. Size of the Multinational CorporationSize of parent rm 1993 6970.20 1 233000 25233.78 .Size of subsidiary rm 1921 346.61 1 49000 1660.02 .Number of aliates 2123 5.41 1 9 3.01 .
3. Market Environment
CompetitionMany domestic competitors-subsidiary 1978 0.46 0 1 0.50 900Many domestic competitors-parent 2058 0.46 0 1 0.50 940
→ Austria 936 0.45 0 1 0.50 424→ Germany 1122 0.46 0 1 0.50 516
Subsidiary market Lerner 1900 96.57 54.73 124.56 4.42 .Parent market Lerner 2053 93.68 73.15 121.58 6.14 .
→ Austria 890 92.83 77.52 121.58 6.58 .→ Germany 1163 94.32 73.15 119.61 5.69 .
TradeMany world competitors-subsidiary 1938 0.29 0 1 0.45 563Many world competitors-parent 2010 0.73 0 1 0.45 1463
→ Austria 934 0.72 0 1 0.45 675→ Germany 1076 0.73 0 1 0.44 788
Import share 827 0. 67 0.0028 23.74 1.18 .Export share 843 0.53 0.0039 25.17 1.07 .Taris 875 10.17 0 246.08 19.37 .
Social Capital in Host CountriesContract enforcement 2064 3.73 1 5 0.71 .Trust 2101 0.23 0.082 0.52 0.045 .Hierarchical religion 2100 0.68 0.17 0.98 0.21 .
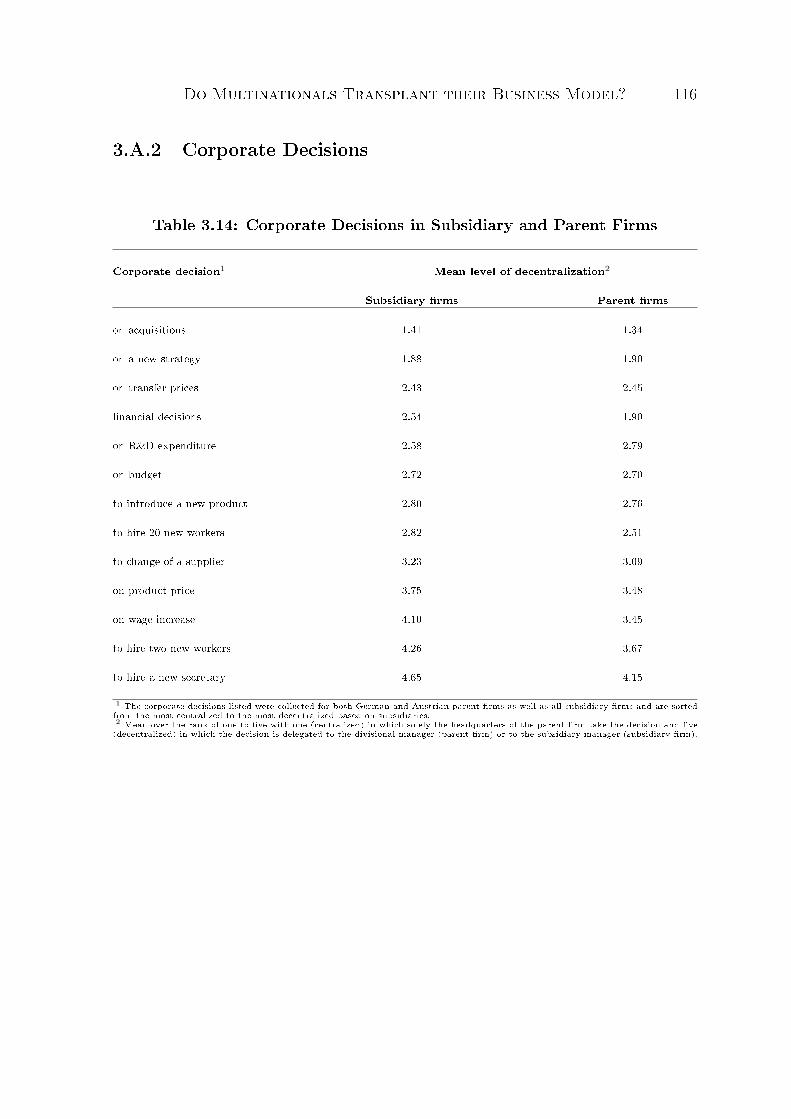
Do Multinationals Transplant their Business Model? 116
3.A.2 Corporate Decisions
Table 3.14: Corporate Decisions in Subsidiary and Parent Firms
Corporate decision1 Mean level of decentralization2
Subsidiary rms Parent rms
on acquisitions 1.41 1.34
on a new strategy 1.88 1.90
on transfer prices 2.43 2.45
nancial decisions 2.54 1.90
on R&D expenditure 2.58 2.79
on budget 2.72 2.70
to introduce a new product 2.80 2.76
to hire 20 new workers 2.82 2.51
to change of a supplier 3.23 3.09
on product price 3.75 3.48
on wage increase 4.10 3.45
to hire two new workers 4.26 3.67
to hire a new secretary 4.65 4.15
1 The corporate decisions listed were collected for both German and Austrian parent rms as well as all subsidiary rms and are sortedfrom the most centralized to the most decentralized based on subsidiaries.2 Mean over the rank of one to ve with one (centralized) in which solely the headquarters of the parent rm take the decision and ve(decentralized) in which the decision is delegated to the divisional manager (parent rm) or to the subsidiary manager (subsidiary rm).
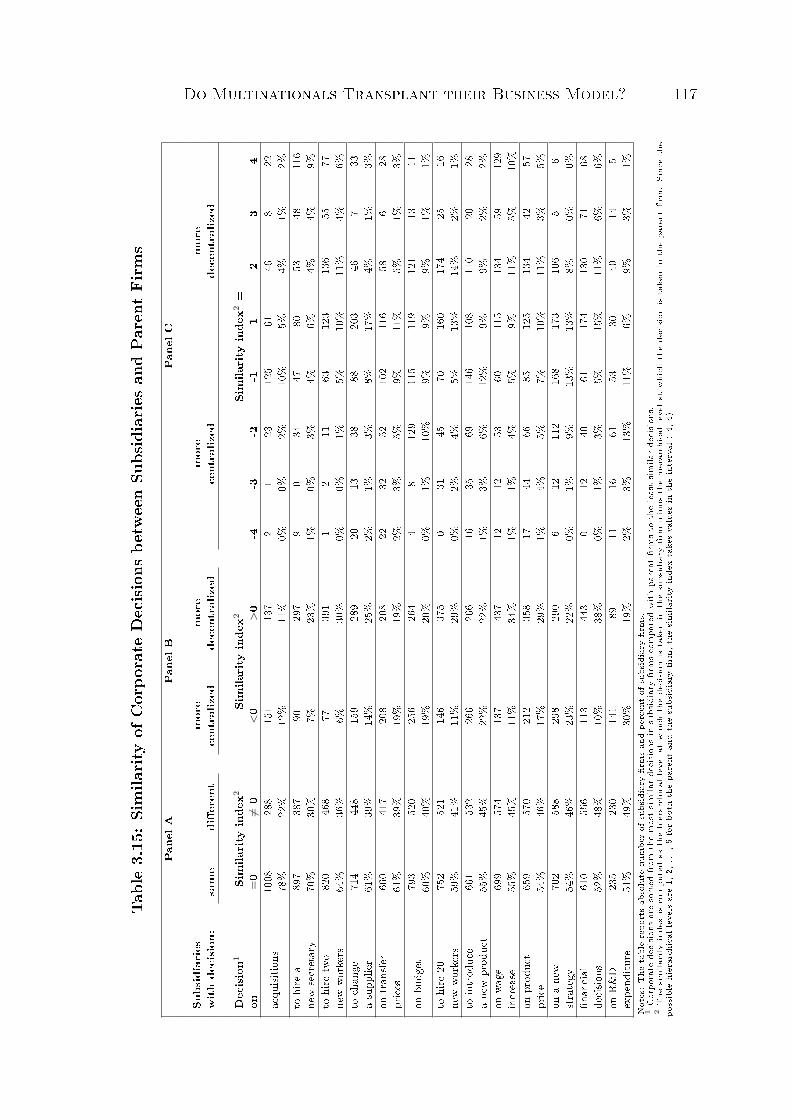
Do Multinationals Transplant their Business Model? 117
Table3.15
:Simila
rityof
Corpo
rate
Decision
sbe
tweenSu
bsidiarie
san
dPa
rent
Firm
sPa
nelA
Pane
lBPa
nelC
Subsidiaries
more
more
more
more
withde
cision
:same
die
rent
centralized
decentralized
centralized
decentralized
Decision1
Simila
rity
inde
x2Simila
rity
inde
x2Simila
rity
inde
x2=
on=0
6=0
<0
>0
-4-3
-2-1
12
34
acqu
isitio
ns10
0828
815
113
72
123
125
6146
822
78%
22%
12%
11%
0%0%
2%10
%5%
4%1%
2%to
hire
a89
738
790
297
90
3447
8053
4811
6ne
wsecretary
70%
30%
7%23
%1%
0%3%
4%6%
4%4%
9%to
hire
two
820
468
7739
11
211
6312
313
655
77ne
wwo
rkers
64%
36%
6%30
%0%
0%1%
5%10
%11
%4%
6%to
chan
ge71
444
815
928
920
1338
8820
346
733
asupp
lier
61%
39%
14%
25%
2%1%
3%8%
17%
4%1%
3%on
tran
sfer
660
417
208
208
2232
5210
211
658
628
prices
61%
39%
19%
19%
2%3%
5%9%
11%
5%1%
3%
onbu
dget
793
520
256
264
48
129
115
119
121
1311
60%
40%
19%
20%
0%1%
10%
9%9%
9%1%
1%to
hire
2075
252
114
637
50
3145
7016
017
425
16ne
wwo
rkers
59%
41%
11%
29%
0%2%
4%5%
13%
14%
2%1%
tointrod
uce
661
532
266
266
1635
6914
610
811
020
28ane
wprod
uct
55%
45%
22%
22%
1%3%
6%12
%9%
9%2%
2%on
wage
699
574
137
437
1212
5360
115
134
5912
9increase
55%
45%
11%
34%
1%1%
4%5%
9%11
%5%
10%
onprod
uct
659
570
212
358
1744
6685
125
134
4257
price
54%
46%
17%
29%
1%4%
5%7%
10%
11%
3%5%
onane
w70
258
829
829
06
1211
216
817
310
65
6strategy
54%
46%
23%
22%
0%1%
9%13
%13
%8%
0%0%
nan
cial
610
556
113
443
012
4061
174
130
7168
decisio
ns52
%48
%10
%38
%0%
1%3%
5%15
%11
%6%
6%on
R&D
235
230
141
8911
1661
5330
4014
5expe
nditu
re51
%49
%30
%19
%2%
3%13
%11
%6%
9%3%
1%Notes:The
tablerepo
rtsab
solute
numbe
rof
subsidiary
rmsan
dpe
rcentof
subsidiary
rms.
1Corpo
rate
decision
saresorted
from
themostsimila
rde
cision
sin
subsidiary
rmscompa
redwithpa
rent
rmsto
theleastsimila
rde
cision
s.2The
simila
rity
inde
xis
compu
tedas
thehierarchical
levelat
which
thede
cision
istakenin
thesubsidiary
rm
minus
thehierarchical
levelat
which
thede
cision
istakenin
thepa
rent
rm.Sinc
ethe
possible
hierarchical
levels
are1,
2,...,
5forbo
ththepa
rent
andthesubsidiary
rm,t
hesimila
rity
inde
xtakesvalues
intheinterval
(-4,
4).
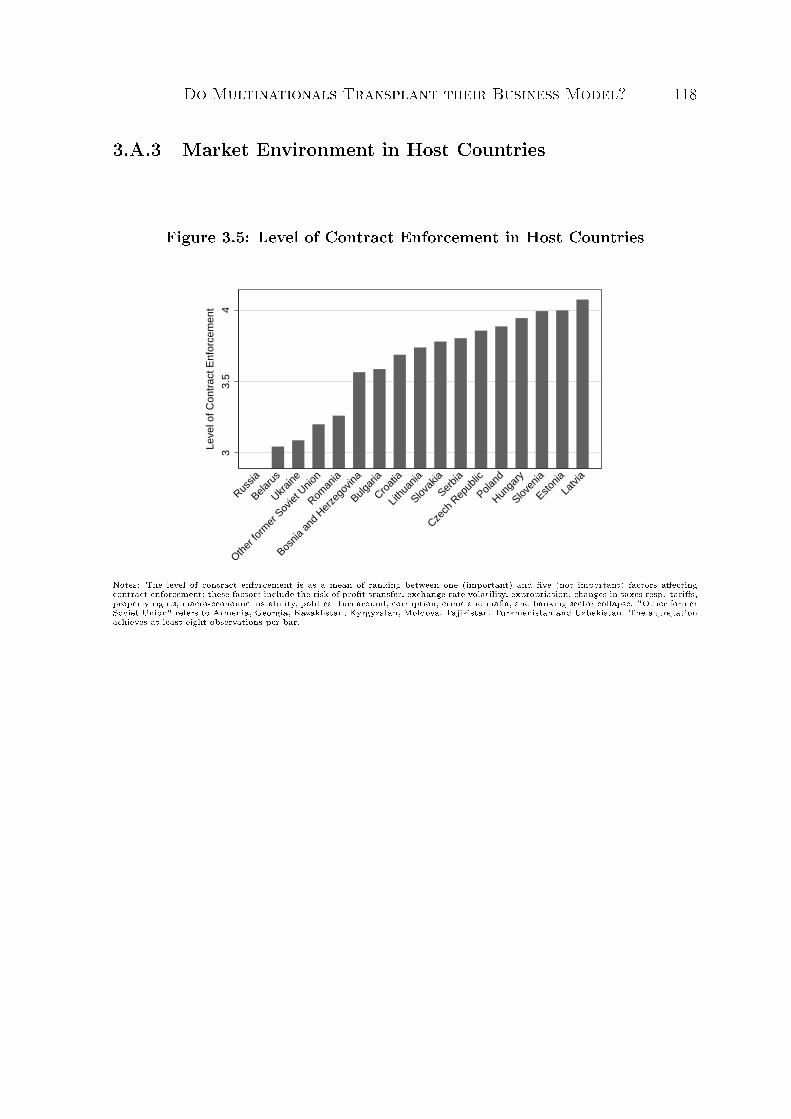
Do Multinationals Transplant their Business Model? 118
3.A.3 Market Environment in Host Countries
Figure 3.5: Level of Contract Enforcement in Host Countries3
3.5
4
Leve
l of C
ontr
act E
nfor
cem
ent
Russia
Belaru
s
Ukrain
e
Other
form
er S
oviet
Unio
n
Roman
ia
Bosnia
and
Her
zego
vina
Bulgar
ia
Croat
ia
Lithu
ania
Slovak
ia
Serbia
Czech
Rep
ublic
Poland
Hunga
ry
Sloven
ia
Estonia
Latvi
a
Notes: The level of contract enforcement is as a mean of ranking between one (important) and ve (not important) factors aectingcontract enforcement; these factors include the risk of prot transfer, exchange rate volatility, expropriation, changes in taxes resp. taris,property rights, macro-economic instability, political turnaround, corruption, crime and maa, and banking sector collapse. "Other formerSoviet Union" refers to Armenia, Georgia, Kazakhstan, Kyrgyzstan, Moldova, Tajikistan, Turkmenistan and Uzbekistan. The aggregationachieves at least eight observations per bar.
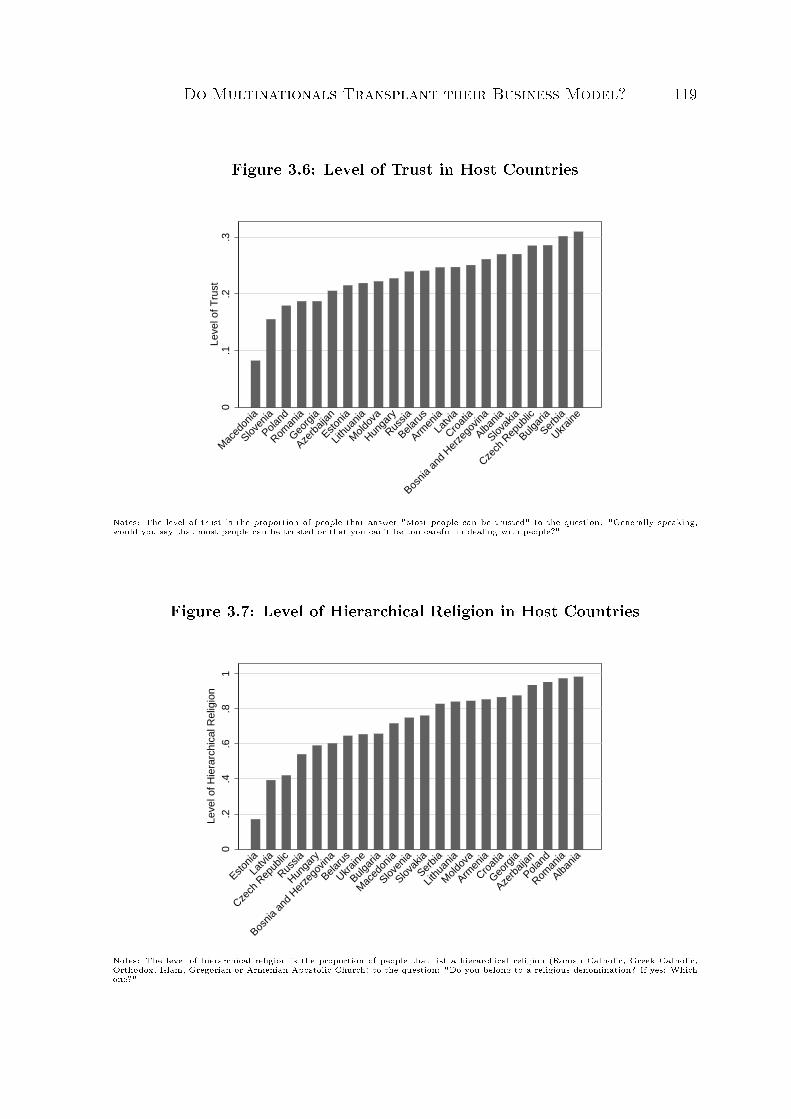
Do Multinationals Transplant their Business Model? 119
Figure 3.6: Level of Trust in Host Countries
0.1
.2.3
Leve
l of T
rust
Mac
edon
ia
Sloven
ia
Poland
Roman
ia
Georg
ia
Azerb
aijan
Estonia
Lithu
ania
Mold
ova
Hunga
ry
Russia
Belaru
s
Armen
ia
Latvi
a
Croat
ia
Bosnia
and
Her
zego
vina
Albania
Slovak
ia
Czech
Rep
ublic
Bulgar
ia
Serbia
Ukrain
e
Notes: The level of trust is the proportion of people that answer "Most people can be trusted" to the question: "Generally speaking,would you say that most people can be trusted or that you can't be too careful in dealing with people?"
Figure 3.7: Level of Hierarchical Religion in Host Countries
0.2
.4.6
.81
Leve
l of H
iera
rchi
cal R
elig
ion
Estonia
Latvi
a
Czech
Rep
ublic
Russia
Hunga
ry
Bosnia
and
Her
zego
vina
Belaru
s
Ukrain
e
Bulgar
ia
Mac
edon
ia
Sloven
ia
Slovak
ia
Serbia
Lithu
ania
Mold
ova
Armen
ia
Croat
ia
Georg
ia
Azerb
aijan
Poland
Roman
ia
Albania
Notes: The level of hierarchical religion is the proportion of people that list a hierarchical religion (Roman Catholic, Greek Catholic,Orthodox, Islam, Gregorian or Armenian Apostolic Church) to the question: "Do you belong to a religious denomination? If yes: Whichone?"
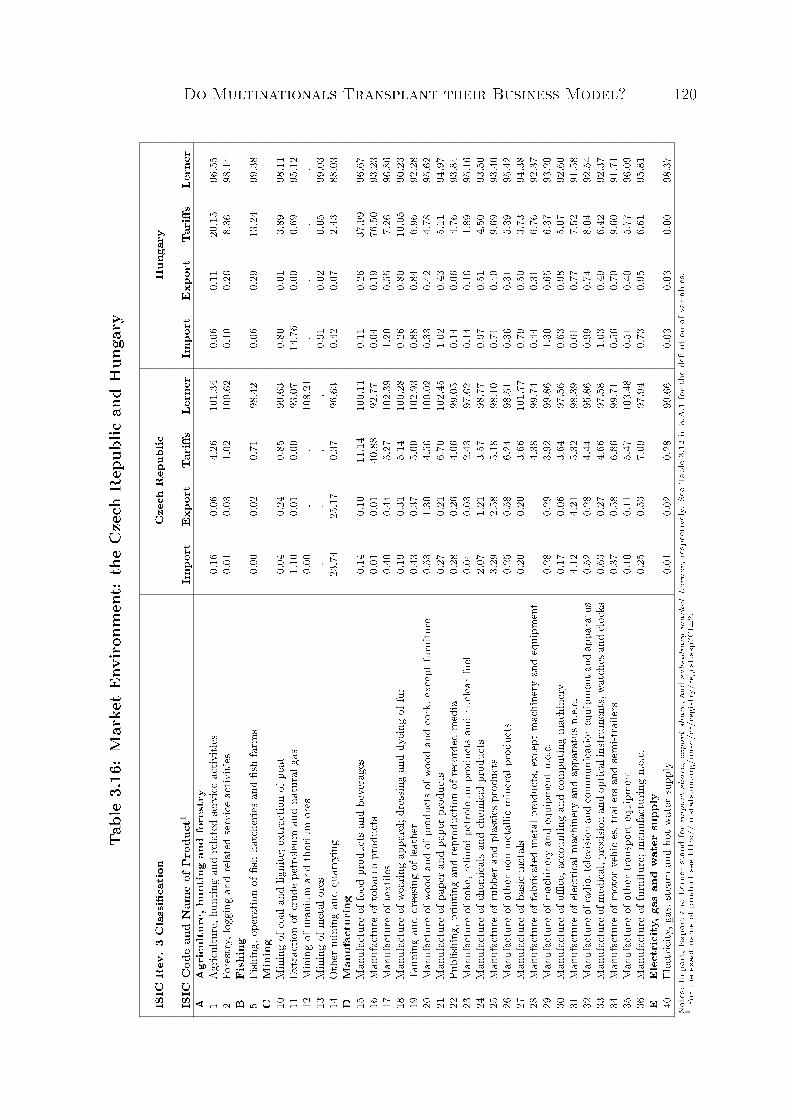
Do Multinationals Transplant their Business Model? 120Ta
ble3.16
:MarketEn
vironm
ent:
theCzech
Rep
ublic
andHun
gary
ISIC
Rev.3Classication
Czech
Rep
ublic
Hun
gary
ISIC
Cod
ean
dNam
eof
Produ
ct1
Impo
rtEx
port
Taris
Lerner
Impo
rtEx
port
Taris
Lerner
AAgriculture,h
unting
andforestry
1Agriculture,h
untin
gan
drelatedserviceactiv
ities
0.16
0.06
4.26
101.34
0.06
0.11
20.15
96.55
2Fo
restry,log
ging
andrelatedserviceactiv
ities
0.01
0.03
1.02
100.62
0.10
0.26
8.36
98.14
BFishing
5Fishing,
operationof
shha
tche
riesan
dshfarm
s0.00
0.02
0.71
98.42
0.06
0.29
13.24
99.38
CMining
10Miningof
coal
andlig
nite;e
xtractionof
peat
0.04
0.24
0.85
99.63
0.80
0.01
3.89
98.11
11Ex
tractio
nof
crud
epe
troleu
man
dna
turalg
as1.10
0.01
0.00
93.07
14.76
0.00
0.69
95.12
12Miningof
uran
ium
andthorium
ores
0.00
..
108.21
..
..
13Miningof
metal
ores
..
..
0.91
0.02
0.05
99.03
14Other
miningan
dqu
arrying
23.74
25.17
0.37
96.63
0.42
0.07
2.43
88.03
DMan
ufacturing
15Man
ufacture
offood
prod
ucts
andbe
verages
0.14
0.10
11.14
100.11
0.11
0.26
37.99
96.67
16Man
ufacture
oftoba
ccoprod
ucts
0.01
0.01
40.88
92.77
0.04
0.19
76.50
93.23
17Man
ufacture
oftextile
s0.40
0.44
5.27
102.39
1.20
0.55
7.26
96.86
18Man
ufacture
ofwe
aringap
parel;dressin
gan
ddy
eing
offur
0.19
0.31
5.14
100.28
0.26
0.80
10.05
90.23
19Ta
nningan
ddressin
gof
leathe
r0.43
0.37
5.00
102.93
0.88
0.84
6.96
92.28
20Man
ufacture
ofwo
odan
dof
prod
ucts
ofwo
odan
dcork,e
xcep
tfurnitu
re0.53
1.30
4.56
100.02
0.33
0.42
4.78
95.62
21Man
ufacture
ofpa
peran
dpa
perprod
ucts
0.27
0.21
6.70
102.45
1.02
0.43
5.11
94.97
22Pu
blish
ing,
printin
gan
dreprod
uctio
nof
recorded
med
ia0.28
0.26
4.06
99.05
0.14
0.06
4.76
93.84
23Man
ufacture
ofcoke,re
nedpe
troleu
mprod
ucts
andnu
clearfuel
0.04
0.03
2.43
97.62
0.14
0.16
1.89
95.16
24Man
ufacture
ofchem
icalsan
dchem
ical
prod
ucts
2.07
1.21
3.57
98.77
0.97
0.51
4.50
93.50
25Man
ufacture
ofrubb
eran
dplastic
sprod
ucts
3.29
2.58
5.18
98.10
0.71
0.40
9.69
93.40
26Man
ufacture
ofothe
rno
n-metallic
mineral
prod
ucts
0.25
0.58
6.24
98.51
0.36
0.31
5.39
95.42
27Man
ufacture
ofba
sicmetals
0.20
0.20
3.66
101.77
0.79
0.50
3.73
94.38
28Man
ufacture
offabricated
metal
prod
ucts,e
xcep
tmachine
ryan
dequipm
ent
4.38
99.74
0.44
0.31
6.76
92.37
29Man
ufacture
ofmachine
ryan
dequipm
entn.e.c.
0.28
0.29
3.92
99.86
1.30
0.65
6.37
93.20
30Man
ufacture
ofo
ce,a
ccou
ntingan
dcompu
tingmachine
ry0.17
0.06
3.64
97.56
0.63
0.98
5.07
92.60
31Man
ufacture
ofelectrical
machine
ryan
dap
paratusn.e.c.
4.12
4.21
5.32
98.39
0.61
0.77
7.52
91.58
32Man
ufacture
ofradio,
televisio
nan
dcommun
icationequipm
enta
ndap
paratus
0.52
0.28
4.44
95.86
0.99
0.74
8.04
92.54
33Man
ufacture
ofmed
ical,p
recisio
nan
dop
tical
instruments,w
atches
andclocks
0.63
0.27
4.66
97.58
1.03
0.49
6.42
92.37
34Man
ufacture
ofmotor
vehicles,traile
rsan
dsemi-t
raile
rs0.37
0.58
6.86
99.71
0.56
0.70
9.60
91.71
35Man
ufacture
ofothe
rtran
sportequipm
ent
0.10
0.11
5.47
103.48
0.51
0.40
5.77
96.09
36Man
ufacture
offurnitu
re;m
anufacturin
gn.e.c.
0.25
0.53
7.09
97.94
0.73
0.95
6.61
95.81
EElectricity
,gas
andwater
supp
ly40
Electricity
,gas,s
team
andho
twa
tersupp
ly0.01
0.02
0.28
99.66
0.03
0.03
0.00
98.37
Notes:Im
port,E
xportan
dLe
rner
stan
dforim
port
share,
export
share,
andsubsidiary
marketLe
rner,r
espe
ctively.
SeeTa
ble3.12
in3.A.1
forthede
nitionof
variab
les.
1Fo
rtheexactna
meof
prod
uctseehttp://u
nstats.un.org/
unsd/cr/registry/regcst.asp?
Cl=
2.
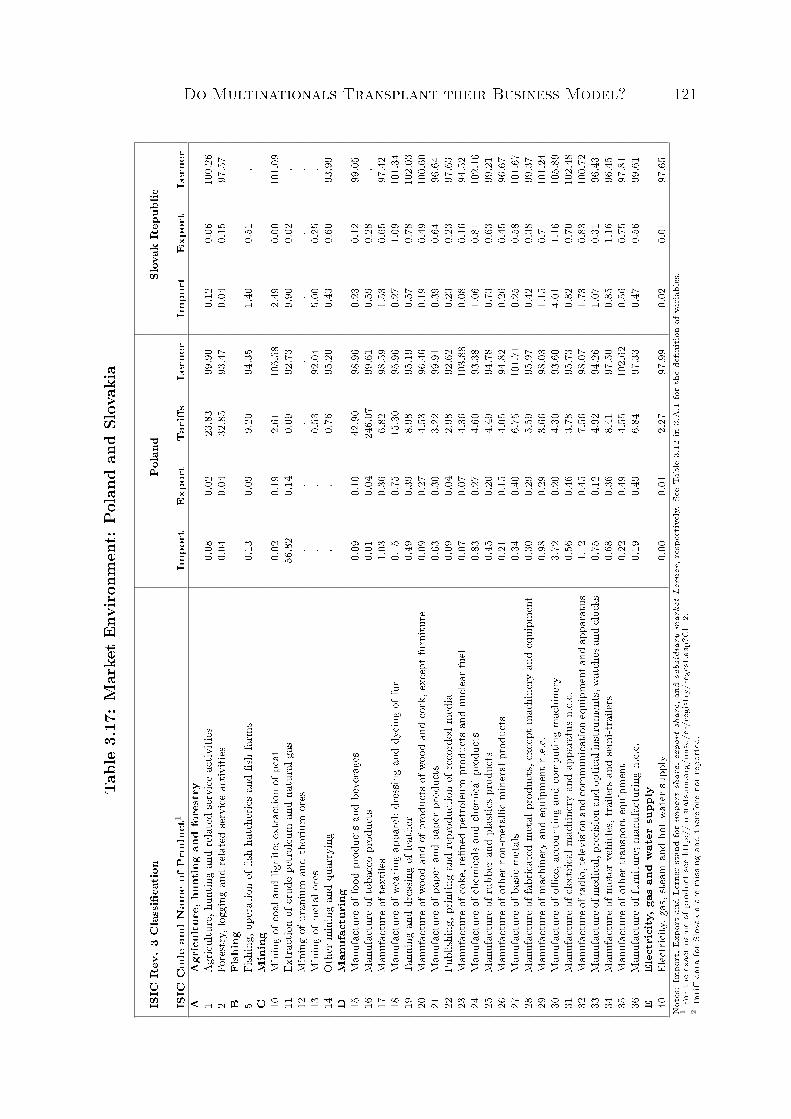
Do Multinationals Transplant their Business Model? 121Ta
ble3.17
:MarketEn
vironm
ent:
Poland
andSlovak
ia
ISIC
Rev.3Classication
Poland
Slovak
Rep
ublic
ISIC
Cod
ean
dNam
eof
Produ
ct1
Impo
rtEx
port
Taris
Lerner
Impo
rtEx
port
Lerner
AAgriculture,h
unting
andforestry
1Agriculture,h
untin
gan
drelatedserviceactiv
ities
0.08
0.02
23.83
99.90
0.12
0.06
100.26
2Fo
restry,log
ging
andrelatedserviceactiv
ities
0.04
0.04
32.85
93.47
0.04
0.15
97.57
BFishing
5Fishing,
operationof
shha
tche
riesan
dshfarm
s0.13
0.09
9.20
94.35
1.40
0.51
.C
Mining
10Miningof
coal
andlig
nite;e
xtractionof
peat
0.02
0.19
2.61
105.58
2.49
0.00
101.09
11Ex
tractio
nof
crud
epe
troleu
man
dna
turalg
as56
.82
0.14
0.09
92.73
9.90
0.02
.12
Miningof
uran
ium
andthorium
ores
..
..
..
.13
Miningof
metal
ores
..
0.53
92.04
5.00
0.25
.14
Other
miningan
dqu
arrying
..
0.76
95.20
0.43
0.60
93.99
DMan
ufacturing
15Man
ufacture
offood
prod
ucts
andbe
verages
0.09
0.10
42.90
98.96
0.23
0.12
99.05
16Man
ufacture
oftoba
ccoprod
ucts
0.01
0.04
246.07
99.61
0.59
0.28
.17
Man
ufacture
oftextile
s1.03
0.36
6.82
98.59
1.53
0.65
97.42
18Man
ufacture
ofwe
aringap
parel;dressin
gan
ddy
eing
offur
0.15
0.75
15.30
95.96
0.27
1.09
101.34
19Ta
nningan
ddressin
gof
leathe
r0.49
0.39
8.98
95.19
0.57
0.78
102.03
20Man
ufacture
ofwo
odan
dof
prod
ucts
ofwo
odan
dcork,e
xcep
tfurnitu
re0.09
0.27
4.53
96.46
0.19
0.49
100.60
21Man
ufacture
ofpa
peran
dpa
perprod
ucts
0.63
0.30
3.22
99.91
0.39
0.64
96.64
22Pu
blish
ing,
printin
gan
dreprod
uctio
nof
recorded
med
ia0.09
0.04
2.98
92.62
0.23
0.23
97.63
23Man
ufacture
ofcoke,re
nedpe
troleu
mprod
ucts
andnu
clearfuel
0.07
0.07
4.36
103.88
0.08
0.16
94.52
24Man
ufacture
ofchem
icalsan
dchem
ical
prod
ucts
0.83
0.27
4.60
93.38
1.06
0.81
102.16
25Man
ufacture
ofrubb
eran
dplastic
sprod
ucts
0.45
0.20
4.49
94.78
0.73
0.63
99.21
26Man
ufacture
ofothe
rno
n-metallic
mineral
prod
ucts
0.21
0.15
4.05
94.82
0.26
0.45
96.67
27Man
ufacture
ofba
sicmetals
0.34
0.40
6.75
101.71
0.25
0.58
101.67
28Man
ufacture
offabricated
metal
prod
ucts,e
xcep
tmachine
ryan
dequipm
ent
0.30
0.29
5.59
95.97
0.42
0.38
99.37
29Man
ufacture
ofmachine
ryan
dequipm
entn.e.c.
0.98
0.29
3.66
98.03
1.15
0.71
101.24
30Man
ufacture
ofo
ce,a
ccou
ntingan
dcompu
tingmachine
ry3.72
0.20
4.30
93.60
4.01
1.16
105.89
31Man
ufacture
ofelectrical
machine
ryan
dap
paratusn.e.c.
0.56
0.46
3.78
95.73
0.82
0.70
102.48
32Man
ufacture
ofradio,
televisio
nan
dcommun
icationequipm
enta
ndap
paratus
1.12
0.45
7.56
98.07
1.73
0.83
100.72
33Man
ufacture
ofmed
ical,p
recisio
nan
dop
tical
instruments,w
atches
andclocks
0.75
0.12
4.92
94.26
1.07
0.31
96.43
34Man
ufacture
ofmotor
vehicles,traile
rsan
dsemi-t
raile
rs0.68
0.36
8.41
97.50
0.85
1.16
96.45
35Man
ufacture
ofothe
rtran
sportequipm
ent
0.22
0.49
4.55
102.62
0.56
0.75
97.81
36Man
ufacture
offurnitu
re;m
anufacturin
gn.e.c.
0.19
0.49
6.84
97.33
0.47
0.56
99.61
EElectricity
,gas
andwater
supp
ly40
Electricity
,gas,s
team
andho
twa
tersupp
ly0.00
0.01
2.27
97.99
0.02
0.01
97.65
Notes:Im
port,E
xportan
dLe
rner
stan
dforim
port
share,
export
share,
andsubsidiary
marketLe
rner,r
espe
ctively.
SeeTa
ble3.12
in3.A.1
forthede
nitionof
variab
les.
1Fo
rtheexactna
meof
prod
uctseehttp://u
nstats.un.org/
unsd/cr/registry/regcst.asp?
Cl=
2.2Ta
rida
taforSlovak
iaaremissing
andthereforeno
trepo
rted
.
References
Acemoglu, D., Aghion, P., Lelarge, C., van Reenen, J. V., Zilibotti, F., 2007. Tech-nology, Information and the Decentralization of the Firm. Quarterly Journal of Eco-nomics 122 (4), 17591799.
Antras, P., Helpman, E., 2004. Global Sourcing. Journal of Political Economy 112 (3),552580.
Bernard, A. B., Jensen, J. B., Redding, S. J., Schott, P. K., 2007. Firms in InternationalTrade. Journal of Economic Perspectives 21 (3), 105130.
Bloom, N., Sadun, R., van Reenen, J., 2009. The Organization of Firms across Coun-tries. CEP Discussion Papers dp0937, Centre for Economic Performance, LondonSchool of Economics, London.
Bloom, N., Sadun, R., van Reenen, J. M., 2007. Americans Do I.T. Better: US Multina-tionals and the Productivity Miracle. NBER Working Paper Series w13085, NationalBureau of Economic Research, Cambridge, MA.
Bureau van Dijk, 2005. AMADEUS database. Available at http://www.bvdep.com/en/Amadeus.html.
Fernández, R., Fogli, A., 2009. Culture: An Empirical Investigation of Beliefs, Work,and Fertility. American Economic Journal: Macroeconomics 1 (1), 146177.
Fisman, R., Miguel, E., 2008. Corruption, Norms, and Legal Enforcement: Evidencefrom Diplomatic Parking Tickets. Journal of Political Economy 115 (6), 10201048.
Guadalupe, M., Wulf, J., 2008. The Flattening Firm and Product Market Competition:The Eect of Trade Liberalization. NBER Working Papers 14491, National Bureauof Economic Research, Cambridge, MA.
Helpman, E., Melitz, M. J., Yeaple, S. R., 2004. Export versus FDI with HeterogeneousFirms. American Economic Review 94 (1), 300316.
Do Multinationals Transplant their Business Model? 123
Marin, D., 2004. A Nation of Poets and Thinkers: Less so with Eastern Enlargement?Austria and Germany. CEPR Discussion Paper 4358, Centre for Economic PolicyResearch, London.
Marin, D., 2008. The New Corporation in Europe. Bruegel Policy Brief, Issue 2008/07,Bruegel, Brussels.
Marin, D., 2009. The Battle for Talent: Globalization and the Rise of Executive Pay.Working Paper 2009/01, Bruegel, Brussels.
Marin, D., Rousová, L., 2009. The Transfer of Productivity to Eastern Europe: TheRole of Organization. Mimeo, University of Munich, Munich.
Marin, D., Verdier, T., 2004. Globalization and the Empowerment of Talent. Discus-sion Papers 1, SFB/TR 15 Governance and the Eciency of Economic Systems,University of Munich, Munich.
Marin, D., Verdier, T., 2007. Corporate Hierarchies and the Size of Nations: Theoryand Evidence. Working Papers 0714, New York University, Leonard N. Stern Schoolof Business, Department of Economics, New York.
Marin, D., Verdier, T., 2008a. Competing in Organizations: Firm Heterogeneity andInternational Trade. In: Helpman, E., Marin, D., Verdier, T. (Eds.), The Organiza-tion of Firms in a Global Economy. Harvard University Press, pp. 142172.
Marin, D., Verdier, T., 2008b. Power Inside the Firm and the Market: A GeneralEquilibrium Approach. Journal of the European Economic Association 6 (4), 752788.
Melitz, M. J., 2003. The Impact of Trade on Intra-Industry Reallocations and Aggre-gate Industry Productivity. Econometrica 71 (6), 16951725.
OECD, 2009. Structural Analysis Database (STAN). Available at www.oecd.org/sti/stan.
Rajan, R. G., Wulf, J., 2006. The Flattening Firm: Evidence from Panel Data anthe Changing Nature of Corporate Hierarchies. Review of Economics and Statistics88 (4), 759773.
UNIDO, 2008. Industrial Statistics Database (INDSTAT 4, Revision 3). Available athttp://www.unido.org/index.php?id=o3533.

Do Multinationals Transplant their Business Model? 124
World Bank, 2009. World Integrated Trade Solution (WITS). Available at http://wits.worldbank.org.
WVS Organization, 2009. World Value Survey 1995, Waves 19951999. Available athttp://www.worldvaluessurvey.org.

Eidesstattliche Versicherung
Ich versichere hiermit eidesstattlich, dass ich die vorliegende Arbeit selbständig undohne fremde Hilfe verfasst habe. Die aus fremden Quellen direkt oder indirektübernommenen Gedanken sowie mir gegebene Anregungen sind als solche kenntlichgemacht.
Die Arbeit wurde bisher keiner anderen Prüfungsbehörde vorgelegt und auch noch nichtveröentlicht.
Datum: 18.12.2009
Linda Rousová
Curriculum Vitae
10/2006 - 12/2009 Ph.D. program in EconomicsMunich Graduate School of EconomicsLudwig-Maximilians-University, Munich, Germany
10/2007 - 02/2008 InternshipEconomic Research Division, Trade in Services DivisionWorld Trade Organization, Geneva, Switzerland
10/2005 - 09/2006 Master studies in EconomicsMunich Graduate School of EconomicsLudwig-Maximilians-University, Munich, Germany
09/2000 - 07/2005 Master studies in Mathematicstitle conferred: Magistr (equivalent to Master)Charles University, Prague, Czech Republic
04/2003 - 09/2003 Visiting studentMartin Luther University, Halle, Germany
09/2002 - 03/2003 Socrates/Erasmus programHumboldt University, Berlin, Germany
05/2000 School leaving examinationGymnasium U Balvanu, Jablonec n. N., Czech Republic
09/30/1981 born in Jablonec nad Nisou, Czech Republic