MPRI – Course on Concurrency Probabilistic methods in Concurrency
Upload
pushpalanka-jayawardhanaCategory
view
141download
1
Threads and ConcurrencyIdentifying Performance Deviations in Thread Pools
PRESENTED BY
158217G - PUSHPALANKA JAYAWARDHANA
158248C - SALIYA SAMARAWICKRAMA
Mark D. Syer, Bram Adams and Ahmed E. Hassan
Reference:M. D. Syer, B. Adams, and A. E. Hassan,"Identifying performance deviations in thread pools," in Proceedings of the International Conference on Software Maintenance,
sep 2011, pp. 83-92

Line Up
Objective
Thread pools
Performance deviations in thread pools
Methodology
Related work, results& limitations
Hiding the thread complexity
Summary
2

Objective
Introduce a methodology to identify threads with
performance deviations in thread pools.
Significance
ULS systems vastly use thread pool pattern in high concurrent implementations
Isolating the deviating threads need immense effort
source: http://farm3.static.flickr.com/2275/2153328067_2aeda0e4d2_m.jpg
3

Thread Pools What is a thread pools?
Benefits of thread pools
Thread creation/destroying overhead reduced
Improved responsiveness
Issues related to thread pools
Idle threads
Dead locks
Thread leakages
Get the suitable tuning
No control over the state and priority of the thread
source: https://www10.informatik.uni-erlangen.de/~buildscript/pe/trunk/doc/html/threadpool.png
4
Performance Deviations in Thread
Pools Why is it hard to identify deviations?
No detailed log entries
Require thorough knowledge on system architecture
Hard to detect concurrency issues
Hard to track threads in the pool in isolation
Lacking tool support
Require heavy instrumentation
Hard to interpret hardware sensor gathered data
source: http://connect.greenbeacon.com/wp-content/uploads/2014/12/tracker.jpg, http://blog.infostruction.com/wp-content/uploads/2010/11/networksecurity.jpg
5

Method to Identify
Iterative, top down approach
Apply statistical analysis on resource usage logs
Measure dissimilarity between resource usage
Isolate the most deviating abstractions
source: http://static2.xlstat.com/images/content/home-slides-03.jpg.pagespeed.ce.vt3YFEFWQF.jpg
6

Method in Detail
► More resource usage metrics► More accurate understanding on behavior
► Higher level abstractions► Pooled threads in one machine
► Threads created in one hour slot
7

Method in Detail
Click to add text
►Why Co-variance matrix?► Robust to noise in the performance data
► Factor out time
► compare load tests of deviating lengths
8

Co-variance measures
A measure of how much two random variables change together
9
CPUMem

Co-variance Ctd.. 10
M C H
source: http://images.wisegeek.com/black-desktop-computer.jpg, http://stattrek.com/matrix-algebra/covariance-matrix.aspx
2
Forstner and Moonen Distance
Matrix

Method in Detail
Click to add text
► Merge the least distant abstraction to cluster
► Ward's method - least distance between cluster centroids after merge► Stop when all in one cluster made
11

Method in Detail
Click to add text
12
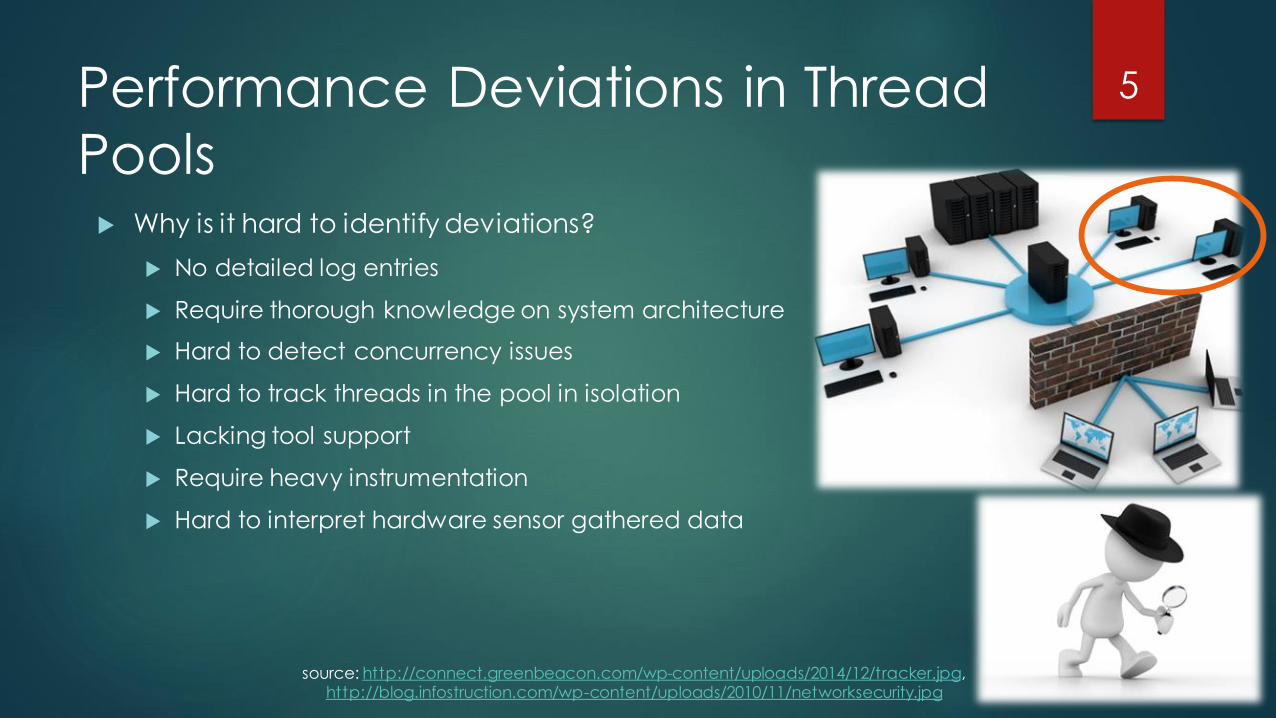
Method in Detail
► Recursively improve the dendrogram via an algorithm
► Stops when clusters are in good fit► Isolate the deviations
13

Ranking Algorithm 14

Case Study - Background
Qualitatively evaluate the deviated threads
Calculate the precision & recall value
Load test using synthetically injected deviations
System
ULA system in e-commerce domain
Time duration 16 hours
15

Case Study
Resource Measured
CPU CPU time usage as %
Virtual Bytes Virtual address space usage
Private Bytes Private memory usage
Handles # of open file handles
Micro Thread # allocated micro threads
16
Sampled every 7 seconds
Each has
Thread ID
Time
Value of each resource usage

Case Study 17
Thread pool contains 40 threads
Each process one work item
Each item completion time two hours
Threads with identical life time grouped
Group called a “Wave”
Wave length 2 hours and 5 minutes
Observe 8 Waves
Using pvclust , hierarchical clustering done
Ranking done as per slide

Results - Qualitative 18
Results of first wave Ranking of waves

Results - Qualitative 19
T1W1 in solid line
T1W8 in dotted line
T1W5 in dashed line
Virtual memory allocation

Results - Qualitative 20
T1W1 in detail

Results – Quantitative 21

Results Summary & Limitations
High precision
Identify IO & memory leaks
identify CPU spikes
This evaluated has been done using a single software system, so this results may differ for
other systems…
22

Summary
Threads vs thread pools
Benefits & risks related to thread pools
Light weight statistical approach to detect risks
23

Thank You..!
24

Hiding Complexity
Android handler
AsyncTask
25
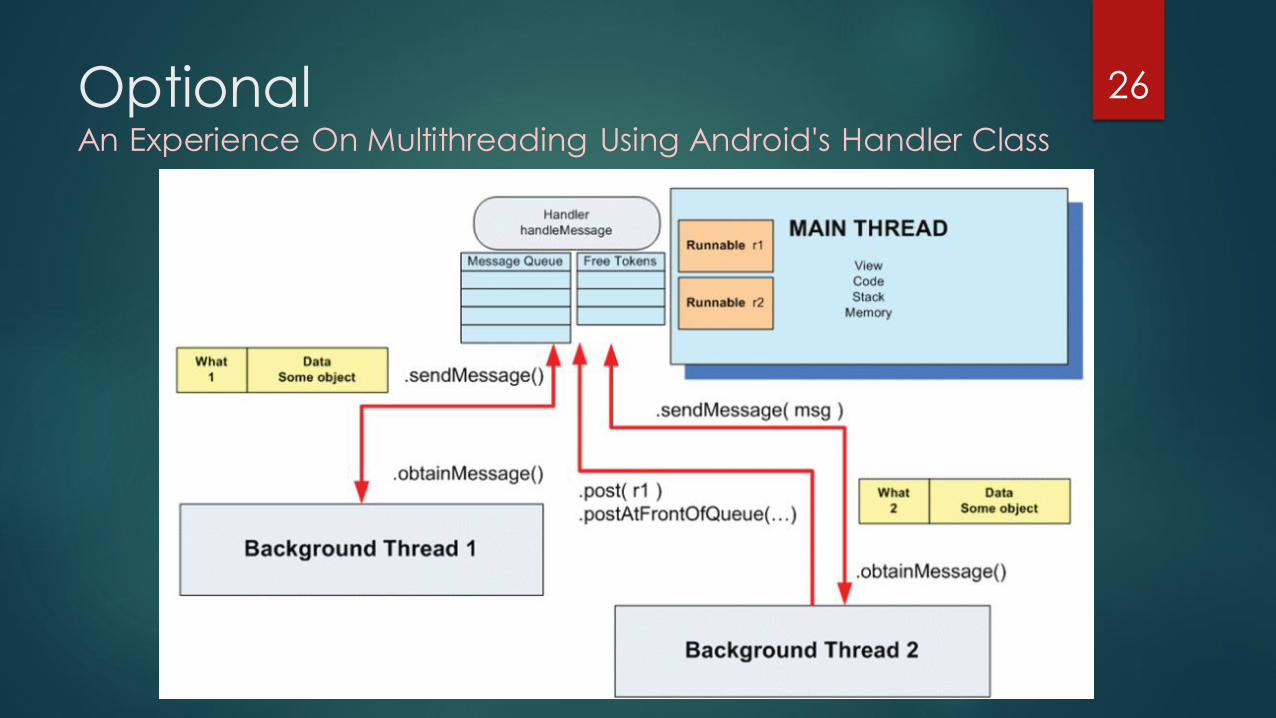
OptionalAn Experience On Multithreading Using Android's Handler Class
26

Qualitative Evaluation
Selecting the abstractions to visualize based on ranking
Normalizing the time scale
Under sampling the metrics by averaging every two minutes to remove single-point anomalies and noise.
Plotting the under sampled metrics.
Plotting additional details, such as the average and standard
deviation, as needed. The
27

Results – Average of All Test 28