
THORPEX: TAKING STOCK AND LOOKING AHEAD · THORPEX: TAKING STOCK AND LOOKING AHEAD ... A Sequential...
47
THORPEX: TAKING STOCK AND LOOKING AHEAD Acknowledgements: US THORPEX Executive Committee (USTEC) Members THORPEX Symposium, 17 November 2014, Geneva, Switzerland 1
Transcript of THORPEX: TAKING STOCK AND LOOKING AHEAD · THORPEX: TAKING STOCK AND LOOKING AHEAD ... A Sequential...

THORPEX: TAKING STOCK AND LOOKING AHEAD
Acknowledgements: US THORPEX Executive Committee (USTEC) Members
THORPEX Symposium, 17 November 2014, Geneva, Switzerland1

OUTLINE / SUMMARY• Accomplishments – Adaptive methods
– Targeted observations– Ensemble‐based background covariance– Ensemble‐based probabilistic forecasts
• Failures– Organizational – Stakeholders Panel– Research – Cost‐benefit analysis
• Some open research questions– Adaptive observations– Cloud / hydrometeor analysis– Software level collaboration w object oriented design– Ensemble initialization– Statistical post‐processing
• Teams + strong individual initiatives= Key to innovation2
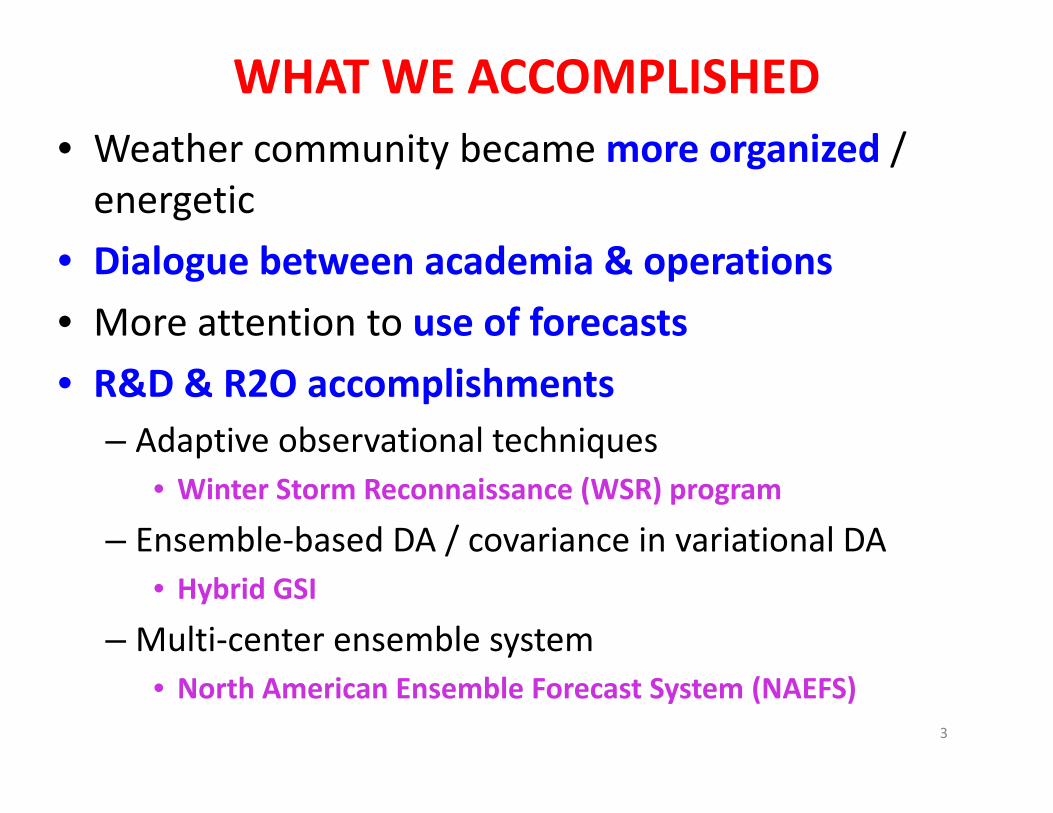
WHAT WE ACCOMPLISHED• Weather community became more organized / energetic
• Dialogue between academia & operations• More attention to use of forecasts• R&D & R2O accomplishments
– Adaptive observational techniques• Winter Storm Reconnaissance (WSR) program
– Ensemble‐based DA / covariance in variational DA• Hybrid GSI
– Multi‐center ensemble system• North American Ensemble Forecast System (NAEFS)
3
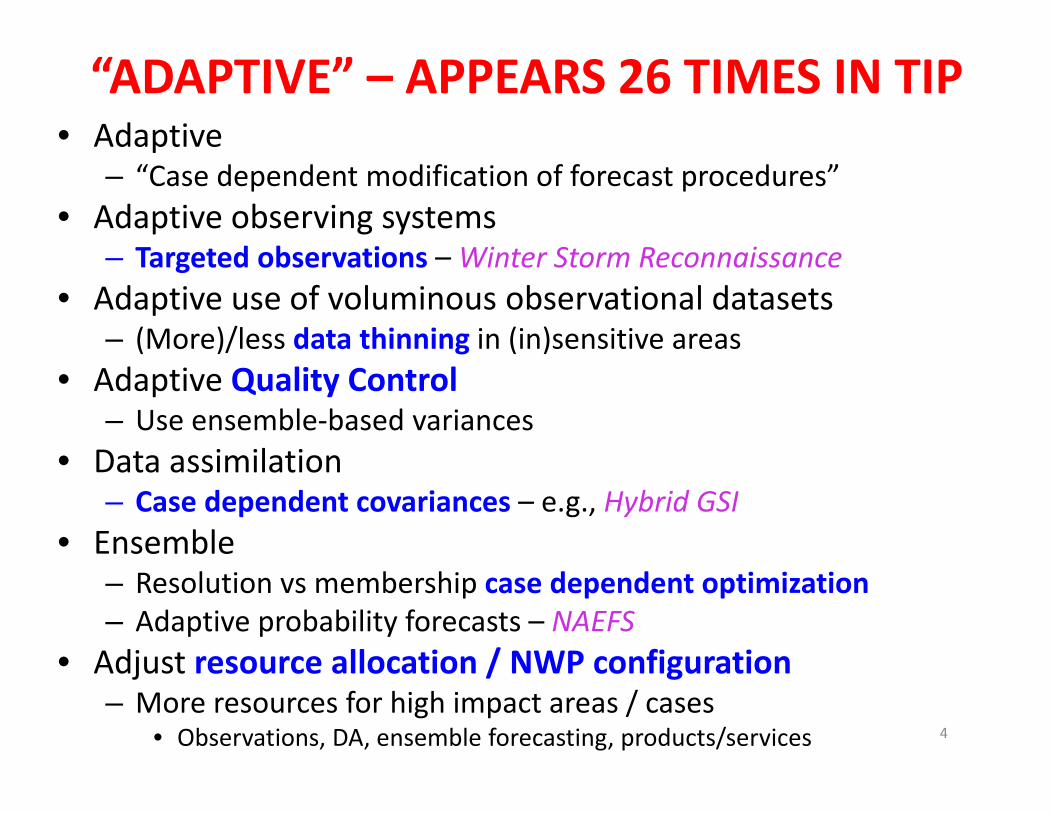
“ADAPTIVE” – APPEARS 26 TIMES IN TIP• Adaptive
– “Case dependent modification of forecast procedures”• Adaptive observing systems
– Targeted observations –Winter Storm Reconnaissance• Adaptive use of voluminous observational datasets
– (More)/less data thinning in (in)sensitive areas• Adaptive Quality Control
– Use ensemble‐based variances• Data assimilation
– Case dependent covariances – e.g., Hybrid GSI• Ensemble
– Resolution vs membership case dependent optimization– Adaptive probability forecasts – NAEFS
• Adjust resource allocation / NWP configuration– More resources for high impact areas / cases
• Observations, DA, ensemble forecasting, products/services 4
5
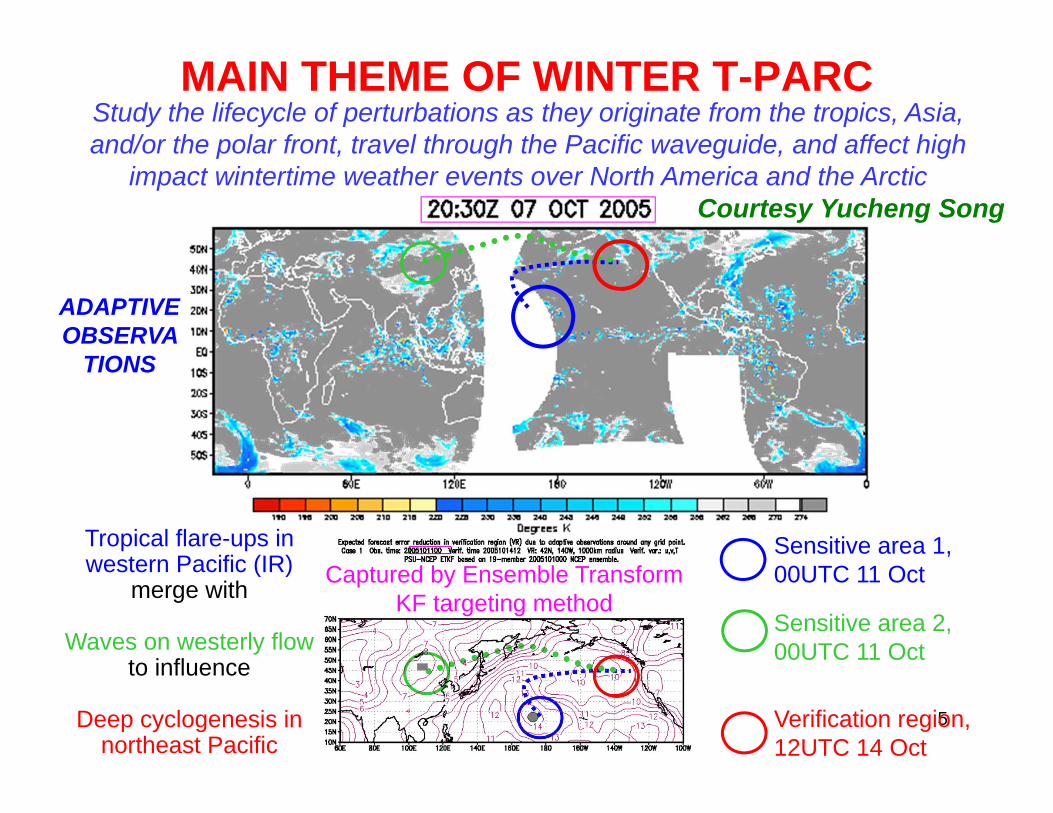
Study the lifecycle of perturbations as they originate from the tropics, Asia, and/or the polar front, travel through the Pacific waveguide, and affect high
impact wintertime weather events over North America and the Arctic
MAIN THEME OF WINTER T-PARC
Tropical flare-ups in western Pacific (IR)
merge with
Waves on westerly flowto influence
Deep cyclogenesis in northeast Pacific
Verification region, 12UTC 14 Oct
Sensitive area 1, 00UTC 11 Oct
Sensitive area 2, 00UTC 11 Oct
Captured by Ensemble Transform KF targeting method
Courtesy Yucheng Song
ADAPTIVEOBSERVA
TIONS
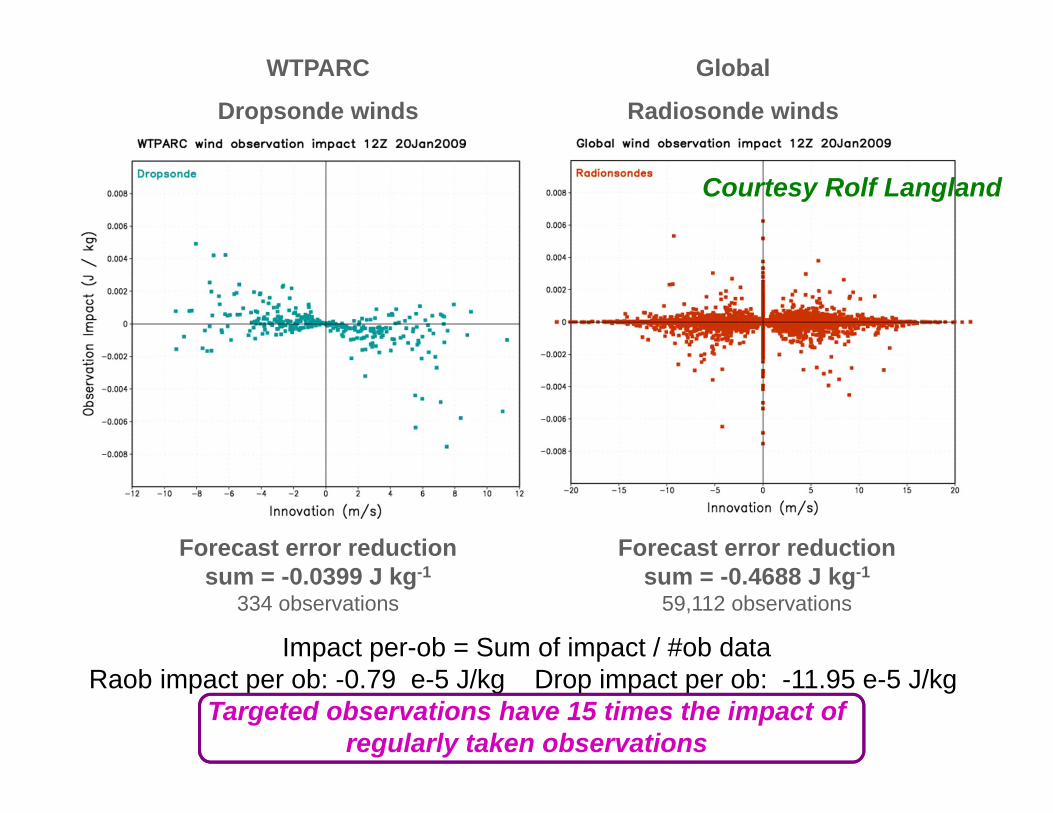
WTPARC
Dropsonde winds
Global
Radiosonde winds
Forecast error reduction sum = -0.0399 J kg-1
334 observations
Forecast error reduction sum = -0.4688 J kg-1
59,112 observations
Impact per-ob = Sum of impact / #ob dataRaob impact per ob: -0.79 e-5 J/kg Drop impact per ob: -11.95 e-5 J/kg
Targeted observations have 15 times the impact of regularly taken observations
Courtesy Rolf Langland
7
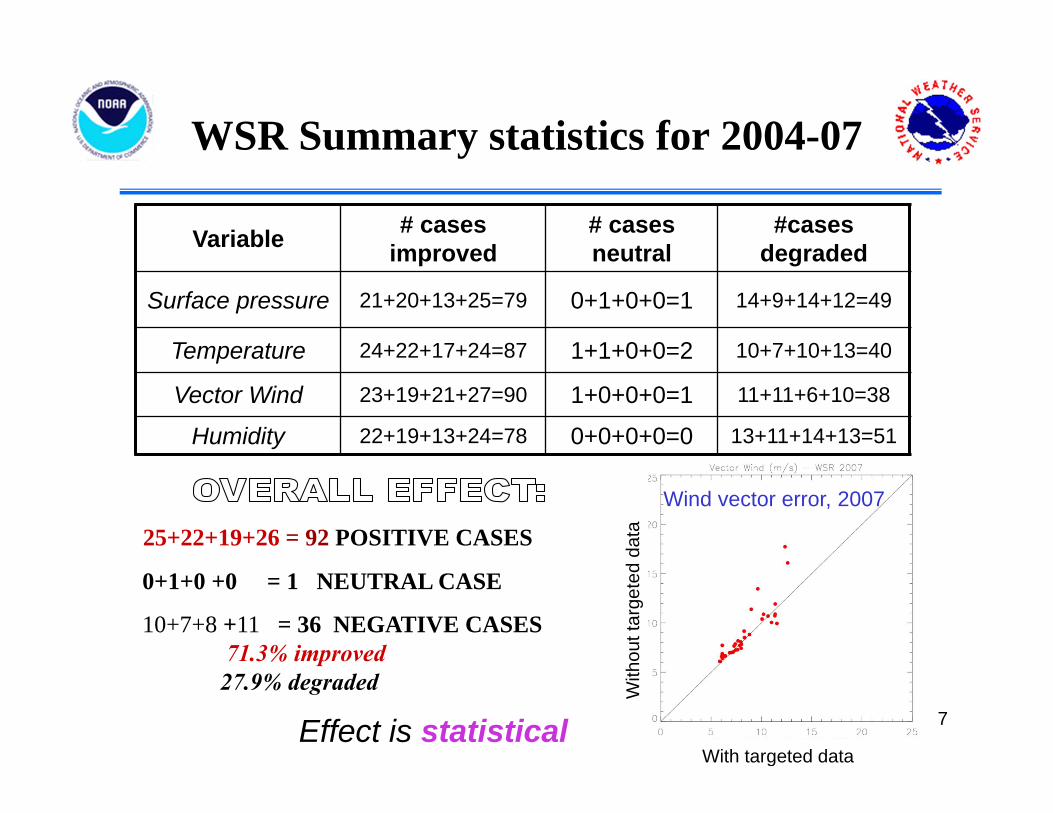
WSR Summary statistics for 2004-07
Variable # cases improved
# cases neutral
#cases degraded
Surface pressure 21+20+13+25=79 0+1+0+0=1 14+9+14+12=49
Temperature 24+22+17+24=87 1+1+0+0=2 10+7+10+13=40
Vector Wind 23+19+21+27=90 1+0+0+0=1 11+11+6+10=38
Humidity 22+19+13+24=78 0+0+0+0=0 13+11+14+13=51
25+22+19+26 = 92 POSITIVE CASES
0+1+0 +0 = 1 NEUTRAL CASE
10+7+8 +11 = 36 NEGATIVE CASES71.3% improved27.9% degraded
Wind vector error, 2007
With
out t
arge
ted
data
With targeted dataEffect is statistical
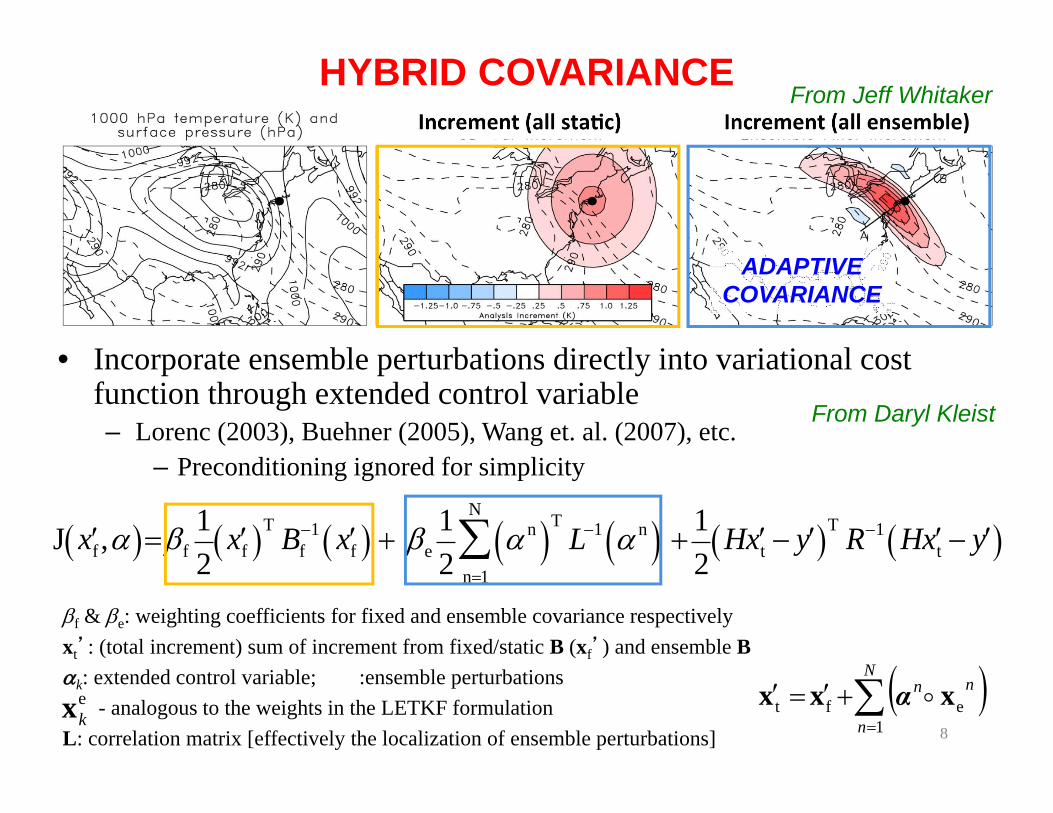
f & e: weighting coefficients for fixed and ensemble covariance respectivelyxt’: (total increment) sum of increment from fixed/static B (xf’) and ensemble B k: extended control variable; :ensemble perturbations
- analogous to the weights in the LETKF formulationL: correlation matrix [effectively the localization of ensemble perturbations] 8
HYBRID COVARIANCE
ekx
• Incorporate ensemble perturbations directly into variational cost function through extended control variable– Lorenc (2003), Buehner (2005), Wang et. al. (2007), etc.
– Preconditioning ignored for simplicity
J xf , f12
xf T Bf1 xf e
12
n TL1 n
n1
N
12
H xt y T R1 H xt y
N
n
nn
1eft xxx α
From Daryl Kleist
From Jeff Whitaker
ADAPTIVECOVARIANCE
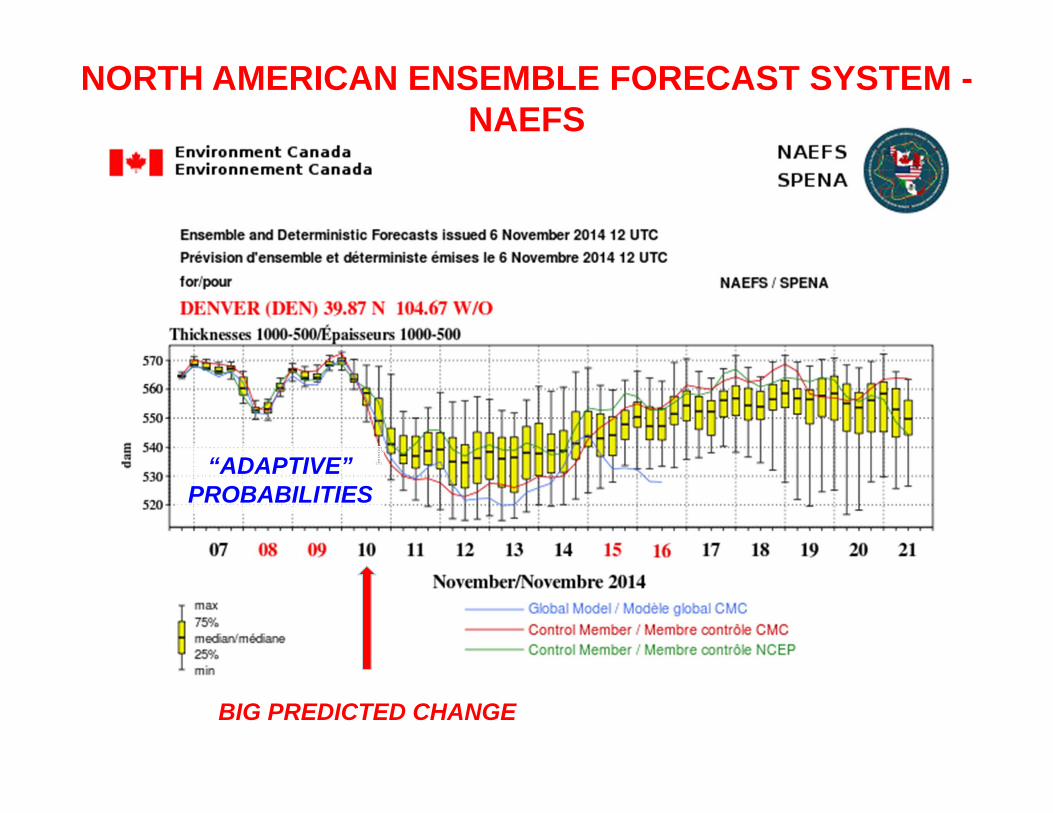
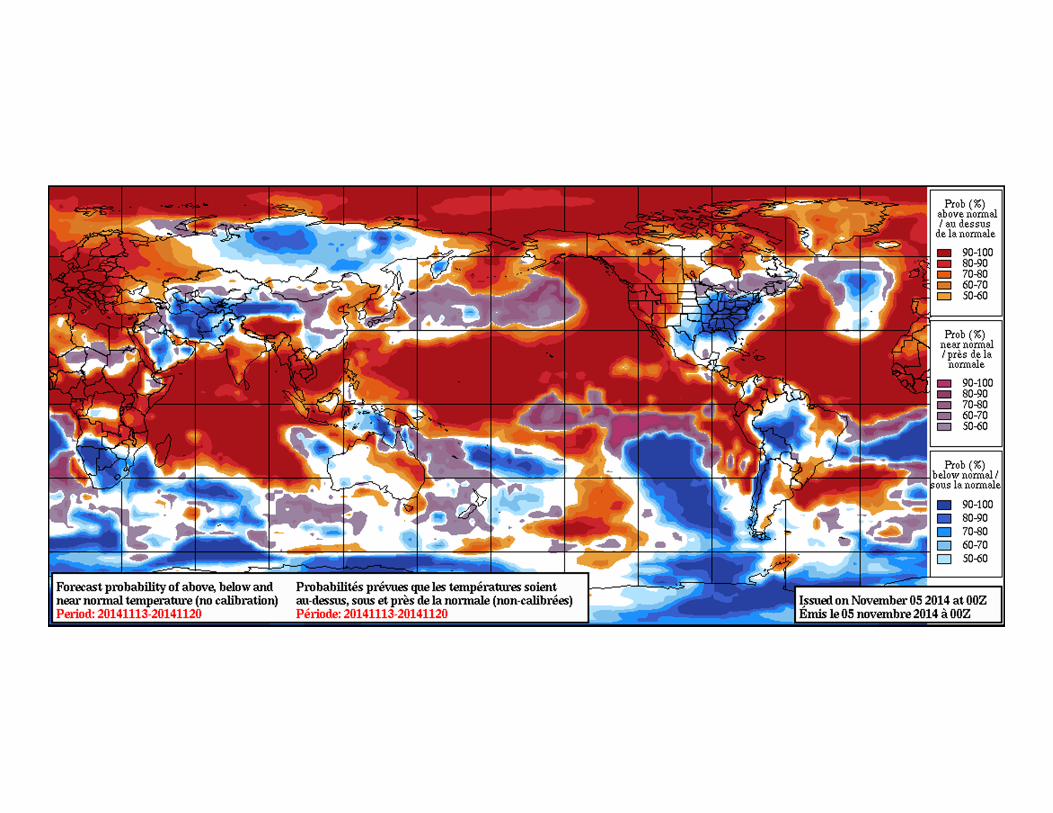
“ADAPTIVE”PROBABILITIES
BIG PREDICTED CHANGE
NORTH AMERICAN ENSEMBLE FORECAST SYSTEM -NAEFS
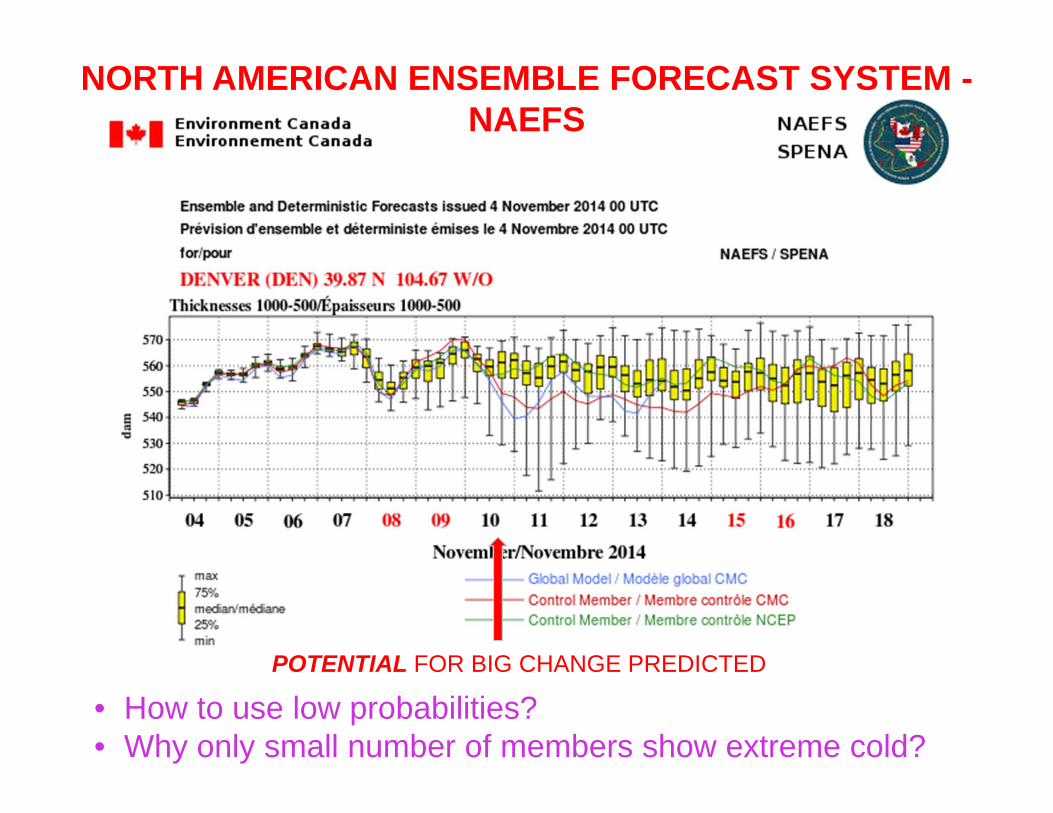
POTENTIAL FOR BIG CHANGE PREDICTED
• How to use low probabilities?• Why only small number of members show extreme cold?
NORTH AMERICAN ENSEMBLE FORECAST SYSTEM -NAEFS

NORTH AMERICAN ENSEMBLE FORECAST SYSTEM -NAEFS
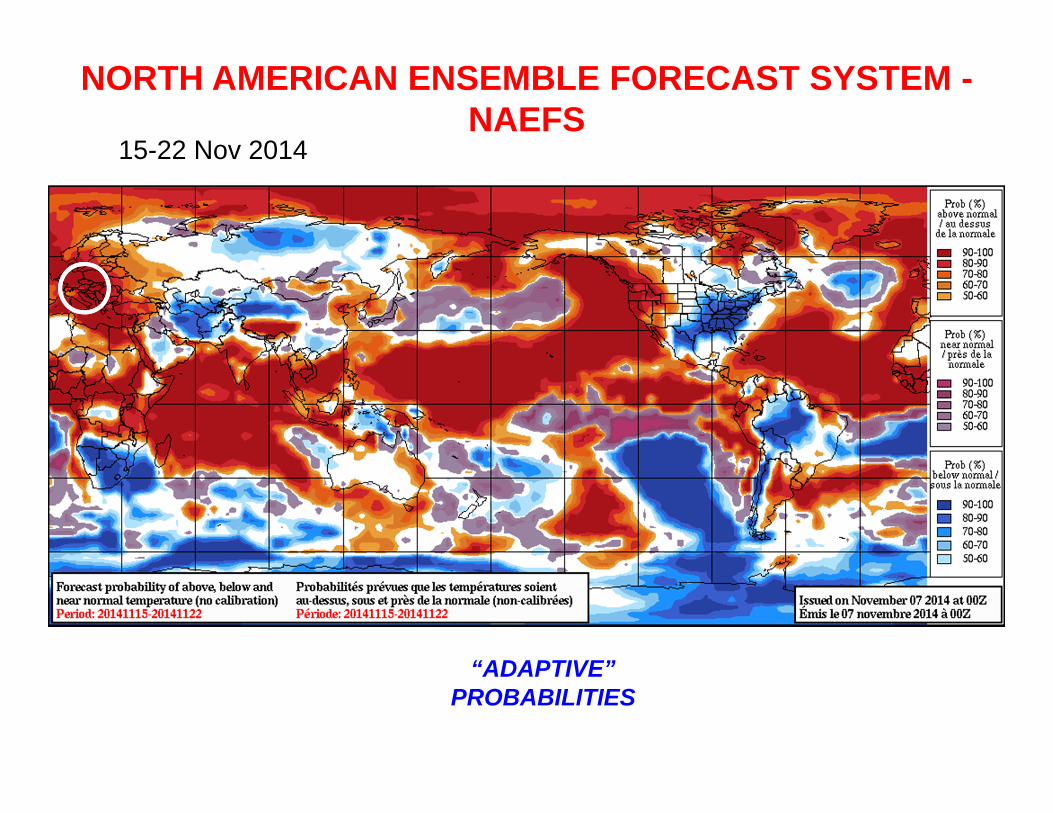
“ADAPTIVE”PROBABILITIES
NORTH AMERICAN ENSEMBLE FORECAST SYSTEM -NAEFS
15-22 Nov 2014
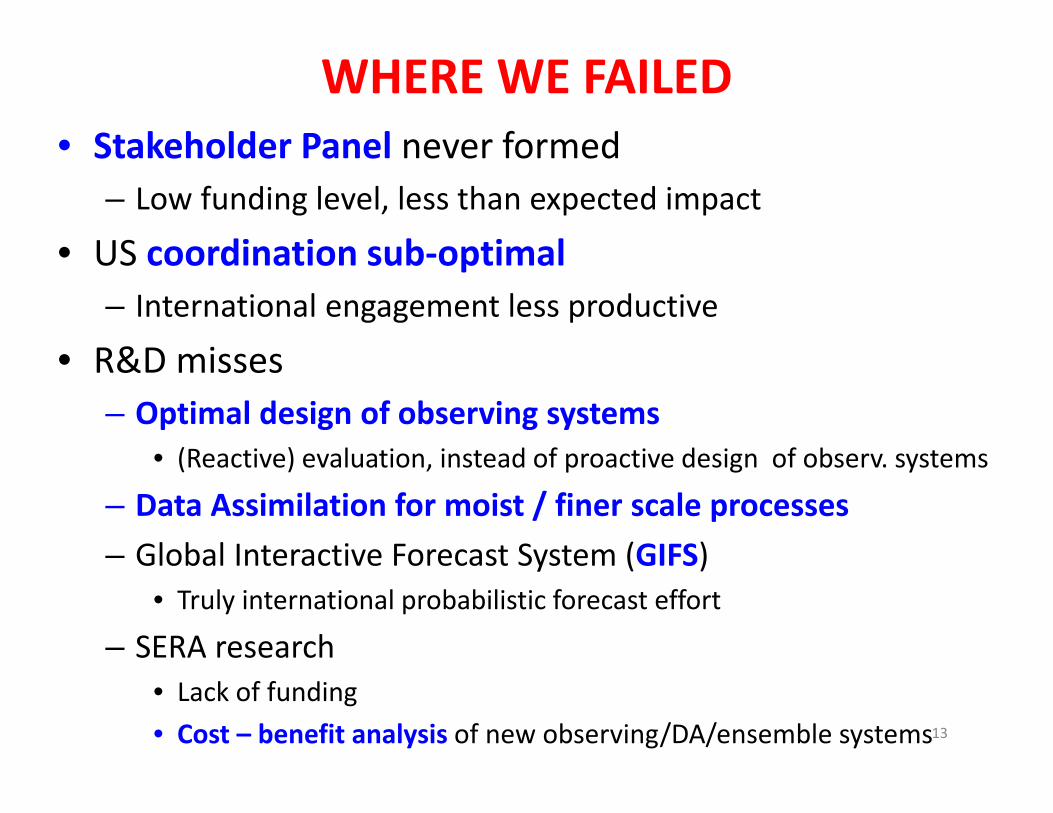
WHERE WE FAILED• Stakeholder Panel never formed
– Low funding level, less than expected impact
• US coordination sub‐optimal– International engagement less productive
• R&D misses– Optimal design of observing systems
• (Reactive) evaluation, instead of proactive design of observ. systems
– Data Assimilation for moist / finer scale processes– Global Interactive Forecast System (GIFS)
• Truly international probabilistic forecast effort
– SERA research• Lack of funding• Cost – benefit analysis of new observing/DA/ensemble systems13
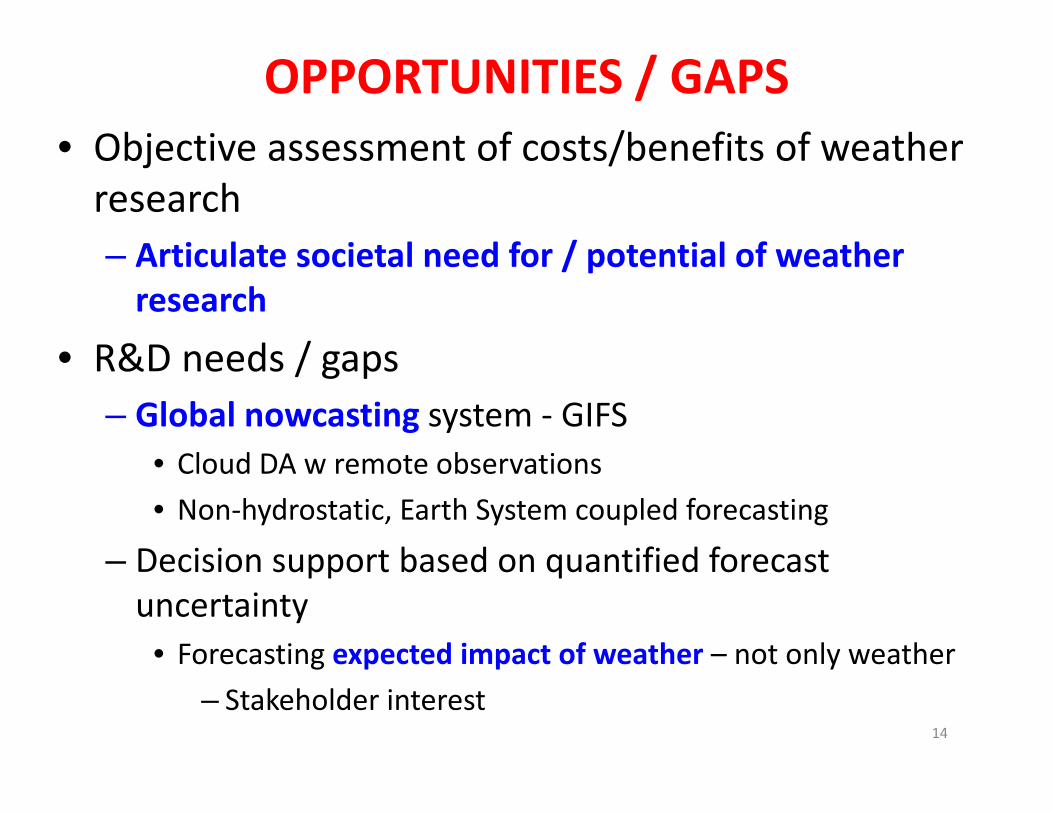
OPPORTUNITIES / GAPS• Objective assessment of costs/benefits of weather research– Articulate societal need for / potential of weather research
• R&D needs / gaps– Global nowcasting system ‐ GIFS
• Cloud DA w remote observations• Non‐hydrostatic, Earth System coupled forecasting
– Decision support based on quantified forecast uncertainty
• Forecasting expected impact of weather – not only weather– Stakeholder interest
14
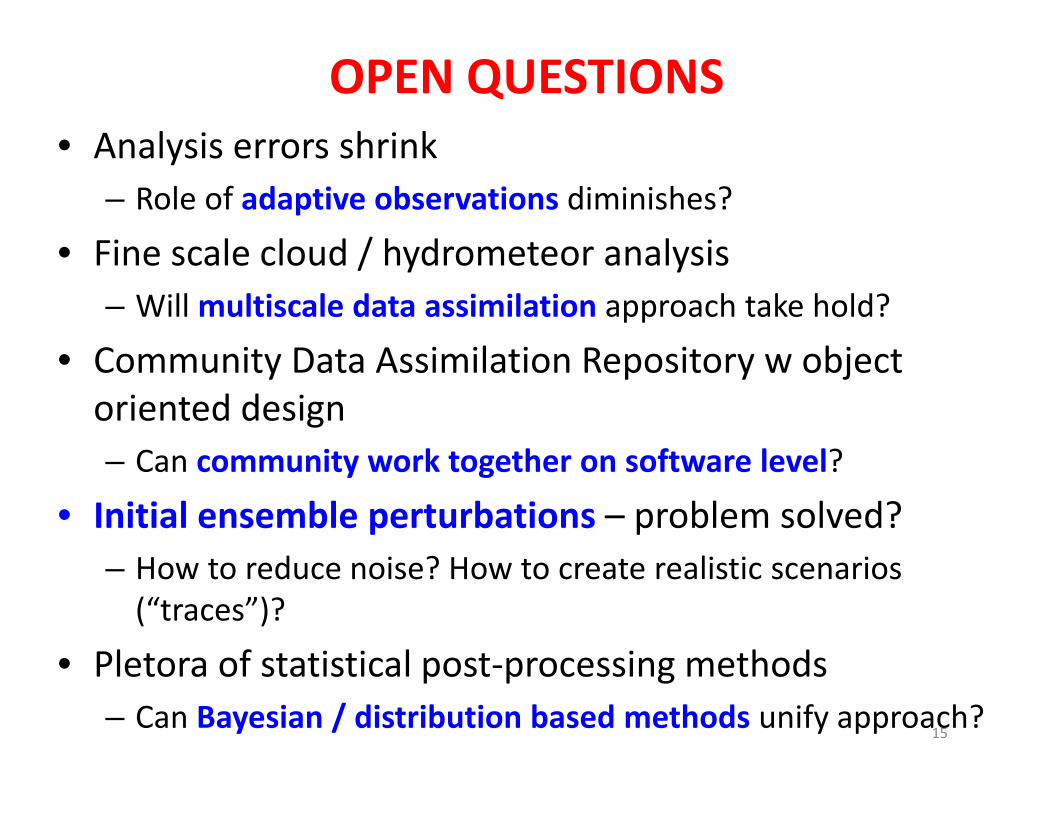
OPEN QUESTIONS• Analysis errors shrink
– Role of adaptive observations diminishes?
• Fine scale cloud / hydrometeor analysis– Will multiscale data assimilation approach take hold?
• Community Data Assimilation Repository w object oriented design– Can community work together on software level?
• Initial ensemble perturbations – problem solved?– How to reduce noise? How to create realistic scenarios (“traces”)?
• Pletora of statistical post‐processing methods– Can Bayesian / distribution based methods unify approach?
15

OPEN QUESTION ‐ 1Role of adaptive observations diminishes?
• NWP changes in past decade (Hamill et al)– More extensive observing networks
• Better use of satellite data
– Improved DA• 4DVAR in most places
– Improved model first guess• Physics etc better captured
• Result– Reduced analysis errors
16
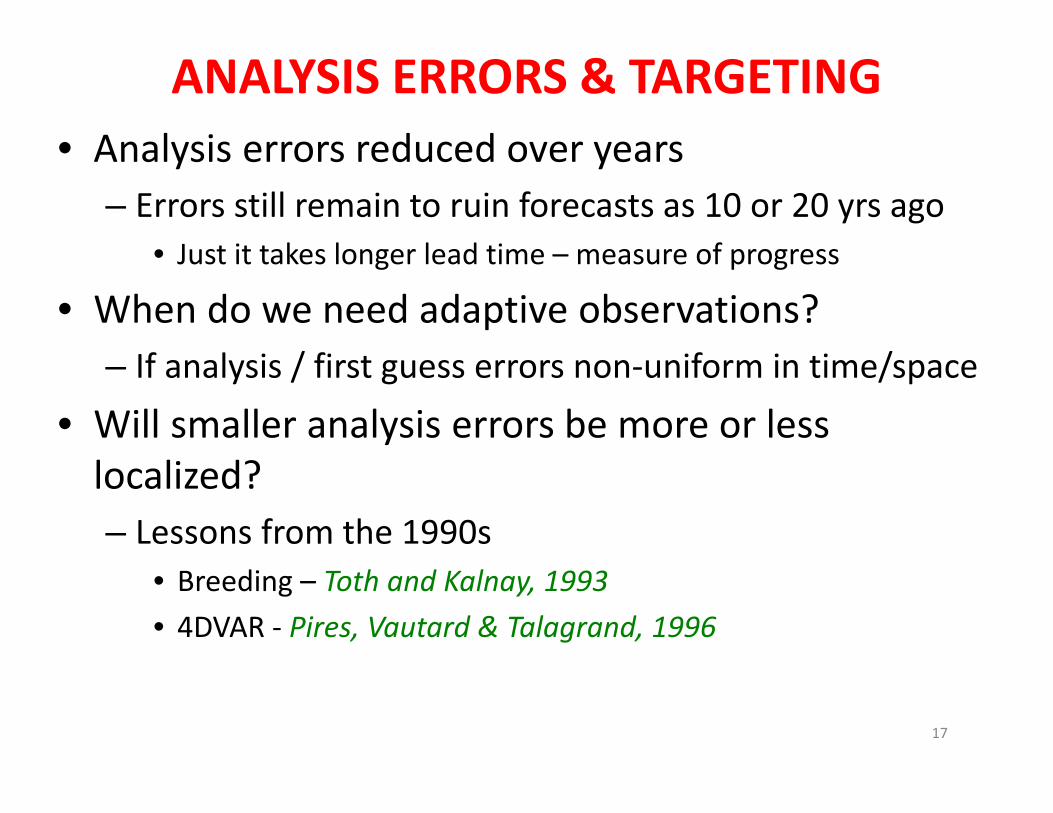
ANALYSIS ERRORS & TARGETING• Analysis errors reduced over years
– Errors still remain to ruin forecasts as 10 or 20 yrs ago• Just it takes longer lead time – measure of progress
• When do we need adaptive observations?– If analysis / first guess errors non‐uniform in time/space
• Will smaller analysis errors be more or less localized?– Lessons from the 1990s
• Breeding – Toth and Kalnay, 1993• 4DVAR ‐ Pires, Vautard & Talagrand, 1996
17
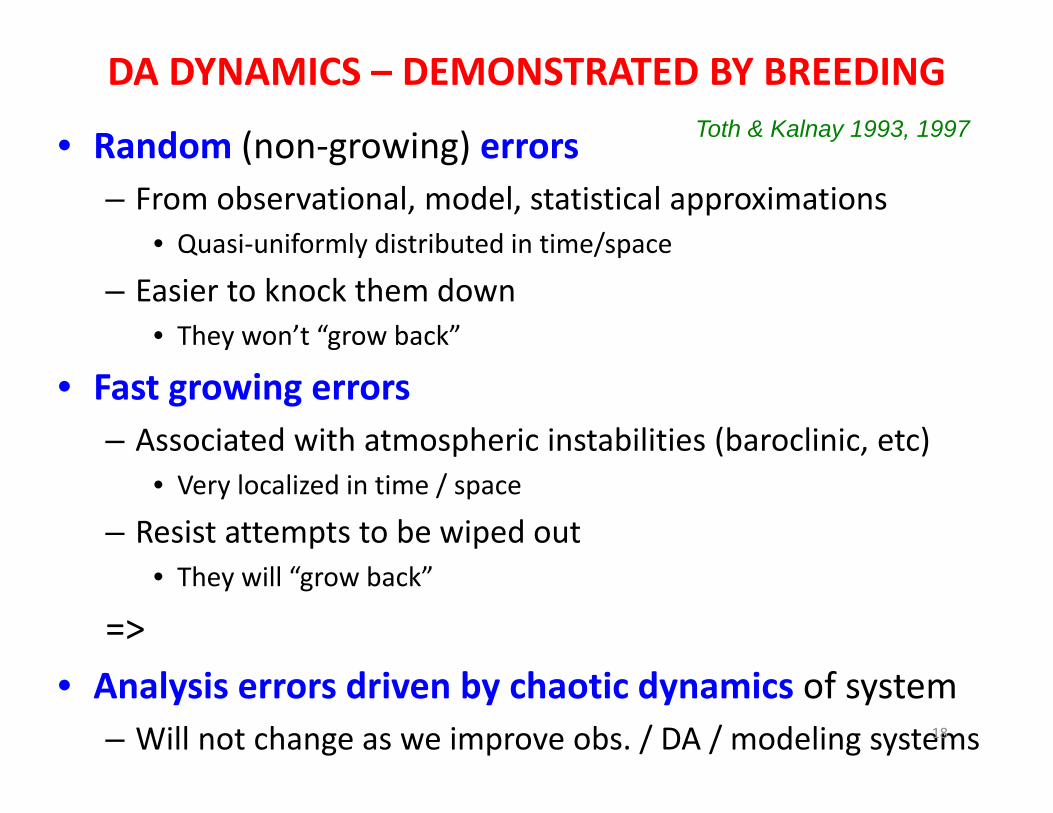
DA DYNAMICS – DEMONSTRATED BY BREEDING
• Random (non‐growing) errors– From observational, model, statistical approximations
• Quasi‐uniformly distributed in time/space
– Easier to knock them down• They won’t “grow back”
• Fast growing errors– Associated with atmospheric instabilities (baroclinic, etc)
• Very localized in time / space
– Resist attempts to be wiped out• They will “grow back”
=>• Analysis errors driven by chaotic dynamics of system
– Will not change as we improve obs. / DA / modeling systems18
Toth & Kalnay 1993, 1997
19
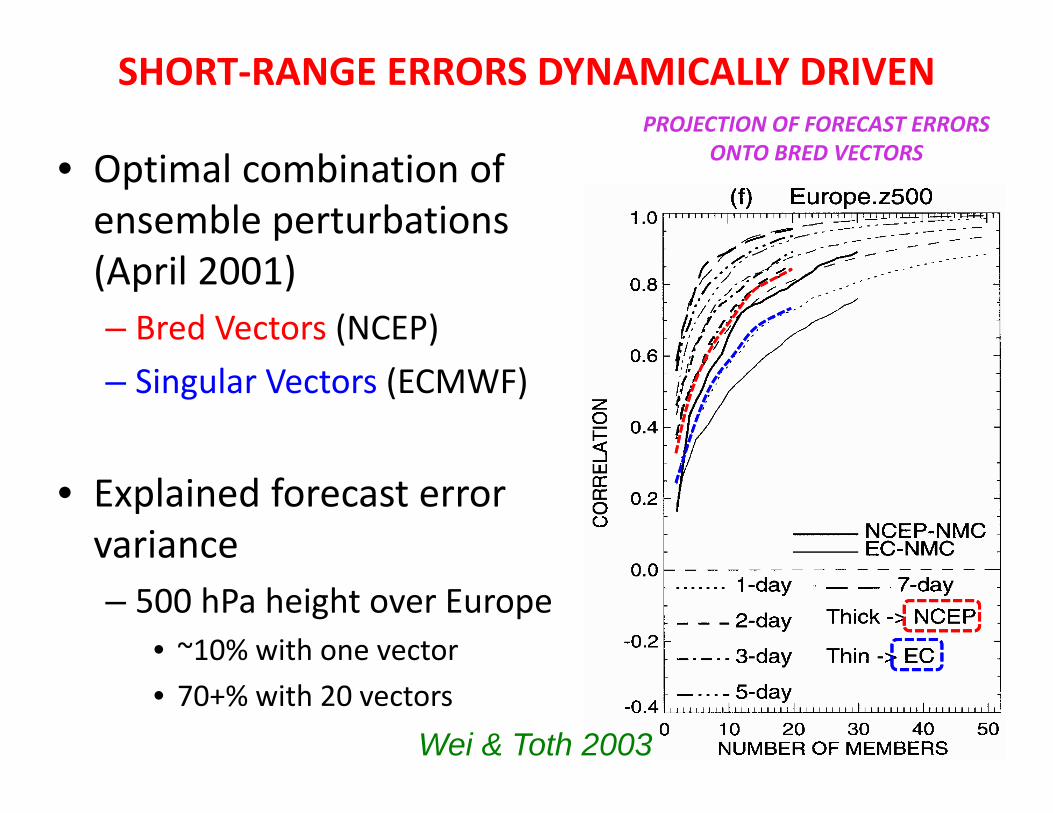
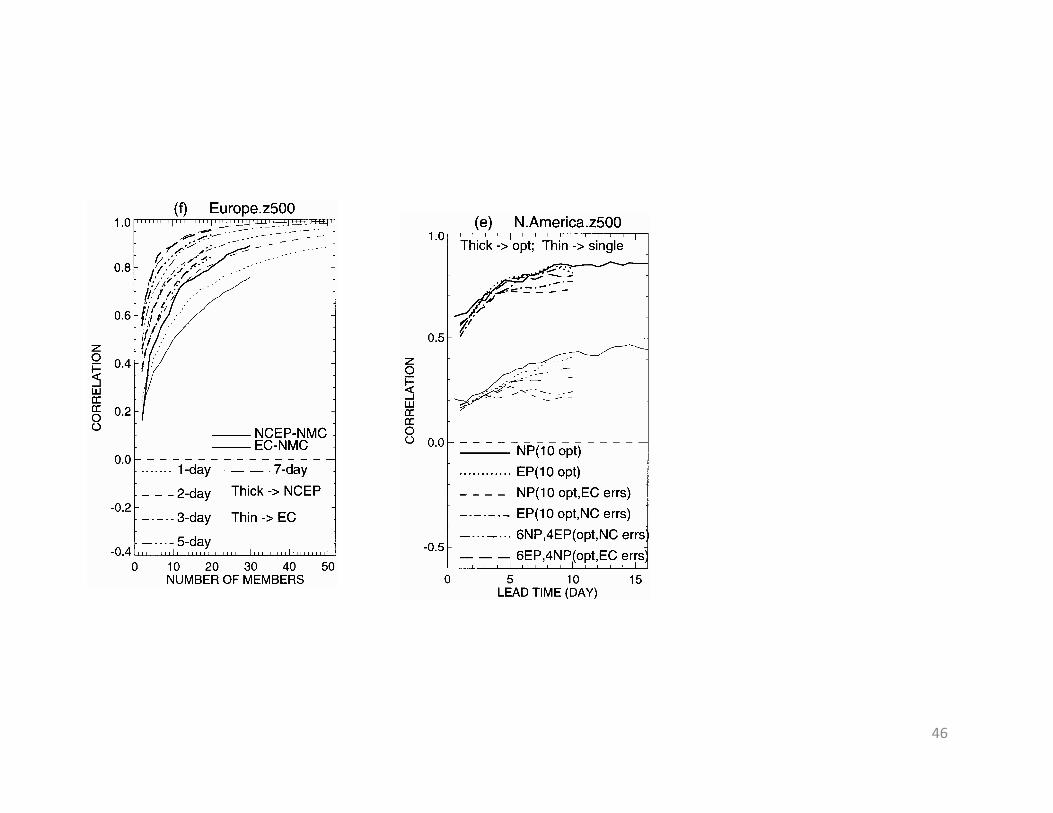
SHORT‐RANGE ERRORS DYNAMICALLY DRIVEN
• Optimal combination of ensemble perturbations (April 2001)– Bred Vectors (NCEP)– Singular Vectors (ECMWF)
• Explained forecast error variance– 500 hPa height over Europe
• ~10% with one vector• 70+% with 20 vectors
PROJECTION OF FORECAST ERRORS ONTO BRED VECTORS
Wei & Toth 2003
20
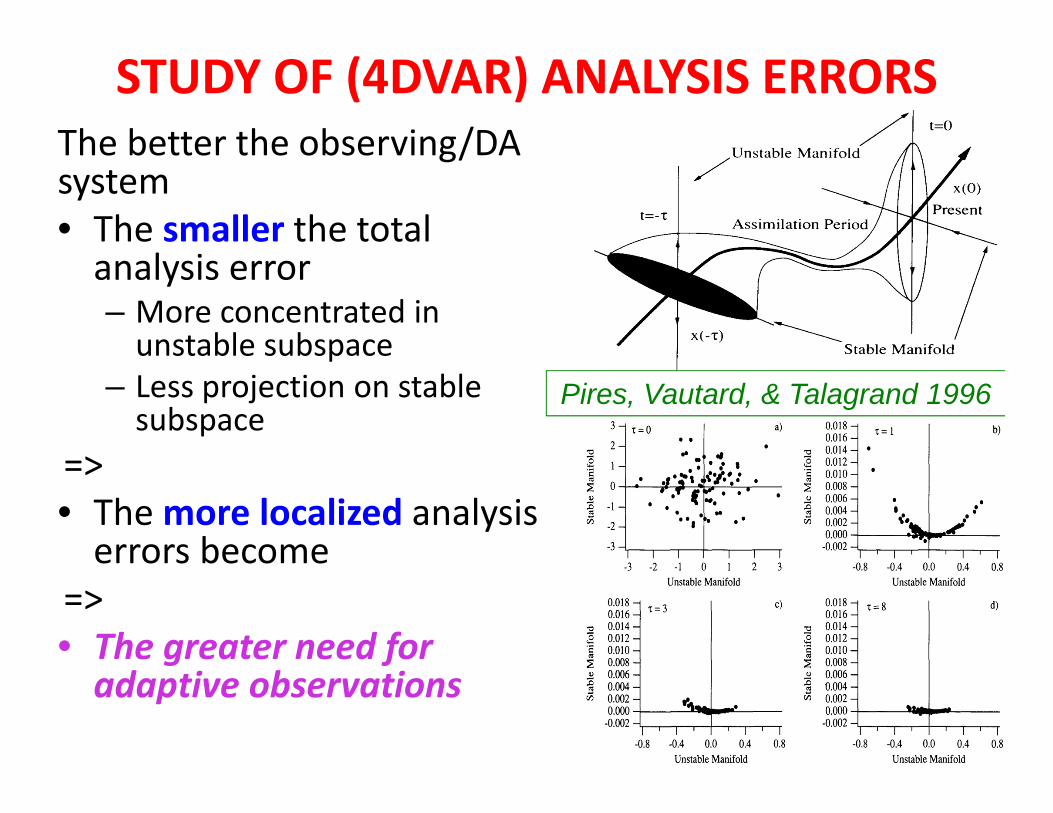
STUDY OF (4DVAR) ANALYSIS ERRORSThe better the observing/DA system• The smaller the total analysis error– More concentrated in unstable subspace
– Less projection on stable subspace
=>• The more localized analysis errors become
=>• The greater need for adaptive observations
Pires, Vautard, & Talagrand 1996
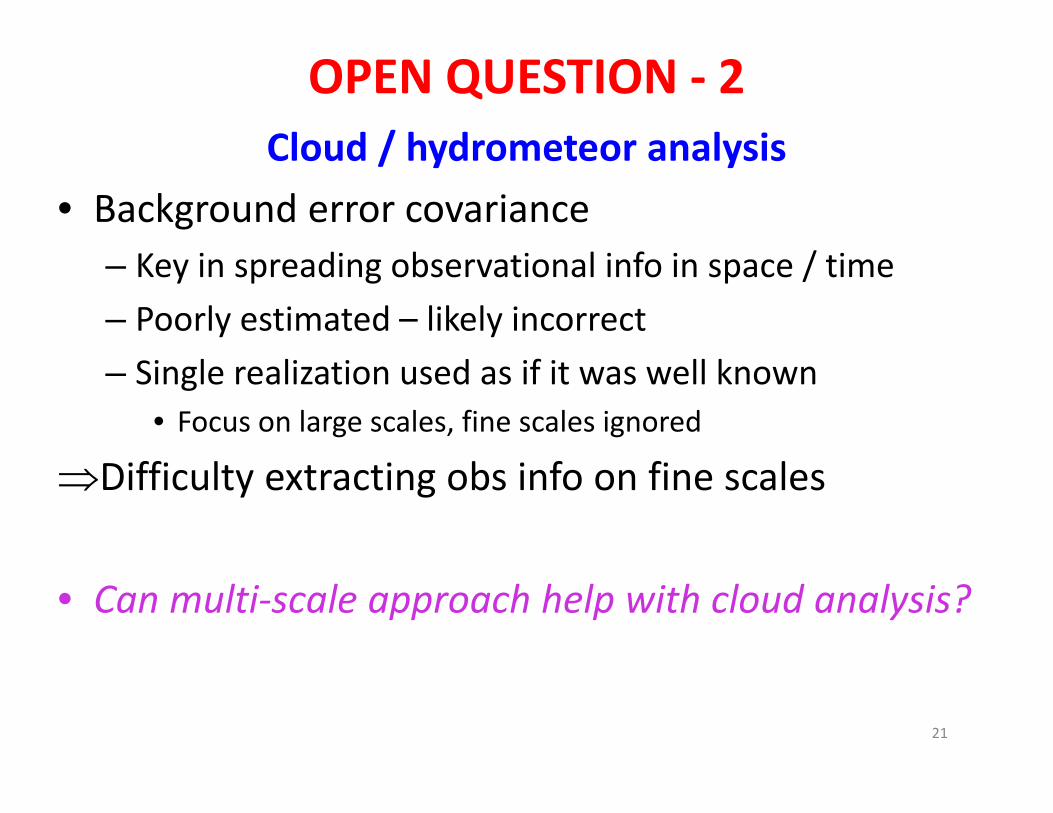
OPEN QUESTION ‐ 2Cloud / hydrometeor analysis
• Background error covariance– Key in spreading observational info in space / time– Poorly estimated – likely incorrect– Single realization used as if it was well known
• Focus on large scales, fine scales ignored
Difficulty extracting obs info on fine scales
• Can multi‐scale approach help with cloud analysis?
21
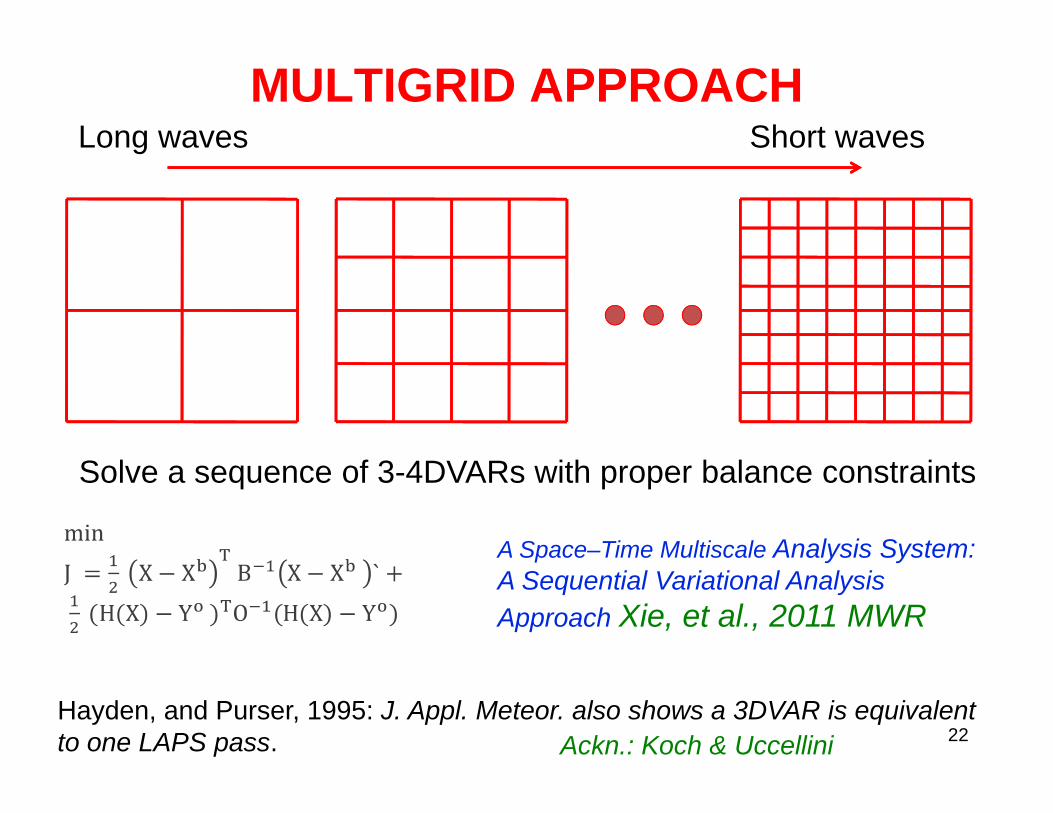
Solve a sequence of 3-4DVARs with proper balance constraints
Long waves Short waves
22
MULTIGRID APPROACH
A Space–Time Multiscale Analysis System: A Sequential Variational Analysis Approach Xie, et al., 2011 MWR
Hayden, and Purser, 1995: J. Appl. Meteor. also shows a 3DVAR is equivalent to one LAPS pass. Ackn.: Koch & Uccellini
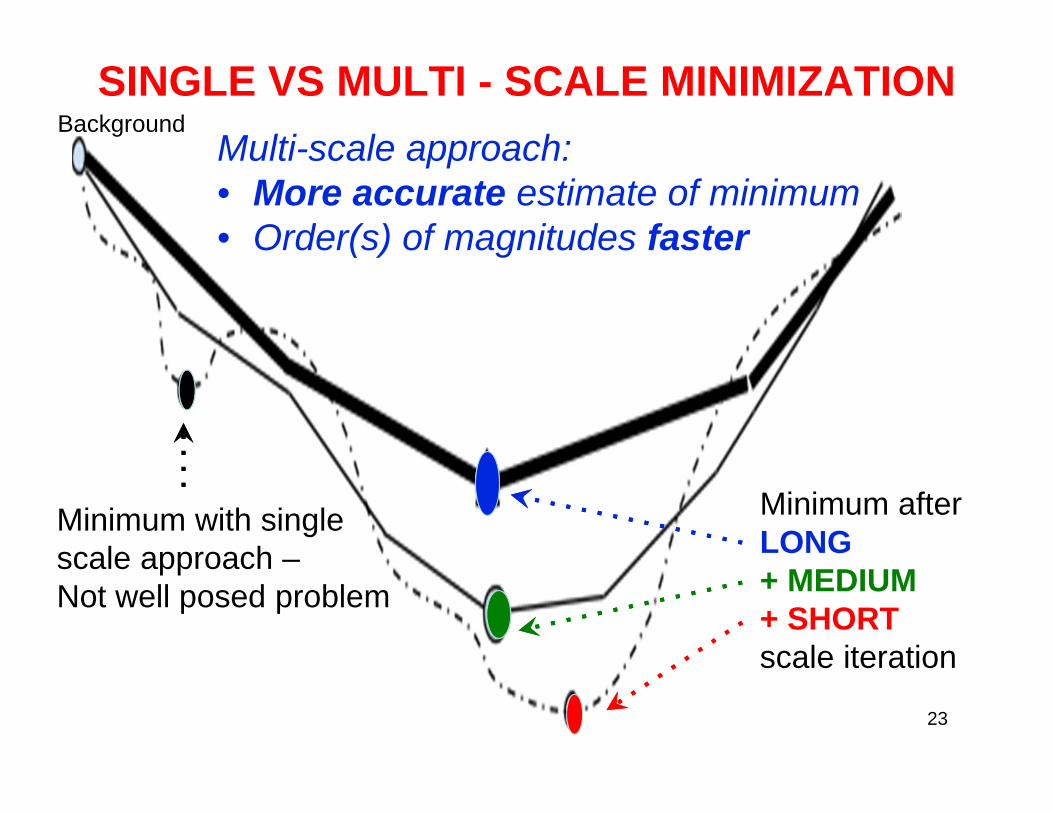
SINGLE VS MULTI - SCALE MINIMIZATION
Minimum with single scale approach –Not well posed problem
Minimum afterLONG + MEDIUM + SHORT scale iteration
Multi-scale approach:• More accurate estimate of minimum• Order(s) of magnitudes faster
Background
23
24
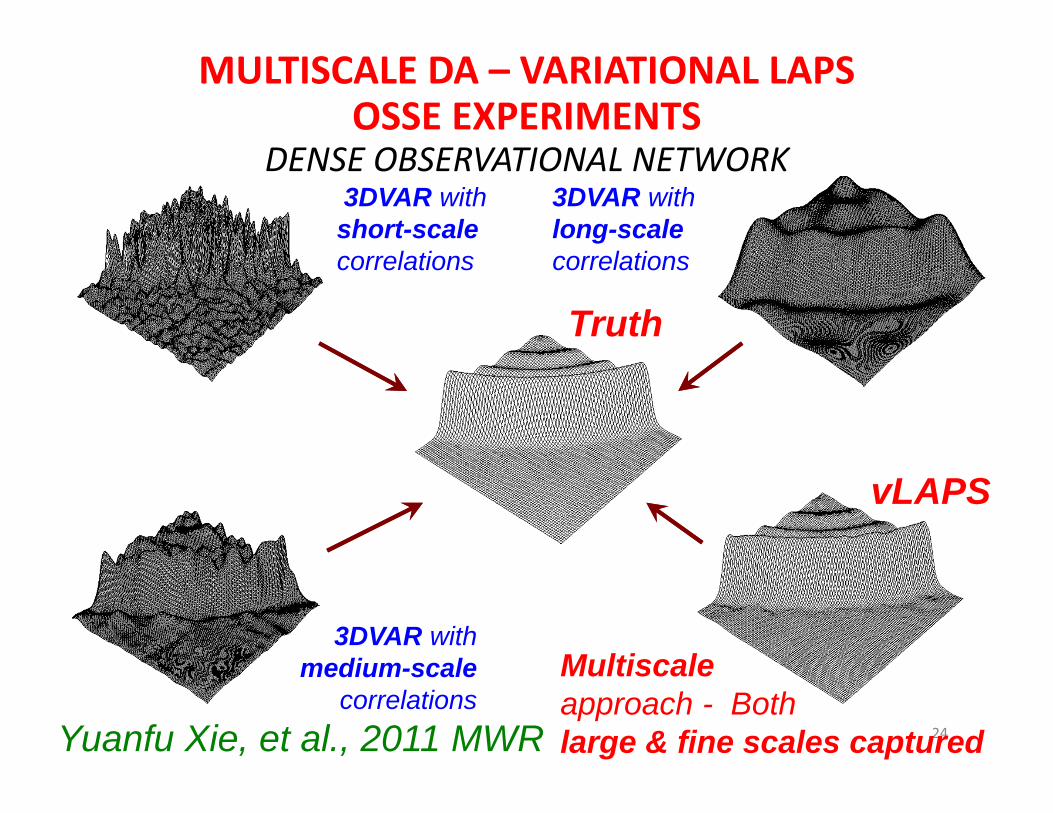
MULTISCALE DA – VARIATIONAL LAPSOSSE EXPERIMENTS
DENSE OBSERVATIONAL NETWORK
Truth
3DVAR withshort-scalecorrelations
3DVAR with medium-scale
correlationsMultiscaleapproach - Bothlarge & fine scales captured
3DVAR withlong-scalecorrelations
vLAPS
Yuanfu Xie, et al., 2011 MWR
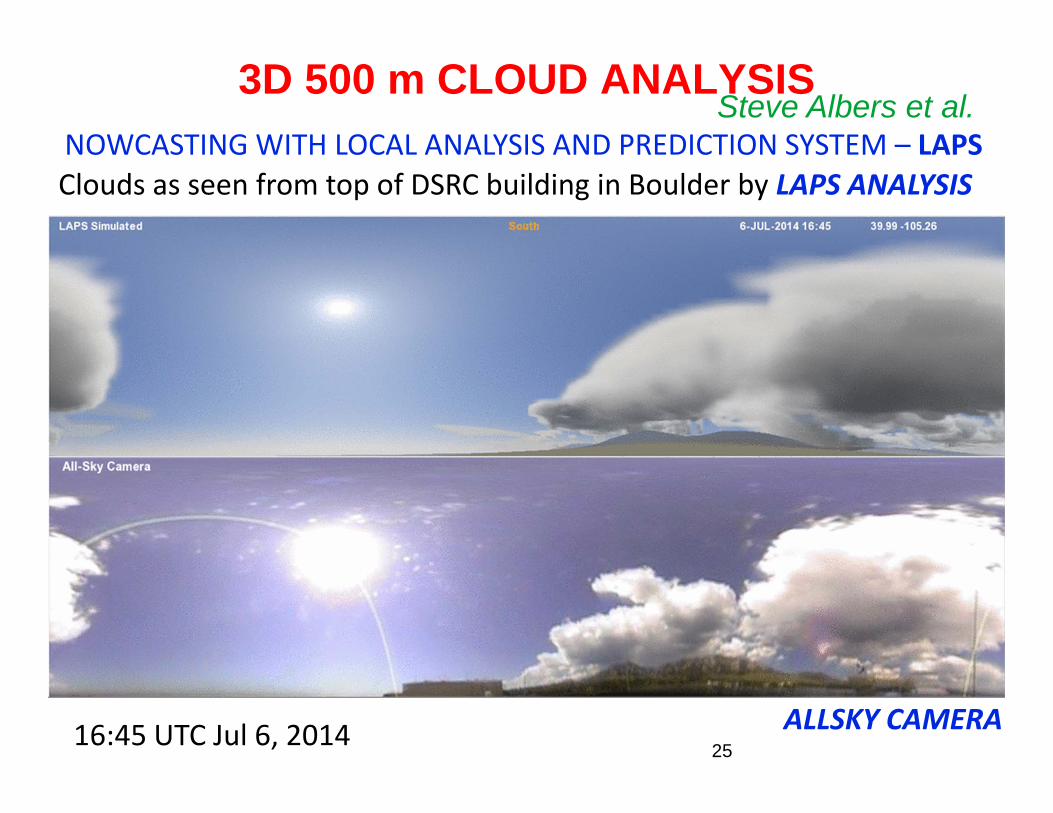
3D 500 m CLOUD ANALYSIS
Clouds as seen from top of DSRC building in Boulder by LAPS ANALYSIS
ALLSKY CAMERA16:45 UTC Jul 6, 2014 25
NOWCASTING WITH LOCAL ANALYSIS AND PREDICTION SYSTEM – LAPSSteve Albers et al.
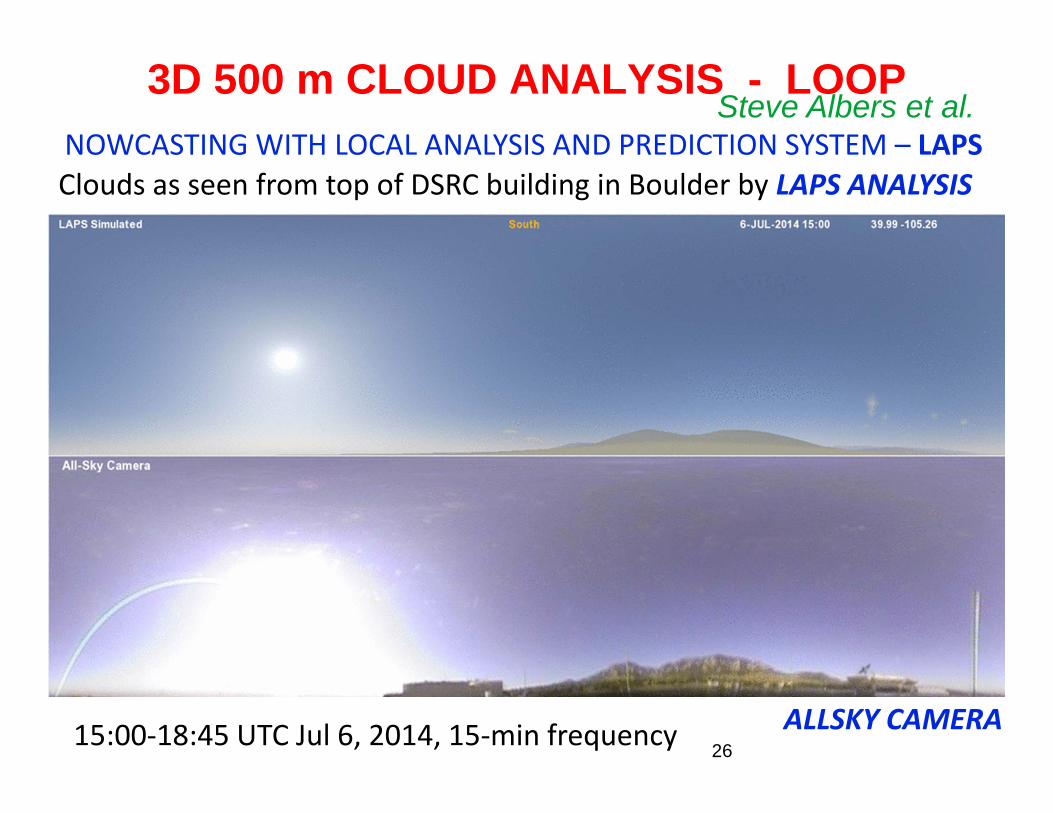
3D 500 m CLOUD ANALYSIS - LOOPSteve Albers et al.
NOWCASTING WITH LOCAL ANALYSIS AND PREDICTION SYSTEM – LAPSClouds as seen from top of DSRC building in Boulder by LAPS ANALYSIS
ALLSKY CAMERA15:00‐18:45 UTC Jul 6, 2014, 15‐min frequency 26
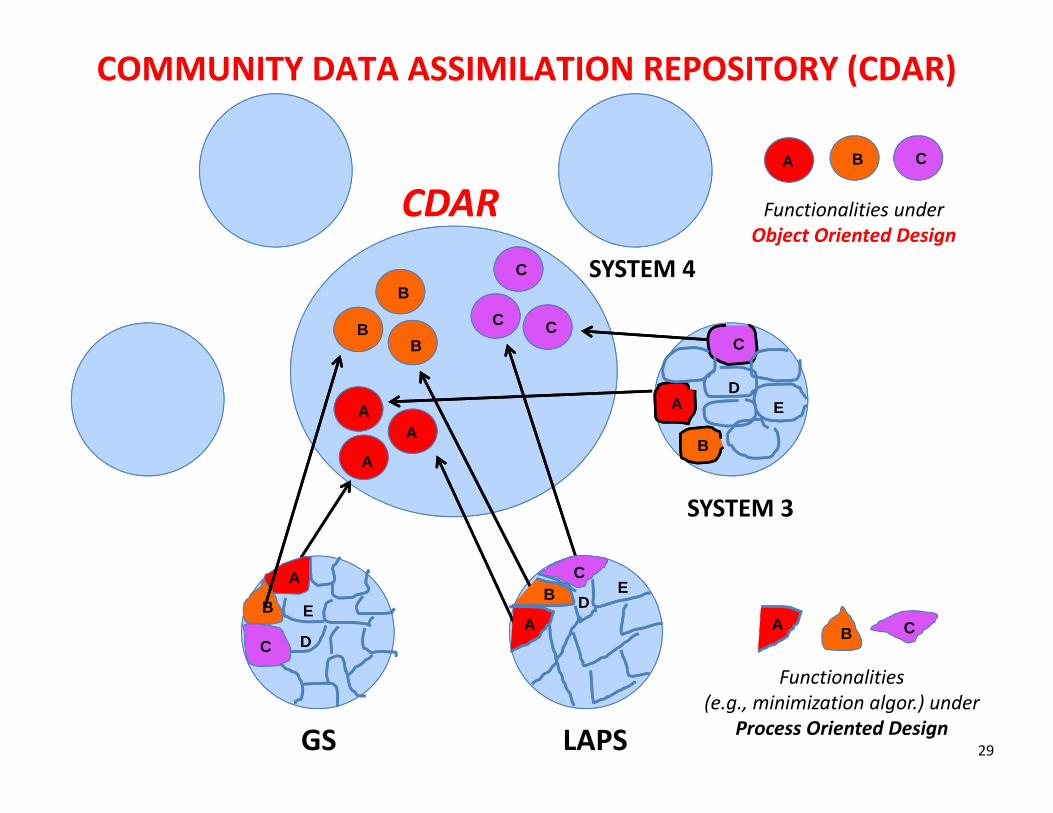
OPEN QUESTION ‐ 3Collaboration on software level
• Levels of possible collaboration– Discussions – exchange ideas– Science literature – exchange algorithms– Working together – exchange software
• Want to accelerate R&D / R2O– Need to move beyond exchanging ideas / algorithms
• Data assimilation example– Community Data Assimilation Repository (CDAR)
• Can object oriented software design facilitate more substantial national / international collaboration?27
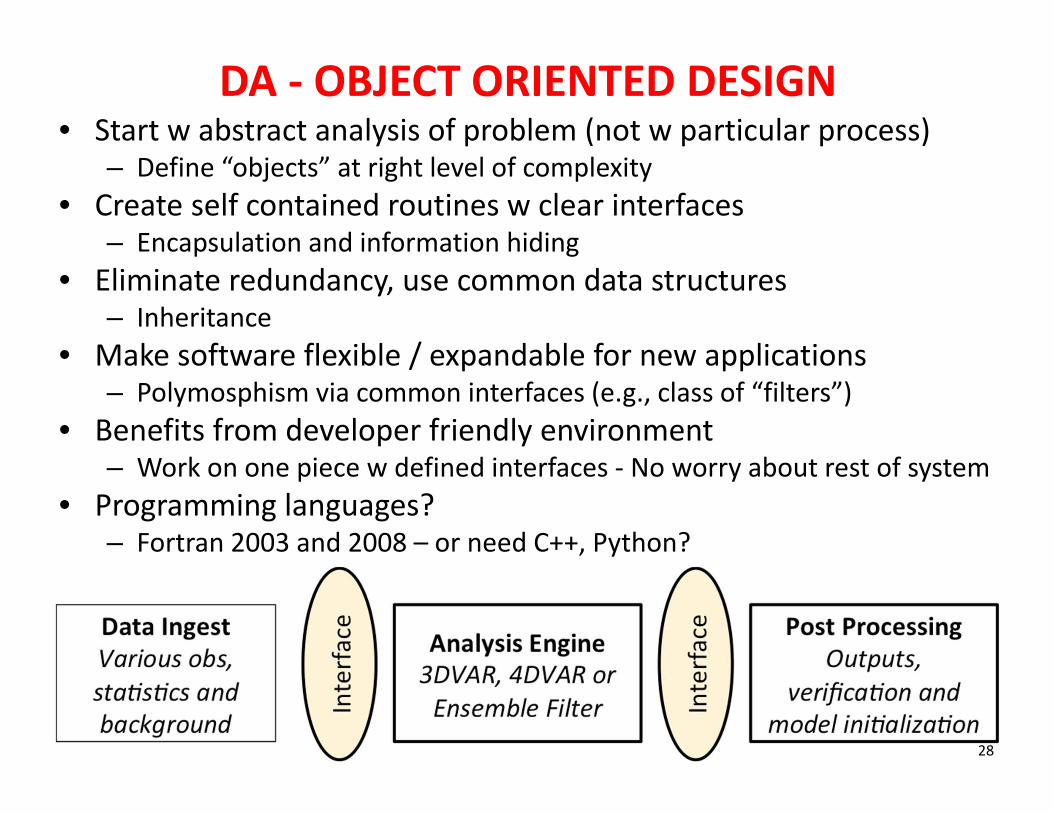
DA ‐ OBJECT ORIENTED DESIGN
28
• Start w abstract analysis of problem (not w particular process)– Define “objects” at right level of complexity
• Create self contained routines w clear interfaces– Encapsulation and information hiding
• Eliminate redundancy, use common data structures– Inheritance
• Make software flexible / expandable for new applications– Polymosphism via common interfaces (e.g., class of “filters”)
• Benefits from developer friendly environment– Work on one piece w defined interfaces ‐ No worry about rest of system
• Programming languages?– Fortran 2003 and 2008 – or need C++, Python?
GS LAPS
CDAR
D
D
D
E
E
C
E
C
C
A
A
A
B
BB C
A
B
A
BCA
B
C
COMMUNITY DATA ASSIMILATION REPOSITORY (CDAR)
SYSTEM 4
SYSTEM 3
29
A
Functionalities(e.g., minimization algor.) under
Process Oriented Design
B C
CA B
Functionalities underObject Oriented Design
OPEN QUESTION ‐ 4
Problem of initial ensemble perturbations solved?• Succession of approaches
– SVs, Bred vectors, multiple analyses, ensemble filters• Each w some (un)desirable features• Like fashions, community latched on them in succession
• Largest impact at short lead times – later no big differences
• Today, ensemble filters favored approach in US
• This is it?30
INITIAL ENSEMBLE PERTURBATION REQUIREMENTS ‐HOW ENSEMBLE FILTERS FARE?
• Sample analysis uncertainty– In its own analysis – not if used in ¾ dvar hybrid analysis
• Dynamically constrained– Presence of noise hinders DA applications
• Realistic sequences / alternative scenarios– For driving land / hydro / wave / ice ensemble applicatns– Not available
• No memory in time series of perturbed analyses
• Computational efficiency / parsimony– More complex DA problem solved
• Two background terms justified in analysis Eq.?– Primary product – state estimate – thrown out in hybrid
• Are there alternatives with better scorecard? 31
OPEN QUESTION ‐ 5
Is there any “order” in statistical post‐processing?• Problem
– Link model prognostic variables with observed / analyzed user variables
• Potpourie of approaches / acronyms– Perfect prog, MOS, EKDMOS, BMA
• Which to use for what problem?– Careful analysis of problems lacking?
• Search for scientifically sound approach(es)32
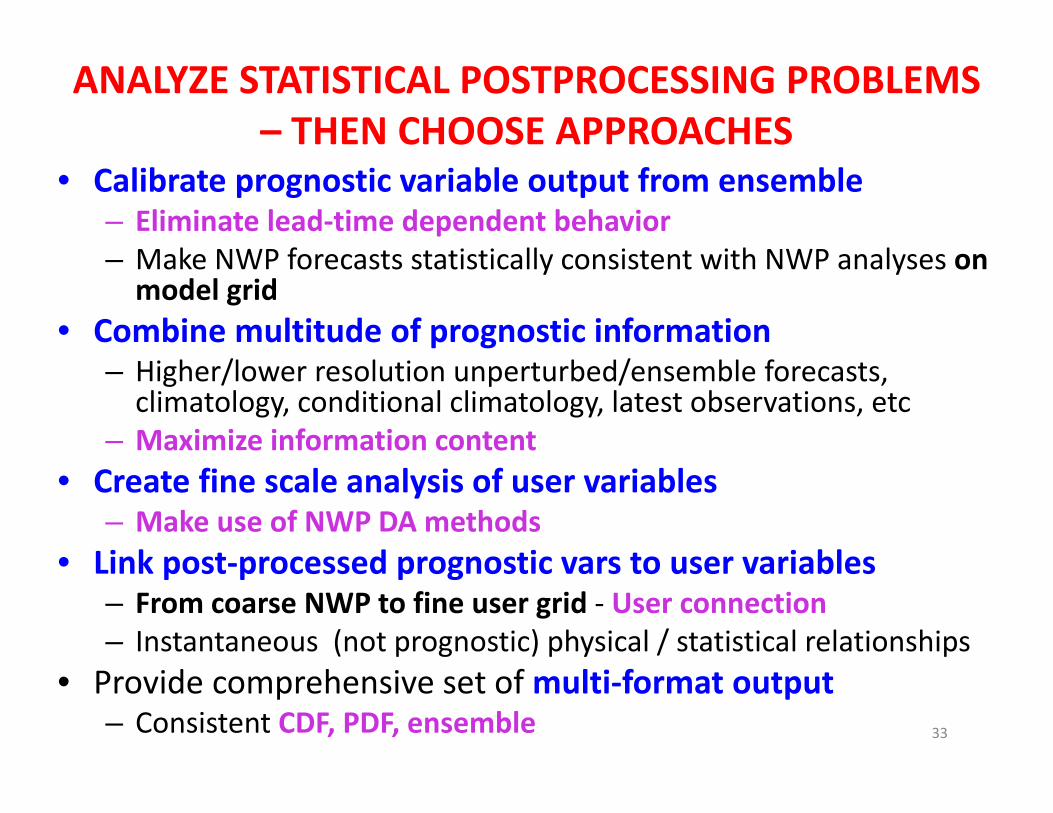
ANALYZE STATISTICAL POSTPROCESSING PROBLEMS – THEN CHOOSE APPROACHES
• Calibrate prognostic variable output from ensemble– Eliminate lead‐time dependent behavior– Make NWP forecasts statistically consistent with NWP analyses onmodel grid
• Combine multitude of prognostic information– Higher/lower resolution unperturbed/ensemble forecasts, climatology, conditional climatology, latest observations, etc
– Maximize information content• Create fine scale analysis of user variables
– Make use of NWP DA methods• Link post‐processed prognostic vars to user variables
– From coarse NWP to fine user grid ‐ User connection– Instantaneous (not prognostic) physical / statistical relationships
• Provide comprehensive set of multi‐format output– Consistent CDF, PDF, ensemble 33
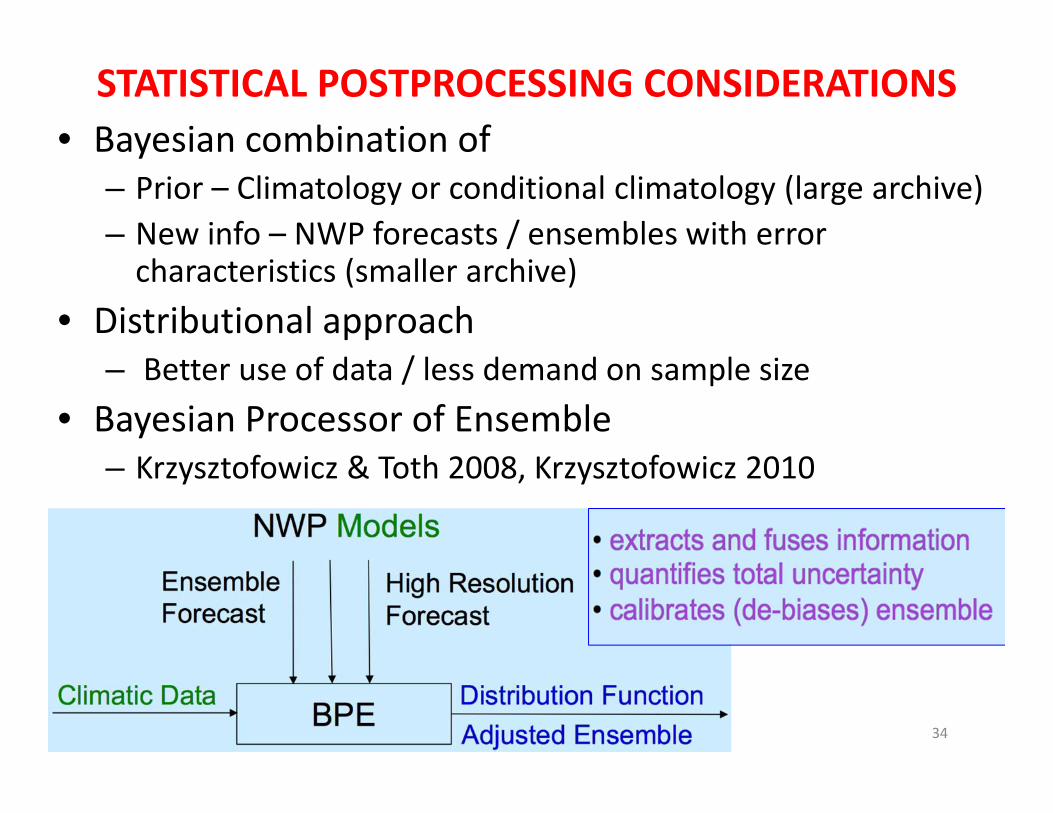
STATISTICAL POSTPROCESSING CONSIDERATIONS• Bayesian combination of
– Prior – Climatology or conditional climatology (large archive)– New info – NWP forecasts / ensembles with error characteristics (smaller archive)
• Distributional approach– Better use of data / less demand on sample size
• Bayesian Processor of Ensemble– Krzysztofowicz & Toth 2008, Krzysztofowicz 2010
34
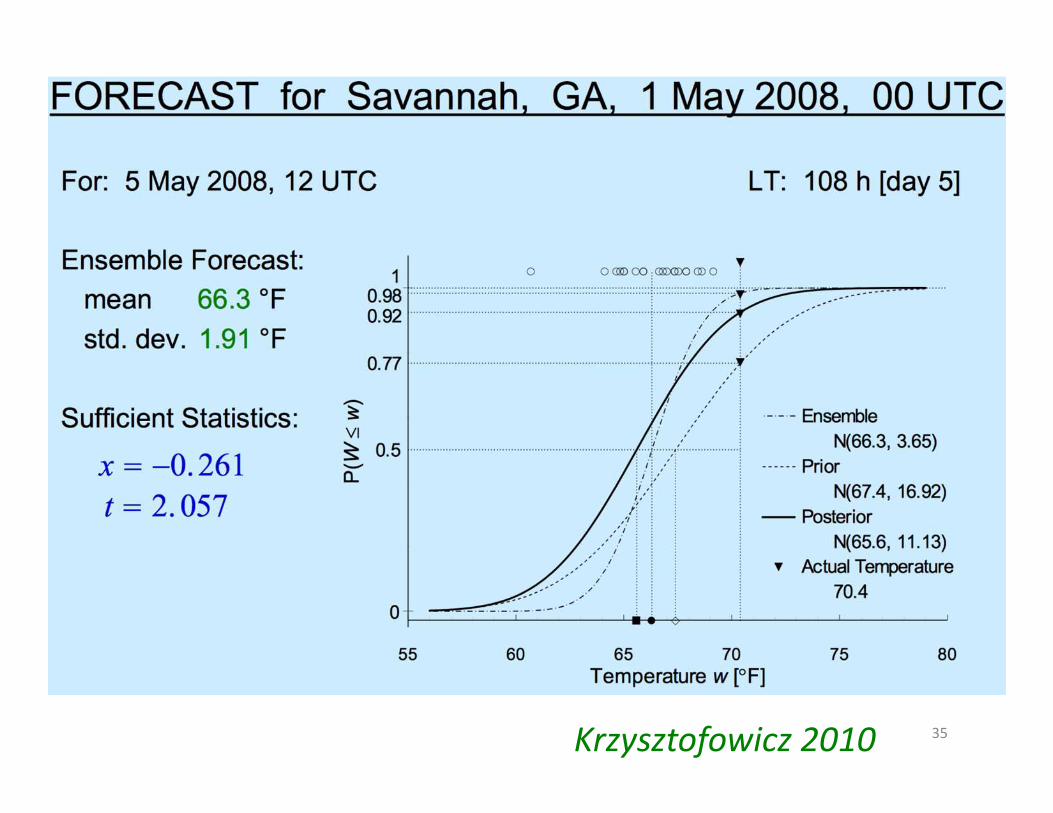
35Krzysztofowicz 2010
36
00.10.20.30.40.50.60.70.80.91
12 60 108 156 204 252
Inform
ation Co
nten
t
Lead Time (hrs)
Summer 2007‐08
High Resolution Ensemble Mean BPE
0
0.2
0.4
0.6
0.8
1
1.2
12 60 108 156 204 252
Axis Title
Lead Time (hrs)
Winter 2008‐09
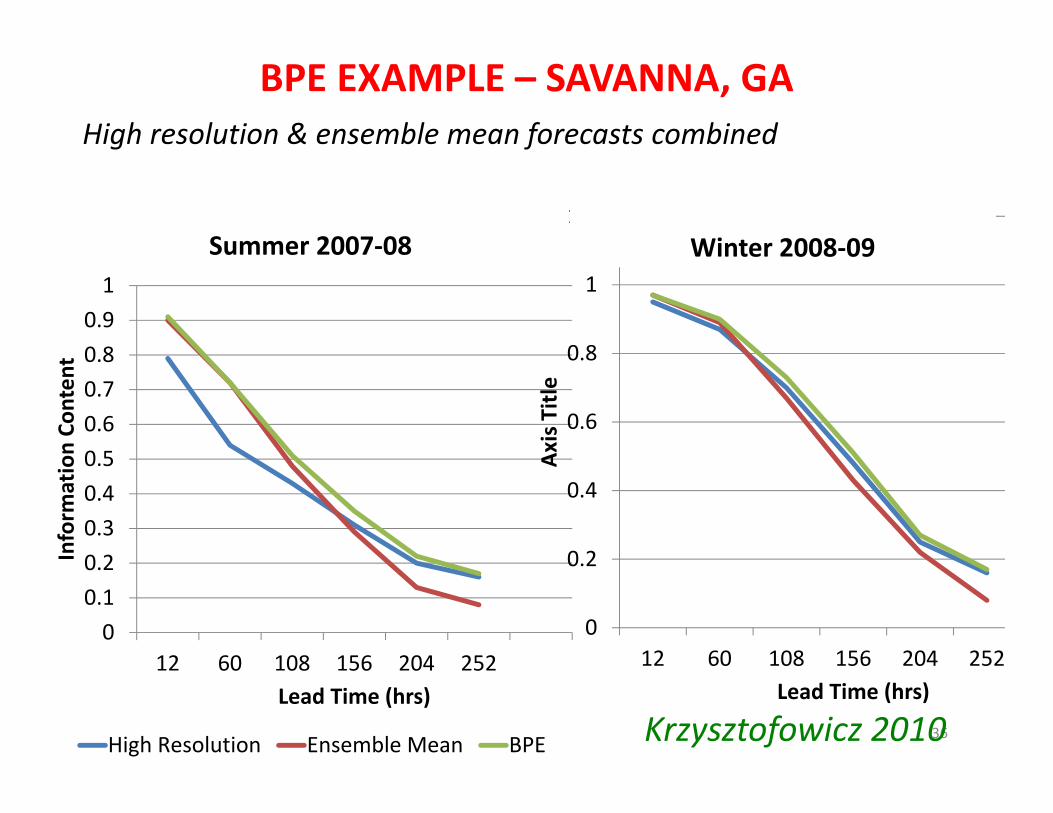
BPE EXAMPLE – SAVANNA, GAHigh resolution & ensemble mean forecasts combined
Winter 2008‐09
Krzysztofowicz 2010
PILLARS OF SCIENTIFIC INNOVATION
• Collaboration / teamwork critical to advance science– Ask / welcome questions– Respect different viewpoints– Accept / embrace disagreement – Critical for advances
• Be open, ready to transcend current, & discover new ideas
• Acknowledge role of individuals in science, too– Source of new thoughts / quantum steps/leap
37
Process
OUTLINE / SUMMARY• Accomplishments – Adaptive methods
– Targeted observations– Ensemble‐based background covariance– Ensemble‐based probabilistic forecasts
• Failures– Organizational – Stakeholders Panel– Research – Cost‐benefit analysis
• Some open research questions– Adaptive observations– Cloud / hydrometeor analysis– Software level collaboration w object oriented design– Ensemble initialization– Statistical post‐processing
• Teams + strong individual initiatives= Key to innovation38

BACKGROUND
39

THORPEX 101 – 2005‐2014• Objective
– Accelerate improvements in high impact weather forecasts• History
– WMO/WWRP sponsored program launched in 2004• Approach
– Research related to end‐to‐end forecast process– Coordination across
• Components of forecast system– Observing, data assimilation, ensemble forecast, decision support systems
• Nations & regions• Research & operational communities
– Modernize / optimize forecast system• Allocate research resources to maximize overall economic impact• Adaptive & probabilistic approaches
– Observations, covariances, physics, decision procedures 40
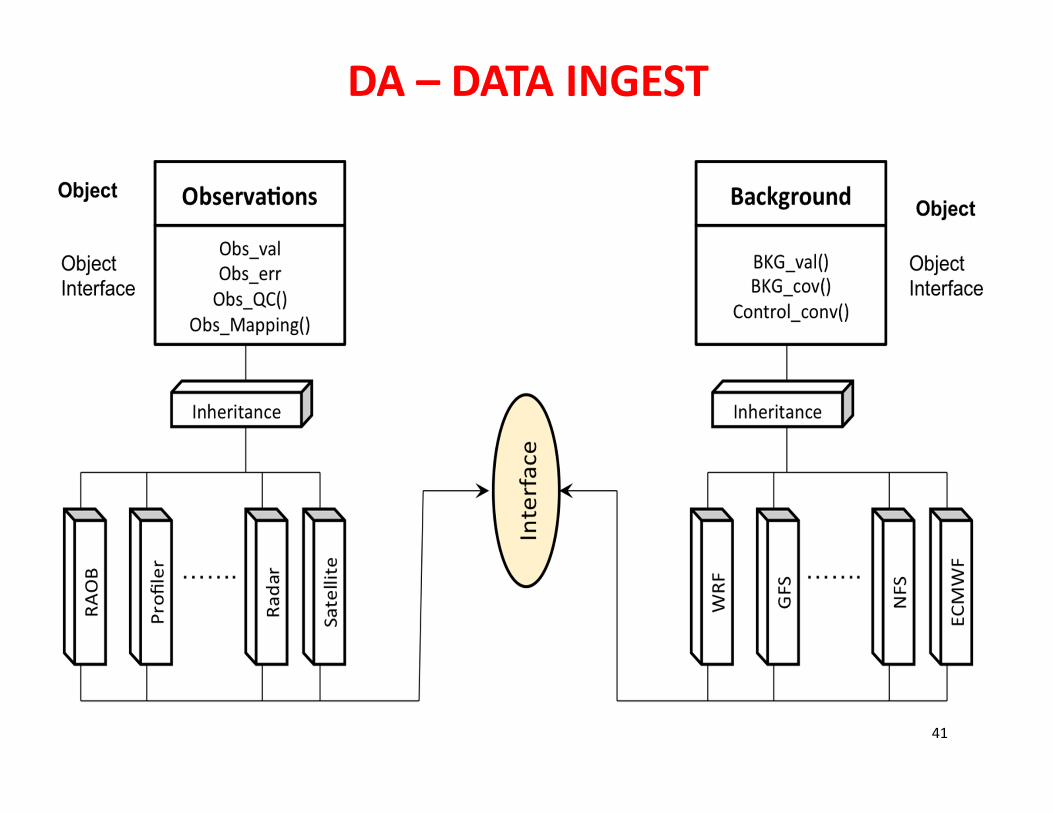
DA – DATA INGEST
41
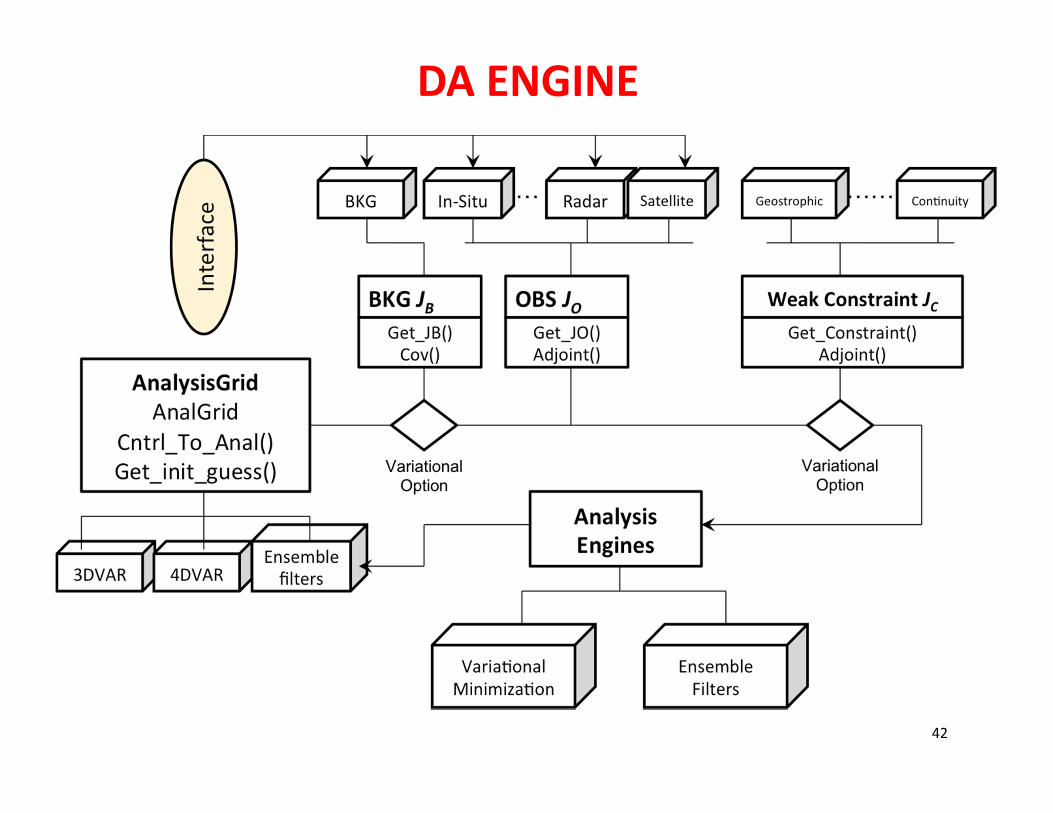
DA ENGINE
42

DA – POST‐PROCESSING
43
44
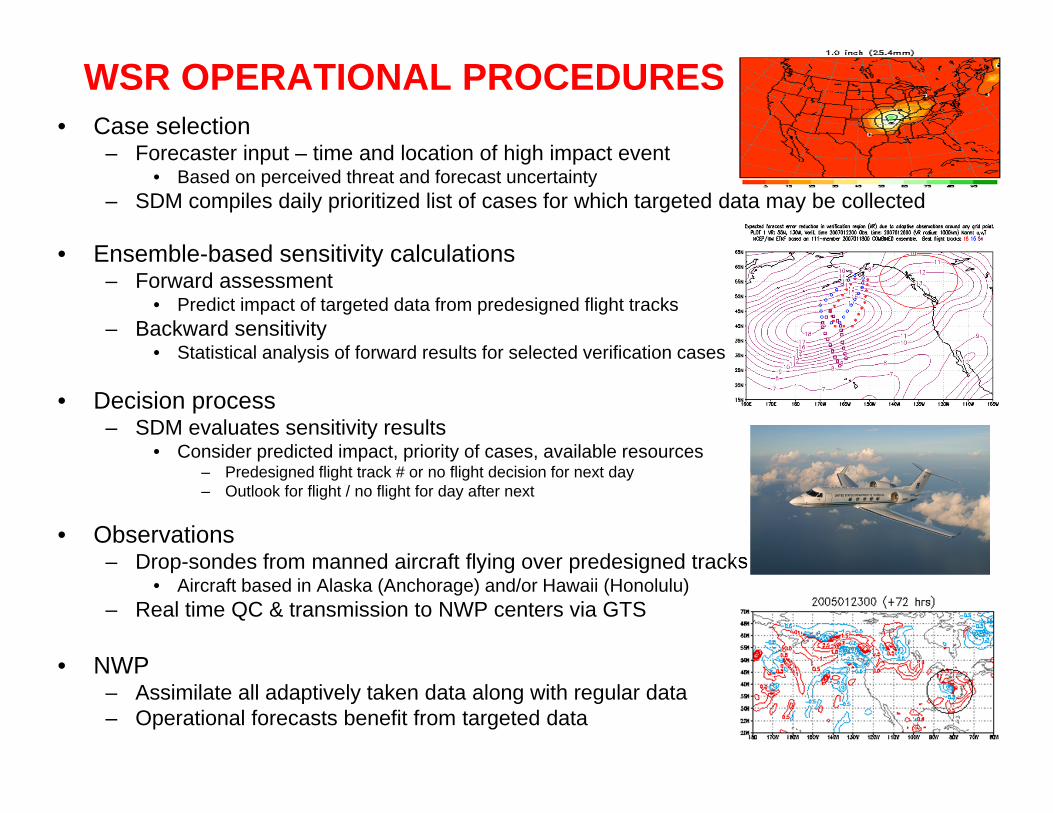
WSR OPERATIONAL PROCEDURES • Case selection
– Forecaster input – time and location of high impact event• Based on perceived threat and forecast uncertainty
– SDM compiles daily prioritized list of cases for which targeted data may be collected
• Ensemble-based sensitivity calculations– Forward assessment
• Predict impact of targeted data from predesigned flight tracks– Backward sensitivity
• Statistical analysis of forward results for selected verification cases
• Decision process– SDM evaluates sensitivity results
• Consider predicted impact, priority of cases, available resources– Predesigned flight track # or no flight decision for next day– Outlook for flight / no flight for day after next
• Observations– Drop-sondes from manned aircraft flying over predesigned tracks
• Aircraft based in Alaska (Anchorage) and/or Hawaii (Honolulu)– Real time QC & transmission to NWP centers via GTS
• NWP– Assimilate all adaptively taken data along with regular data– Operational forecasts benefit from targeted data
46

NAEFS FORECAST FOR MONTREAL – 08/13
47


