THOMSON SCIENTIFIC Patricia Brennan Thomson Scientific January 10, 2008.
31
THOMSON SCIENTIFIC Patricia Brennan Thomson Scientific January 10, 2008
-
Upload
merryl-madison-horn -
Category
Documents
-
view
221 -
download
0
Transcript of THOMSON SCIENTIFIC Patricia Brennan Thomson Scientific January 10, 2008.

THOMSON SCIENTIFIC
Patricia Brennan
Thomson Scientific
January 10, 2008

THOMSON SCIENTIFIC
Research Publication and Performance
- Impact Factor Imperative?
•How do we assess value?
• Current Academic Evaluation Market
• Role of citations, citation metrics
• Possibilities with new metrics – Usage Factors, H Index,
• Irish Research output: Summary Metrics

THOMSON SCIENTIFIC
Stakeholders in Academic Evaluation

THOMSON SCIENTIFIC
Drivers for increased evaluation and assessment

THOMSON SCIENTIFIC
Source: National Citation Report Ireland 2003-2003Scholarship is increasingly Collaborative
Scholarly communications are changing: what is the output ?

THOMSON SCIENTIFIC
Scholarship is Global
0
200
400
600
800
1000
1200
1400
1600
1800
1981 1983 1985 1987 1989 1991 1993 1995 1997 1999 2001 2003
Year
Pap
ers
wit
h N
Co
un
trie
s
> 5 countries > 10 countries > 15 countries
>5 countries
Source: Web of Science®

THOMSON SCIENTIFIC
Mean Authors per Paper
0
0.5
1
1.5
2
2.5
3
3.5
4
81 82 83 84 85 86 87 88 89 90 91 92 93 94 95 96 97 98 99 0 1 2 3 4 5 6
year
au
tho
r/p
ap
er
Source: Web of Science®
Scholarship is increasingly collaborative

THOMSON SCIENTIFIC
Largest Collaboration in 2006: 2512
authors, a “collaboration of collaborations”
Collaborations are getting broader and more complex

THOMSON SCIENTIFIC
What to measure? When?
• Total Papers• Total Citations• Citation Impact (cites per paper)• Percent Cited Paper• Impact Relative to Field• Percentile Rank in Field • Collaboration Indicators• Expected Citation Count• Ratio of Citations to Expected citation count• Expected Citation Rate for Category• Mean / Median Citation• H Index• Citation Frequency Distribution• Time Series Trends
9
Authors
Institutions
Nations
Topics
Fields

THOMSON SCIENTIFIC
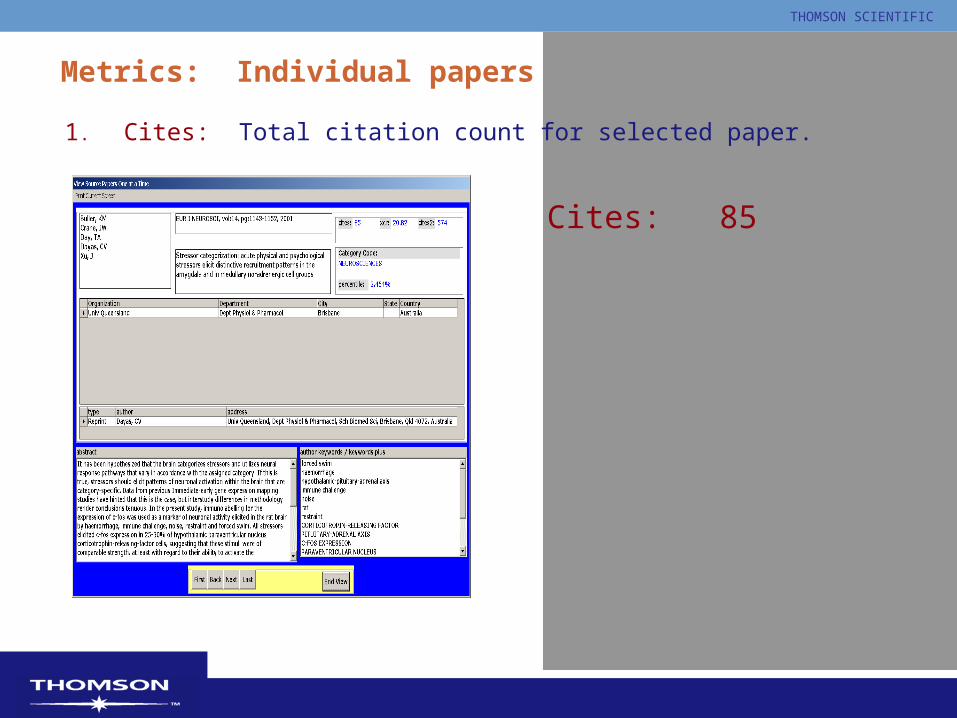
Metrics: Individual papers
1. Cites: Total citation count for selected paper.
2. Cites2: 2nd generation cite count based on total citations received by the citing articles.
3. Expected Citation Rate: An average rate of citation for all the papers of that document type (articles, reviews, letters, etc.), in that journal, for that selected year. This is a metric to evaluate citation counts.
4. Ratio: Ratio of expected cites to actual cites
5. Field: Subject area for the journal in which the paper appeared.
6. %: Percentile position of the paper based on citations in the same field.
THOMSON SCIENTIFIC
Metrics: Individual papers
1. Cites: Total citation count for selected paper.
Cites: 85

THOMSON SCIENTIFIC
Metrics: Individual papers
2. Cites2: 2nd generation cite count based on total citations received by the citing articles.
Cites: 85
Cites2: 574

THOMSON SCIENTIFIC
Metrics: Individual papers
3. Expected Citation Rate: An average rate of citation for all the papers of that document type (articles, reviews, letters, etc.), in that journal, for that
selected year. This is a metric to compare peer journal papers.
Cites: 85
Cites2: 574
Expected Citation Rate: 20.8
(All Articles from European Journal of
Neuroscience in 2001 received on
average 20.8 cites through year-end 2006.)

THOMSON SCIENTIFIC
Metrics: Individual papers
4. Ratio: Ratio of expected cites to actual cites
Cites: 85
Cites2: 574
Expected Citation Rate: 20.8
Ratio: 4.1
[85: 20.8 = 4.1]

THOMSON SCIENTIFIC
Metrics: Individual papers
5. Field: Subject area for the journal in which the paper appeared.Cites: 85
Cites2: 574
Expected Citation Rate: 20.8
Ratio: 4.1
Field: Neuroscience
[Note: For the multidisciplinary journals Science, Nature and PNAS,
all articles and reviews are reassigned based on the primary
category to which the article’s citing and cited journals are assigned.]

THOMSON SCIENTIFIC
Metrics: Individual papers
6. Percentile: position of the paper based on citations in the same field and year.
Cites: 85
Cites2: 574
Expected Citation Rate: 20.8
Ratio: 4.1
Field: Neuroscience
Percentile: 3.5%
[The 85 cites to this Neuroscience paper places it in the top 3.5%
based on the citation distribution to all papers published in this field in
2001. ]

THOMSON SCIENTIFIC
Metrics for groups of papers1. Total # papers and total # cites: combined numbers for the set
2. Mean times cited: Total cites divided by total papers. [average impact]
3. Median times cited: Midpoint for citations
4. H-Index: Number of papers (N) in a given dataset having N or more citations.
5. C-Index: Sum of all actual citations divided by sum of all expected citations.
6. Average Percentile: average of the field percentile measures which are based on field and year of publication
7. Disciplinarity: reflects the level of multidisciplinarity in a set of papers, ranging from 0 to 1, where the lower the number, the greater the multidisciplinarity. (Herfindal Index)

THOMSON SCIENTIFIC
H-Index: Number of papers (N) in a given dataset having N or more citations.
14 papers in this set had
14 or more citations

THOMSON SCIENTIFIC
C-Index: Sum of all actual citations divided by sum of all expected citations.
C index = 1.98
357 180.46

THOMSON SCIENTIFIC
Average Percentile: average of the field percentile measures which are based on field and year of publication
Average Percentile =
31.62

THOMSON SCIENTIFIC
Tools for multiple workflows: Author, Researcher
• Promotion and Tenure– Author Finder
– The Distinct Author Identification System (DAIS)
– Citation Report
– ResearchID.com
21
“.. I would prefer to see something like a unique identifier for
people (so I can still get all of an author's work even if I don't know his professional history) ..”

THOMSON SCIENTIFIC
• Evaluating Research TeamsInitial Views and Exploration
– Analyze Tool
– Citation Report
Profiling Within Institutions
– Journal Use Reports
A Global View
– Essential Science Indicators
Detailed and Precise Analysis
– Custom Analysis
22
Tools for multiple workflows: Administrators, Researchers

THOMSON SCIENTIFIC
Tools for multiple workflows: Librarian, Publisher
• Evaluating a journal collection:– Journal Citation Reports,
– Journal Use Reports
23

THOMSON SCIENTIFIC
The Impact Factor Imperative
IF Calculation

THOMSON SCIENTIFIC
Irish Research Output: Summary Metrics
Metric Count
Total Papers 18,218
Total Cites 131,826
Mean Times Cited 7.24
Median Times Cited 2
H Index 86
Average Percentile 50.70
C-Index 1.115
Disciplinarity Indicator .01
Source: National Citation Report Ireland 2003-2003

THOMSON SCIENTIFIC
Irish Research Output: Comparative Output
Source: National Science Indicators 06

THOMSON SCIENTIFIC
Irish Research Impact: Comparative Impact
Source: National Science Indicators 06

THOMSON SCIENTIFIC
Irish Research Output: Summary Metrics
• Most Cited Author: Wolf K H– Cited 6143 times
Source: National Citation Report Ireland 2003-2003

THOMSON SCIENTIFIC
Understanding Context: Average Impact per Field

THOMSON SCIENTIFIC
Establishing Best Practices
• Consider whether available data can address the question
• Choose publication types, field definitions, and years of data
• Decide on whole or fractional counting
• Judge whether data require editing to remove “artifacts”
• Ask whether the results are reasonable
• Use relative measures, not just absolute counts
• Obtain multiple measures
• Recognize the skewed nature of citation data
• Confirm data collected are relevant to question
• Compare like with like

THOMSON SCIENTIFIC ACADEMIC & GOVERNMENT MARKETS
Thank You