Thomson Reuters 2020 FOURTH-QUARTER & FULL-YEAR RESULTS
43
February 23, 2021 Thomson Reuters 2020 FOURTH-QUARTER & FULL-YEAR RESULTS REUTERS / Firstname Lastname REUTERS / Pascal Rossignol
Transcript of Thomson Reuters 2020 FOURTH-QUARTER & FULL-YEAR RESULTS

February 23, 2021
Thomson Reuters2020 FOURTH-QUARTER & FULL-YEAR RESULTS
REUTERS / Firstname Lastname
REUTERS / Pascal Rossignol

• Welcome / Introduction Frank Golden
• Fourth-Quarter & Full-Year 2020 Results Steve Hasker
Accelerating to 3.0 - Change Program
• Financial Review Mike Eastwood
Fourth-Quarter & Full-Year 2020
Outlook - 2021, 2022 & 2023
• Q & A
Agenda
2
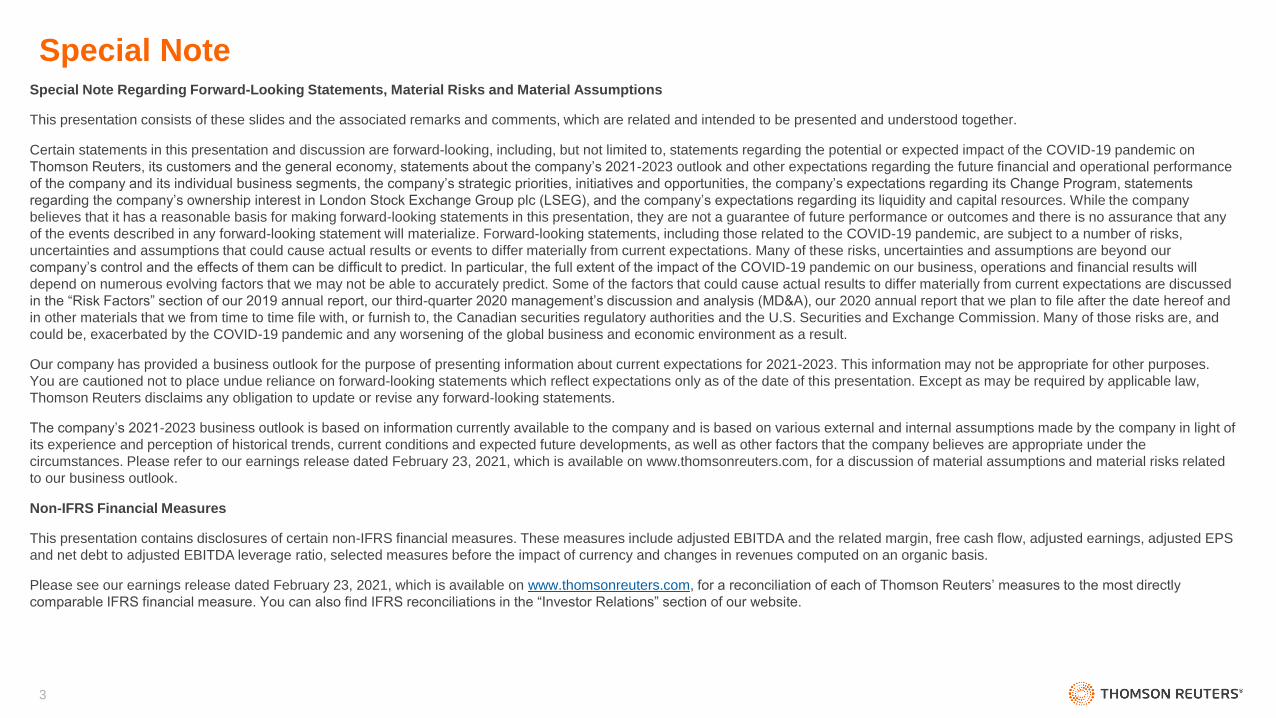
Special NoteSpecial Note Regarding Forward-Looking Statements, Material Risks and Material Assumptions
This presentation consists of these slides and the associated remarks and comments, which are related and intended to be presented and understood together.
Certain statements in this presentation and discussion are forward-looking, including, but not limited to, statements regarding the potential or expected impact of the COVID-19 pandemic on
Thomson Reuters, its customers and the general economy, statements about the company’s 2021-2023 outlook and other expectations regarding the future financial and operational performance
of the company and its individual business segments, the company’s strategic priorities, initiatives and opportunities, the company’s expectations regarding its Change Program, statements
regarding the company’s ownership interest in London Stock Exchange Group plc (LSEG), and the company’s expectations regarding its liquidity and capital resources. While the company
believes that it has a reasonable basis for making forward-looking statements in this presentation, they are not a guarantee of future performance or outcomes and there is no assurance that any
of the events described in any forward-looking statement will materialize. Forward-looking statements, including those related to the COVID-19 pandemic, are subject to a number of risks,
uncertainties and assumptions that could cause actual results or events to differ materially from current expectations. Many of these risks, uncertainties and assumptions are beyond our
company’s control and the effects of them can be difficult to predict. In particular, the full extent of the impact of the COVID-19 pandemic on our business, operations and financial results will
depend on numerous evolving factors that we may not be able to accurately predict. Some of the factors that could cause actual results to differ materially from current expectations are discussed
in the “Risk Factors” section of our 2019 annual report, our third-quarter 2020 management’s discussion and analysis (MD&A), our 2020 annual report that we plan to file after the date hereof and
in other materials that we from time to time file with, or furnish to, the Canadian securities regulatory authorities and the U.S. Securities and Exchange Commission. Many of those risks are, and
could be, exacerbated by the COVID-19 pandemic and any worsening of the global business and economic environment as a result.
Our company has provided a business outlook for the purpose of presenting information about current expectations for 2021-2023. This information may not be appropriate for other purposes.
You are cautioned not to place undue reliance on forward-looking statements which reflect expectations only as of the date of this presentation. Except as may be required by applicable law,
Thomson Reuters disclaims any obligation to update or revise any forward-looking statements.
The company’s 2021-2023 business outlook is based on information currently available to the company and is based on various external and internal assumptions made by the company in light of
its experience and perception of historical trends, current conditions and expected future developments, as well as other factors that the company believes are appropriate under the
circumstances. Please refer to our earnings release dated February 23, 2021, which is available on www.thomsonreuters.com, for a discussion of material assumptions and material risks related
to our business outlook.
Non-IFRS Financial Measures
This presentation contains disclosures of certain non-IFRS financial measures. These measures include adjusted EBITDA and the related margin, free cash flow, adjusted earnings, adjusted EPS
and net debt to adjusted EBITDA leverage ratio, selected measures before the impact of currency and changes in revenues computed on an organic basis.
Please see our earnings release dated February 23, 2021, which is available on www.thomsonreuters.com, for a reconciliation of each of Thomson Reuters’ measures to the most directly
comparable IFRS financial measure. You can also find IFRS reconciliations in the “Investor Relations” section of our website.
3

THOMSON REUTERS
Fourth-Quarter & Full-Year 2020 Highlights
Steve Hasker
President & CEO
4
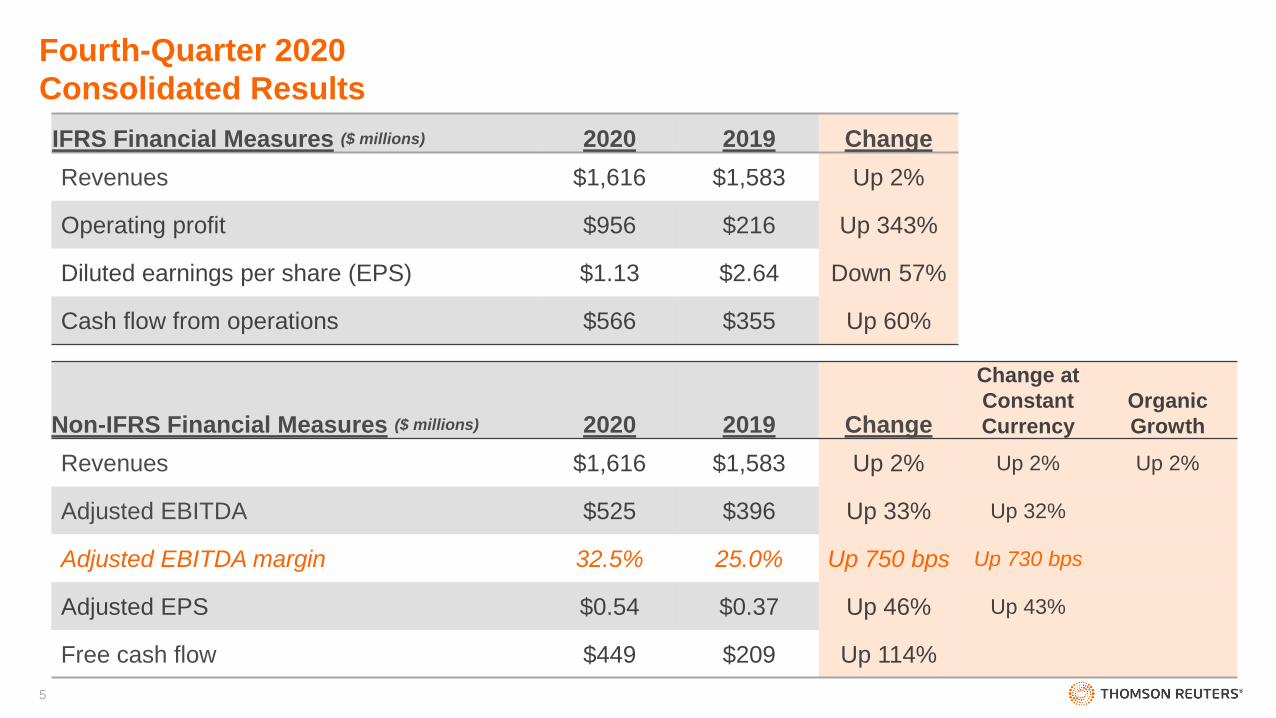
IFRS Financial Measures ($ millions) 2020 2019 Change
Revenues $1,616 $1,583 Up 2%
Operating profit $956 $216 Up 343%
Diluted earnings per share (EPS) $1.13 $2.64 Down 57%
Cash flow from operations $566 $355 Up 60%
Non-IFRS Financial Measures ($ millions) 2020 2019 Change
Change at
Constant
Currency
Organic
Growth
Revenues $1,616 $1,583 Up 2% Up 2% Up 2%
Adjusted EBITDA $525 $396 Up 33% Up 32%
Adjusted EBITDA margin 32.5% 25.0% Up 750 bps Up 730 bps
Adjusted EPS $0.54 $0.37 Up 46% Up 43%
Free cash flow $449 $209 Up 114%
Fourth-Quarter 2020
Consolidated Results
5

Fourth-Quarter 2020
Revenue Growth by Segment
Reported Revenues up 2% to $1.6 billion
Organic revenues up 2%
Organic recurring revenues up 5%
Legal Professionals
$0.7B
+5% (+4% organic)
Tax Professionals
Corporates
$0.3B
+3%(+3% organic)
Corporates
Tax & Accounting Professionals
$0.3B
+4%(+8% organic)
Reuters News
Reuters News
$0.2B
+0%(-3% organic)
Global Print
Global Print
$0.2B
-10%(-10% organic)
Reuters News
Reported
Revenues
Global Print
“Big 3” grew 5% organically (~79% total revenues)
6
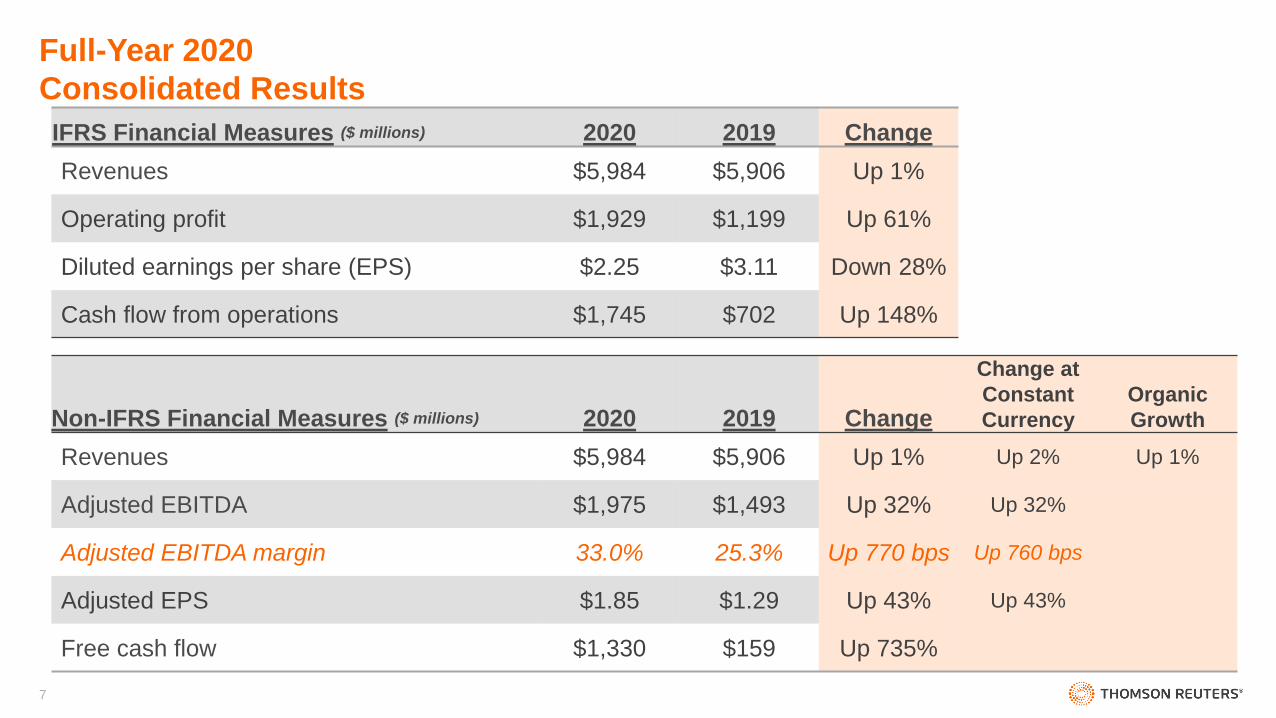
IFRS Financial Measures ($ millions) 2020 2019 Change
Revenues $5,984 $5,906 Up 1%
Operating profit $1,929 $1,199 Up 61%
Diluted earnings per share (EPS) $2.25 $3.11 Down 28%
Cash flow from operations $1,745 $702 Up 148%
Non-IFRS Financial Measures ($ millions) 2020 2019 Change
Change at
Constant
Currency
Organic
Growth
Revenues $5,984 $5,906 Up 1% Up 2% Up 1%
Adjusted EBITDA $1,975 $1,493 Up 32% Up 32%
Adjusted EBITDA margin 33.0% 25.3% Up 770 bps Up 760 bps
Adjusted EPS $1.85 $1.29 Up 43% Up 43%
Free cash flow $1,330 $159 Up 735%
Full-Year 2020
Consolidated Results
7
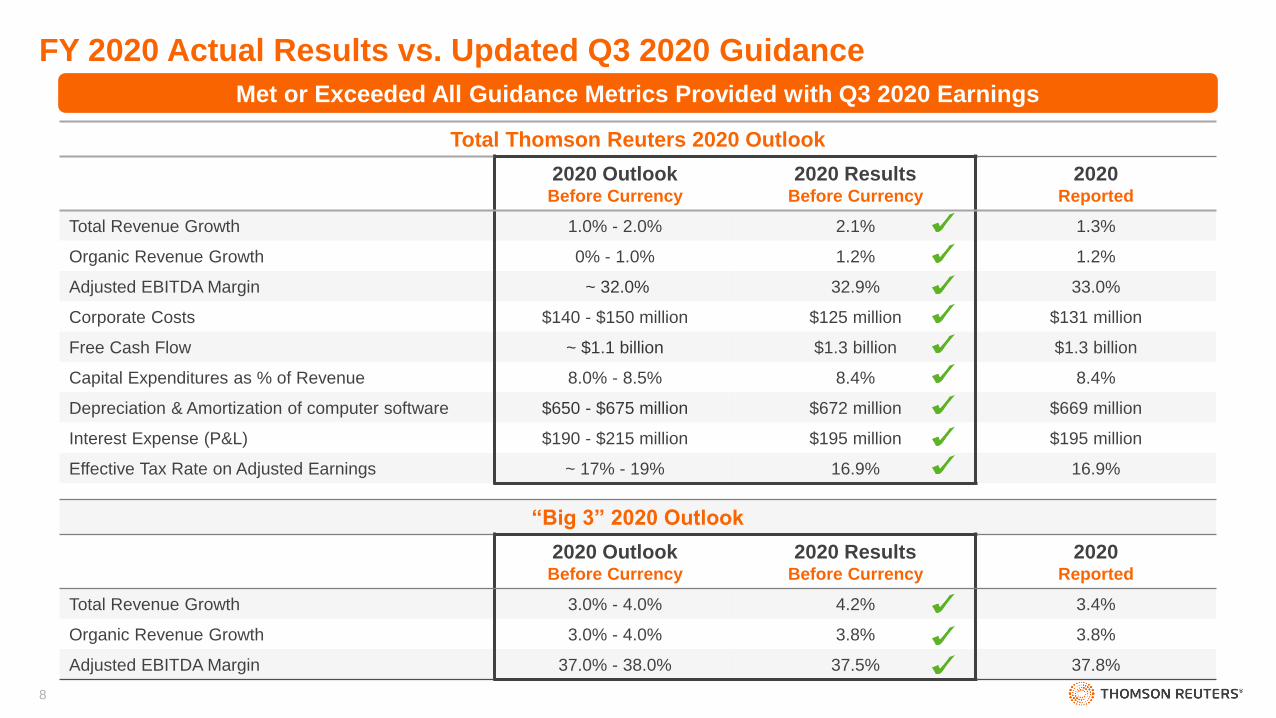
Met or Exceeded All Guidance Metrics Provided with Q3 2020 Earnings
Total Thomson Reuters 2020 Outlook
2020 OutlookBefore Currency
2020 ResultsBefore Currency
2020Reported
Total Revenue Growth 1.0% - 2.0% 2.1% 1.3%
Organic Revenue Growth 0% - 1.0% 1.2% 1.2%
Adjusted EBITDA Margin ~ 32.0% 32.9% 33.0%
Corporate Costs $140 - $150 million $125 million $131 million
Free Cash Flow ~ $1.1 billion $1.3 billion $1.3 billion
Capital Expenditures as % of Revenue 8.0% - 8.5% 8.4% 8.4%
Depreciation & Amortization of computer software $650 - $675 million $672 million $669 million
Interest Expense (P&L) $190 - $215 million $195 million $195 million
Effective Tax Rate on Adjusted Earnings ~ 17% - 19% 16.9% 16.9%
“Big 3” 2020 Outlook
2020 OutlookBefore Currency
2020 ResultsBefore Currency
2020Reported
Total Revenue Growth 3.0% - 4.0% 4.2% 3.4%
Organic Revenue Growth 3.0% - 4.0% 3.8% 3.8%
Adjusted EBITDA Margin 37.0% - 38.0% 37.5% 37.8%
FY 2020 Actual Results vs. Updated Q3 2020 Guidance
8

Accelerating To 3.0 - Change Program
9

Our Businesses are Well Positioned for a Post-COVID World
1. Robust & Growing Legal, Tax, and Government (Risk, Fraud & Compliance) Businesses
• Demand for TR’s advanced, trusted & branded “how-to” products is increasing
• Deep, long-term customer relationships provide advantaged position
2. Strong Prevailing Tailwinds Play to Our Strengths & Contribute to Growth
3. The Change Program Will Drive Both Growth & Efficiencies
• Lever #1 - Holding Company to Operating Company
• Lever #2 - Content Provider to Content-Driven Technology Company
4. This is an Organic Growth Plan Led by a Seasoned Team
5. LSEG Ownership Interest Provides Substantial Optionality
Key Takeaways
10

Our Customers Are Looking For More Ways To Seamlessly Work With Us &
Extract More Value From Our Information for Commercial & Competitive Advantage
Growth Drivers
TR has Advantaged Exposure
to High Growth Verticals
TR has Opportunity to Better
Serve Customers & Access
New Customer Groups
• SMBs migrating to higher quality Legal, Tax & Accounting, and Risk, Fraud & Compliance
solutions
• Self-serve & omnichannel customer access technologies are enabling TR to cost
effectively access smaller customer groups (smaller professional service firms/SMBs)
Customers Seeing
Fundamental Shifts in Ways of
Working
• Shift to virtual working environments & dispersed teams
• Significant shifts in customer spend away from real estate & headcount into information &
technology
• Accelerating demand for real time, 24/7, digital, always-on actionable information –
combining unique data, AI/ML & software
• TR has advantaged positions in high growth areas within & beyond the Big 3. Examples:
- Direct & Indirect Tax, Audit
- Legal How-To & workflow software
- Risk, Fraud & Compliance prevention, detection & investigation
1
2
3
Professional Services Markets in Transition
Prevailing Tailwinds Provide New Growth Opportunities
11

Big 3 Customer Segments*
Go to Market
Product
Operations
Talent
Global Print
Go to Market
Product
Operations
Talent
Reuters News
Go to Market
Product
Operations
Talent
Big 3 Customer Segments*
Go to Market
Global Print
Go to Market
Reuters News
Go to Market
Operations &
Technology
Talent &
Culture
* Big 3 Customer Segments include Legal Professionals, Corporates and Tax & Accounting Professionals
A Streamlined, Integrated & Agile Operating Company is
Expected to Drive Strong Operating & Financial Performance & Value for Shareholders
Holding Company Operating Company
Thomson Reuters Change Program
Lever #1 - Holding Company Structure to an Operating Company Structure
12
Customer
Experience
Product &
Portfolio
Achieving
Benefit of
Scale
Product Dev.
Operations &
Technology

Unique Content
Examples:
Cases, codes, rules, procedures
Editorial enhancements, practice notes, commentary, summaries
Categorizations & taxonomies
Rates, qualifying rules, calculators
Unique Content
World class AI/ML
Native Cloud capabilities, SaaS business models, sales & support skills
Building on our traditional strengths…
Adding essential capabilities to serve customers
how, when & where they want to be served
Best of Breed Software
TR Markets & Customers Seeing
Fundamental Shifts in Ways of WorkingThomson Reuters Change Program
Lever #2 - Content Company to a Content-Driven Technology Company
13
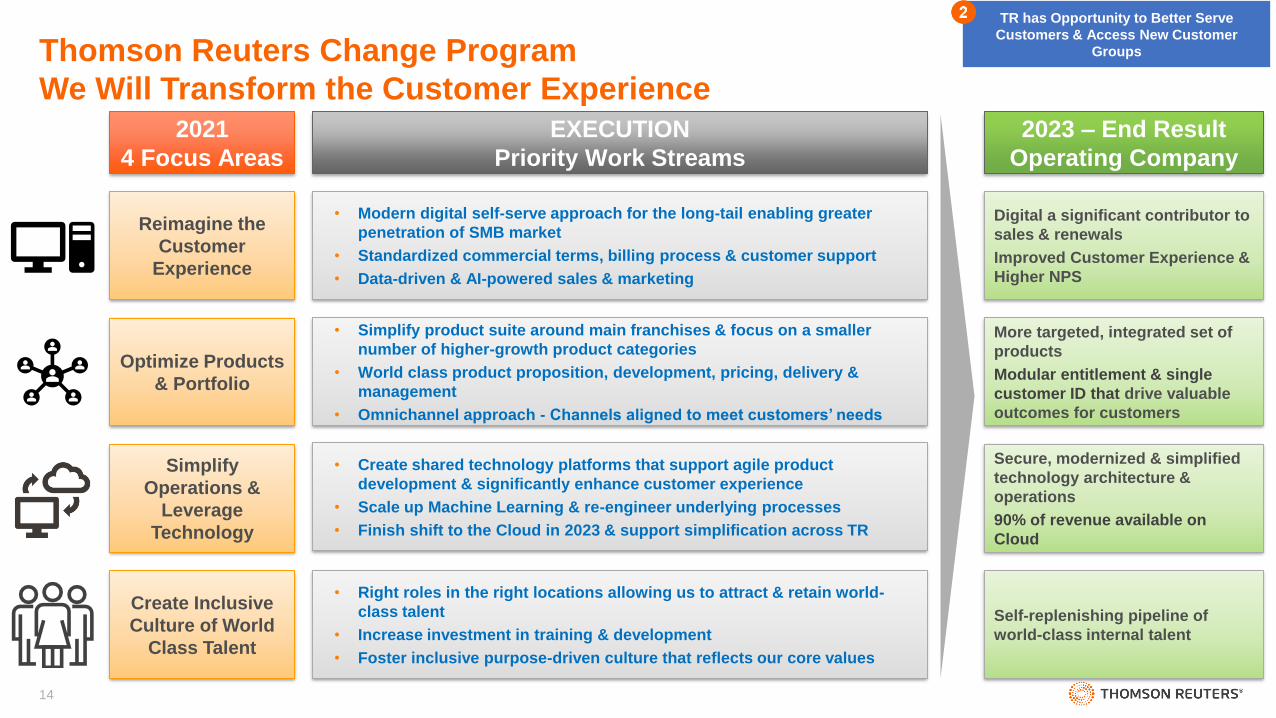
• Simplify product suite around main franchises & focus on a smaller
number of higher-growth product categories
• World class product proposition, development, pricing, delivery &
management
• Omnichannel approach - Channels aligned to meet customers’ needs
• Modern digital self-serve approach for the long-tail enabling greater
penetration of SMB market
• Standardized commercial terms, billing process & customer support
• Data-driven & AI-powered sales & marketing
• Create shared technology platforms that support agile product
development & significantly enhance customer experience
• Scale up Machine Learning & re-engineer underlying processes
• Finish shift to the Cloud in 2023 & support simplification across TR
• Right roles in the right locations allowing us to attract & retain world-
class talent
• Increase investment in training & development
• Foster inclusive purpose-driven culture that reflects our core values
2021
4 Focus Areas
Reimagine the
Customer
Experience
Simplify
Operations &
Leverage
Technology
Create Inclusive
Culture of World
Class Talent
Optimize Products
& Portfolio
EXECUTION
Priority Work Streams
2023 – End Result
Operating Company
Digital a significant contributor to
sales & renewals
Improved Customer Experience &
Higher NPS
More targeted, integrated set of
products
Modular entitlement & single
customer ID that drive valuable
outcomes for customers
Secure, modernized & simplified
technology architecture &
operations
90% of revenue available on
Cloud
Self-replenishing pipeline of
world-class internal talent
TR has Opportunity to Better Serve
Customers & Access New Customer
GroupsThomson Reuters Change Program
We Will Transform the Customer Experience
14
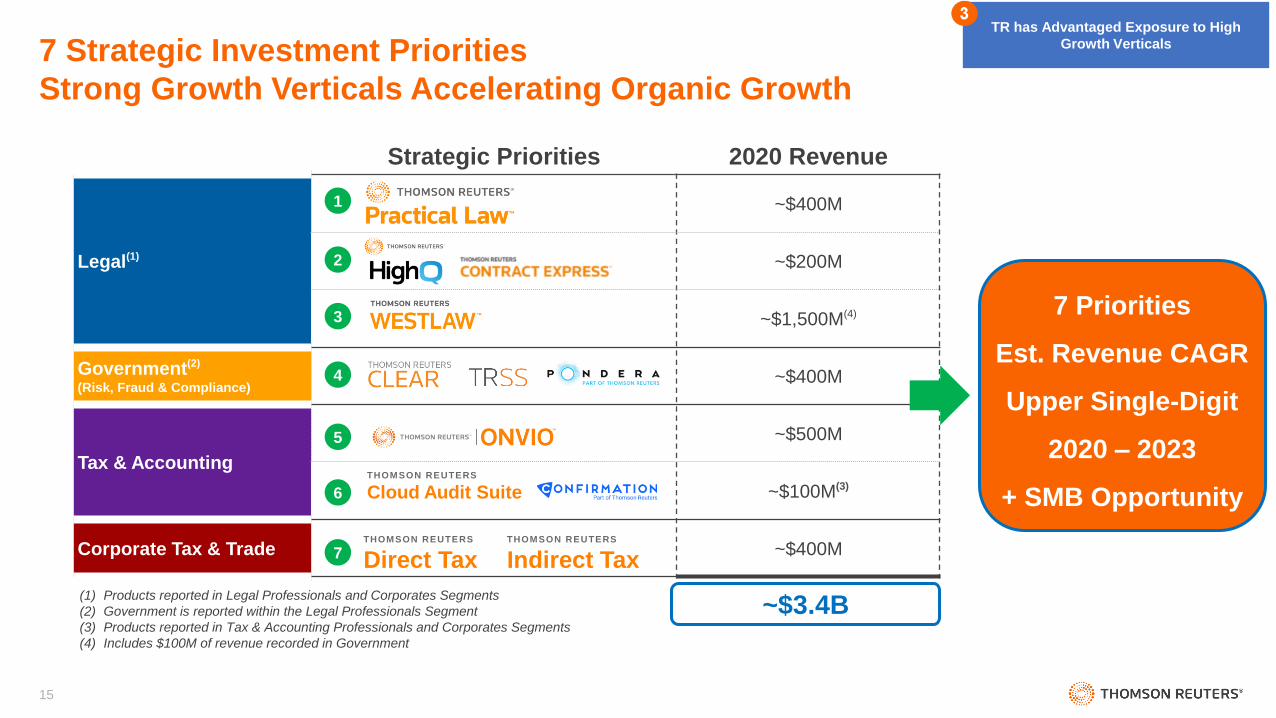
Strategic Priorities 2020 Revenue
Legal(1)
~$400M
~$200M
~$1,500M(4)
Government(2)
(Risk, Fraud & Compliance)~$400M
Tax & Accounting
~$500M
~$100M(3)
Corporate Tax & Trade ~$400M
1
2
3
4
5
6
7
~$3.4B
7 Priorities
Est. Revenue CAGR
Upper Single-Digit
2020 – 2023
+ SMB Opportunity
(1) Products reported in Legal Professionals and Corporates Segments
(2) Government is reported within the Legal Professionals Segment
(3) Products reported in Tax & Accounting Professionals and Corporates Segments
(4) Includes $100M of revenue recorded in Government
TR has Advantaged Exposure to High
Growth Verticals7 Strategic Investment Priorities
Strong Growth Verticals Accelerating Organic Growth
THOMSON REUTERS
Direct TaxTHOMSON REUTERS
Indirect Tax
THOMSON REUTERS
Cloud Audit Suite
15

Thomson Reuters Change Program Have Begun to Implement a 24-month Program
1. Estimated investment of $500 - $600 million (2021 & 2022)
• Will accelerate organic revenue growth, reduce operating costs, significantly increase margins, lower
Capex intensity & increase free cash flow
2. Estimated to generate additional annual revenues of $100 million in 2023
3. Estimated to achieve annual Operating Expense savings of $600M by 2023
• $200M of operating expense savings to be reinvested in growth initiatives
• $400M operating expense savings net of investment (10% reduction)
16

2021 - 2023 Outlook
17

Note: 2021 – 2023 reflected before the impact of currency
2020 2023
Organic Growth• Total TR
• Big 3 Segments
1.2%
3.8%
5% - 6%
6% - 7%
Adj. EBITDA
Margin33.0% 38% - 40%
Free Cash Flow• FCF per Share
$1.3B
$2.67 per share
$1.8B - $2.0B
$3.60 - $4.00per share
2021
3% - 4%
4.5% - 5.5%
30% - 31%
$1.0B - $1.1B
$2.00 - $2.20per share
2022
4% - 5%
5.5% - 6.5%
34% - 35%
$1.2B - $1.3B
$2.40 - $2.60per share
2021 - 2023 Outlook
Faster Growth, Higher Margins, Record Free Cash Flow & FCF per Share
18

1. Leader in Each Market Where We Operate
2. Acknowledged by Customers as a Product Innovator & Builder
3. Delivering a Seamless Customer Experience
4. LSEG Interest Provides Substantial Optionality to Further Strengthen Our Positions
Thomson Reuters in 2023
A Leading Content-Driven Technology Company
19

Financial Review
Mike Eastwood
Chief Financial Officer
20
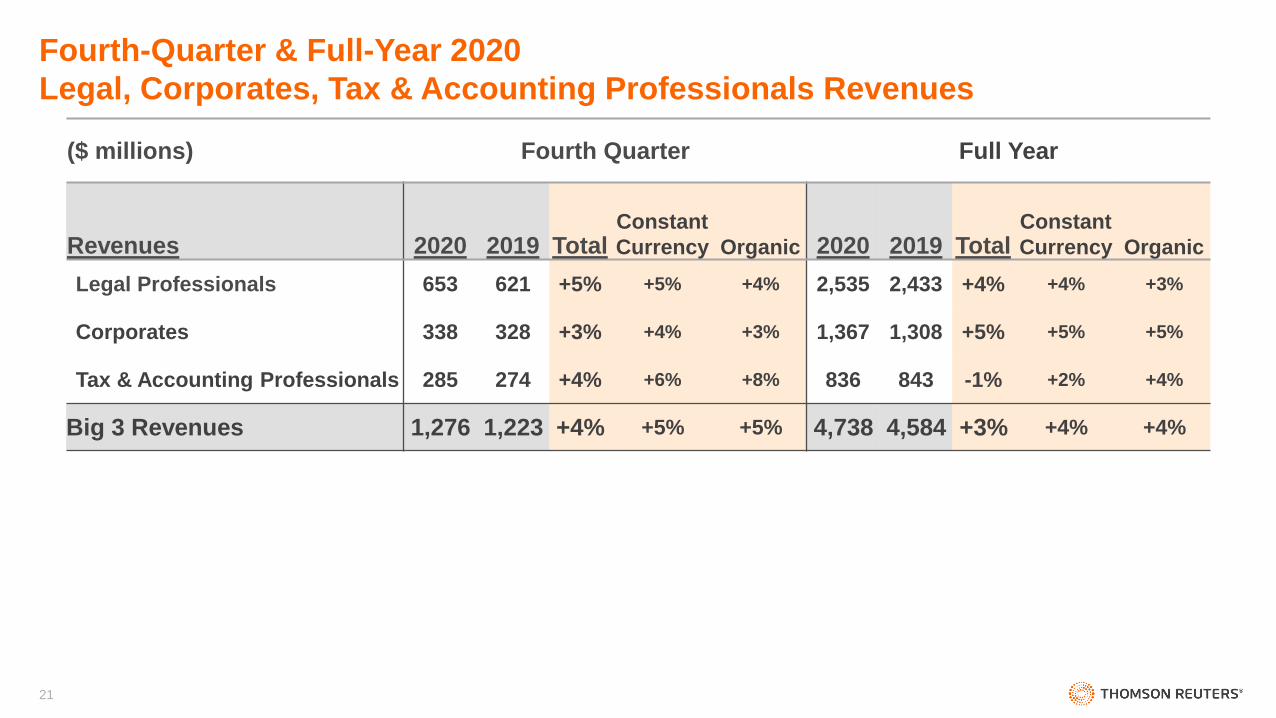
Fourth-Quarter & Full-Year 2020
Legal, Corporates, Tax & Accounting Professionals Revenues
($ millions) Fourth Quarter Full Year
Revenues 2020 2019 TotalConstant
Currency Organic 2020 2019 TotalConstant
Currency Organic
Legal Professionals 653 621 +5% +5% +4% 2,535 2,433 +4% +4% +3%
Corporates 338 328 +3% +4% +3% 1,367 1,308 +5% +5% +5%
Tax & Accounting Professionals 285 274 +4% +6% +8% 836 843 -1% +2% +4%
Big 3 Revenues 1,276 1,223 +4% +5% +5% 4,738 4,584 +3% +4% +4%
21
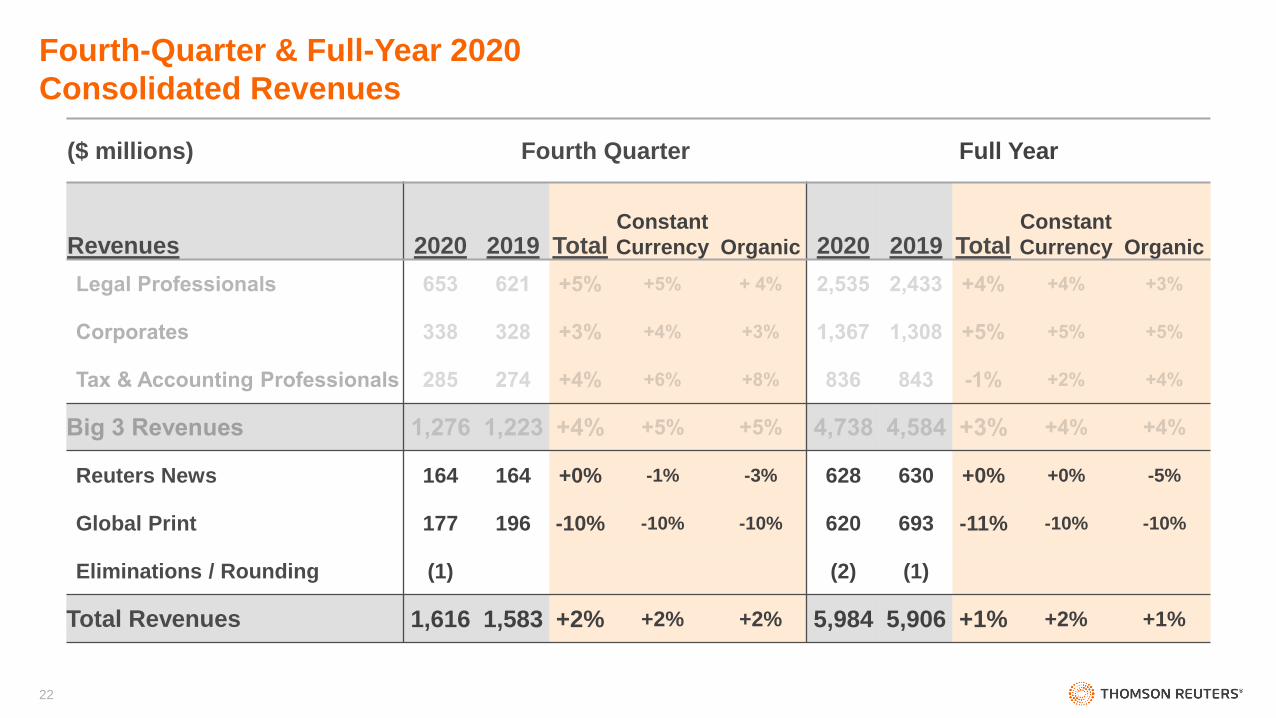
Fourth-Quarter & Full-Year 2020
Consolidated Revenues
($ millions) Fourth Quarter Full Year
Revenues 2020 2019 TotalConstant
Currency Organic 2020 2019 TotalConstant
Currency Organic
Reuters News 164 164 +0% -1% -3% 628 630 +0% +0% -5%
Global Print 177 196 -10% -10% -10% 620 693 -11% -10% -10%
Eliminations / Rounding (1) (2) (1)
Total Revenues 1,616 1,583 +2% +2% +2% 5,984 5,906 +1% +2% +1%
22
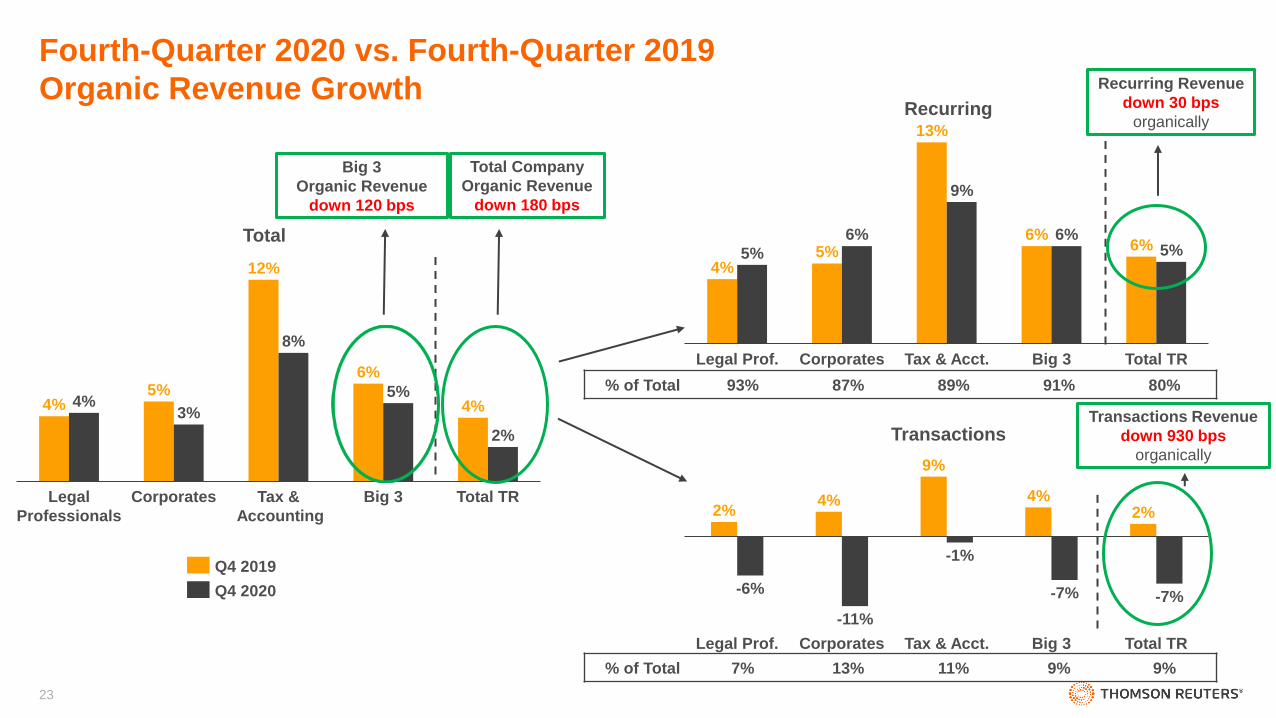
Fourth-Quarter 2020 vs. Fourth-Quarter 2019
Organic Revenue Growth
% of Total 7% 13% 11% 9% 9%
Recurring
Transactions
4%
Legal
Professionals
Tax &
Accounting
5%
Corporates Big 3 Total TR
4%3%
12%
2%
8%
6%
5%4%
Q4 2019
Q4 2020
Total 6%
4%5%
Legal Prof.
5%
Corporates Total TRBig 3Tax & Acct.
6%
13%
9%
6%6% 5%
2%2%
Tax & Acct.Legal Prof. Corporates
4%
-6%
Big 3 Total TR
-11%
-1%
4%
-7% -7%
9%
% of Total 93% 87% 89% 91% 80%
Total Company
Organic Revenue
down 180 bps
Recurring Revenue
down 30 bps
organically
Transactions Revenue
down 930 bps
organically
Big 3
Organic Revenue
down 120 bps
23
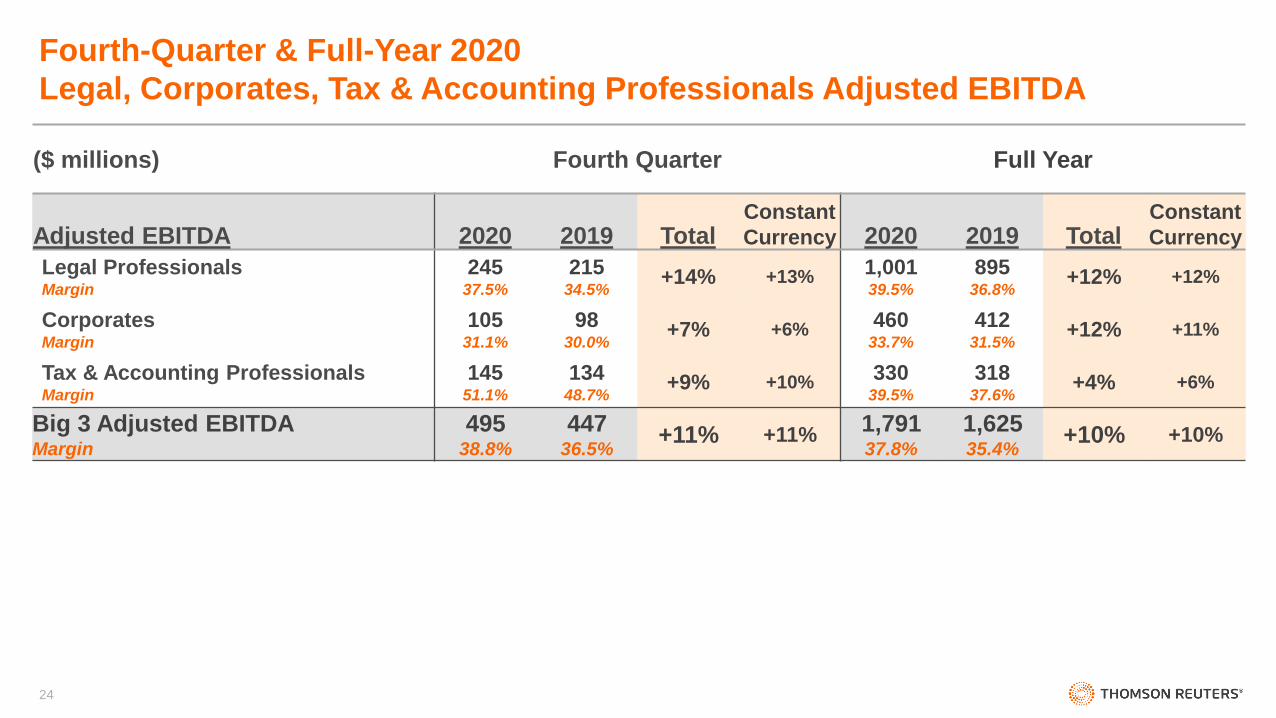
Fourth-Quarter & Full-Year 2020
Legal, Corporates, Tax & Accounting Professionals Adjusted EBITDA
($ millions) Fourth Quarter Full Year
Adjusted EBITDA 2020 2019 TotalConstant
Currency 2020 2019 TotalConstant
Currency
Legal ProfessionalsMargin
24537.5%
21534.5%
+14% +13% 1,00139.5%
89536.8%
+12% +12%
CorporatesMargin
10531.1%
9830.0%
+7% +6% 46033.7%
41231.5%
+12% +11%
Tax & Accounting ProfessionalsMargin
14551.1%
13448.7%
+9% +10% 33039.5%
31837.6%
+4% +6%
Big 3 Adjusted EBITDAMargin
49538.8%
44736.5%
+11% +11%1,79137.8%
1,62535.4%
+10% +10%
24

Fourth-Quarter & Full-Year 2020
Consolidated Adjusted EBITDA
($ millions) Fourth Quarter Full Year
Adjusted EBITDA 2020 2019 TotalConstant
Currency 2020 2019 TotalConstant
Currency
Reuters NewsMargin
63.9%
106.5%
-41% -34% 7311.7%
6810.9%
+7% -1%
Global PrintMargin
6134.6%
7739.4%
-21% -22% 24239.0%
29442.5%
-18% -18%
Corporate Costs (37) (138) (131) (494)
Total Adjusted EBITDAMargin
52532.5%
39625.0%
+33% +32%1,97533.0%
1,49325.3%
+32% +32%
25
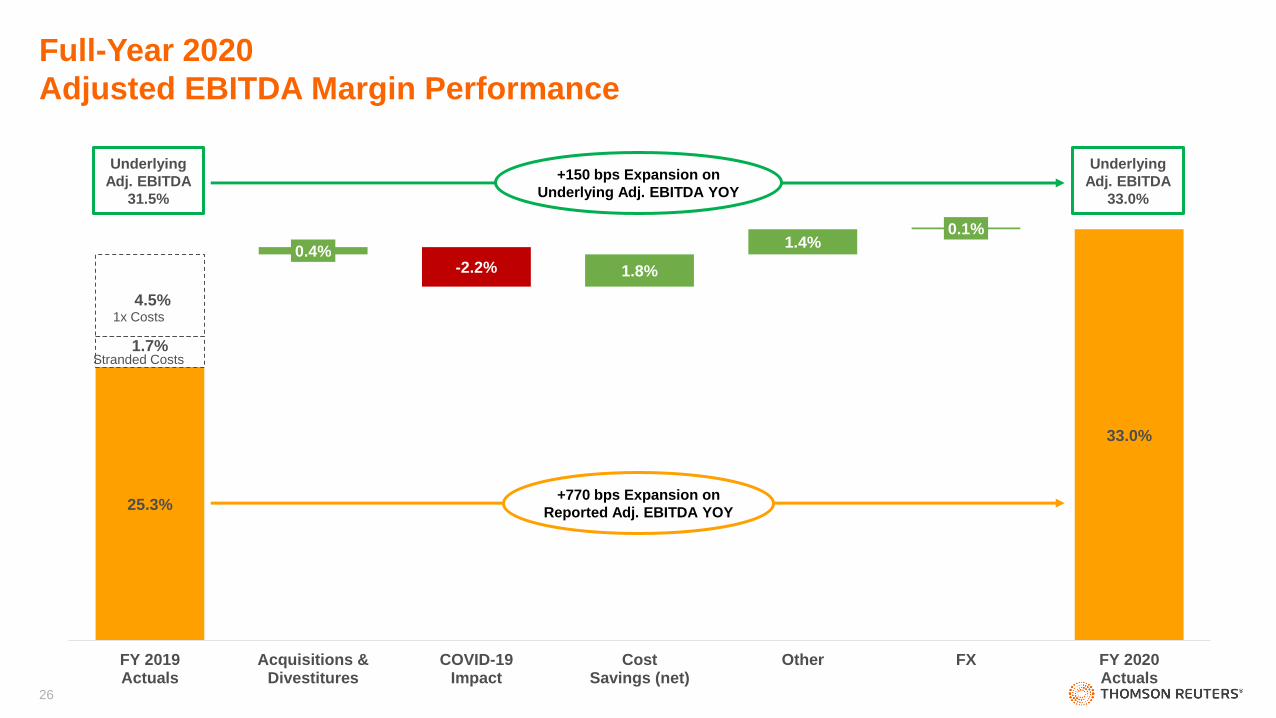
Full-Year 2020
Adjusted EBITDA Margin Performance
25.3%
33.0%
1.7%
4.5%
0.4%-2.2% 1.8%
1.4%0.1%
FY 2019Actuals
Acquisitions &Divestitures
COVID-19Impact
CostSavings (net)
Other FX FY 2020Actuals
+150 bps Expansion on
Underlying Adj. EBITDA YOY
Underlying
Adj. EBITDA
31.5%
Underlying
Adj. EBITDA
33.0%
1x Costs
Stranded Costs
+770 bps Expansion on
Reported Adj. EBITDA YOY
26

Adjusted Earnings Per Share
Free Cash Flow
Capital Structure
27
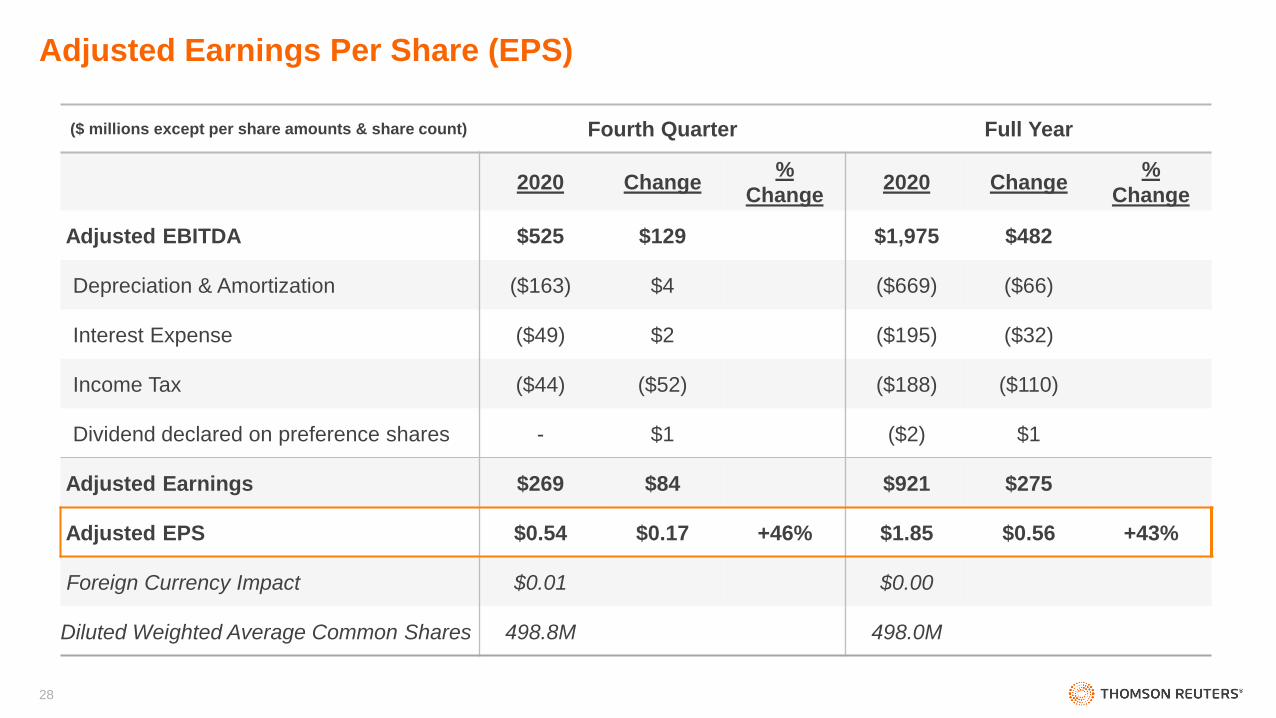
Adjusted Earnings Per Share (EPS)
($ millions except per share amounts & share count) Fourth Quarter Full Year
2020 Change%
Change2020 Change
%
Change
Adjusted EBITDA $525 $129 $1,975 $482
Depreciation & Amortization ($163) $4 ($669) ($66)
Interest Expense ($49) $2 ($195) ($32)
Income Tax ($44) ($52) ($188) ($110)
Dividend declared on preference shares - $1 ($2) $1
Adjusted Earnings $269 $84 $921 $275
Adjusted EPS $0.54 $0.17 +46% $1.85 $0.56 +43%
Foreign Currency Impact $0.01 $0.00
Diluted Weighted Average Common Shares 498.8M 498.0M
28
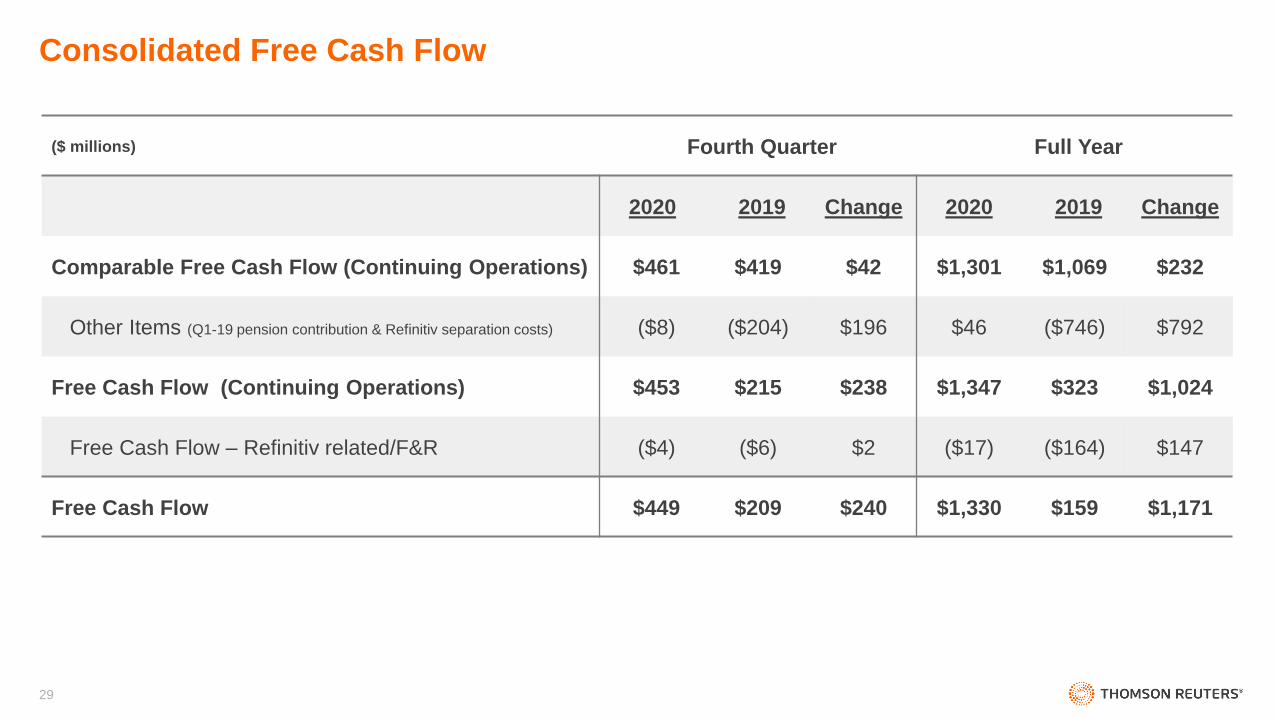
Consolidated Free Cash Flow
($ millions) Fourth Quarter Full Year
2020 2019 Change 2020 2019 Change
Comparable Free Cash Flow (Continuing Operations) $461 $419 $42 $1,301 $1,069 $232
Other Items (Q1-19 pension contribution & Refinitiv separation costs) ($8) ($204) $196 $46 ($746) $792
Free Cash Flow (Continuing Operations) $453 $215 $238 $1,347 $323 $1,024
Free Cash Flow – Refinitiv related/F&R ($4) ($6) $2 ($17) ($164) $147
Free Cash Flow $449 $209 $240 $1,330 $159 $1,171
29

• Debt Outstanding @ 12/31/20 = $3.7B
• Cash on Balance Sheet @ 12/31/20 = $1.8B
• Credit Revolver @ 12/31/20 = ~$1.8B (undrawn)
• Avg. Interest Cost for term debt = 4.1%
• Average term debt maturity = ~10 years
• Capital structure and liquidity position remain strong
• Principal sources of liquidity: Cash on hand, cash from operations, $1.8B syndicated credit facility and $1.8B CP program
• Current Net Debt / Adjusted EBITDA Ratio of 1.1x vs. Target of 2.5x (1.0x calculated under credit facility below max. covenant of 4.5x)
• No debt maturities until November 2023
Debt Maturity
5.65%4.30%
3.85%
2.25%
3.35%5.50%
5.85%
4.50%$0
$200
$400
$600
$800
$1,000
$1,200
2020 2021 2022 2023 2024 2025 2026 2035 2040 2043
Existing Term Debt
Millio
ns
(U
S$
)
Significant Financial Capacity - Ready to Put to Work
30
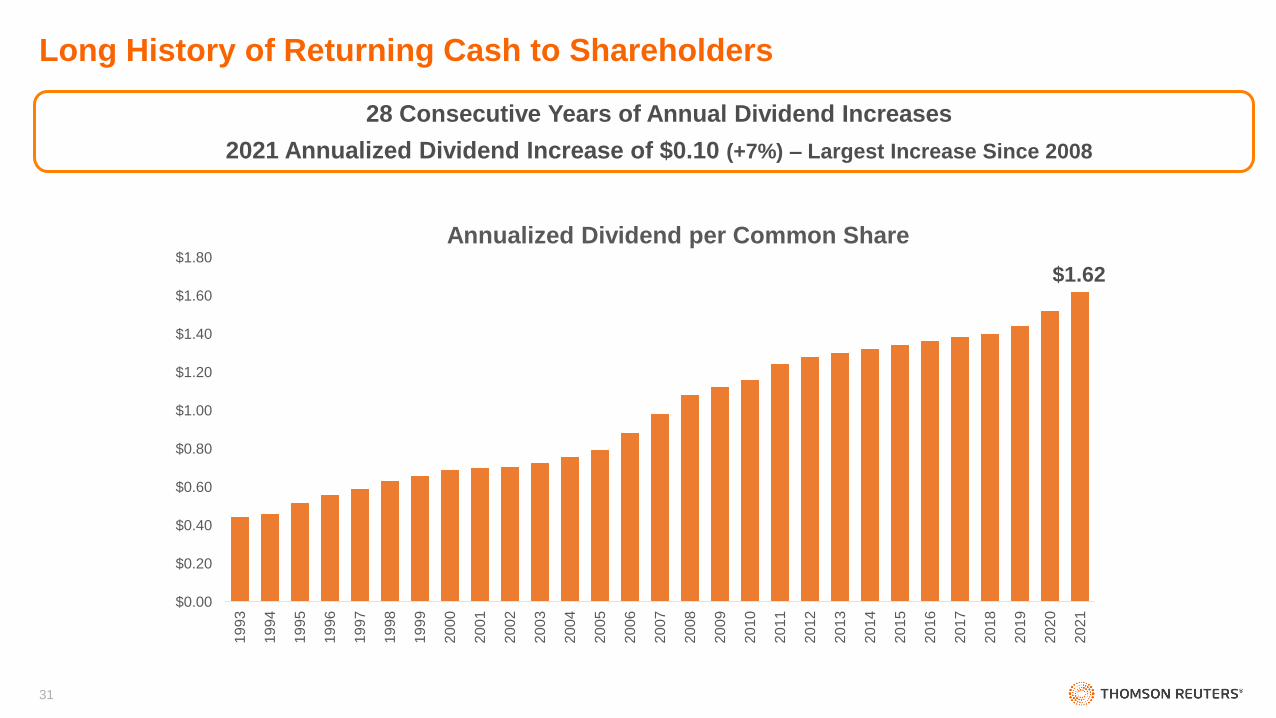
28 Consecutive Years of Annual Dividend Increases
2021 Annualized Dividend Increase of $0.10 (+7%) – Largest Increase Since 2008
$1.62
$0.00
$0.20
$0.40
$0.60
$0.80
$1.00
$1.20
$1.40
$1.60
$1.80
1993
1994
1995
1996
1997
1998
1999
2000
2001
2002
2003
2004
2005
2006
2007
2008
2009
2010
2011
2012
2013
2014
2015
2016
2017
2018
2019
2020
2021
Annualized Dividend per Common Share
Long History of Returning Cash to Shareholders
31

Thomson Reuters Ownership Stake in London Stock Exchange Group
Significant Store of Value – Provides Substantial Optionality
• TRI ownership interest in LSEG currently = 82.5 shares
Current LSEG Value = ~$11.2B / ~$23 value within TRI stock price [LSEG 02/22/21 closing price]
Refinitiv/LSEG transaction closed January 29, 2021
Tax of $700 million payable on gain on sale of Refinitiv
Expect to sell $1 billion of LSEG shares (net proceeds $750 million) to pay $700 million
Estimate TR will receive dividends = $75 million per year (after sale of $1B of LSEG shares)
• Will be assessing optimal uses of proceeds
First tranche can be sold in January 2023
32

2021 - 2023 Outlook
33
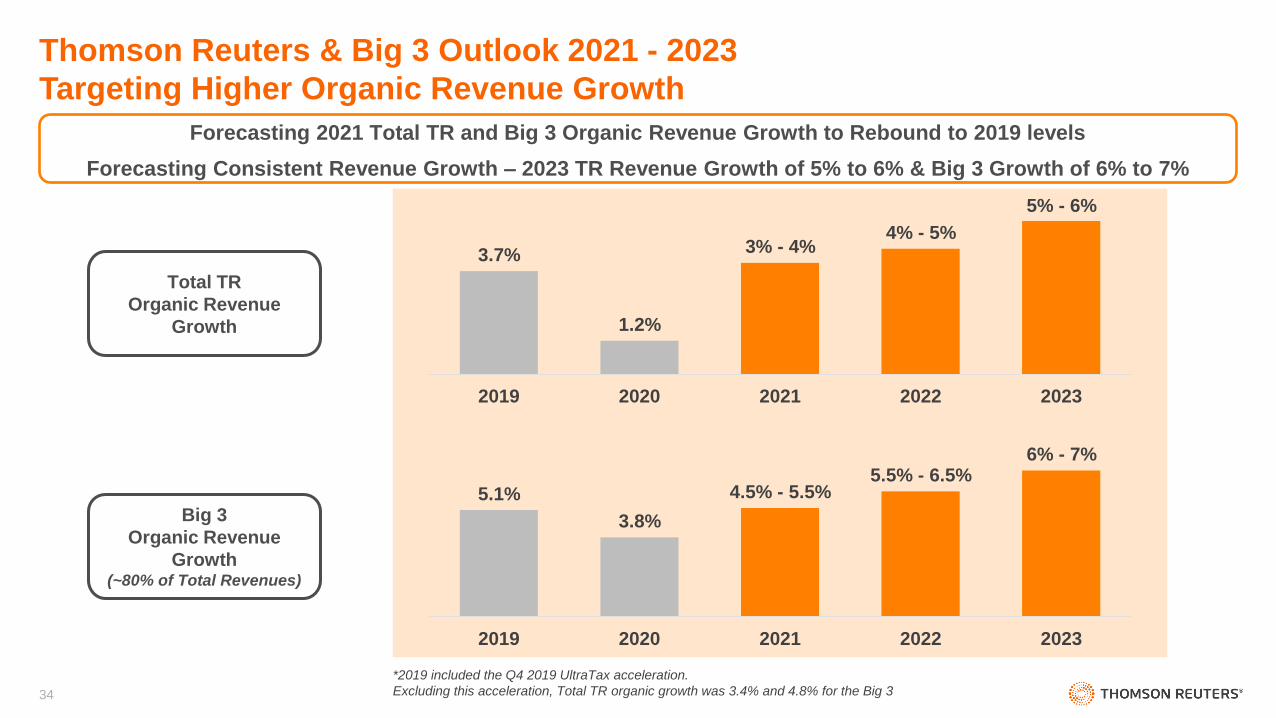
3.7%
1.2%
3% - 4%4% - 5%
5% - 6%
2019 2020 2021 2022 2023
Total TR
Organic Revenue
Growth
Big 3
Organic Revenue
Growth(~80% of Total Revenues)
Forecasting 2021 Total TR and Big 3 Organic Revenue Growth to Rebound to 2019 levels
Forecasting Consistent Revenue Growth – 2023 TR Revenue Growth of 5% to 6% & Big 3 Growth of 6% to 7%
5.1%
3.8%
4.5% - 5.5%5.5% - 6.5%
6% - 7%
2019 2020 2021 2022 2023
*2019 included the Q4 2019 UltraTax acceleration.
Excluding this acceleration, Total TR organic growth was 3.4% and 4.8% for the Big 3
Thomson Reuters & Big 3 Outlook 2021 - 2023
Targeting Higher Organic Revenue Growth
34
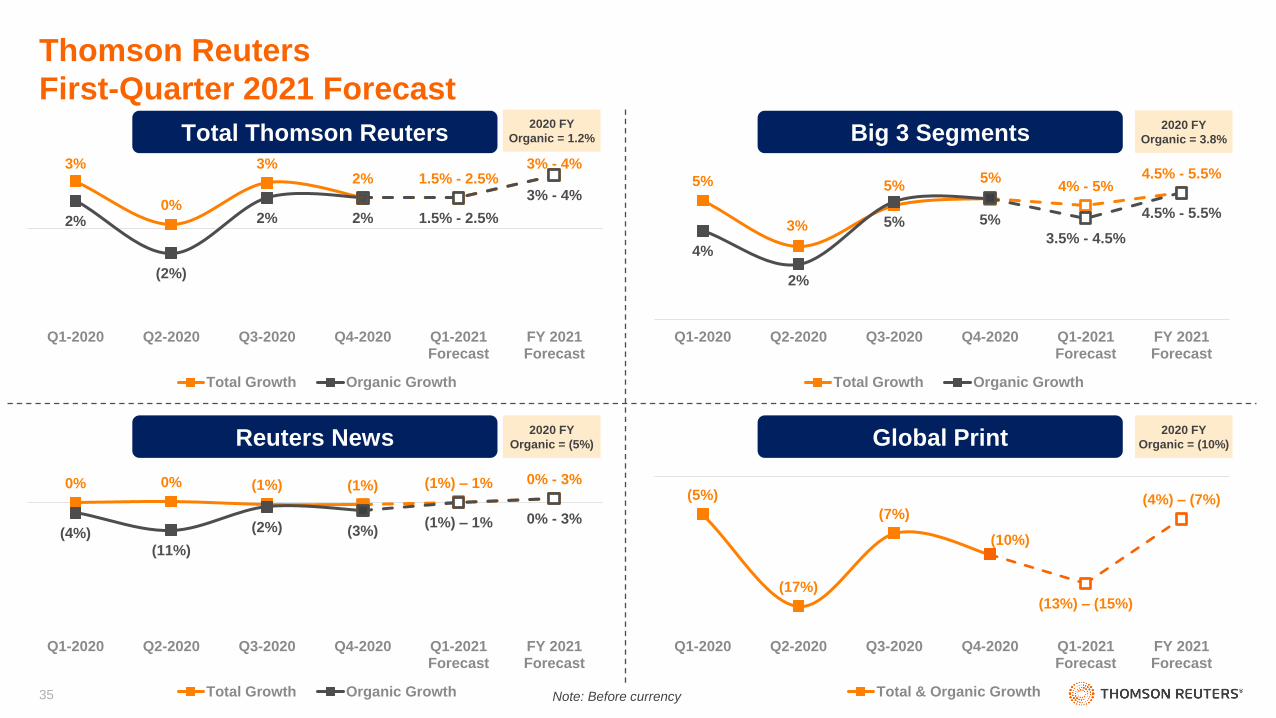
Thomson Reuters
First-Quarter 2021 Forecast
Reuters News Global Print
Big 3 SegmentsTotal Thomson Reuters
0% 0% (1%) (1%)
(4%)
(11%)
(2%) (3%)
(1%) – 1% 0% - 3%
(1%) – 1% 0% - 3%
Q1-2020 Q2-2020 Q3-2020 Q4-2020 Q1-2021Forecast
FY 2021Forecast
Total Growth Organic Growth
(5%)
(17%)
(7%)
(10%)
(13%) – (15%)
(4%) – (7%)
Q1-2020 Q2-2020 Q3-2020 Q4-2020 Q1-2021Forecast
FY 2021Forecast
Total & Organic Growth
5%
3%
5%5%
4%
2%
5% 5%
4% - 5%4.5% - 5.5%
3.5% - 4.5%
4.5% - 5.5%
Q1-2020 Q2-2020 Q3-2020 Q4-2020 Q1-2021Forecast
FY 2021Forecast
Total Growth Organic Growth
3%
0%
3%2%
2%
(2%)
2% 2%
1.5% - 2.5%3% - 4%
1.5% - 2.5%
3% - 4%
Q1-2020 Q2-2020 Q3-2020 Q4-2020 Q1-2021Forecast
FY 2021Forecast
Total Growth Organic Growth
2020 FY
Organic = 1.2%2020 FY
Organic = 3.8%
2020 FY
Organic = (5%)
2020 FY
Organic = (10%)
35 Note: Before currency
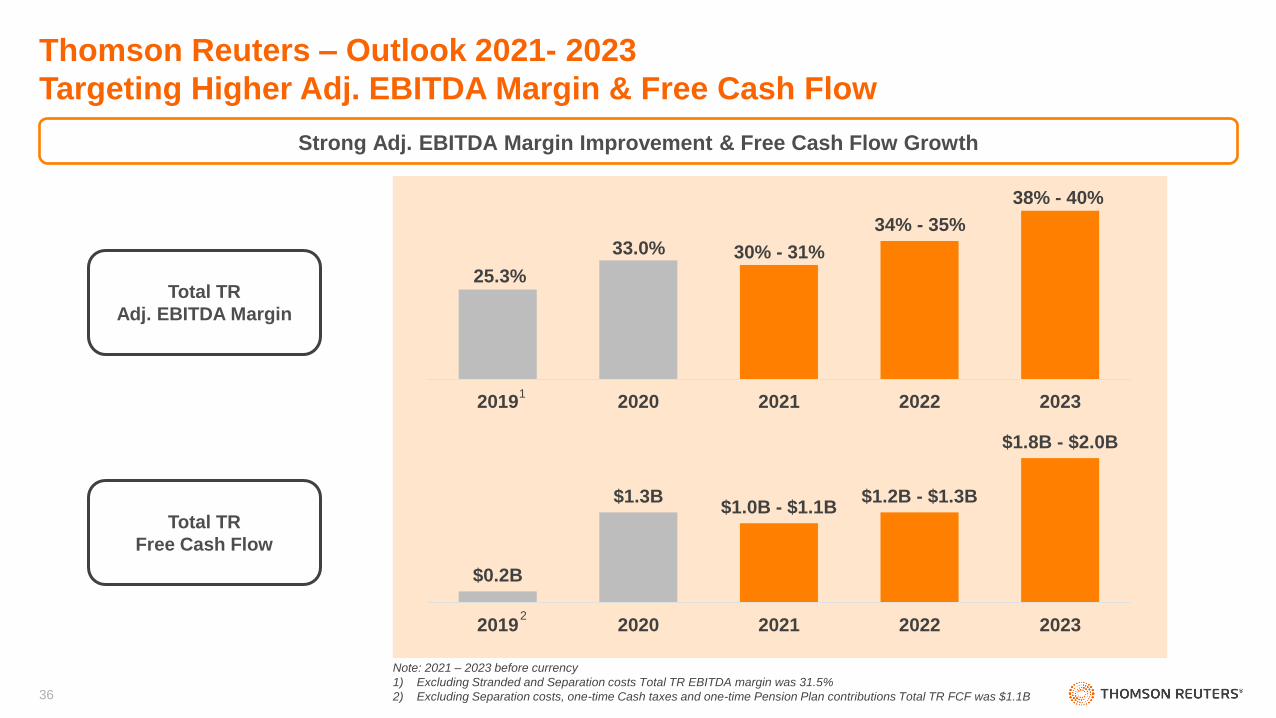
Total TR
Adj. EBITDA Margin
34% - 35%
2019 2020 2021 2022 2023
25.3%
33.0% 30% - 31%
Total TR
Free Cash Flow
38% - 40%
$0.2B
$1.3B$1.0B - $1.1B
$1.2B - $1.3B
$1.8B - $2.0B
2019 2020 2021 2022 2023
Note: 2021 – 2023 before currency
1) Excluding Stranded and Separation costs Total TR EBITDA margin was 31.5%
2) Excluding Separation costs, one-time Cash taxes and one-time Pension Plan contributions Total TR FCF was $1.1B
1
2
Strong Adj. EBITDA Margin Improvement & Free Cash Flow Growth
Thomson Reuters – Outlook 2021- 2023
Targeting Higher Adj. EBITDA Margin & Free Cash Flow
36
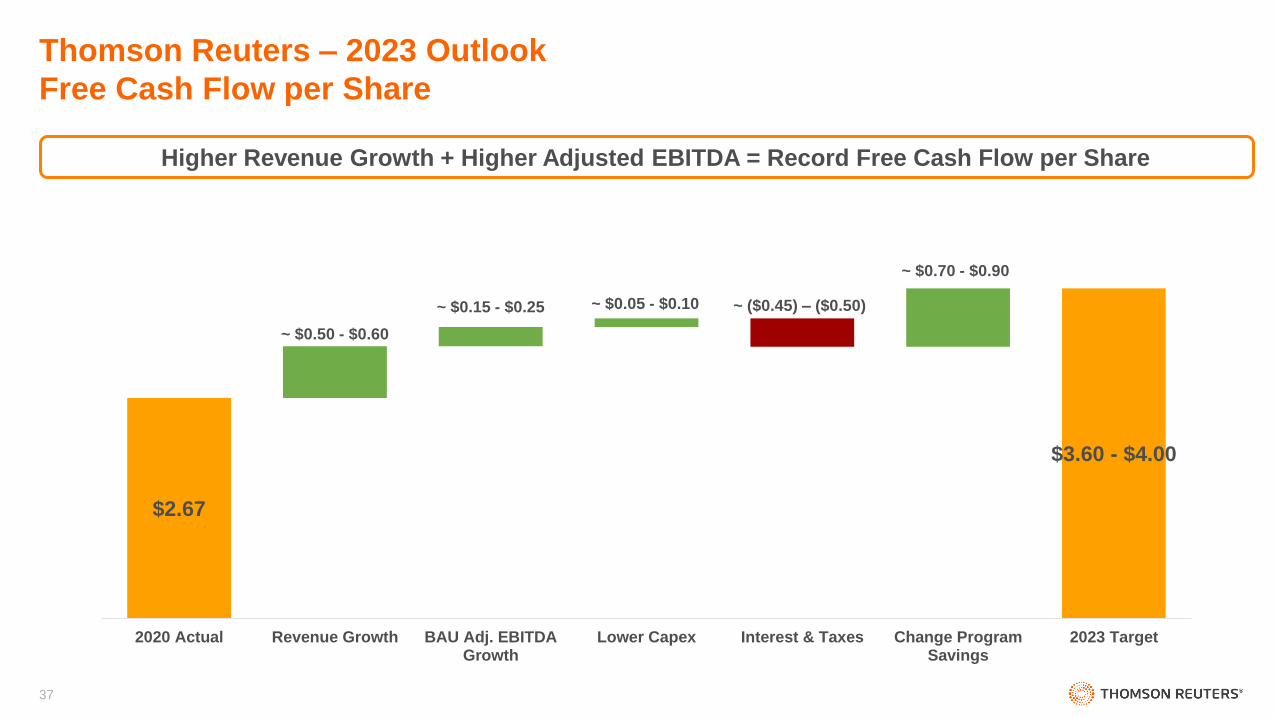
$2.67
$3.60 - $4.00
~ $0.50 - $0.60
~ $0.15 - $0.25 ~ $0.05 - $0.10
~ $0.70 - $0.90
~ ($0.45) – ($0.50)
2020 Actual Revenue Growth BAU Adj. EBITDAGrowth
Lower Capex Interest & Taxes Change ProgramSavings
2023 Target
Higher Revenue Growth + Higher Adjusted EBITDA = Record Free Cash Flow per Share
Thomson Reuters – 2023 Outlook
Free Cash Flow per Share
37
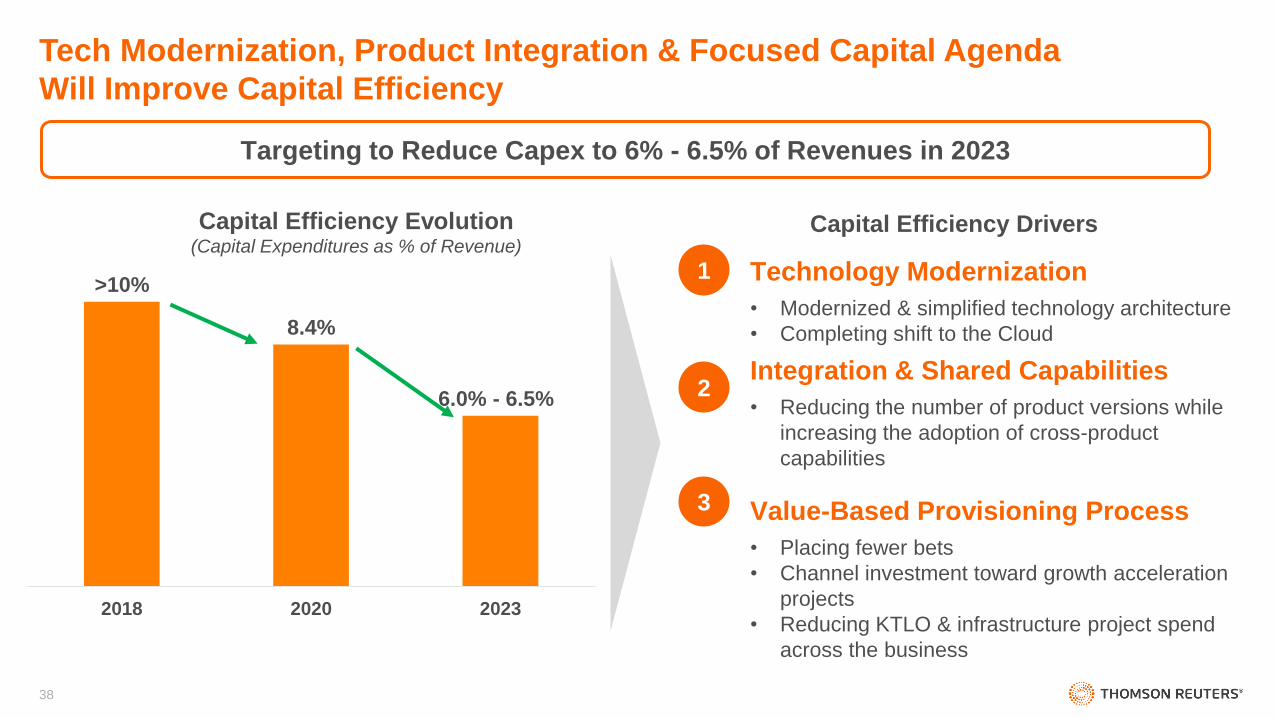
>10%
8.4%
6.0% - 6.5%
2018 2020 2023
Technology Modernization
• Modernized & simplified technology architecture
• Completing shift to the Cloud
Integration & Shared Capabilities
• Reducing the number of product versions while
increasing the adoption of cross-product
capabilities
Value-Based Provisioning Process
• Placing fewer bets
• Channel investment toward growth acceleration
projects
• Reducing KTLO & infrastructure project spend
across the business
1
2
3
Targeting to Reduce Capex to 6% - 6.5% of Revenues in 2023
Capital Efficiency Evolution (Capital Expenditures as % of Revenue)
Capital Efficiency Drivers
Tech Modernization, Product Integration & Focused Capital Agenda
Will Improve Capital Efficiency
38

Phasing of Change Program Investments
~60%
H2-2021
~60%
~40%
~60%
~40%
~40%
H1-2021 FY 2021
OpEx
Capital
~$115M - $140M
~$185M - $210M
~$300M - $350M
2021 Phasing
Forecast More Than Half of Change Program Costs Will Be Incurred in 2021
39
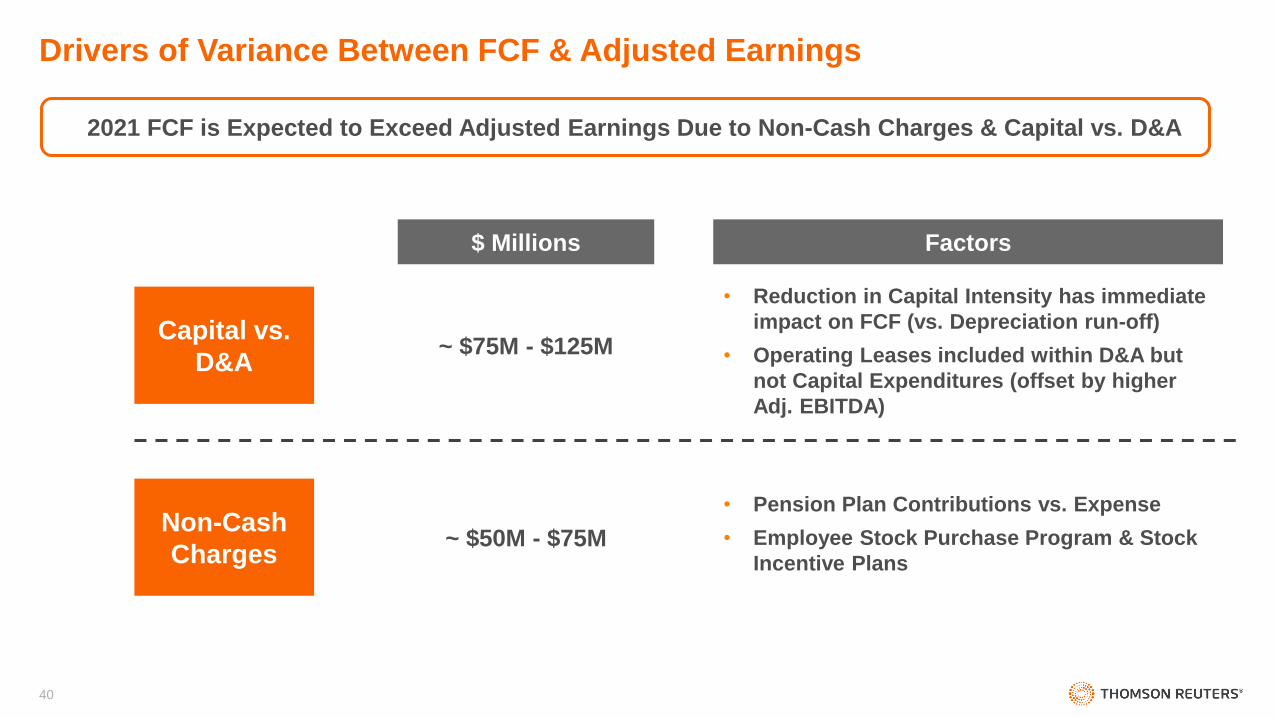
Non-Cash
Charges
Capital vs.
D&A
$ Millions Factors
~ $50M - $75M
~ $75M - $125M
• Pension Plan Contributions vs. Expense
• Employee Stock Purchase Program & Stock
Incentive Plans
• Reduction in Capital Intensity has immediate
impact on FCF (vs. Depreciation run-off)
• Operating Leases included within D&A but
not Capital Expenditures (offset by higher
Adj. EBITDA)
Drivers of Variance Between FCF & Adjusted Earnings
2021 FCF is Expected to Exceed Adjusted Earnings Due to Non-Cash Charges & Capital vs. D&A
40

Total Thomson Reuters2020
Reported
2021
Outlook(1)
2022
Outlook(1)
2023
Outlook(1)
Total Revenue Growth 1.3% 3.0% - 4.0% 4.0% - 5.0% 5.0% - 6.0%
Organic Revenue Growth 1.2% 3.0% - 4.0% 4.0% - 5.0% 5.0% - 6.0%
Adjusted EBITDA Margin 33.0% 30% - 31% 34% - 35% 38% – 40%
Corporate Costs
Core Corporate Costs
Change Program OpEx
$131 million $305 - $340 million
$130 - $140 million
$175 - $200 million
$245 - $280 million
$120 - $130 million
$125 - $150 million
$110 - $120 million
$110 - $120 million
$0
Free Cash Flow $1.3 billion $1.0 - $1.1 billion $1.2 - $1.3 billion $1.8 - $2.0 billion
Capital Expenditures as % of Revenue
Change Program Capex
8.4% 9.0% - 9.5%
$125 - $150 million
7.5% - 8.0%
$75 - $100 million
6.0% - 6.5%
$0
Depreciation & Amortization of computer software $669 million $650 - $675 million $620 - $645 million $580 - $605 million
Interest Expense (P&L) $195 million $190 - $210 million $190 - $210 million $190 - $210 million
Effective Tax Rate on Adjusted Earnings 16.9% 16% - 18% n/a n/a
Big 32020
Reported
2021
Outlook(1)
2022
Outlook(1)
2023
Outlook(1)
Total Revenue Growth 3.4% 4.5% - 5.5% 5.5% - 6.5% 6.0% - 7.0%
Organic Revenue Growth 3.8% 4.5% - 5.5% 5.5% - 6.5% 6.0% - 7.0%
Adjusted EBITDA Margin 37.8% 38% - 39% 41% - 42% 43% - 45%
(1) Before currency, includes Change Program impact and excludes the impact of future acquisitions / dispositions
FY 2021 - 2023 Outlook
41
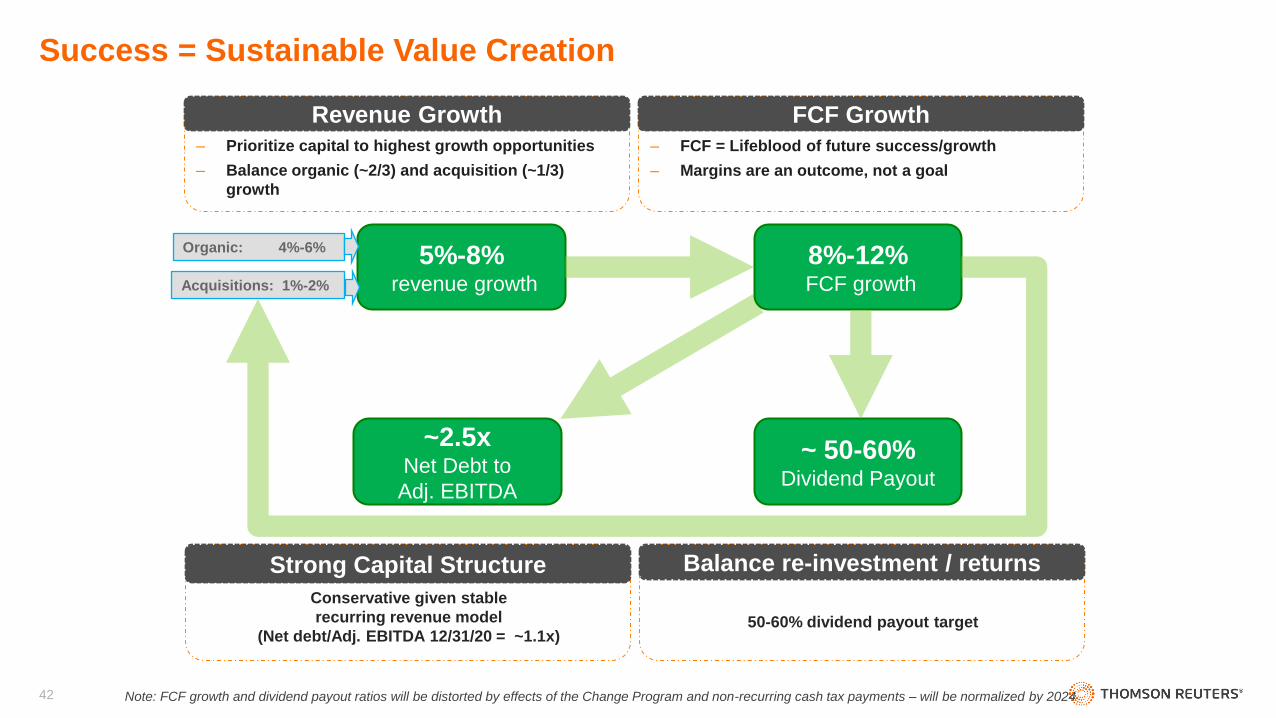
Success = Sustainable Value Creation
Note: FCF growth and dividend payout ratios will be distorted by effects of the Change Program and non-recurring cash tax payments – will be normalized by 2024
‒ Prioritize capital to highest growth opportunities
‒ Balance organic (~2/3) and acquisition (~1/3)
growth
Revenue Growth
‒ FCF = Lifeblood of future success/growth
‒ Margins are an outcome, not a goal
FCF Growth
Conservative given stable
recurring revenue model
(Net debt/Adj. EBITDA 12/31/20 = ~1.1x)
Strong Capital Structure
50-60% dividend payout target
Balance re-investment / returns
5%-8%revenue growth
8%-12%FCF growth
~2.5x Net Debt to
Adj. EBITDA
~ 50-60% Dividend Payout
Organic: 4%-6%
Acquisitions: 1%-2%
42

Q&A
43