Thompson-Okanagan Tourism Labour Market Study Final Report · Thompson-Okanagan Tourism Labour...
71
Thompson-Okanagan Tourism Labour Market Study Final Report Roslyn Kunin & Associates, Inc. (RKA, Inc.) 3449 West 23 rd Avenue Vancouver, BC V6S 1K2 Voice: (604) 736-0783 / Fax: (604) 736-0789 [email protected] http:/www.rkunin.com/ May 29, 2009 The views expressed in this paper are those of the author. The author is responsible for all errors and omissions.
Transcript of Thompson-Okanagan Tourism Labour Market Study Final Report · Thompson-Okanagan Tourism Labour...
Thompson-Okanagan Tourism Labour Market Study
Final Report
Roslyn Kunin & Associates, Inc. (RKA, Inc.) 3449 West 23rd Avenue Vancouver, BC V6S 1K2
Voice: (604) 736-0783 / Fax: (604) 736-0789 [email protected]
http:/www.rkunin.com/
May 29, 2009
The views expressed in this paper are those of the author. The author is responsible for all errors and omissions.
Roslyn Kunin and Associates, Inc.
Table of Contents
Table of Contents ________________________________________________________ ii
Acknowledgements ______________________________________________________ iv
Executive Summary ______________________________________________________ v
1. Introduction _________________________________________________________ 1
2. Methodology ________________________________________________________ 3 2.1. Secondary Research ........................................................................................................3 2.2. Primary Research .............................................................................................................4
3. Regional Tourism Market Overview______________________________________ 5 3.1. Geographic Area...............................................................................................................5 3.2. Visitation Trends ...............................................................................................................7 3.3. Transportation Indicators..................................................................................................8 3.4. Accommodation Trends....................................................................................................8
4. Employment Projections _____________________________________________ 11 4.1. Core Tourism Employment in 2008 ................................................................................12 4.2. Employment Projections to 2011....................................................................................14 4.3. Projecting Ahead to 2015 ...............................................................................................19 4.4. Seasonal Employment....................................................................................................21 4.5. Replacement Needs .......................................................................................................23
5. Labour Supply Issues ________________________________________________ 25 5.1. Demographic Aspects.....................................................................................................25 5.2. Potential Labour Force Growth to 2015..........................................................................31 5.3. Mobility and Labour Supply ............................................................................................34 5.4. Aboriginal Peoples..........................................................................................................36 5.5. Unemployment................................................................................................................37 5.6. Foreign Workers .............................................................................................................39 5.7. Earnings, Hours and Non-Wage Benefits.......................................................................42
6. Assessing the Balance in the Tourism Labour Market _____________________ 44
7. Potential Labour Market and HR Development Strategies___________________ 48 7.1. Recruitment ....................................................................................................................48 7.2. Training...........................................................................................................................49 7.3. Retention ........................................................................................................................50
8. Conclusions________________________________________________________ 54
References_____________________________________________________________ 56
Appendix I List of Focus Group Participants _________________________________ 59
Appendix II Preliminary Employment Projections for Validation in Focus Group Sessions ______________________________________________________________ 60

Roslyn Kunin and Associates, Inc.
III
Appendix III Geographic Boundaries of Tourism Regions and Development Regions 62
Appendix IV Techniques Applied to Derive Employment Estimates and Projections by Occupation ____________________________________________________________ 63
Roslyn Kunin and Associates, Inc.
Acknowledgements
Roslyn Kunin and Associates, Inc. (RKA) would like to thank Mr. Kerry Jothen of Human Capital Strategies and Mr. John Leschyson, Director Industry HR Development of go2 for their guidance and support of this project.
The following organizations were helpful in organizing and hosting focus group sessions and other meetings for the study:
• Manteo Resort, Waterfront Hotel and Villas in Kelowna
• Kamloops Towne Lodge in Kamloops.
RKA further thanks all the Thompson Okanagan tourism and hospitality industry representatives who took the time to answer questions and provide input via industry round-table sessions and telephone interviews. You took scarce time away from your demanding work to provide the current, relevant information without which this report would not have been possible. Your views are reflected in this report, but your anonymity is protected. This project was made possible with the generous support of Human Resourcesand Social Development Canada (HRSDC).
IV
Roslyn Kunin and Associates, Inc.
Executive Summary
In this report, Roslyn Kunin and Associates (RKA) has examined available information regarding overall employment levels and human resource requirements for the tourism industry as a whole in the Thompson Okanagan region. We have examined statistical data sources and survey reports, etc. to gain background information to the tourism industry in the province and in the Thompson Okanagan tourism region specifically.
We then provide estimates of employment in core tourism related occupations in the region in year 2007 and 2008, and provide projections of the same in the period from 2009 to 2015. We have also presented statistical data available concerning different sources of labour that provides for the workforce in the tourism and hospitality industry in the region. In addition, we have provided our estimates and projections of the labour force growth in the region based upon population growth patterns and labour force participation patterns among different age cohorts and gender groups.
Employment in core tourism occupations in this study in the region will continue to grow positively, despite a set-back in 2009. In addition, attrition will result in additional openings for replacement needs. Total potential labour demand is summarized in the Table that follows. Labour force growth, on the other hand, is expected to lag behind employment growth for many of the core tourism occupations in the region, and as such labour shortages in many of the occupations are expected to prevail in the future period from as soon as 2010.
Results shown in this report are also reflective of the two focus group sessions we conducted as well as interviews with industry stakeholders on current labour market conditions, demographic profiles, projected future labour requirements, and challenges faced by employers in recruitment and retention issues.
V
Roslyn Kunin and Associates, Inc.
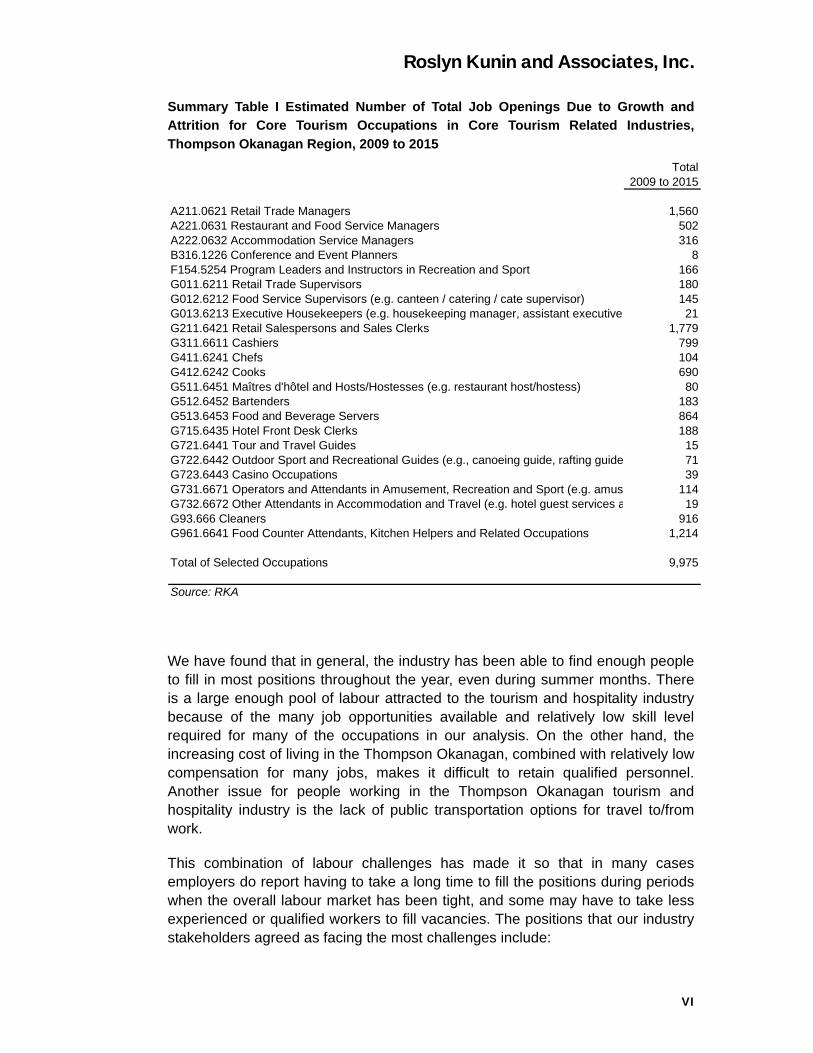
Summary Table I Estimated Number of Total Job Openings Due to Growth and Attrition for Core Tourism Occupations in Core Tourism Related Industries, Thompson Okanagan Region, 2009 to 2015
Total2009 to 2015
A211.0621 Retail Trade Managers 1,560A221.0631 Restaurant and Food Service Managers 502A222.0632 Accommodation Service Managers 316B316.1226 Conference and Event Planners 8F154.5254 Program Leaders and Instructors in Recreation and Sport 166G011.6211 Retail Trade Supervisors 180G012.6212 Food Service Supervisors (e.g. canteen / catering / cate supervisor) 145G013.6213 Executive Housekeepers (e.g. housekeeping manager, assistant executive 21G211.6421 Retail Salespersons and Sales Clerks 1,779G311.6611 Cashiers 799G411.6241 Chefs 104G412.6242 Cooks 690G511.6451 Maîtres d'hôtel and Hosts/Hostesses (e.g. restaurant host/hostess) 80G512.6452 Bartenders 183G513.6453 Food and Beverage Servers 864G715.6435 Hotel Front Desk Clerks 188G721.6441 Tour and Travel Guides 15G722.6442 Outdoor Sport and Recreational Guides (e.g., canoeing guide, rafting guide 71G723.6443 Casino Occupations 39G731.6671 Operators and Attendants in Amusement, Recreation and Sport (e.g. amus 114G732.6672 Other Attendants in Accommodation and Travel (e.g. hotel guest services a 19G93.666 Cleaners 916G961.6641 Food Counter Attendants, Kitchen Helpers and Related Occupations 1,214
Total of Selected Occupations 9,975
Source: RKA
We have found that in general, the industry has been able to find enough people to fill in most positions throughout the year, even during summer months. There is a large enough pool of labour attracted to the tourism and hospitality industry because of the many job opportunities available and relatively low skill level required for many of the occupations in our analysis. On the other hand, the increasing cost of living in the Thompson Okanagan, combined with relatively low compensation for many jobs, makes it difficult to retain qualified personnel. Another issue for people working in the Thompson Okanagan tourism and hospitality industry is the lack of public transportation options for travel to/from work.
This combination of labour challenges has made it so that in many cases employers do report having to take a long time to fill the positions during periods when the overall labour market has been tight, and some may have to take less experienced or qualified workers to fill vacancies. The positions that our industry stakeholders agreed as facing the most challenges include:
VI
Roslyn Kunin and Associates, Inc.
VII
• Housekeeping - first and foremost;
• Culinary staff, specifically cooks (front-line/first), as well as sous chefs and chefs.
• Entry level kitchen (especially dishwashers) and restaurant (i.e. bus people)
Other occupations frequently mentioned as being difficult to fill and/or hold onto good, qualified staff include:
• Foodservers and banquet staff (the Thompson Okanagan tourism and hospitality industry is looking for more people who are qualified and experienced)
• Front-line staff (including front desk)
• Sales staff. Many tourism and hospitality operators are hiring staff in these roles from other industries in order to find the people with the right skills and talent.
Looking ahead, the industry expects to continue to be in short supply of people who can fill the following skilled and semi-skilled positions:
• Building/yards/equipment maintenance/handyman
• Other cleaning/custodial/janitorial positions.
Many areas of the industry face a challenge in recruiting young people into the sector as well as maintaining a level of apprenticeship enrolment that is sustainable to the industry. It is important to communicate to young people the kinds of jobs available in the industry, including career and managerial positions that are in need of young recruits. High school career counsellors and parents also need to be involved to encourage more young people to enter these seemingly unskilled jobs but with potential career opportunities. Certain factors impacting apprenticeship training completions have been identified.
We have also examined other issues related to recruitment and retention of skilled workers for the industry. Utilization of non-traditional types of labour supply, temporary use of foreign workers, seasonal nature of the work, inconsistency of the availability of work, multi-tasking, wages and compensation, and other factors have been thoroughly explored and discussed throughout the report.
Finally, we present recommendations from industry stakeholders on potential ways to better utilize existing sources of labour, and to develop additional sources of labour supply to meet the industry’s needs.
Roslyn Kunin and Associates, Inc.
1. Introduction
Tourism is travel for recreational, leisure or business purposes. The goods and services associated with tourism create the opportunity for employment in many service industries. These service industries include: transportation services, such as airlines, cruise ships and taxis; hospitality services, such as accommodations, including hotels and resorts, and all types of restaurants and food services; entertainment venues, such as amusement parks, casinos, various music venues and the theatre; and retail shopping.
Tourism worldwide has grown to become the largest and fastest growing industry in the world. The tourism industry in British Columbia is a similarly significant and essential component of the provincial economy. In B.C., tourism generates over $9 billion in revenue. While already on a steady path of growth, the provincial government has further tasked the tourism industry with the goal of doubling tourism revenues to almost 20 billion by the year 2015 and to grow B.C.’s role as a prime all-season resort and tourism destination.
As a result of its remarkable expansion over the last 20 years, the British Columbia tourism industry has not only matured impressively but has also developed to become increasingly collaborative, coordinated and forward-thinking. To this end, B.C. tourism businesses recognize the need to research, plan and prepare for their industry’s imminent labour requirements. This task must be done in a way that will ensure maximum benefits from the industry’s upcoming growth while sustaining the world class tourism destination and workforce standards that tourists of the future will continue to expect when they visit British Columbia.
There is recognition of a common need for long term tourism labour force planning and preparation that meets not only provincial tourism goals but also supports local and regional needs. go2 - the B.C. tourism industry’s voice on province-wide tourism labour and employment matters, together with the federal and provincial governments, is coordinating a research initiative to project the future demand and supply for tourism and hospitality labour in the Thompson Okanagan tourism region
Roslyn Kunin & Associates, Inc. (RKA) has been retained to conduct region specific labour market analysis for the Thompson Okanagan tourism region. Specifically, this study’s Project Objectives include the following:
1. To estimate labour demand in the Thompson Okanagan region to 2015;
Thompson-Okanagan Tourism Labour Market Study Final Report May 29, 2009
1
Roslyn Kunin and Associates, Inc.
Thompson-Okanagan Tourism Labour Market Study Final Report May 29, 2009
2
2. To estimate labour supply and potential demand-supply gaps in the tourism region;
3. To ensure industry training requirements are aligned to provincial and regional needs;
4. To engage regional tourism stakeholders in the process to provide direction to the labour market analysis process and to provide regional input into the provincial Human Resources strategy;
5. To use this process as a means of assessing the need for region-specific human resources strategies and where appropriate identifying organizations willing to develop and implement these strategies.
The following report presents the findings of this study. It should be noted that the term “tourism” is used interchangeably with “tourism and hospitality”. The hospitality industry is clearly a significant and very important component of the total tourism industry.
The layout of the report is as follows. In the next section, we will describe the approaches we adopted in collecting data and information for the report. In Sections 3 through 7, we will provide labour market data and analysis from our research. Finally, in Section 8, we will conclude our findings.
Roslyn Kunin and Associates, Inc.
2. Methodology
The methodology for the Thompson Okanagan Labour Market study includes both secondary and primary research involving tourism industry stakeholders throughout the Thompson Okanagan tourism region as well as provincial tourism sector representatives.
2.1. Secondary Research
RKA has reviewed existing data on visitation to the Thompson Okanagan and research studies on tourism and hospitality labour demand, job occupations and human resource requirements and issues related to recruitment, training and retention of the tourism and hospitality workforce. The following provided relevant research data and information:
- go2
- Tourism Kelowna
- Tourism Kamloops
- Thompson Okanagan Tourism Association
- Tourism British Columbia
- British Columbia Council of Tourism Associations
- Canadian Tourism Commission
- Tourism Industry Association of Canada
- BC Stats
- Statistics Canada Census and Labour Force Survey
- Various sources of tourism indicators which provide monthly and current
year-to-date data including airport passenger volume, visitor information
centre visitor parties and other key industry tracking statistics
The References section of this report provides a more detailed listing of the materials used in preparing this report.
Thompson-Okanagan Tourism Labour Market Study Final Report May 29, 2009
3
Roslyn Kunin and Associates, Inc.
Thompson-Okanagan Tourism Labour Market Study Final Report May 29, 2009
4
2.2. Primary Research
The primary research for this project was conducted during February, March and April 2009. The following interrelated approaches to information gathering were implemented:
- Round Table/Focus Groups with tourism and hospitality industry representatives in Kelowna and Kamloops; and,
- Follow-up interviews with employers and other regional and industry stakeholders
The purpose of the round table/focus groups was to discuss the current labour situation with regards to tourism and hospitality growth, occupation needs, issues and requirements and to present and “test” different growth scenarios for the regional industry’s labour market needs to the year 2015. The round table/focus group discussions were setup with assistance from go2 and its tourism industry partners. Meeting agenda and handouts with Thompson Okanagan tourism region employment data, charts and statistics on job occupations were prepared for each focus group and handed out to the participants. Appendix I and II provide these materials as well as a list of participants.
All focus group participants were sent an honorarium of $50 as a token of appreciation from go2.
Roslyn Kunin and Associates, Inc.
3. Regional Tourism Market Overview
In this Section, we provide an overview of geographic and tourism market information for the Thompson Okanagan Tourism Region. We also provide information on recent trends in the tourism market. Overall, the analysis shows the Thompson Okanagan offers a diverse tourism product and the area has been one of the fastest growing tourism regions in British Columbia.
It is to be noted that not all data is available for 2008 at the time of finalizing this report.
3.1. Geographic Area
The Thompson Okanagan tourism region is well-known for its orchards, vineyards, skiing, golf, deserts, mountains and lakes. Highlights of the region’s attractions include the Okanagan lakes system, Shuswap Lake, Mount Robson (the highest peak in the Canadian Rockies), Osoyoos (Canada's only authentic desert), and Wells Gray Provincial Park (which has the fourth highest waterfall in Canada).
The Thompson Okanagan region enjoys an average of more than 2000 hours of sunshine annually, making it an ideal destination for seasonal outdoor recreation activities. In summer, the region offers popular hiking, golfing, cycling, camping, and fishing opportunities. In winter, excellent cross-country and downhill skiing, and snowboarding opportunities are available. The four major ski resorts in the region all have excellent ski-in ski-out accommodations and include:
• Sun Peaks near Kamloops;
• Silver Star near Vernon;
• Big White near Kelowna; and,
• Apex near Penticton.
There are more than 45 golf courses in the Thompson Okanagan, which range from tournament calibre to 9-hole recreational. In addition to the diversity of recreational opportunities, visitors can tour the lush Okanagan Valley's numerous vineyards and orchards, or attend year-round wine festivals. The history and culture of the Thompson Okanagan region are tied to the land and its many features, offering museums and heritage sites which present tales of Aboriginal heritage, cattle ranches, farms and mining operations, as well as natural history.
Thompson-Okanagan Tourism Labour Market Study Final Report May 29, 2009
5
Roslyn Kunin and Associates, Inc.
The Thompson Okanagan region is centrally located in British Columbia, and within relatively short driving distance (4 to 7 hours) of four important visitor markets: Vancouver, Calgary, Seattle, and Spokane, Washington. Three commercial airports offering daily flights to major cities are located in the Thompson Okanagan region, at Kelowna, Kamloops, and Penticton. Both the Kelowna and Kamloops airports have been recently upgraded. WestJet offers regularly scheduled service to the area’s key visitor markets of Vancouver and Calgary, as well as Toronto. Airstrips for light aircraft are located at Vernon, Lumby, Oliver, Salmon Arm, and Princeton.
The two major urban centres of the Thompson Okanagan region are: Kamloops and Kelowna. Both cities have enjoyed steady population growth in recent years along with an increase of services and facilities which benefit residents and tourists alike.
Kamloops is located at the hub of four major highways and is one of only two places in Canada where the two national railways (CP and CN) intersect in city limits. VIA Rail and Rocky Mountaineer trains stop at various locations throughout the region.
The City of Kamloops has long recognized Sport Tourism as an important economic generator for the City and has thus branded the City “The Tournament Capital of Canada”. To this end, over $50 million has been invested in new and renovated facilities and sport tourism is now the fastest growing segment of the local tourism economy, generating approximately $2.4 billion a year in revenue.
The Tournament Capital Centre is an outstanding facility recently completed in Kamloops as a part of the city's Tournament Capital Program. This world class facility includes a Fieldhouse, Gymnastics Centre, Canada Games Aquatic Centre, Indoor Throws Room, Work-out facilities, Outdoor Artificial Turf Soccer Field, and several banquet rooms and retail space. There are 16 change rooms in total and a media press room. The unique Fieldhouse facility alone consists of an indoor 6 lane, 200 metre track surrounding three NBA size basketball courts and seating for 2,200. The room itself is the size of three NHL Hockey rinks (65,000 square feet) and has a vinyl floor that can be used for meetings and trade shows.
Other examples of extensive tourism product development around Kamloops include over 13 golf courses, three of which are new, and the recent announcement of Sedric’s Adventure Resort and Theme Park, with Phase I opening in 2010. This $200 million plus project will be a high-tech water park spread over a 45 acre site.
Kelowna is the largest city in British Columbia’s Okanagan Valley, and is situated on the eastern shore of Okanagan Lake. Kelowna is mid-way between Penticton in the south and Vernon in the north. The Okanagan Valley is popular for the many leisure and outdoor activities offered throughout the Thompson Okanagan
Thompson-Okanagan Tourism Labour Market Study Final Report May 29, 2009
6
Roslyn Kunin and Associates, Inc.
region and most of the province’s vineyards are located in this area “Wine tourism” has been actively promoted and become very popular in the Okanagan Valley in recent years.
A recent new addition to Kelowna’s inventory of recreational facilities is the H2O Adventure + Fitness Centre, which is the largest municipally owned water park in Canada and features an Olympic length 50 meter pool, wave pool, river run, 3 water slides, children’s water play area, and an ocean wave surf simulator. There is also a 12,000 square foot cardio and weight equipment and exercise space, all of which is open to both residents and visitors.
Note that throughout the report, due to availability of data, we will provide statistical data and projections and other information pertaining to the Thompson-Okanagan Development Region. The geographic boundaries of tourism regions and development regions in the province are shown in Appendix III.
3.2. Visitation Trends
The Thompson Okanagan has experienced growth in tourist visitations as evidenced by the analysis of available tourist data, including statistics gathered on customs entries, vehicle counts, airport passenger volumes and accommodation revenue and supply.
• Overall 2009 visitor volumes are down year-to-date in the ski sector, due mainly to the worldwide economic slowdown.
• Operators seem cautiously optimistic about the summer months, recognizing that visitors will be more price sensitive than in the past.
• The outlook for the Olympic period in 2010 is to expect moderate impact. Potentially, the ski resorts could experience some increased business during the two weeks of the Olympics as regular Vancouver and Whistler area skiers choose to ski elsewhere during that time in order to completely avoid the crowds.
• Historical visitation data for the Thompson Okanagan showed an increase in the number of overseas visitors in 2007 (up 48% compared to 2006); and a decrease in the number of overnight entries from U.S. visitors (down 3.6% over 2006).
• Overall, there was a decline of 3.1% for all entries to the Thompson Okanagan region in 2007, compared to 2006. After experiencing growth in customs entries from 2000 to 2002, the region has seen an overall decline in customs entries of 3.8% from 2000 to 2007.
Thompson-Okanagan Tourism Labour Market Study Final Report May 29, 2009
7
Roslyn Kunin and Associates, Inc.
• 2007 was identified as a peak year for visitation but business generated by tourism and hospitality operators in 2008 was still seen as very steady, with perhaps just a slight drop over 2007 levels.
• US/Canada land border crossing changes come into effect on June 1, 2009. Passport ID will be required as part of a "Western Hemisphere Travel Initiative" to help ensure border security. This travel restriction is expected to further hinder growth from the US visitor market, especially in the short term.
3.3. Transportation Indicators
Visitation to the Thompson Okanagan tourism region remained steady in 2008, despite early indications of a faltering economy and dropping tourism demand noticeable in other parts of B.C. and North America.
• Average monthly vehicle traffic on the Coquihalla highway was up slightly (+1.2%) in 2008 over 2007.
• Kelowna airport saw an annual passenger volume increase of +2.3% in 2008 over 2007. 1,394,283 passengers travelled through the airport in 2008.
• Kamloops airport is in the process of a significant expansion. Its passenger volumes increased +12.7% in 2008 over 2007. The start-up of direct flight travel to/from Calgary with WestJet was a major source of the increase. Total passenger volume was 226,141 in 2008.
3.4. Accommodation Trends
Room Revenue data for the Thompson Okanagan has shown strong growth, increasing 50% since 2000.
• Kamloops and Kelowna are the most visited destinations in the Thompson Okanagan and also contribute over 50% of room revenue receipts.
• Penticton is a popular beachside community. The two other communities in the region which have experienced the strongest revenue growth are Oliver/Okanagan Falls and Osoyoos.
• Motels earn a higher proportion of room revenue in the Thompson Okanagan than in other B.C. tourism regions. There are few very large hotels (+250 rooms) in this region.
Thompson-Okanagan Tourism Labour Market Study Final Report May 29, 2009
8
Roslyn Kunin and Associates, Inc.
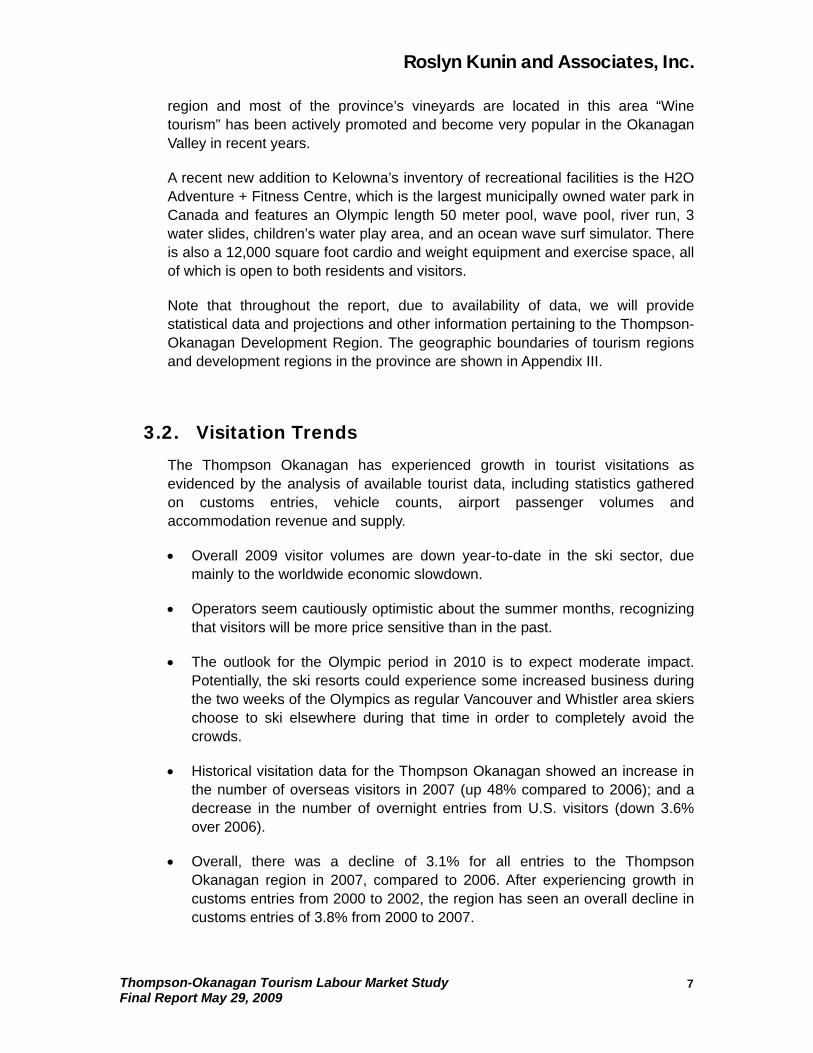
Figure 1: Thompson Okanagan and British Columbia Annual Room Revenue and Percent Change, 2000-2008 ($ thousands)
Room Revenue 2000 2001 2002 2003 2004 2005 2006 2007 2008
Thompson Okanagan 185,515 191,956 206,883 214,550 231,041 251,869 273,102 306,729 278,281% Change 3.5% 7.8% 3.7% 7.7% 9.0% 8.4% 12.3% 1.6%
British Columbia 1,442,901 1,474,160 1,506,360 1,485,670 1,590,956 1,688,343 1,815,312 1,967,921 1,975,793% Change 2.2% 2.2% -1.4% 7.1% 6.1% 7.5% 8.4% 0.4%
Source: British Columbia Tourism Room Revenue, B.C. Stats
• Data from B.C. Stats on the supply of accommodation properties in the Thompson Okanagan show relatively little change in the number of properties, however, both Kamloops and Kelowna either have new properties opening in 2009/2010 or planned.
• In the Kamloops area, Holiday Inn and Best Western will be opening in 2009, and the Sandman Hotel is planned for sometime around 2010/11. In addition, the recently announced Sedrics Water theme park will include a marquee hotel.
• Kelowna has experienced a strong surge in its accommodation supply just recently, including a new property in the Westbank area as well new additions and/or expansions of Sandman, Comfort Inn and Suites, Best Western, Fairfield and Holiday Inn. No further expansion of the accommodation supply is forecast for the next 5 years.
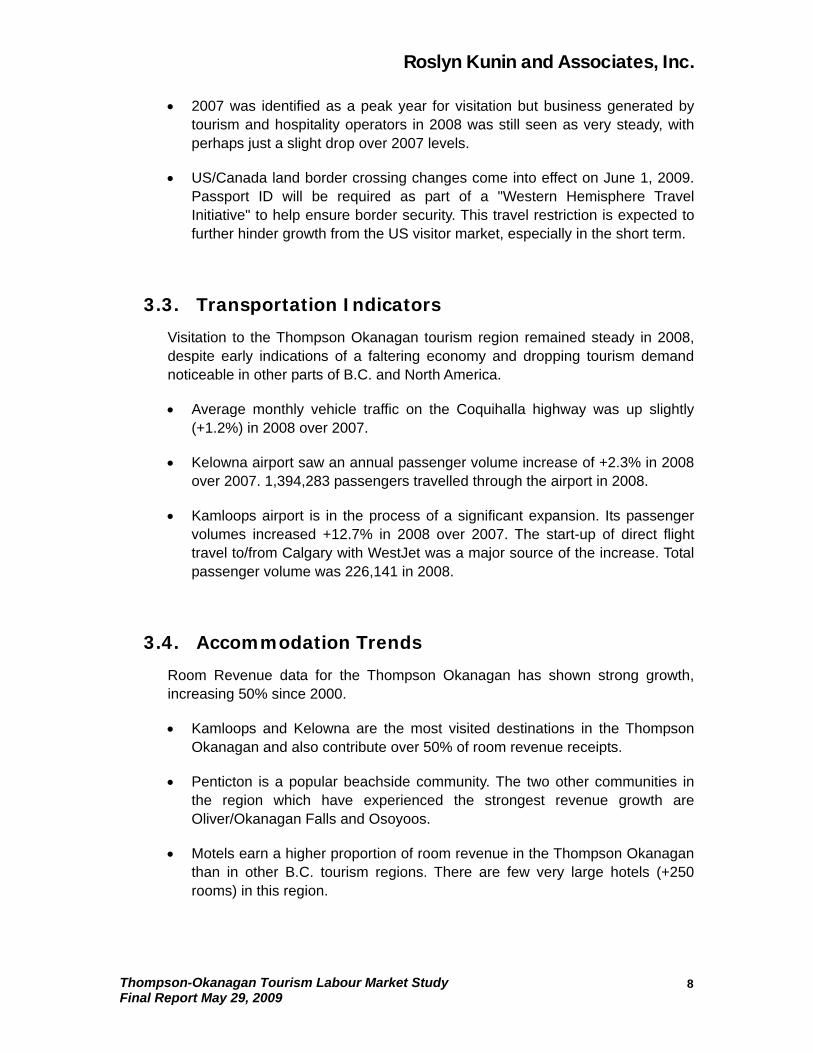
Figure 2: Thompson Okanagan and British Columbia Annual Accommodation Property Inventory and Percent Change, 2000-2007
Properties 2000 2001 2002 2003 2004 2005 2006 2007 2008
Thompson Okanagan 600 612 618 625 639 625 611 613 n/a% Change 2.0% 1.0% 1.1% 2.2% -2.2% -2.2% 0.3%
British Columbia 2,422 2,473 2,493 2,499 2,553 2,567 2,542 2,501 n/a% Change 2.1% 0.8% 0.2% 2.2% 0.5% -1.0% -1.6%
Source: British Columbia Tourism Room Revenue, B.C. Stats
• The historical data available from B.C Stats shows a moderate increase in the room inventory of the Thompson Okanagan, of approximately 10% since 2000.
• There has been some merging of older properties to build newer, larger properties, such as the Manteo Resort, Waterfront Hotel and Villas in
Thompson-Okanagan Tourism Labour Market Study Final Report May 29, 2009
9
Roslyn Kunin and Associates, Inc.
Thompson-Okanagan Tourism Labour Market Study Final Report May 29, 2009
1
Kelowna, as well as upgrading and expansions of existing accommodation properties.
• The new accommodation properties projected for Kamloops are estimated to provide up to 300-400 new rooms in the near future.
• The recent new and/or expanded properties in Kelowna have already added approximately 350+ new rooms to the area’s supply.
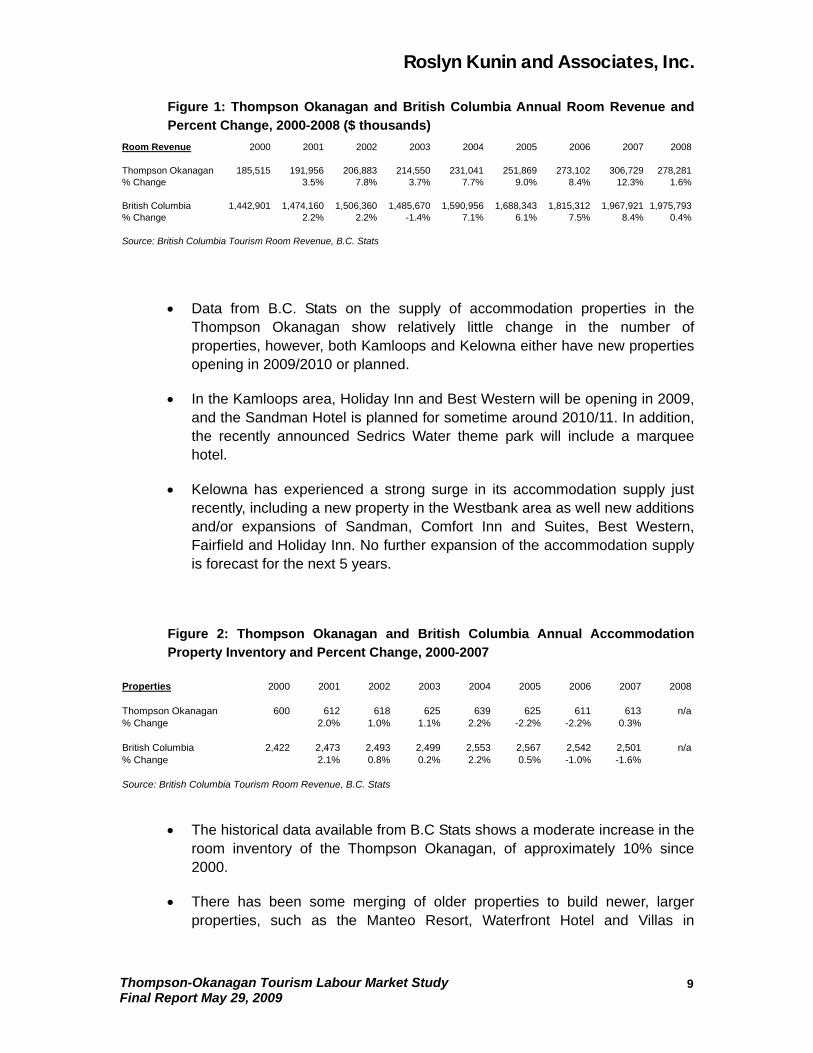
Figure 3: Thompson Okanagan and British Columbia Annual Accommodation Room Inventory and Percent Change, 2000-2007
Properties 2000 2001 2002 2003 2004 2005 2006 2007 2008
Thompson Okanagan 600 612 618 625 639 625 611 613 n/a% Change 2.0% 1.0% 1.1% 2.2% -2.2% -2.2% 0.3%
British Columbia 2,422 2,473 2,493 2,499 2,553 2,567 2,542 2,501 n/a% Change 2.1% 0.8% 0.2% 2.2% 0.5% -1.0% -1.6%
Source: British Columbia Tourism Room Revenue, B.C. Stats
0
Roslyn Kunin and Associates, Inc.
4. Employment Projections
In evaluating tourism labour market conditions, it is first important to realize that tourism is not a stand-alone industry in the standard industry classification. Tourism activities span over a number of industries and as such tourism employment refers to the sum of employment in a number of industries.
There are at least two different ways of measuring tourism employment. Statistics Canada at the national level and at the provincial level the BC Stats define the tourism sector as one which “includes a number of different industries that directly sell goods and services to tourists. These include some types of retailers (e.g., food stores, general merchandise stores, gas stations, RV dealers, clothing stores, and small retailers who sell souvenirs and other gift items to visitors)”, as well as some in the transportation sector, some in the amusement and recreation industries, many in accommodation and food services industries, and some in other industries such as telecommunication services and auto repair services (Hallin, 2008). Since not all businesses in these industries serve tourists exclusively, only some of the total employment in these industries can be attributed to tourism activities.
There are issues regarding this way of measurement. There may be different ways of defining a tourist. Also to consider is the way shares in each of the above industries should be defined as attributing to tourism activities. Currently BC Stats allocates shares in each of the related industries in the following manner, with revisions made in 2007 (Hallin, 2008):
• For transportation, the tourist proportion of passenger air transportation was reduced from just under 100% to 95%, bringing it more in line with ratios used in other jurisdictions.
• The tourist proportion of passenger rail transportation was increased from 86% to 92%.
• For public passenger transit, the tourist proportion was increased from less than one percent to 3.5%.
• For retail trade, the tourist proportion for food and drug stores was reduced from 12.5% to 7.5%.
• For clothing stores, there was also a reduction, from 10% to 7%.
• In the accommodation industry, the tourist proportion for campgrounds was reduced to 95%. However, campgrounds account for a very small percentage of total industry output, so the effect of this change on the overall numbers is minimal. (Note that the proportion attributed to tourists in other types of accommodation arrangements remains unchanged.)
Thompson-Okanagan Tourism Labour Market Study Final Report May 29, 2009
11
Roslyn Kunin and Associates, Inc.
• For food and drinking places, the tourism proportions in use were reduced to 22.5% for full and limited service restaurants and drinking places. For other types of food services (which includes caterers plus mobile food services), the tourist share was reduced to 10%, since this industry primarily serves local residents.
• In amusement and recreation, the ratio for theatrical and staged entertainment was increased to 20% to account for regional shows throughout BC where most of the paying audience is tourists. Similarly, the golf course proportion was increased to 24.5%, based on information obtained from the BC Golf Association.
• For car and truck rentals, the tourism proportion was reduced to 70% to account for local usage of these services.
• The ratio for university and college education was reduced to 0.4%.
Unfortunately a similar method to assess tourism employment level on a sub-provincial basis is not possible due to lack of regional level data in GDP and employment. Also, from a human resources planning perspective, differentiating a worker in the same industry depending on whether he serves a tourist or a local resident can be misleading. This is because the skills acquired are mostly transferrable, and as such it is reasonable to estimate tourism employment focusing on industries and occupations that are core to tourism activities. This is also a method consistent with that utilized in two previous regional labour market studies completed in 2006 and 2007 for tourism regions in British Columbia.
For the purposes of this report, we will focus our analysis on the core industries of accommodation, food and beverage services, as well as amusement and recreation. Other industries that are closely related to serving tourists are retail trade and transportation. For occupational analysis, we will concentrate on key occupations in these industries serving tourists.
4.1. Core Tourism Employment in 2008
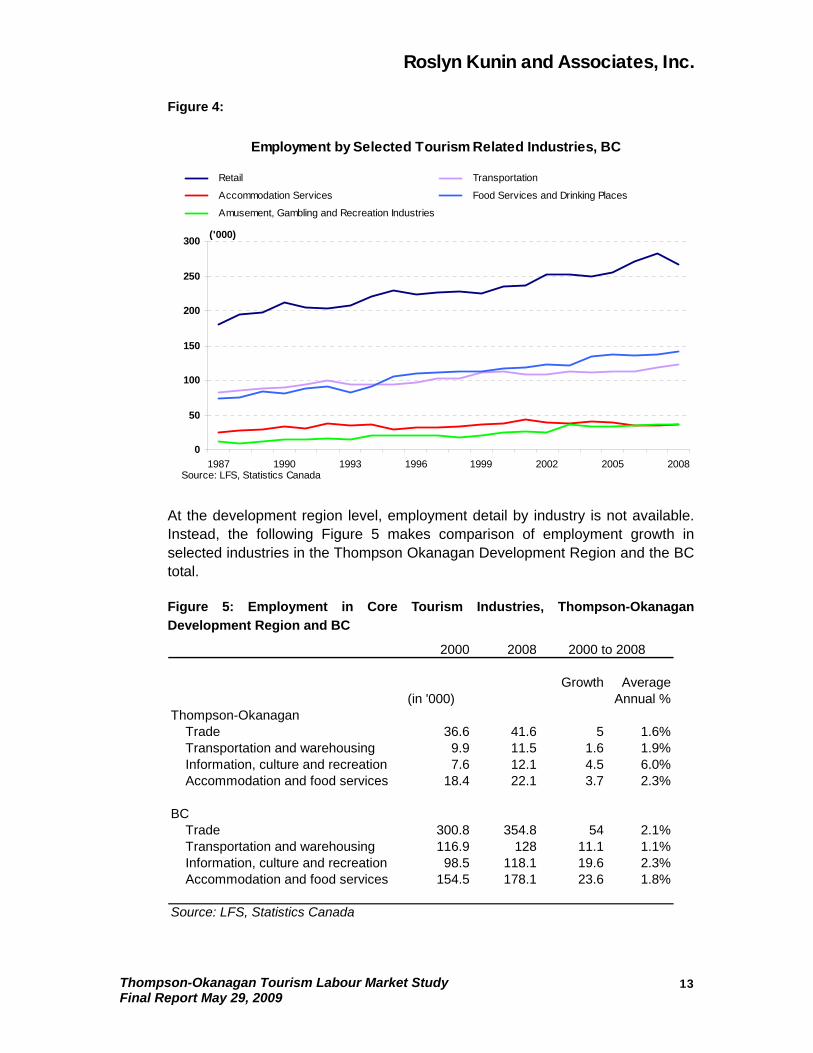
Within BC between the years of 2000 and 2008, overall employment growth in the economy was at an average growth rate of 2.3% per year. Employment growth of these core tourism related industries varied. The one that has experienced strongest growth is Amusement, Gambling, and Recreation Services, at an annual growth rate of 5.0%. Next is the Food and Beverage Services, at an annual growth rate of 2.4%. Employment growth in other three industries (Retail Trade, Transportation, and Accommodation Services) is lower than the provincial average. In fact, the Accommodation Services industry experienced a slight decline in overall employment at the rate of 0.4% per year. Actual employment in these industries is shown in Figure 4.
Thompson-Okanagan Tourism Labour Market Study Final Report May 29, 2009
12
Roslyn Kunin and Associates, Inc.
Figure 4:
Employment by Selected Tourism Related Industries, BC
0
50
100
150
200
250
300
1987 1990 1993 1996 1999 2002 2005 2008
Retail Transportation
Accommodation Services Food Services and Drinking Places
Amusement, Gambling and Recreation Industries
('000)
Source: LFS, Statistics Canada
At the development region level, employment detail by industry is not available. Instead, the following Figure 5 makes comparison of employment growth in selected industries in the Thompson Okanagan Development Region and the BC total.
Figure 5: Employment in Core Tourism Industries, Thompson-Okanagan Development Region and BC
2000 2008 2000 to 2008
Growth Average(in '000) Annual %
Thompson-Okanagan Trade 36.6 41.6 5 1.6% Transportation and warehousing 9.9 11.5 1.6 1.9% Information, culture and recreation 7.6 12.1 4.5 6.0% Accommodation and food services 18.4 22.1 3.7 2.3%
BC Trade 300.8 354.8 54 2.1% Transportation and warehousing 116.9 128 11.1 1.1% Information, culture and recreation 98.5 118.1 19.6 2.3% Accommodation and food services 154.5 178.1 23.6 1.8%
Source: LFS, Statistics Canada
Thompson-Okanagan Tourism Labour Market Study Final Report May 29, 2009
13
Roslyn Kunin and Associates, Inc.
Thompson-Okanagan Tourism Labour Market Study Final Report May 29, 2009
14
It should be noted that industry aggregation shown in Fig. 5 is broader than those shown in the previous Fig. 4, due to availability of data.
In estimating occupational employment for the region, our starting point is the estimated number of employed by occupation for Development Regions in the province, through BC Stats’ Regional Employment Projection Model (REPM) (BC Stats, 2007). Our estimate of total employment in core tourism occupations in the Thompson-Okanagan region in 2008 was 60,500, an increase of 0.7% over 2007. Between 2006 and 2007, the region experienced exceptionally strong employment growth in these core tourism occupations, and the growth rate was 7.5%.
In 2008, occupations in Information, Culture and Recreation experienced strongest employment growth, while those occupations mainly employed in the Trade industry experienced a decline in employment. Those occupations in Transportation and Warehousing experienced fairly strong employment growth as well, as those in Accommodation and Food Services experienced modest employment growth.
This is consistent with feedback from industry sources during focus group sessions held in Kelowna and Kamloops. The region has experienced exceptionally strong employment growth in recent years. The year 2007 was one in which many felt the pressure from severe labour shortage, and tourist visitation and employment growth were still strong in 2008.
4.2. Employment Projections to 2011
Figure 6 provides the occupation detail for projected employment levels in each of the core tourism related occupations to year 2011.
For estimating employment in 2009, the current economic downturn that is occurring globally and its resulting negative impact on employment in essentially every industry has been taken into account.
In looking at the overall economic picture, the following points come from the Tourism Industry Association of Canada (TIAC):
• Economy has been "drawn into the vortex of recession"(OECD)
• The present forecast for international tourism by the United Nations World Tourism Organization calls for between 0% and 2% decline in 2009.
• International tourism could decline by 3% if the economy continues to falter.
Roslyn Kunin and Associates, Inc.
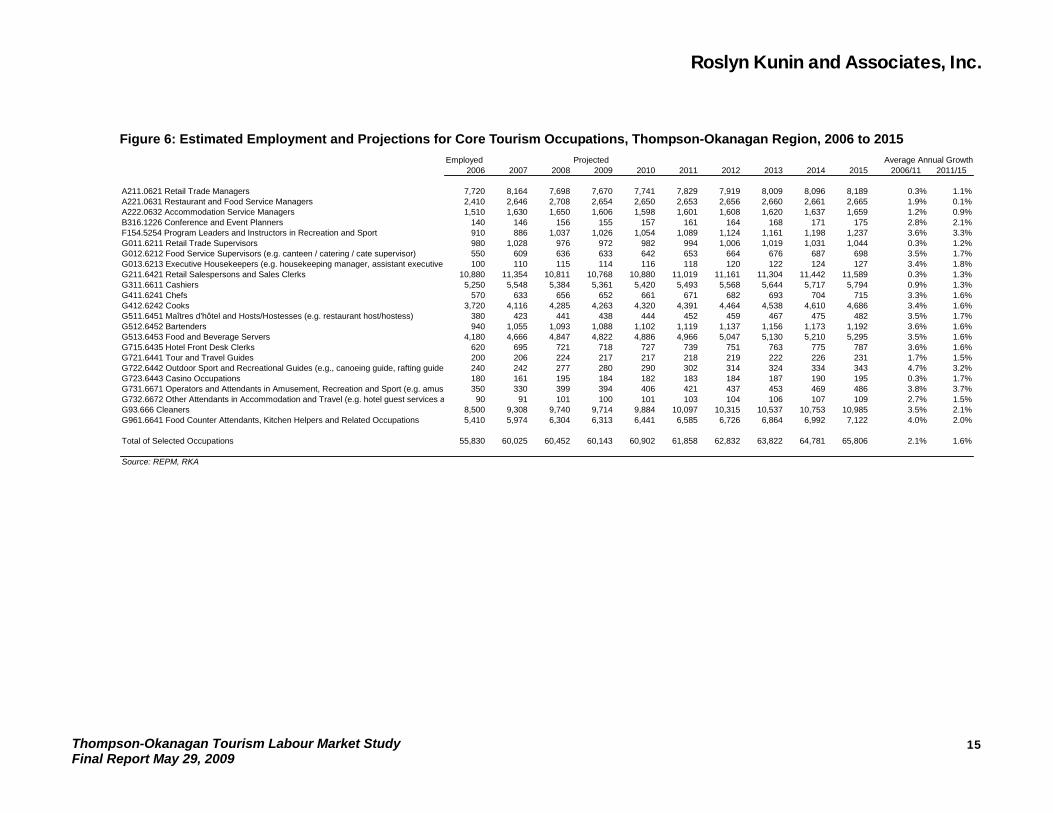
Figure 6: Estimated Employment and Projections for Core Tourism Occupations, Thompson-Okanagan Region, 2006 to 2015 Employed Projected Average Annual Growth
2006 2007 2008 2009 2010 2011 2012 2013 2014 2015 2006/11 2011/15
A211.0621 Retail Trade Managers 7,720 8,164 7,698 7,670 7,741 7,829 7,919 8,009 8,096 8,189 0.3% 1.1%A221.0631 Restaurant and Food Service Managers 2,410 2,646 2,708 2,654 2,650 2,653 2,656 2,660 2,661 2,665 1.9% 0.1%A222.0632 Accommodation Service Managers 1,510 1,630 1,650 1,606 1,598 1,601 1,608 1,620 1,637 1,659 1.2% 0.9%B316.1226 Conference and Event Planners 140 146 156 155 157 161 164 168 171 175 2.8% 2.1%F154.5254 Program Leaders and Instructors in Recreation and Sport 910 886 1,037 1,026 1,054 1,089 1,124 1,161 1,198 1,237 3.6% 3.3%G011.6211 Retail Trade Supervisors 980 1,028 976 972 982 994 1,006 1,019 1,031 1,044 0.3% 1.2%G012.6212 Food Service Supervisors (e.g. canteen / catering / cate supervisor) 550 609 636 633 642 653 664 676 687 698 3.5% 1.7%G013.6213 Executive Housekeepers (e.g. housekeeping manager, assistant executive 100 110 115 114 116 118 120 122 124 127 3.4% 1.8%G211.6421 Retail Salespersons and Sales Clerks 10,880 11,354 10,811 10,768 10,880 11,019 11,161 11,304 11,442 11,589 0.3% 1.3%G311.6611 Cashiers 5,250 5,548 5,384 5,361 5,420 5,493 5,568 5,644 5,717 5,794 0.9% 1.3%G411.6241 Chefs 570 633 656 652 661 671 682 693 704 715 3.3% 1.6%G412.6242 Cooks 3,720 4,116 4,285 4,263 4,320 4,391 4,464 4,538 4,610 4,686 3.4% 1.6%G511.6451 Maîtres d'hôtel and Hosts/Hostesses (e.g. restaurant host/hostess) 380 423 441 438 444 452 459 467 475 482 3.5% 1.7%G512.6452 Bartenders 940 1,055 1,093 1,088 1,102 1,119 1,137 1,156 1,173 1,192 3.6% 1.6%G513.6453 Food and Beverage Servers 4,180 4,666 4,847 4,822 4,886 4,966 5,047 5,130 5,210 5,295 3.5% 1.6%G715.6435 Hotel Front Desk Clerks 620 695 721 718 727 739 751 763 775 787 3.6% 1.6%G721.6441 Tour and Travel Guides 200 206 224 217 217 218 219 222 226 231 1.7% 1.5%G722.6442 Outdoor Sport and Recreational Guides (e.g., canoeing guide, rafting guide 240 242 277 280 290 302 314 324 334 343 4.7% 3.2%G723.6443 Casino Occupations 180 161 195 184 182 183 184 187 190 195 0.3% 1.7%G731.6671 Operators and Attendants in Amusement, Recreation and Sport (e.g. amus 350 330 399 394 406 421 437 453 469 486 3.8% 3.7%G732.6672 Other Attendants in Accommodation and Travel (e.g. hotel guest services a 90 91 101 100 101 103 104 106 107 109 2.7% 1.5%G93.666 Cleaners 8,500 9,308 9,740 9,714 9,884 10,097 10,315 10,537 10,753 10,985 3.5% 2.1%G961.6641 Food Counter Attendants, Kitchen Helpers and Related Occupations 5,410 5,974 6,304 6,313 6,441 6,585 6,726 6,864 6,992 7,122 4.0% 2.0%
Total of Selected Occupations 55,830 60,025 60,452 60,143 60,902 61,858 62,832 63,822 64,781 65,806 2.1% 1.6%
Source: REPM, RKA
Thompson-Okanagan Tourism Labour Market Study Final Report May 29, 2009
15
Roslyn Kunin and Associates, Inc.
Focus group participant discussions offered the following in assessing tourist activity trends and employment impact of the current recession on their region:
• People travel closer to home. The Thompson Okanagan is an established tourist destination, so Canadian travellers will help to alleviate the U.S. and international decline during summer but will not be sufficient during the winter/ski season period.
• Certain segments of travel, including Visiting Friends and Relatives (VFR), repeat visitors and independent travel are likely to be more resilient to economic conditions.
• People will still travel, but their trips will be more economical. Camping is likely to see some growth.
• Visitors stay for shorter periods of time.
• Visitors spend less.
• Travelers book later, waiting for the best offers and delaying the decision to travel until they are comfortable with the cost.
• Price is a determining factor with most travelers, but even more so during a recession.
• Destinations offering value to consumers – through pricing, adding value to the experience, and favorable exchange rates – will have a distinct advantage.
• Cost containment will be crucial for tourism businesses in the coming months as companies ensure that they are able to compete on price and value.
• Partnerships with other tourism businesses that attract similar demographics and are complementary to the service offering are an important way to add value to the tourism experience.
Based on our research and inputs from focus group participants, we are presenting our projections as follows. Detailed notes on techniques used to derive these numbers are presented in Appendix IV at the back of the report.
Overall, employment in core tourism occupations in 2009 is estimated at 60,100 in the Thompson-Okanagan region, a decline of 0.4% over year 2008.
It is also expected that overall employment in core tourism industries will grow by 1.3% in 2010, and 1.6% in 2011. This is based on the assumption that the general economic environment in the province will improve by 2010. Benefits directly resulting from the 2010 Vancouver/Whistler Olympic Games are likely to include utilization of ski facilities in the region for training purposes (for example, the cross country skiing training in Silver Star), as well as potentially increasing traffic in regional ski resorts during the Games. In the long run, industry sources
Thompson-Okanagan Tourism Labour Market Study Final Report May 29, 2009
16
Roslyn Kunin and Associates, Inc.
Thompson-Okanagan Tourism Labour Market Study Final Report May 29, 2009
17
believe that increased travel to the region will not materialize until one or two years after the Games.
Between 2006 and 2011, the total increase in core tourism occupations is expected to be about 6,000. Among all these occupations, Cleaners are expected to see the largest increase in employment growth – of about 1,600 positions. However, this occupational group does require some clarification. By itself, this is the second largest occupation in size, after Retail Salespersons. Between 2006 and 2011, it is expected that there will be a total growth of approximately 1,600 new openings, and between 2011 and 2015 (see next section), a total of 900. This is a fairly broad occupational group, including persons who perform light duty, heavy duty, and also specialized cleaning work. Hotel housekeeping staff are also included in this occupational group. It is noted that about 20% in this occupational group work in the Accommodation and Food Services industry.
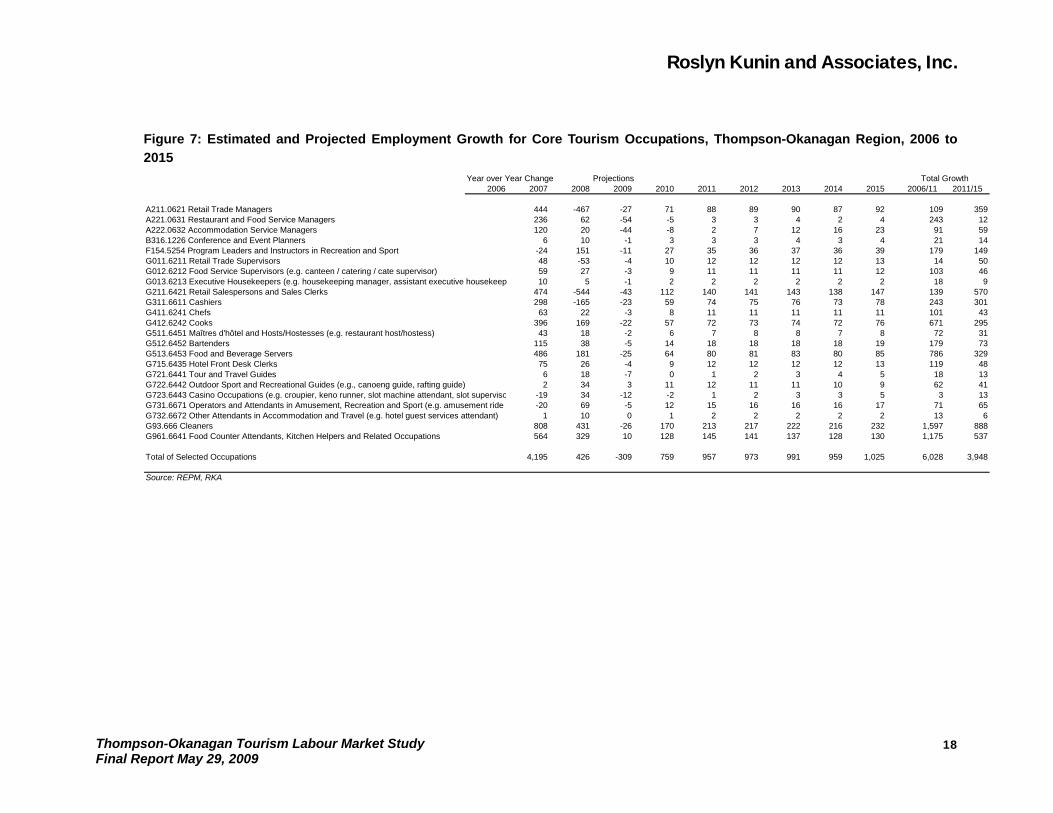
Besides Cleaners, Food Counter Attendants, Kitchen Helpers and Related Occupations is expected to see the next largest increase in employment growth, for about 1,200 positions. Food and Beverage Servers, and Cooks are also expected to see an employment growth of about 800 and 700 respectively over the same period. The many positions resulting from these occupations are due to the fact that these are fairly large occupations in size and as such are able to generate many new positions, even at modest growth rates. Figure 7 shows the estimated and projected new job openings each year due to business growth in the region. Input from tourism and hospitality operators in the region indicated that there has been growth in quick service restaurant openings and often these establishments have difficulty finding sufficient workers.
The occupations that are expected to experience the highest average annual growth rates between 2006 and 2011 include Outdoor Sport and Recreational Guides (e.g., canoeing guide, rafting guide) (4.7% per year), Food Counter Attendants, Kitchen Helpers and Related Occupations (4.0% per year), Operators and Attendants in Amusement, Recreation and Sport (e.g. amusement ride operator, amusement park attendant, campground attendant) (3.8% per year). The reason behind such stronger than average annual growth rates of these occupations is because they all experienced almost the highest employment growth between 2007 and 2008.
Roslyn Kunin and Associates, Inc.
Figure 7: Estimated and Projected Employment Growth for Core Tourism Occupations, Thompson-Okanagan Region, 2006 to 2015
Year over Year Change Projections Total Growth2006 2007 2008 2009 2010 2011 2012 2013 2014 2015 2006/11 2011/15
A211.0621 Retail Trade Managers 444 -467 -27 71 88 89 90 87 92 109 359A221.0631 Restaurant and Food Service Managers 236 62 -54 -5 3 3 4 2 4 243 12A222.0632 Accommodation Service Managers 120 20 -44 -8 2 7 12 16 23 91 59B316.1226 Conference and Event Planners 6 10 -1 3 3 3 4 3 4 21 14F154.5254 Program Leaders and Instructors in Recreation and Sport -24 151 -11 27 35 36 37 36 39 179 149G011.6211 Retail Trade Supervisors 48 -53 -4 10 12 12 12 12 13 14 50G012.6212 Food Service Supervisors (e.g. canteen / catering / cate supervisor) 59 27 -3 9 11 11 11 11 12 103 46G013.6213 Executive Housekeepers (e.g. housekeeping manager, assistant executive housekeep 10 5 -1 2 2 2 2 2 2 18 9G211.6421 Retail Salespersons and Sales Clerks 474 -544 -43 112 140 141 143 138 147 139 570G311.6611 Cashiers 298 -165 -23 59 74 75 76 73 78 243 301G411.6241 Chefs 63 22 -3 8 11 11 11 11 11 101 43G412.6242 Cooks 396 169 -22 57 72 73 74 72 76 671 295G511.6451 Maîtres d'hôtel and Hosts/Hostesses (e.g. restaurant host/hostess) 43 18 -2 6 7 8 8 7 8 72 31G512.6452 Bartenders 115 38 -5 14 18 18 18 18 19 179 73G513.6453 Food and Beverage Servers 486 181 -25 64 80 81 83 80 85 786 329G715.6435 Hotel Front Desk Clerks 75 26 -4 9 12 12 12 12 13 119 48G721.6441 Tour and Travel Guides 6 18 -7 0 1 2 3 4 5 18 13G722.6442 Outdoor Sport and Recreational Guides (e.g., canoeng guide, rafting guide) 2 34 3 11 12 11 11 10 9 62 41G723.6443 Casino Occupations (e.g. croupier, keno runner, slot machine attendant, slot superviso -19 34 -12 -2 1 2 3 3 5 3 13G731.6671 Operators and Attendants in Amusement, Recreation and Sport (e.g. amusement ride o -20 69 -5 12 15 16 16 16 17 71 65G732.6672 Other Attendants in Accommodation and Travel (e.g. hotel guest services attendant) 1 10 0 1 2 2 2 2 2 13 6G93.666 Cleaners 808 431 -26 170 213 217 222 216 232 1,597 888G961.6641 Food Counter Attendants, Kitchen Helpers and Related Occupations 564 329 10 128 145 141 137 128 130 1,175 537
Total of Selected Occupations 4,195 426 -309 759 957 973 991 959 1,025 6,028 3,948
Source: REPM, RKA
Thompson-Okanagan Tourism Labour Market Study Final Report May 29, 2009
18
Roslyn Kunin and Associates, Inc.
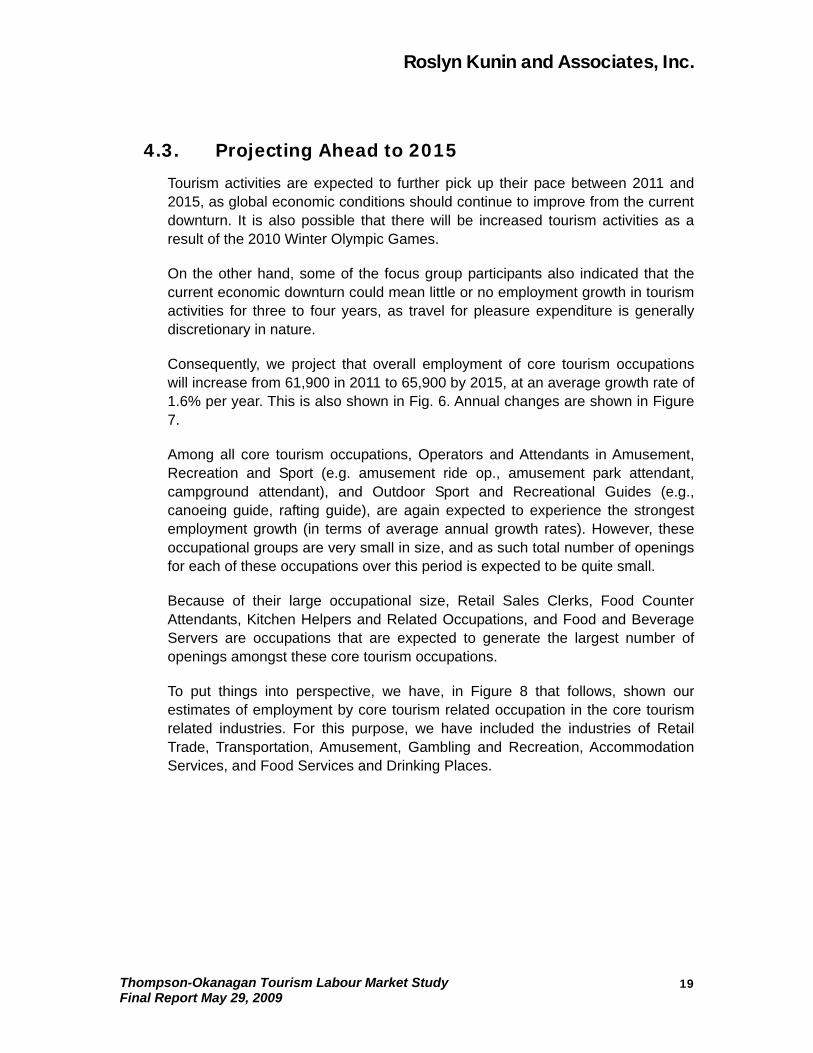
4.3. Projecting Ahead to 2015
Tourism activities are expected to further pick up their pace between 2011 and 2015, as global economic conditions should continue to improve from the current downturn. It is also possible that there will be increased tourism activities as a result of the 2010 Winter Olympic Games.
On the other hand, some of the focus group participants also indicated that the current economic downturn could mean little or no employment growth in tourism activities for three to four years, as travel for pleasure expenditure is generally discretionary in nature.
Consequently, we project that overall employment of core tourism occupations will increase from 61,900 in 2011 to 65,900 by 2015, at an average growth rate of 1.6% per year. This is also shown in Fig. 6. Annual changes are shown in Figure 7.
Among all core tourism occupations, Operators and Attendants in Amusement, Recreation and Sport (e.g. amusement ride op., amusement park attendant, campground attendant), and Outdoor Sport and Recreational Guides (e.g., canoeing guide, rafting guide), are again expected to experience the strongest employment growth (in terms of average annual growth rates). However, these occupational groups are very small in size, and as such total number of openings for each of these occupations over this period is expected to be quite small.
Because of their large occupational size, Retail Sales Clerks, Food Counter Attendants, Kitchen Helpers and Related Occupations, and Food and Beverage Servers are occupations that are expected to generate the largest number of openings amongst these core tourism occupations.
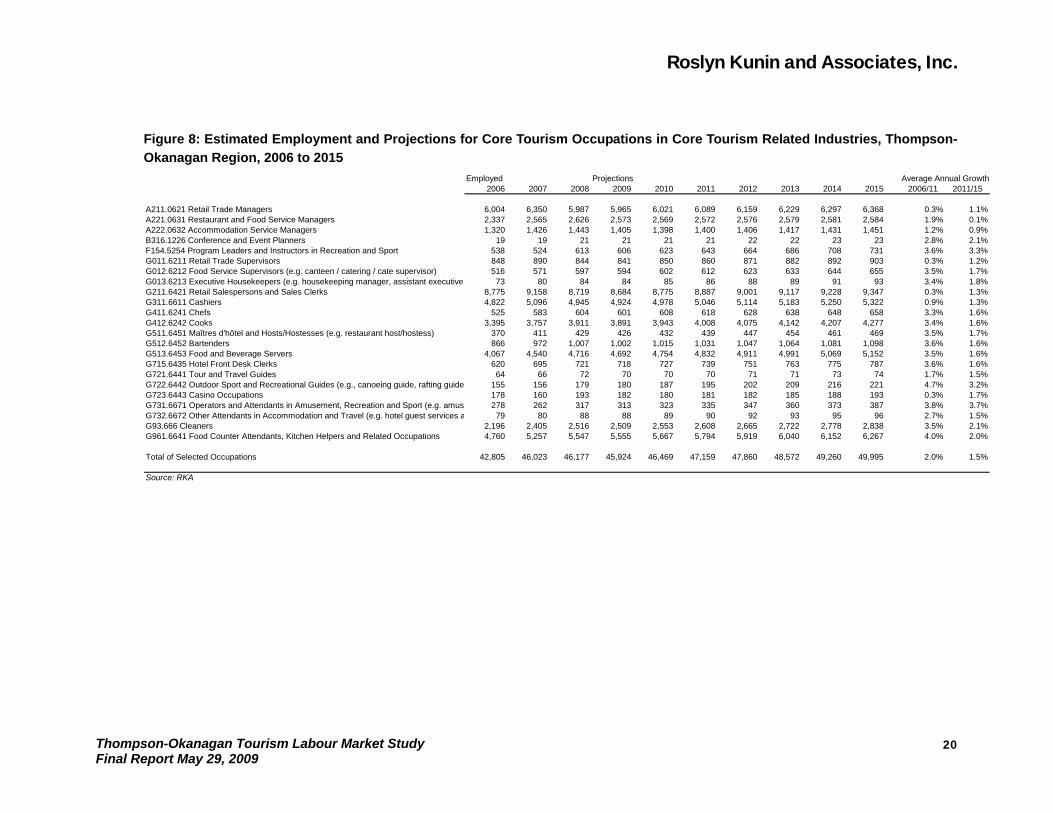
To put things into perspective, we have, in Figure 8 that follows, shown our estimates of employment by core tourism related occupation in the core tourism related industries. For this purpose, we have included the industries of Retail Trade, Transportation, Amusement, Gambling and Recreation, Accommodation Services, and Food Services and Drinking Places.
Thompson-Okanagan Tourism Labour Market Study Final Report May 29, 2009
19
Roslyn Kunin and Associates, Inc.
Figure 8: Estimated Employment and Projections for Core Tourism Occupations in Core Tourism Related Industries, Thompson-Okanagan Region, 2006 to 2015
Employed Projections Average Annual Growth2006 2007 2008 2009 2010 2011 2012 2013 2014 2015 2006/11 2011/15
A211.0621 Retail Trade Managers 6,004 6,350 5,987 5,965 6,021 6,089 6,159 6,229 6,297 6,368 0.3% 1.1%A221.0631 Restaurant and Food Service Managers 2,337 2,565 2,626 2,573 2,569 2,572 2,576 2,579 2,581 2,584 1.9% 0.1%A222.0632 Accommodation Service Managers 1,320 1,426 1,443 1,405 1,398 1,400 1,406 1,417 1,431 1,451 1.2% 0.9%B316.1226 Conference and Event Planners 19 19 21 21 21 21 22 22 23 23 2.8% 2.1%F154.5254 Program Leaders and Instructors in Recreation and Sport 538 524 613 606 623 643 664 686 708 731 3.6% 3.3%G011.6211 Retail Trade Supervisors 848 890 844 841 850 860 871 882 892 903 0.3% 1.2%G012.6212 Food Service Supervisors (e.g. canteen / catering / cate supervisor) 516 571 597 594 602 612 623 633 644 655 3.5% 1.7%G013.6213 Executive Housekeepers (e.g. housekeeping manager, assistant executive 73 80 84 84 85 86 88 89 91 93 3.4% 1.8%G211.6421 Retail Salespersons and Sales Clerks 8,775 9,158 8,719 8,684 8,775 8,887 9,001 9,117 9,228 9,347 0.3% 1.3%G311.6611 Cashiers 4,822 5,096 4,945 4,924 4,978 5,046 5,114 5,183 5,250 5,322 0.9% 1.3%G411.6241 Chefs 525 583 604 601 608 618 628 638 648 658 3.3% 1.6%G412.6242 Cooks 3,395 3,757 3,911 3,891 3,943 4,008 4,075 4,142 4,207 4,277 3.4% 1.6%G511.6451 Maîtres d'hôtel and Hosts/Hostesses (e.g. restaurant host/hostess) 370 411 429 426 432 439 447 454 461 469 3.5% 1.7%G512.6452 Bartenders 866 972 1,007 1,002 1,015 1,031 1,047 1,064 1,081 1,098 3.6% 1.6%G513.6453 Food and Beverage Servers 4,067 4,540 4,716 4,692 4,754 4,832 4,911 4,991 5,069 5,152 3.5% 1.6%G715.6435 Hotel Front Desk Clerks 620 695 721 718 727 739 751 763 775 787 3.6% 1.6%G721.6441 Tour and Travel Guides 64 66 72 70 70 70 71 71 73 74 1.7% 1.5%G722.6442 Outdoor Sport and Recreational Guides (e.g., canoeing guide, rafting guide 155 156 179 180 187 195 202 209 216 221 4.7% 3.2%G723.6443 Casino Occupations 178 160 193 182 180 181 182 185 188 193 0.3% 1.7%G731.6671 Operators and Attendants in Amusement, Recreation and Sport (e.g. amus 278 262 317 313 323 335 347 360 373 387 3.8% 3.7%G732.6672 Other Attendants in Accommodation and Travel (e.g. hotel guest services a 79 80 88 88 89 90 92 93 95 96 2.7% 1.5%G93.666 Cleaners 2,196 2,405 2,516 2,509 2,553 2,608 2,665 2,722 2,778 2,838 3.5% 2.1%G961.6641 Food Counter Attendants, Kitchen Helpers and Related Occupations 4,760 5,257 5,547 5,555 5,667 5,794 5,919 6,040 6,152 6,267 4.0% 2.0%
Total of Selected Occupations 42,805 46,023 46,177 45,924 46,469 47,159 47,860 48,572 49,260 49,995 2.0% 1.5%
Source: RKA
Thompson-Okanagan Tourism Labour Market Study Final Report May 29, 2009
20
Roslyn Kunin and Associates, Inc.
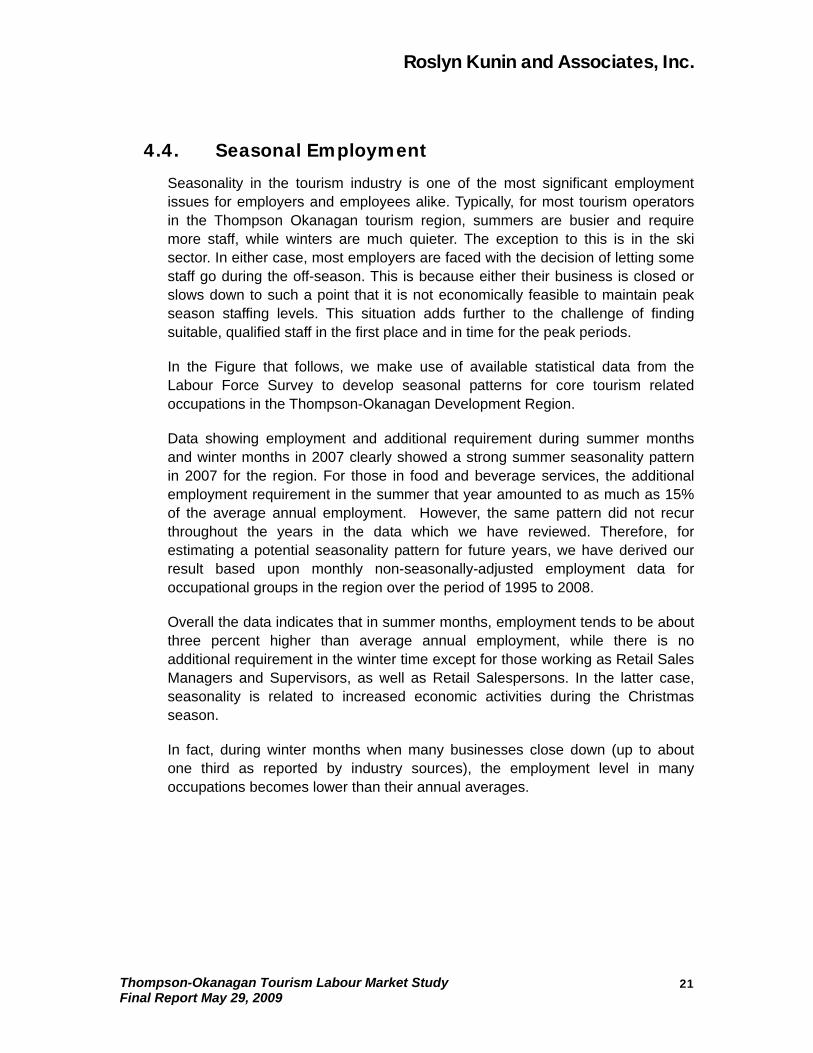
4.4. Seasonal Employment
Seasonality in the tourism industry is one of the most significant employment issues for employers and employees alike. Typically, for most tourism operators in the Thompson Okanagan tourism region, summers are busier and require more staff, while winters are much quieter. The exception to this is in the ski sector. In either case, most employers are faced with the decision of letting some staff go during the off-season. This is because either their business is closed or slows down to such a point that it is not economically feasible to maintain peak season staffing levels. This situation adds further to the challenge of finding suitable, qualified staff in the first place and in time for the peak periods.
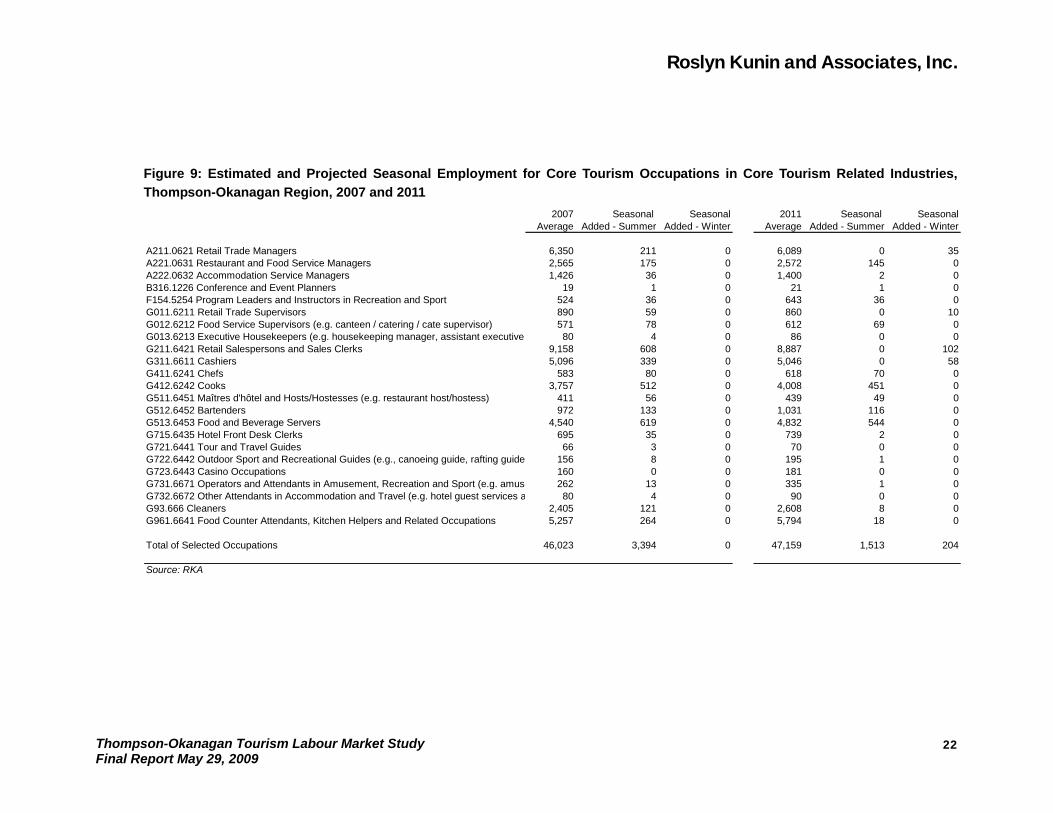
In the Figure that follows, we make use of available statistical data from the Labour Force Survey to develop seasonal patterns for core tourism related occupations in the Thompson-Okanagan Development Region.
Data showing employment and additional requirement during summer months and winter months in 2007 clearly showed a strong summer seasonality pattern in 2007 for the region. For those in food and beverage services, the additional employment requirement in the summer that year amounted to as much as 15% of the average annual employment. However, the same pattern did not recur throughout the years in the data which we have reviewed. Therefore, for estimating a potential seasonality pattern for future years, we have derived our result based upon monthly non-seasonally-adjusted employment data for occupational groups in the region over the period of 1995 to 2008.
Overall the data indicates that in summer months, employment tends to be about three percent higher than average annual employment, while there is no additional requirement in the winter time except for those working as Retail Sales Managers and Supervisors, as well as Retail Salespersons. In the latter case, seasonality is related to increased economic activities during the Christmas season.
In fact, during winter months when many businesses close down (up to about one third as reported by industry sources), the employment level in many occupations becomes lower than their annual averages.
Thompson-Okanagan Tourism Labour Market Study Final Report May 29, 2009
21
Roslyn Kunin and Associates, Inc.
Figure 9: Estimated and Projected Seasonal Employment for Core Tourism Occupations in Core Tourism Related Industries, Thompson-Okanagan Region, 2007 and 2011
2007 Seasonal Seasonal 2011 Seasonal SeasonalAverage Added - Summer Added - Winter Average Added - Summer Added - Winter
A211.0621 Retail Trade Managers 6,350 211 0 6,089 0 35A221.0631 Restaurant and Food Service Managers 2,565 175 0 2,572 145 0A222.0632 Accommodation Service Managers 1,426 36 0 1,400 2 0B316.1226 Conference and Event Planners 19 1 0 21 1 0F154.5254 Program Leaders and Instructors in Recreation and Sport 524 36 0 643 36 0G011.6211 Retail Trade Supervisors 890 59 0 860 0 10G012.6212 Food Service Supervisors (e.g. canteen / catering / cate supervisor) 571 78 0 612 69 0G013.6213 Executive Housekeepers (e.g. housekeeping manager, assistant executive 80 4 0 86 0 0G211.6421 Retail Salespersons and Sales Clerks 9,158 608 0 8,887 0 102G311.6611 Cashiers 5,096 339 0 5,046 0 58G411.6241 Chefs 583 80 0 618 70 0G412.6242 Cooks 3,757 512 0 4,008 451 0G511.6451 Maîtres d'hôtel and Hosts/Hostesses (e.g. restaurant host/hostess) 411 56 0 439 49 0G512.6452 Bartenders 972 133 0 1,031 116 0G513.6453 Food and Beverage Servers 4,540 619 0 4,832 544 0G715.6435 Hotel Front Desk Clerks 695 35 0 739 2 0G721.6441 Tour and Travel Guides 66 3 0 70 0 0G722.6442 Outdoor Sport and Recreational Guides (e.g., canoeing guide, rafting guide 156 8 0 195 1 0G723.6443 Casino Occupations 160 0 0 181 0 0G731.6671 Operators and Attendants in Amusement, Recreation and Sport (e.g. amus 262 13 0 335 1 0G732.6672 Other Attendants in Accommodation and Travel (e.g. hotel guest services a 80 4 0 90 0 0G93.666 Cleaners 2,405 121 0 2,608 8 0G961.6641 Food Counter Attendants, Kitchen Helpers and Related Occupations 5,257 264 0 5,794 18 0
Total of Selected Occupations 46,023 3,394 0 47,159 1,513 204
Source: RKA
Thompson-Okanagan Tourism Labour Market Study Final Report May 29, 2009
22
Roslyn Kunin and Associates, Inc.
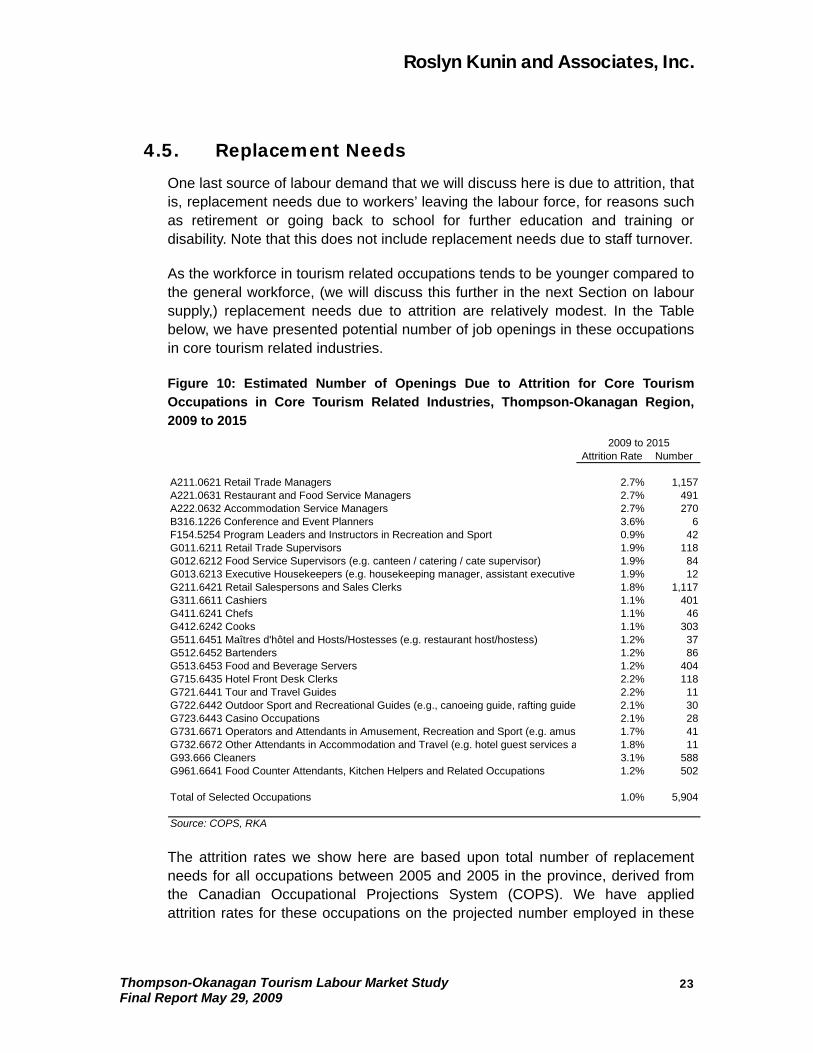
4.5. Replacement Needs
One last source of labour demand that we will discuss here is due to attrition, that is, replacement needs due to workers’ leaving the labour force, for reasons such as retirement or going back to school for further education and training or disability. Note that this does not include replacement needs due to staff turnover.
As the workforce in tourism related occupations tends to be younger compared to the general workforce, (we will discuss this further in the next Section on labour supply,) replacement needs due to attrition are relatively modest. In the Table below, we have presented potential number of job openings in these occupations in core tourism related industries.
Figure 10: Estimated Number of Openings Due to Attrition for Core Tourism Occupations in Core Tourism Related Industries, Thompson-Okanagan Region, 2009 to 2015
2009 to 2015Attrition Rate Number
A211.0621 Retail Trade Managers 2.7% 1,157A221.0631 Restaurant and Food Service Managers 2.7% 491A222.0632 Accommodation Service Managers 2.7% 270B316.1226 Conference and Event Planners 3.6% 6F154.5254 Program Leaders and Instructors in Recreation and Sport 0.9% 42G011.6211 Retail Trade Supervisors 1.9% 118G012.6212 Food Service Supervisors (e.g. canteen / catering / cate supervisor) 1.9% 84G013.6213 Executive Housekeepers (e.g. housekeeping manager, assistant executive 1.9% 12G211.6421 Retail Salespersons and Sales Clerks 1.8% 1,117G311.6611 Cashiers 1.1% 401G411.6241 Chefs 1.1% 46G412.6242 Cooks 1.1% 303G511.6451 Maîtres d'hôtel and Hosts/Hostesses (e.g. restaurant host/hostess) 1.2% 37G512.6452 Bartenders 1.2% 86G513.6453 Food and Beverage Servers 1.2% 404G715.6435 Hotel Front Desk Clerks 2.2% 118G721.6441 Tour and Travel Guides 2.2% 11G722.6442 Outdoor Sport and Recreational Guides (e.g., canoeing guide, rafting guide 2.1% 30G723.6443 Casino Occupations 2.1% 28G731.6671 Operators and Attendants in Amusement, Recreation and Sport (e.g. amus 1.7% 41G732.6672 Other Attendants in Accommodation and Travel (e.g. hotel guest services a 1.8% 11G93.666 Cleaners 3.1% 588G961.6641 Food Counter Attendants, Kitchen Helpers and Related Occupations 1.2% 502
Total of Selected Occupations 1.0% 5,904
Source: COPS, RKA
The attrition rates we show here are based upon total number of replacement needs for all occupations between 2005 and 2005 in the province, derived from the Canadian Occupational Projections System (COPS). We have applied attrition rates for these occupations on the projected number employed in these
Thompson-Okanagan Tourism Labour Market Study Final Report May 29, 2009
23
Roslyn Kunin and Associates, Inc.
Thompson-Okanagan Tourism Labour Market Study Final Report May 29, 2009
2
occupations in core tourism related industries each year to arrive at the total number of job openings due to attrition.
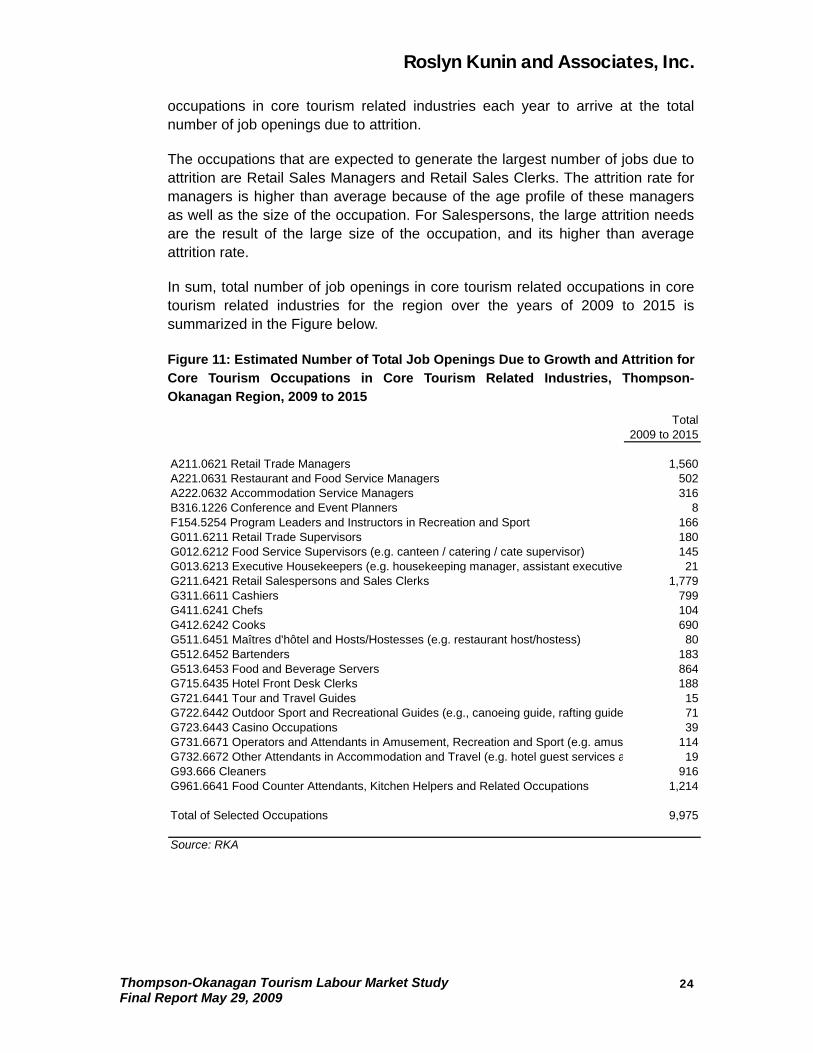
The occupations that are expected to generate the largest number of jobs due to attrition are Retail Sales Managers and Retail Sales Clerks. The attrition rate for managers is higher than average because of the age profile of these managers as well as the size of the occupation. For Salespersons, the large attrition needs are the result of the large size of the occupation, and its higher than average attrition rate.
In sum, total number of job openings in core tourism related occupations in core tourism related industries for the region over the years of 2009 to 2015 is summarized in the Figure below.
Figure 11: Estimated Number of Total Job Openings Due to Growth and Attrition for Core Tourism Occupations in Core Tourism Related Industries, Thompson-Okanagan Region, 2009 to 2015
Total2009 to 2015
A211.0621 Retail Trade Managers 1,560A221.0631 Restaurant and Food Service Managers 502A222.0632 Accommodation Service Managers 316B316.1226 Conference and Event Planners 8F154.5254 Program Leaders and Instructors in Recreation and Sport 166G011.6211 Retail Trade Supervisors 180G012.6212 Food Service Supervisors (e.g. canteen / catering / cate supervisor) 145G013.6213 Executive Housekeepers (e.g. housekeeping manager, assistant executive 21G211.6421 Retail Salespersons and Sales Clerks 1,779G311.6611 Cashiers 799G411.6241 Chefs 104G412.6242 Cooks 690G511.6451 Maîtres d'hôtel and Hosts/Hostesses (e.g. restaurant host/hostess) 80G512.6452 Bartenders 183G513.6453 Food and Beverage Servers 864G715.6435 Hotel Front Desk Clerks 188G721.6441 Tour and Travel Guides 15G722.6442 Outdoor Sport and Recreational Guides (e.g., canoeing guide, rafting guide 71G723.6443 Casino Occupations 39G731.6671 Operators and Attendants in Amusement, Recreation and Sport (e.g. amus 114G732.6672 Other Attendants in Accommodation and Travel (e.g. hotel guest services a 19G93.666 Cleaners 916G961.6641 Food Counter Attendants, Kitchen Helpers and Related Occupations 1,214
Total of Selected Occupations 9,975
Source: RKA
4
Roslyn Kunin and Associates, Inc.
5. Labour Supply Issues
As with other industries and with tourism activities elsewhere in BC and Canada, the question is how to obtain the labour supply that is needed to allow for industry growth.
We have shown, in Section 4, that over the period of 2009 to 2015 a total of 10,000 job openings are projected to be available in the Thompson-Okanagan region for the core tourism related occupations in core tourism related industries. This translates to about 1,400 positions per year on average.
In this section, we first present information regarding general demographic trends in the Thompson-Okanagan region, and also population migration patterns in the region. We then provide our estimates and projections of the potential labour force growth in the region. Then we will discuss sources of labour supply in the tourism industries, as well as factors impacting labour supply in the industries.
5.1. Demographic Aspects
The demographics of those working in the tourism sector are somewhat different from the overall workforce. Youth, those of ages between 15 and 24, accounts for 15% in the overall workforce in BC, those in the core working age population (age 25 to 44) account for over two-thirds, while older workers (those aged 55 and over) represent about 17% of the overall workforce.
For the Thompson-Okanagan region, it is a similar age profile for the general workforce. Youth accounts for 16%, those in the core working age population account for two-thirds (65%), and older workers account for 19% of the overall workforce.
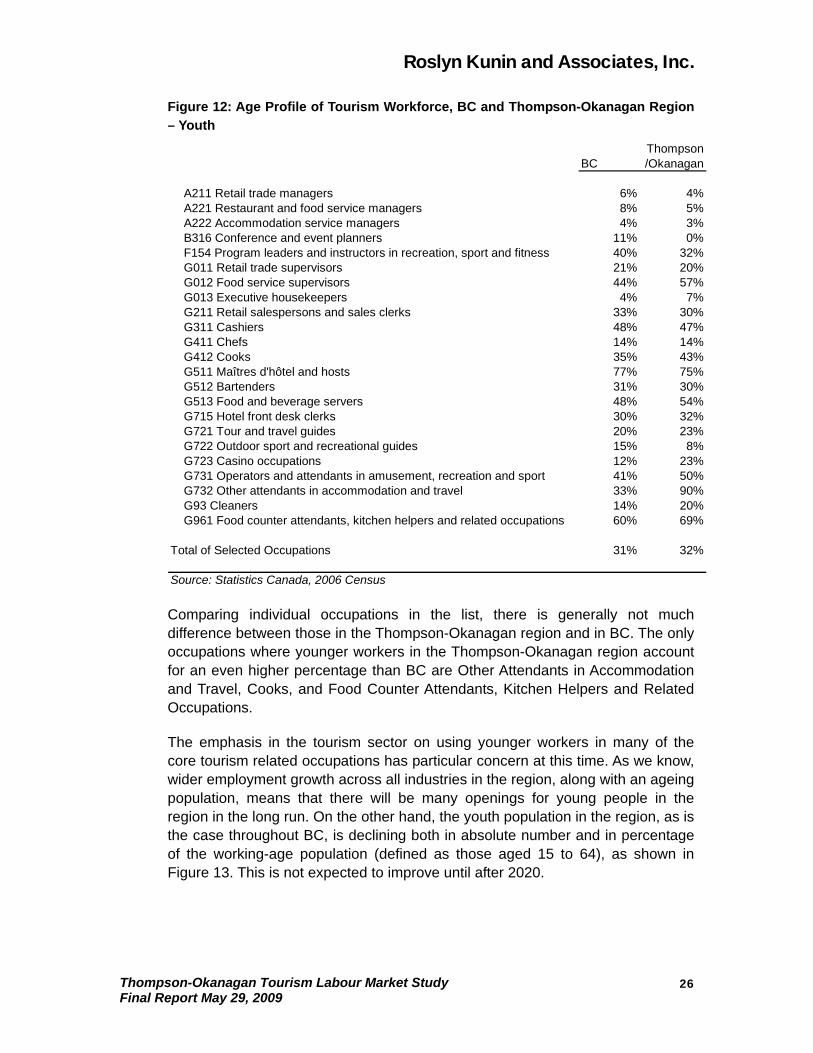
For those in the core tourism related occupations we are studying, youth represent almost a third, while this group of workers in the Thompson-Okanagan region account for a slightly larger proportion than the BC average (32% vs. 31%). This is shown in Figure 12.
Thompson-Okanagan Tourism Labour Market Study Final Report May 29, 2009
25
Roslyn Kunin and Associates, Inc.
Figure 12: Age Profile of Tourism Workforce, BC and Thompson-Okanagan Region – Youth
ThompsonBC /Okanagan
A211 Retail trade managers 6% 4% A221 Restaurant and food service managers 8% 5% A222 Accommodation service managers 4% 3% B316 Conference and event planners 11% 0% F154 Program leaders and instructors in recreation, sport and fitness 40% 32% G011 Retail trade supervisors 21% 20% G012 Food service supervisors 44% 57% G013 Executive housekeepers 4% 7% G211 Retail salespersons and sales clerks 33% 30% G311 Cashiers 48% 47% G411 Chefs 14% 14% G412 Cooks 35% 43% G511 Maîtres d'hôtel and hosts 77% 75% G512 Bartenders 31% 30% G513 Food and beverage servers 48% 54% G715 Hotel front desk clerks 30% 32% G721 Tour and travel guides 20% 23% G722 Outdoor sport and recreational guides 15% 8% G723 Casino occupations 12% 23% G731 Operators and attendants in amusement, recreation and sport 41% 50% G732 Other attendants in accommodation and travel 33% 90% G93 Cleaners 14% 20% G961 Food counter attendants, kitchen helpers and related occupations 60% 69%
Total of Selected Occupations 31% 32%
Source: Statistics Canada, 2006 Census
Comparing individual occupations in the list, there is generally not much difference between those in the Thompson-Okanagan region and in BC. The only occupations where younger workers in the Thompson-Okanagan region account for an even higher percentage than BC are Other Attendants in Accommodation and Travel, Cooks, and Food Counter Attendants, Kitchen Helpers and Related Occupations.
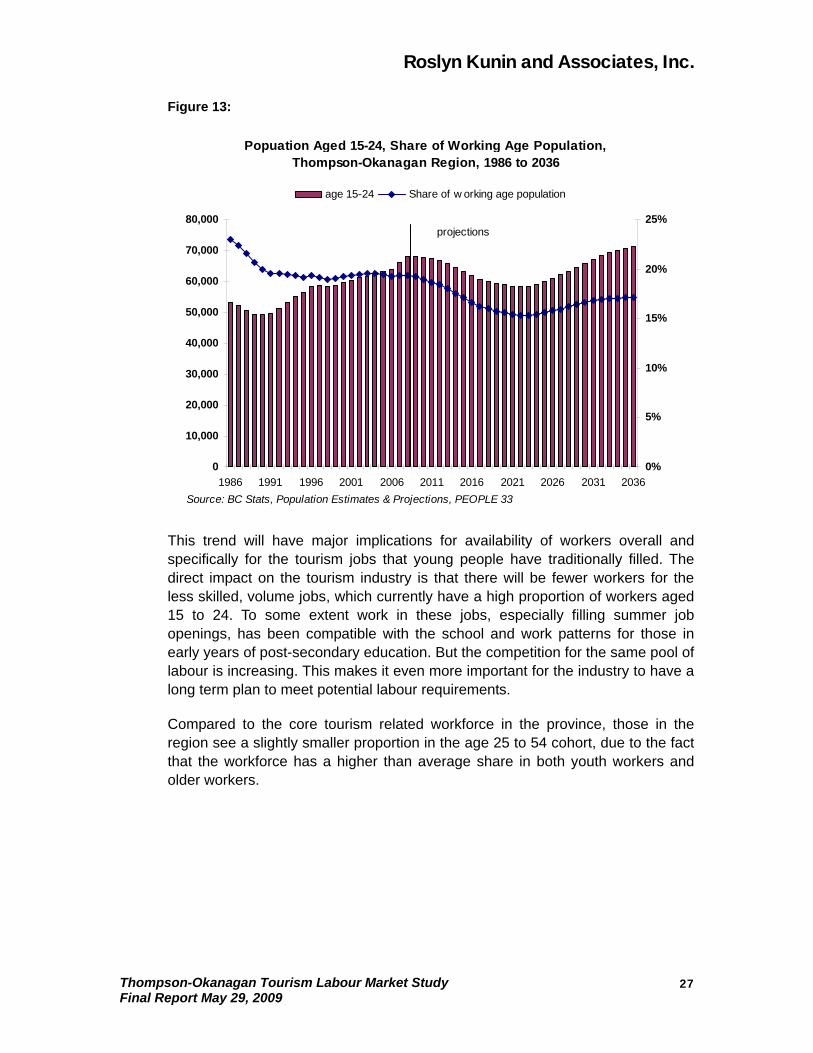
The emphasis in the tourism sector on using younger workers in many of the core tourism related occupations has particular concern at this time. As we know, wider employment growth across all industries in the region, along with an ageing population, means that there will be many openings for young people in the region in the long run. On the other hand, the youth population in the region, as is the case throughout BC, is declining both in absolute number and in percentage of the working-age population (defined as those aged 15 to 64), as shown in Figure 13. This is not expected to improve until after 2020.
Thompson-Okanagan Tourism Labour Market Study Final Report May 29, 2009
26
Roslyn Kunin and Associates, Inc.
Figure 13:
Popuation Aged 15-24, Share of Working Age Population, Thompson-Okanagan Region, 1986 to 2036
0
10,000
20,000
30,000
40,000
50,000
60,000
70,000
80,000
1986 1991 1996 2001 2006 2011 2016 2021 2026 2031 20360%
5%
10%
15%
20%
25%
age 15-24 Share of w orking age population
Source: BC Stats, Population Estimates & Projections, PEOPLE 33
projections
This trend will have major implications for availability of workers overall and specifically for the tourism jobs that young people have traditionally filled. The direct impact on the tourism industry is that there will be fewer workers for the less skilled, volume jobs, which currently have a high proportion of workers aged 15 to 24. To some extent work in these jobs, especially filling summer job openings, has been compatible with the school and work patterns for those in early years of post-secondary education. But the competition for the same pool of labour is increasing. This makes it even more important for the industry to have a long term plan to meet potential labour requirements.
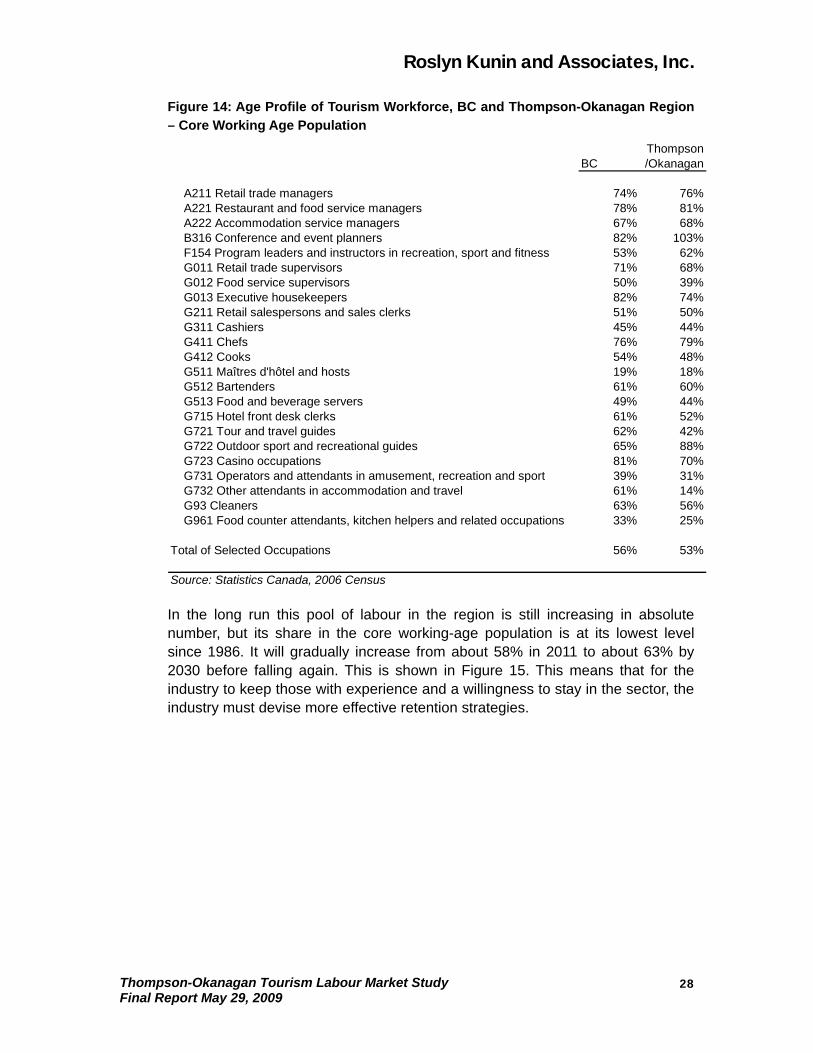
Compared to the core tourism related workforce in the province, those in the region see a slightly smaller proportion in the age 25 to 54 cohort, due to the fact that the workforce has a higher than average share in both youth workers and older workers.
Thompson-Okanagan Tourism Labour Market Study Final Report May 29, 2009
27
Roslyn Kunin and Associates, Inc.
Figure 14: Age Profile of Tourism Workforce, BC and Thompson-Okanagan Region – Core Working Age Population
ThompsonBC /Okanagan
A211 Retail trade managers 74% 76% A221 Restaurant and food service managers 78% 81% A222 Accommodation service managers 67% 68% B316 Conference and event planners 82% 103% F154 Program leaders and instructors in recreation, sport and fitness 53% 62% G011 Retail trade supervisors 71% 68% G012 Food service supervisors 50% 39% G013 Executive housekeepers 82% 74% G211 Retail salespersons and sales clerks 51% 50% G311 Cashiers 45% 44% G411 Chefs 76% 79% G412 Cooks 54% 48% G511 Maîtres d'hôtel and hosts 19% 18% G512 Bartenders 61% 60% G513 Food and beverage servers 49% 44% G715 Hotel front desk clerks 61% 52% G721 Tour and travel guides 62% 42% G722 Outdoor sport and recreational guides 65% 88% G723 Casino occupations 81% 70% G731 Operators and attendants in amusement, recreation and sport 39% 31% G732 Other attendants in accommodation and travel 61% 14% G93 Cleaners 63% 56% G961 Food counter attendants, kitchen helpers and related occupations 33% 25%
Total of Selected Occupations 56% 53%
Source: Statistics Canada, 2006 Census
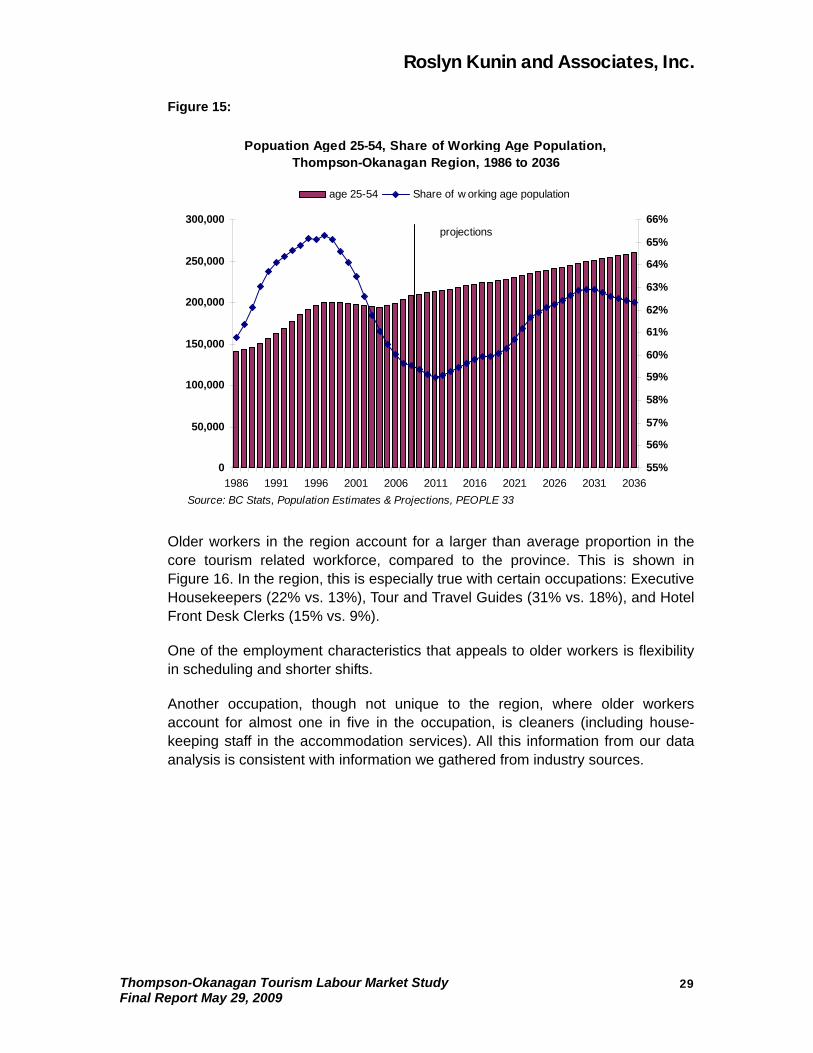
In the long run this pool of labour in the region is still increasing in absolute number, but its share in the core working-age population is at its lowest level since 1986. It will gradually increase from about 58% in 2011 to about 63% by 2030 before falling again. This is shown in Figure 15. This means that for the industry to keep those with experience and a willingness to stay in the sector, the industry must devise more effective retention strategies.
Thompson-Okanagan Tourism Labour Market Study Final Report May 29, 2009
28
Roslyn Kunin and Associates, Inc.
Figure 15:
Popuation Aged 25-54, Share of Working Age Population, Thompson-Okanagan Region, 1986 to 2036
0
50,000
100,000
150,000
200,000
250,000
300,000
1986 1991 1996 2001 2006 2011 2016 2021 2026 2031 203655%
56%
57%
58%
59%
60%
61%
62%
63%
64%
65%
66%
age 25-54 Share of w orking age population
Source: BC Stats, Population Estimates & Projections, PEOPLE 33
projections
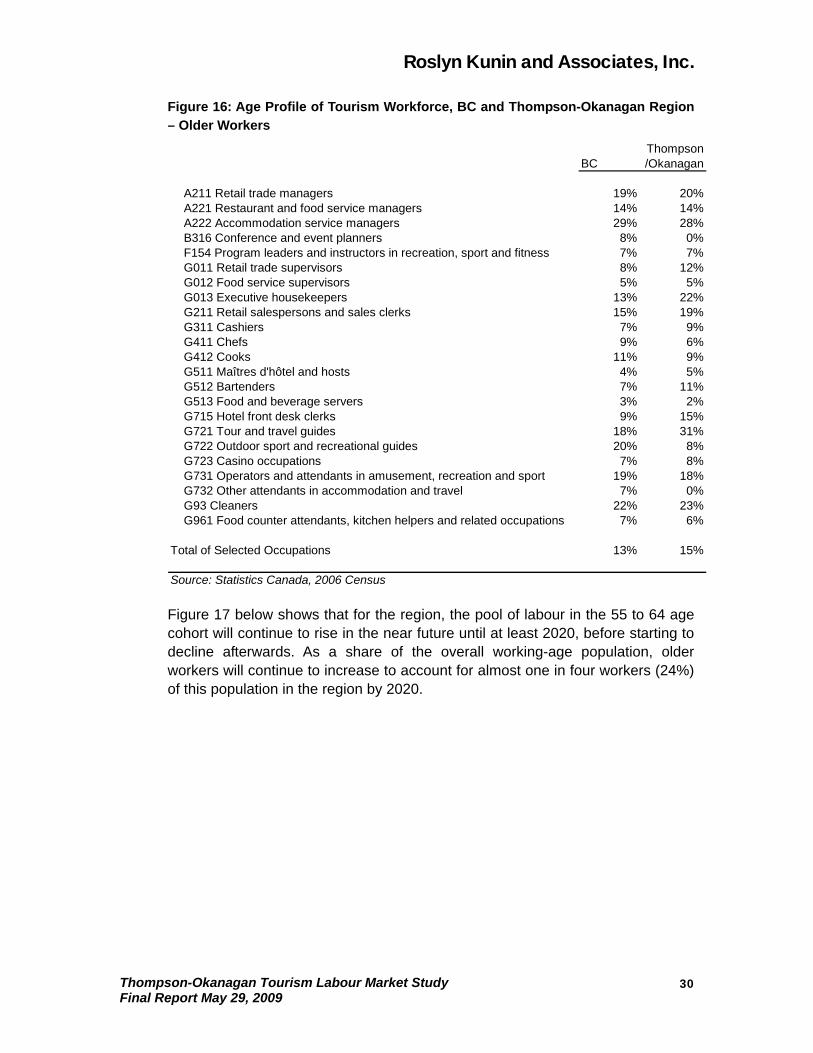
Older workers in the region account for a larger than average proportion in the core tourism related workforce, compared to the province. This is shown in Figure 16. In the region, this is especially true with certain occupations: Executive Housekeepers (22% vs. 13%), Tour and Travel Guides (31% vs. 18%), and Hotel Front Desk Clerks (15% vs. 9%).
One of the employment characteristics that appeals to older workers is flexibility in scheduling and shorter shifts.
Another occupation, though not unique to the region, where older workers account for almost one in five in the occupation, is cleaners (including house-keeping staff in the accommodation services). All this information from our data analysis is consistent with information we gathered from industry sources.
Thompson-Okanagan Tourism Labour Market Study Final Report May 29, 2009
29
Roslyn Kunin and Associates, Inc.
Figure 16: Age Profile of Tourism Workforce, BC and Thompson-Okanagan Region – Older Workers
ThompsonBC /Okanagan
A211 Retail trade managers 19% 20% A221 Restaurant and food service managers 14% 14% A222 Accommodation service managers 29% 28% B316 Conference and event planners 8% 0% F154 Program leaders and instructors in recreation, sport and fitness 7% 7% G011 Retail trade supervisors 8% 12% G012 Food service supervisors 5% 5% G013 Executive housekeepers 13% 22% G211 Retail salespersons and sales clerks 15% 19% G311 Cashiers 7% 9% G411 Chefs 9% 6% G412 Cooks 11% 9% G511 Maîtres d'hôtel and hosts 4% 5% G512 Bartenders 7% 11% G513 Food and beverage servers 3% 2% G715 Hotel front desk clerks 9% 15% G721 Tour and travel guides 18% 31% G722 Outdoor sport and recreational guides 20% 8% G723 Casino occupations 7% 8% G731 Operators and attendants in amusement, recreation and sport 19% 18% G732 Other attendants in accommodation and travel 7% 0% G93 Cleaners 22% 23% G961 Food counter attendants, kitchen helpers and related occupations 7% 6%
Total of Selected Occupations 13% 15%
Source: Statistics Canada, 2006 Census
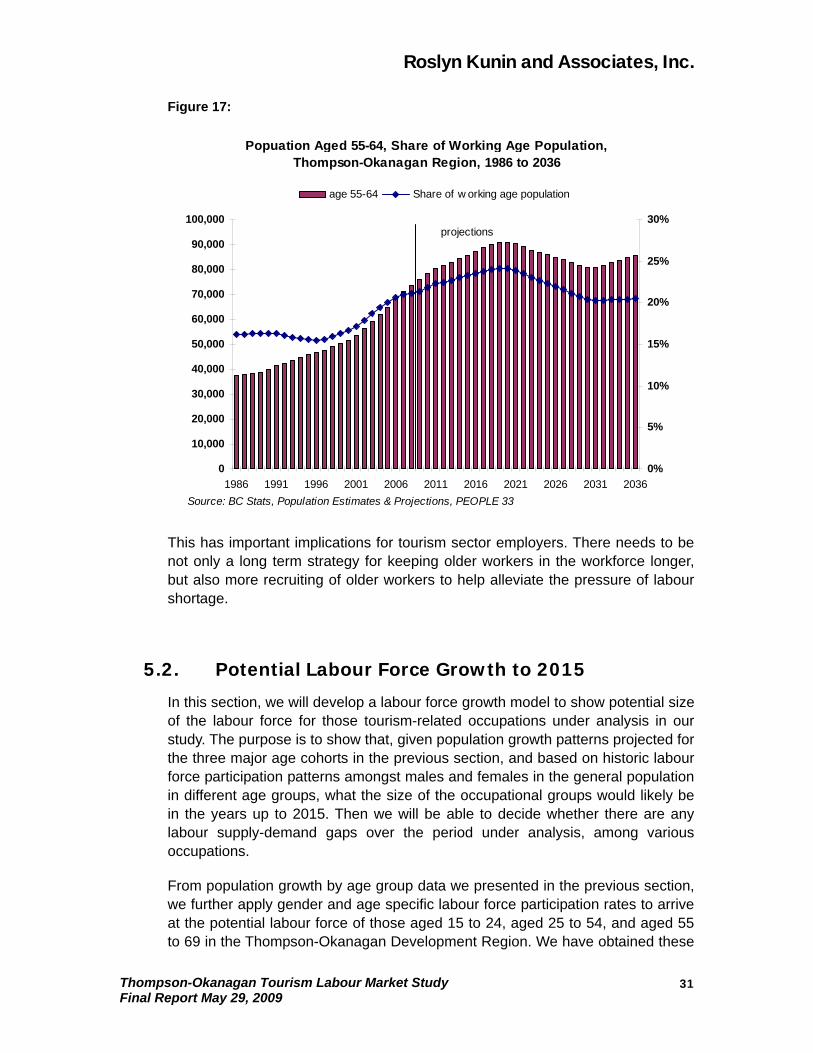
Figure 17 below shows that for the region, the pool of labour in the 55 to 64 age cohort will continue to rise in the near future until at least 2020, before starting to decline afterwards. As a share of the overall working-age population, older workers will continue to increase to account for almost one in four workers (24%) of this population in the region by 2020.
Thompson-Okanagan Tourism Labour Market Study Final Report May 29, 2009
30
Roslyn Kunin and Associates, Inc.
Figure 17:
Popuation Aged 55-64, Share of Working Age Population, Thompson-Okanagan Region, 1986 to 2036
0
10,000
20,000
30,000
40,000
50,000
60,000
70,000
80,000
90,000
100,000
1986 1991 1996 2001 2006 2011 2016 2021 2026 2031 20360%
5%
10%
15%
20%
25%
30%
age 55-64 Share of w orking age population
Source: BC Stats, Population Estimates & Projections, PEOPLE 33
projections
This has important implications for tourism sector employers. There needs to be not only a long term strategy for keeping older workers in the workforce longer, but also more recruiting of older workers to help alleviate the pressure of labour shortage.
5.2. Potential Labour Force Growth to 2015
In this section, we will develop a labour force growth model to show potential size of the labour force for those tourism-related occupations under analysis in our study. The purpose is to show that, given population growth patterns projected for the three major age cohorts in the previous section, and based on historic labour force participation patterns amongst males and females in the general population in different age groups, what the size of the occupational groups would likely be in the years up to 2015. Then we will be able to decide whether there are any labour supply-demand gaps over the period under analysis, among various occupations.
From population growth by age group data we presented in the previous section, we further apply gender and age specific labour force participation rates to arrive at the potential labour force of those aged 15 to 24, aged 25 to 54, and aged 55 to 69 in the Thompson-Okanagan Development Region. We have obtained these
Thompson-Okanagan Tourism Labour Market Study Final Report May 29, 2009
31
Roslyn Kunin and Associates, Inc.
Thompson-Okanagan Tourism Labour Market Study Final Report May 29, 2009
32
gender and age specific labour force participation rates from a 2007 BC Stats study entitled British Columbia Labour Force Participation Rate Projections to 2031. Specifically, we made use of labour force participation rates in 2006, and projected rates in 2011 and 2016.1 Rates for the years in between have been derived by simple interpolation.
Afterwards, we have used 2006 Census data to derive occupational distribution of the labour force in the region, and applied the same occupational shares to the estimated and projected labour force in the region to arrive at labour force growth of occupations we are studying to 2015. We have also made minor adjustments to ensure the consistency between the Census data and labor force averages for the year. Figure 18 below presents our estimates and projections of the labour force by occupation in the region in 2007 and 2008, and from 2009 onwards.
1 We have also added the labour force growth for those aged 70-74. For this age group we have assumed that their labour force participation rates are half of those for those aged 65-69 years.
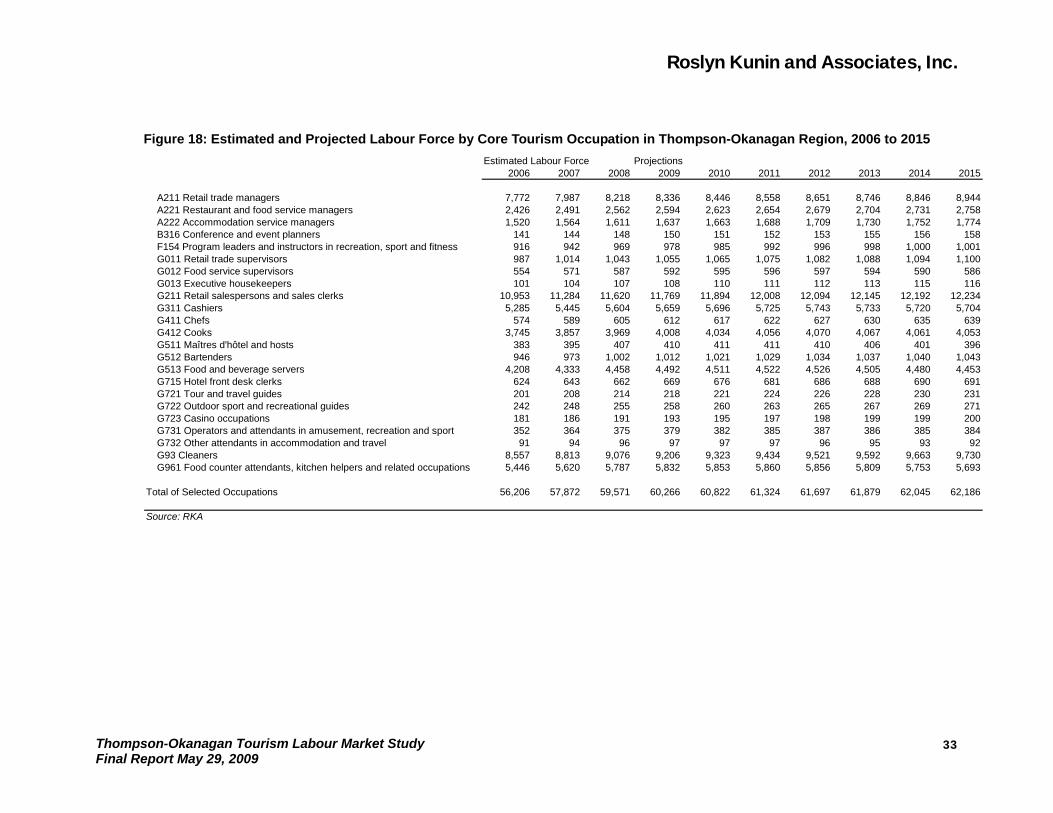
Roslyn Kunin and Associates, Inc.
Figure 18: Estimated and Projected Labour Force by Core Tourism Occupation in Thompson-Okanagan Region, 2006 to 2015 Estimated Labour Force Projections
2006 2007 2008 2009 2010 2011 2012 2013 2014 2015
A211 Retail trade managers 7,772 7,987 8,218 8,336 8,446 8,558 8,651 8,746 8,846 8,944 A221 Restaurant and food service managers 2,426 2,491 2,562 2,594 2,623 2,654 2,679 2,704 2,731 2,758 A222 Accommodation service managers 1,520 1,564 1,611 1,637 1,663 1,688 1,709 1,730 1,752 1,774 B316 Conference and event planners 141 144 148 150 151 152 153 155 156 158 F154 Program leaders and instructors in recreation, sport and fitness 916 942 969 978 985 992 996 998 1,000 1,001 G011 Retail trade supervisors 987 1,014 1,043 1,055 1,065 1,075 1,082 1,088 1,094 1,100 G012 Food service supervisors 554 571 587 592 595 596 597 594 590 586 G013 Executive housekeepers 101 104 107 108 110 111 112 113 115 116 G211 Retail salespersons and sales clerks 10,953 11,284 11,620 11,769 11,894 12,008 12,094 12,145 12,192 12,234 G311 Cashiers 5,285 5,445 5,604 5,659 5,696 5,725 5,743 5,733 5,720 5,704 G411 Chefs 574 589 605 612 617 622 627 630 635 639 G412 Cooks 3,745 3,857 3,969 4,008 4,034 4,056 4,070 4,067 4,061 4,053 G511 Maîtres d'hôtel and hosts 383 395 407 410 411 411 410 406 401 396 G512 Bartenders 946 973 1,002 1,012 1,021 1,029 1,034 1,037 1,040 1,043 G513 Food and beverage servers 4,208 4,333 4,458 4,492 4,511 4,522 4,526 4,505 4,480 4,453 G715 Hotel front desk clerks 624 643 662 669 676 681 686 688 690 691 G721 Tour and travel guides 201 208 214 218 221 224 226 228 230 231 G722 Outdoor sport and recreational guides 242 248 255 258 260 263 265 267 269 271 G723 Casino occupations 181 186 191 193 195 197 198 199 199 200 G731 Operators and attendants in amusement, recreation and sport 352 364 375 379 382 385 387 386 385 384 G732 Other attendants in accommodation and travel 91 94 96 97 97 97 96 95 93 92 G93 Cleaners 8,557 8,813 9,076 9,206 9,323 9,434 9,521 9,592 9,663 9,730 G961 Food counter attendants, kitchen helpers and related occupations 5,446 5,620 5,787 5,832 5,853 5,860 5,856 5,809 5,753 5,693
Total of Selected Occupations 56,206 57,872 59,571 60,266 60,822 61,324 61,697 61,879 62,045 62,186
Source: RKA
Thompson-Okanagan Tourism Labour Market Study Final Report May 29, 2009
33
Roslyn Kunin and Associates, Inc.
There are limitations to this model, the biggest of which is our assumption that occupational shares within the labour force remain constant at 2006 levels. It is realistic to think that as economic activities grow in the region, individuals will make changes to their occupational (career) choices over the years. In any case, Figure 18 presents the likely size of the total labour supply in these occupations in the region.
In the following sections 5.3 through 5.7, we further discuss various factors and issues that could potentially change the flow and therefore the pool of labour supply.
5.3. Mobility and Labour Supply
Recruitment of tourism and hospitality staff has added costs when employers are forced to seek employees outside their immediate geographic area.
Another important labour supply issue has to do with where workers come from. In addition to relying upon youth workers for many of the lesser skilled volume jobs, the region has also a higher than provincial average share of interprovincial migrants in these jobs.
Interprovincial migrant information from the 2006 Census refers to persons who moved into the area (in this case, the Thompson-Okanagan Development Region) from 2001 to 2006 from another province or territory within Canada. Information on external migrants from the 2006 Census indicates movers from outside of Canada, usually immigrants. While such information gives a picture of who in the workforce had moved into the area and were still there in 2006, it does not measure the movement year by year of workers who might come for a period of time and then move away. Despite this gap, these mobility measures do give a sense of the extent of migration from outside the area, especially when compared to the BC average data.
In Figure 19 that follows, we show the percentage of the core tourism related occupations that were migrants from interprovincial or international sources, to give an indication of reliance in these occupations on utilization of these migrants.
Thompson-Okanagan Tourism Labour Market Study Final Report May 29, 2009
34
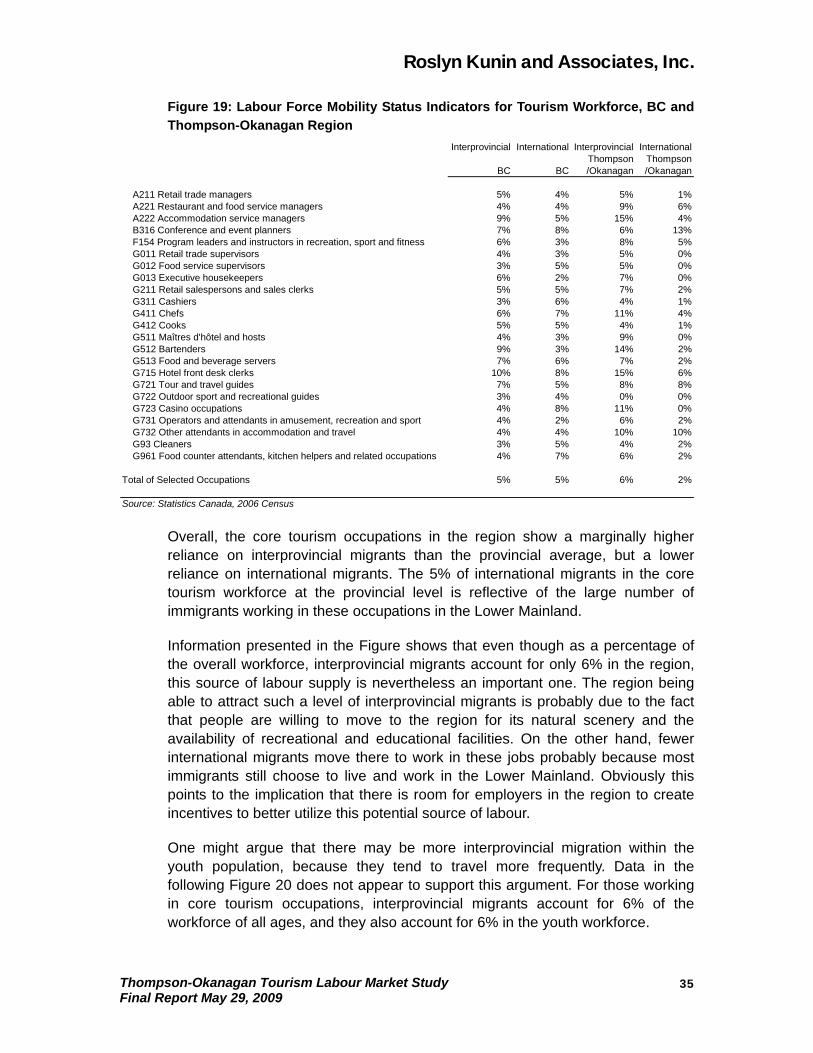
Roslyn Kunin and Associates, Inc.
Figure 19: Labour Force Mobility Status Indicators for Tourism Workforce, BC and Thompson-Okanagan Region
Interprovincial International Interprovincial InternationalThompson Thompson
BC BC /Okanagan /Okanagan
A211 Retail trade managers 5% 4% 5% 1% A221 Restaurant and food service managers 4% 4% 9% 6% A222 Accommodation service managers 9% 5% 15% 4% B316 Conference and event planners 7% 8% 6% 13% F154 Program leaders and instructors in recreation, sport and fitness 6% 3% 8% 5% G011 Retail trade supervisors 4% 3% 5% 0% G012 Food service supervisors 3% 5% 5% 0% G013 Executive housekeepers 6% 2% 7% 0% G211 Retail salespersons and sales clerks 5% 5% 7% 2% G311 Cashiers 3% 6% 4% 1% G411 Chefs 6% 7% 11% 4% G412 Cooks 5% 5% 4% 1% G511 Maîtres d'hôtel and hosts 4% 3% 9% 0% G512 Bartenders 9% 3% 14% 2% G513 Food and beverage servers 7% 6% 7% 2% G715 Hotel front desk clerks 10% 8% 15% 6% G721 Tour and travel guides 7% 5% 8% 8% G722 Outdoor sport and recreational guides 3% 4% 0% 0% G723 Casino occupations 4% 8% 11% 0% G731 Operators and attendants in amusement, recreation and sport 4% 2% 6% 2% G732 Other attendants in accommodation and travel 4% 4% 10% 10% G93 Cleaners 3% 5% 4% 2% G961 Food counter attendants, kitchen helpers and related occupations 4% 7% 6% 2%
Total of Selected Occupations 5% 5% 6% 2%
Source: Statistics Canada, 2006 Census
Overall, the core tourism occupations in the region show a marginally higher reliance on interprovincial migrants than the provincial average, but a lower reliance on international migrants. The 5% of international migrants in the core tourism workforce at the provincial level is reflective of the large number of immigrants working in these occupations in the Lower Mainland.
Information presented in the Figure shows that even though as a percentage of the overall workforce, interprovincial migrants account for only 6% in the region, this source of labour supply is nevertheless an important one. The region being able to attract such a level of interprovincial migrants is probably due to the fact that people are willing to move to the region for its natural scenery and the availability of recreational and educational facilities. On the other hand, fewer international migrants move there to work in these jobs probably because most immigrants still choose to live and work in the Lower Mainland. Obviously this points to the implication that there is room for employers in the region to create incentives to better utilize this potential source of labour.
One might argue that there may be more interprovincial migration within the youth population, because they tend to travel more frequently. Data in the following Figure 20 does not appear to support this argument. For those working in core tourism occupations, interprovincial migrants account for 6% of the workforce of all ages, and they also account for 6% in the youth workforce.
Thompson-Okanagan Tourism Labour Market Study Final Report May 29, 2009
35
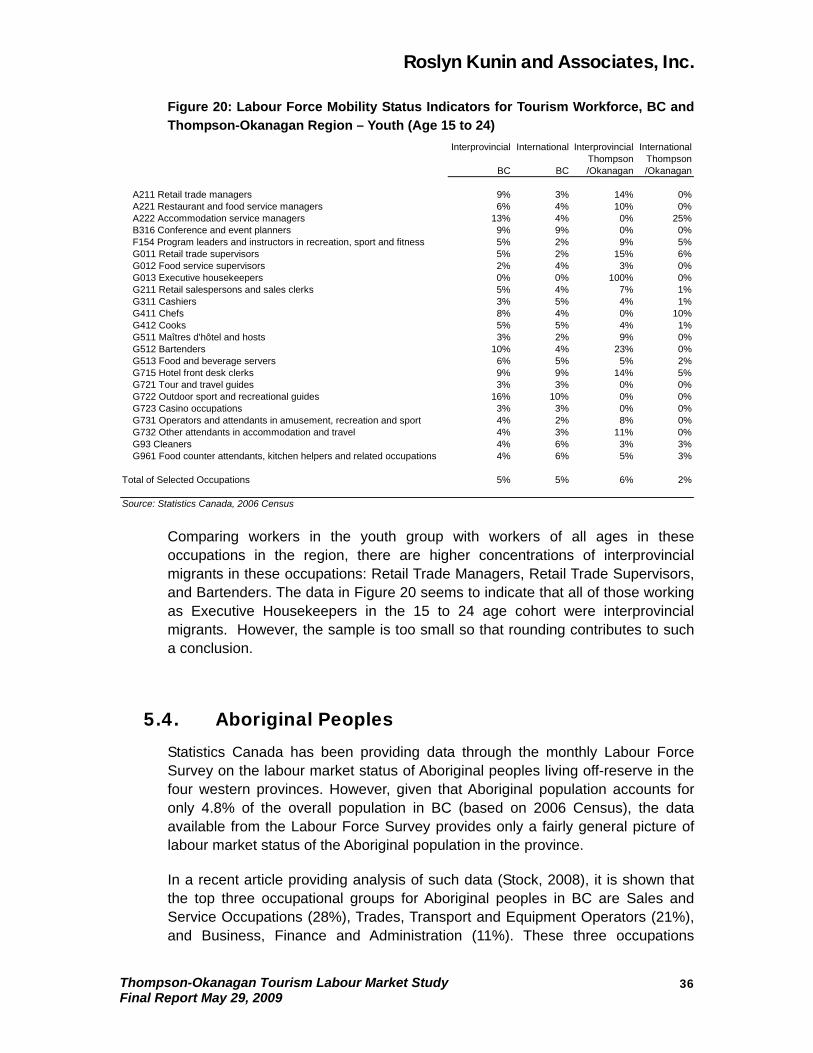
Roslyn Kunin and Associates, Inc.
Figure 20: Labour Force Mobility Status Indicators for Tourism Workforce, BC and Thompson-Okanagan Region – Youth (Age 15 to 24)
Interprovincial International Interprovincial InternationalThompson Thompson
BC BC /Okanagan /Okanagan
A211 Retail trade managers 9% 3% 14% 0% A221 Restaurant and food service managers 6% 4% 10% 0% A222 Accommodation service managers 13% 4% 0% 25% B316 Conference and event planners 9% 9% 0% 0% F154 Program leaders and instructors in recreation, sport and fitness 5% 2% 9% 5% G011 Retail trade supervisors 5% 2% 15% 6% G012 Food service supervisors 2% 4% 3% 0% G013 Executive housekeepers 0% 0% 100% 0% G211 Retail salespersons and sales clerks 5% 4% 7% 1% G311 Cashiers 3% 5% 4% 1% G411 Chefs 8% 4% 0% 10% G412 Cooks 5% 5% 4% 1% G511 Maîtres d'hôtel and hosts 3% 2% 9% 0% G512 Bartenders 10% 4% 23% 0% G513 Food and beverage servers 6% 5% 5% 2% G715 Hotel front desk clerks 9% 9% 14% 5% G721 Tour and travel guides 3% 3% 0% 0% G722 Outdoor sport and recreational guides 16% 10% 0% 0% G723 Casino occupations 3% 3% 0% 0% G731 Operators and attendants in amusement, recreation and sport 4% 2% 8% 0% G732 Other attendants in accommodation and travel 4% 3% 11% 0% G93 Cleaners 4% 6% 3% 3% G961 Food counter attendants, kitchen helpers and related occupations 4% 6% 5% 3%
Total of Selected Occupations 5% 5% 6% 2%
Source: Statistics Canada, 2006 Census
Comparing workers in the youth group with workers of all ages in these occupations in the region, there are higher concentrations of interprovincial migrants in these occupations: Retail Trade Managers, Retail Trade Supervisors, and Bartenders. The data in Figure 20 seems to indicate that all of those working as Executive Housekeepers in the 15 to 24 age cohort were interprovincial migrants. However, the sample is too small so that rounding contributes to such a conclusion.
5.4. Aboriginal Peoples
Statistics Canada has been providing data through the monthly Labour Force Survey on the labour market status of Aboriginal peoples living off-reserve in the four western provinces. However, given that Aboriginal population accounts for only 4.8% of the overall population in BC (based on 2006 Census), the data available from the Labour Force Survey provides only a fairly general picture of labour market status of the Aboriginal population in the province.
In a recent article providing analysis of such data (Stock, 2008), it is shown that the top three occupational groups for Aboriginal peoples in BC are Sales and Service Occupations (28%), Trades, Transport and Equipment Operators (21%), and Business, Finance and Administration (11%). These three occupations
Thompson-Okanagan Tourism Labour Market Study Final Report May 29, 2009
36
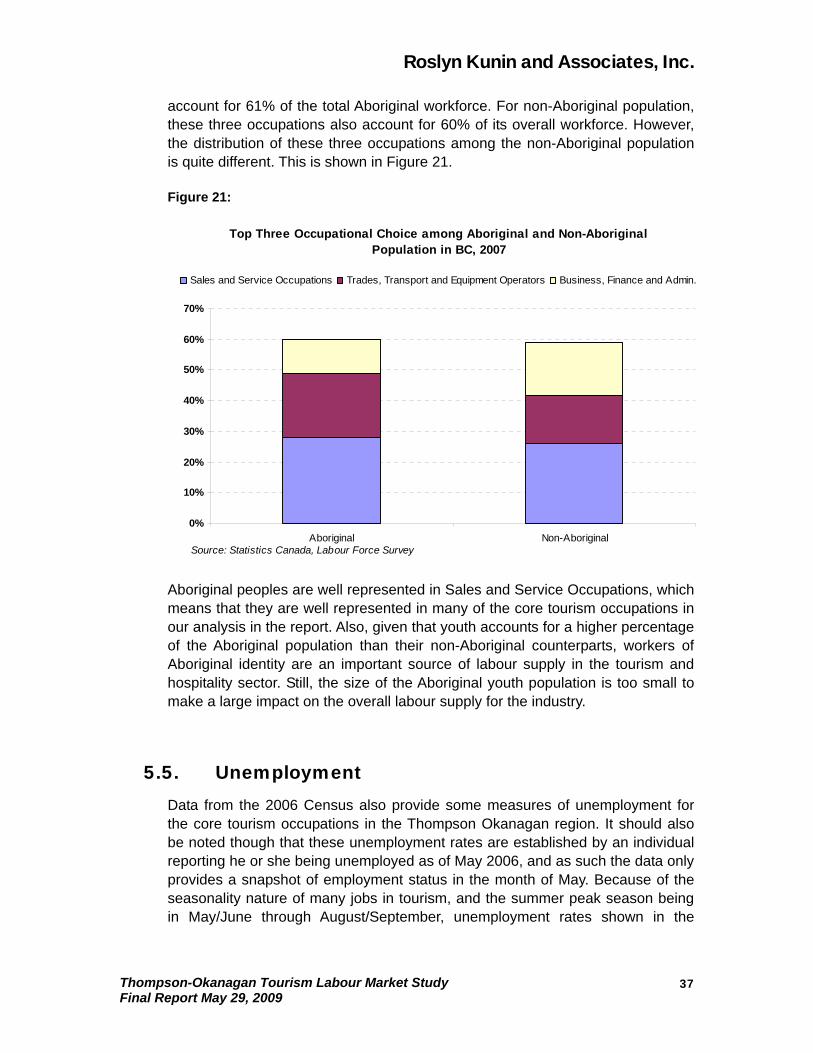
Roslyn Kunin and Associates, Inc.
account for 61% of the total Aboriginal workforce. For non-Aboriginal population, these three occupations also account for 60% of its overall workforce. However, the distribution of these three occupations among the non-Aboriginal population is quite different. This is shown in Figure 21.
Figure 21:
Top Three Occupational Choice among Aboriginal and Non-Aboriginal Population in BC, 2007
0%
10%
20%
30%
40%
50%
60%
70%
Aboriginal Non-Aboriginal
Sales and Service Occupations Trades, Transport and Equipment Operators Business, Finance and Admin.
Source: Statistics Canada, Labour Force Survey
Aboriginal peoples are well represented in Sales and Service Occupations, which means that they are well represented in many of the core tourism occupations in our analysis in the report. Also, given that youth accounts for a higher percentage of the Aboriginal population than their non-Aboriginal counterparts, workers of Aboriginal identity are an important source of labour supply in the tourism and hospitality sector. Still, the size of the Aboriginal youth population is too small to make a large impact on the overall labour supply for the industry.
5.5. Unemployment
Data from the 2006 Census also provide some measures of unemployment for the core tourism occupations in the Thompson Okanagan region. It should also be noted though that these unemployment rates are established by an individual reporting he or she being unemployed as of May 2006, and as such the data only provides a snapshot of employment status in the month of May. Because of the seasonality nature of many jobs in tourism, and the summer peak season being in May/June through August/September, unemployment rates shown in the
Thompson-Okanagan Tourism Labour Market Study Final Report May 29, 2009
37
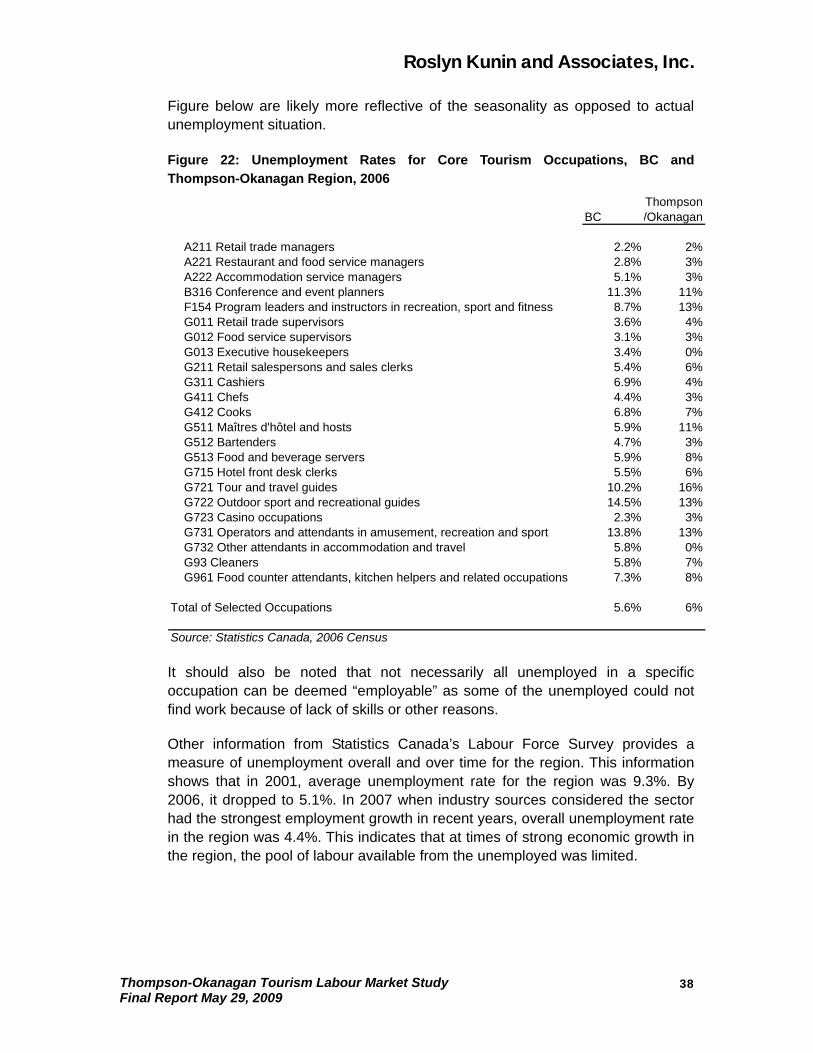
Roslyn Kunin and Associates, Inc.
Figure below are likely more reflective of the seasonality as opposed to actual unemployment situation.
Figure 22: Unemployment Rates for Core Tourism Occupations, BC and Thompson-Okanagan Region, 2006
ThompsonBC /Okanagan
A211 Retail trade managers 2.2% 2% A221 Restaurant and food service managers 2.8% 3% A222 Accommodation service managers 5.1% 3% B316 Conference and event planners 11.3% 11% F154 Program leaders and instructors in recreation, sport and fitness 8.7% 13% G011 Retail trade supervisors 3.6% 4% G012 Food service supervisors 3.1% 3% G013 Executive housekeepers 3.4% 0% G211 Retail salespersons and sales clerks 5.4% 6% G311 Cashiers 6.9% 4% G411 Chefs 4.4% 3% G412 Cooks 6.8% 7% G511 Maîtres d'hôtel and hosts 5.9% 11% G512 Bartenders 4.7% 3% G513 Food and beverage servers 5.9% 8% G715 Hotel front desk clerks 5.5% 6% G721 Tour and travel guides 10.2% 16% G722 Outdoor sport and recreational guides 14.5% 13% G723 Casino occupations 2.3% 3% G731 Operators and attendants in amusement, recreation and sport 13.8% 13% G732 Other attendants in accommodation and travel 5.8% 0% G93 Cleaners 5.8% 7% G961 Food counter attendants, kitchen helpers and related occupations 7.3% 8%
Total of Selected Occupations 5.6% 6%
Source: Statistics Canada, 2006 Census
It should also be noted that not necessarily all unemployed in a specific occupation can be deemed “employable” as some of the unemployed could not find work because of lack of skills or other reasons.
Other information from Statistics Canada’s Labour Force Survey provides a measure of unemployment overall and over time for the region. This information shows that in 2001, average unemployment rate for the region was 9.3%. By 2006, it dropped to 5.1%. In 2007 when industry sources considered the sector had the strongest employment growth in recent years, overall unemployment rate in the region was 4.4%. This indicates that at times of strong economic growth in the region, the pool of labour available from the unemployed was limited.
Thompson-Okanagan Tourism Labour Market Study Final Report May 29, 2009
38
Roslyn Kunin and Associates, Inc.
Thompson-Okanagan Tourism Labour Market Study Final Report May 29, 2009
39
5.6. Foreign Workers
In situations where Canadian citizens and landed immigrants cannot fulfill the needs of labour demand, an employer may need to resort to bringing in workers temporarily from outside the country. In the province of BC, there are a number of ways for employers in the tourism sector to recruit workers in specific occupations from overseas to meet labour requirements.
According to information available from go2, these following four types of programs are available for tourism employers to draw labour from.
• Temporary Foreign Worker Program. This program is designed to assist tourism operators meet their labour requirements by hiring foreign workers under very specific circumstances and for a limited period of time. The program covers both skilled and unskilled workers and has been amended to help expedite the process for certain occupations where there is a demonstrated shortage of Canadian workers able to perform the work.
• Provincial Nominee Program. This is a joint program administered by Citizenship and Immigration Canada and British Columbia’s Ministry of Economic Development. This program is designed to expedite the permanent immigration of foreign skilled workers into Canada. A majority of nominees to this program are currently working in Canada with a temporary work visa.
• International Students Program. This program has a number of variations (Co-operative Education, Work Off-Campus and Post Graduation work visas) all of which are designed to provide international students studying in Canada with relevant work experience while in Canada.
• Working Holiday and Student Work Abroad Programs. These programs are designed to assist young people (usually between the ages of 18-35) in certain countries to come to Canada for a designated period of time to work while on holiday. This program is currently used by a number of ski resorts in British Columbia to increase their local labour pool.
Data from the Citizenship and Immigration Canada (CIC) show that the number of entries of temporary foreign workers working in tourism related occupations more than quadrupled between 2000 and 2008 in the province. On an average annual growth basis, this represents a growth rate of 20% per year. Of all the occupations, Light Duty Cleaners, which include housekeeping staff and room attendants, as well as Food and Beverage Servers, increased the most. This is shown in Figure 23. Such data is consistent with our analysis showing substantial labour shortage especially with these occupations within the region (see Section 6 that follows).
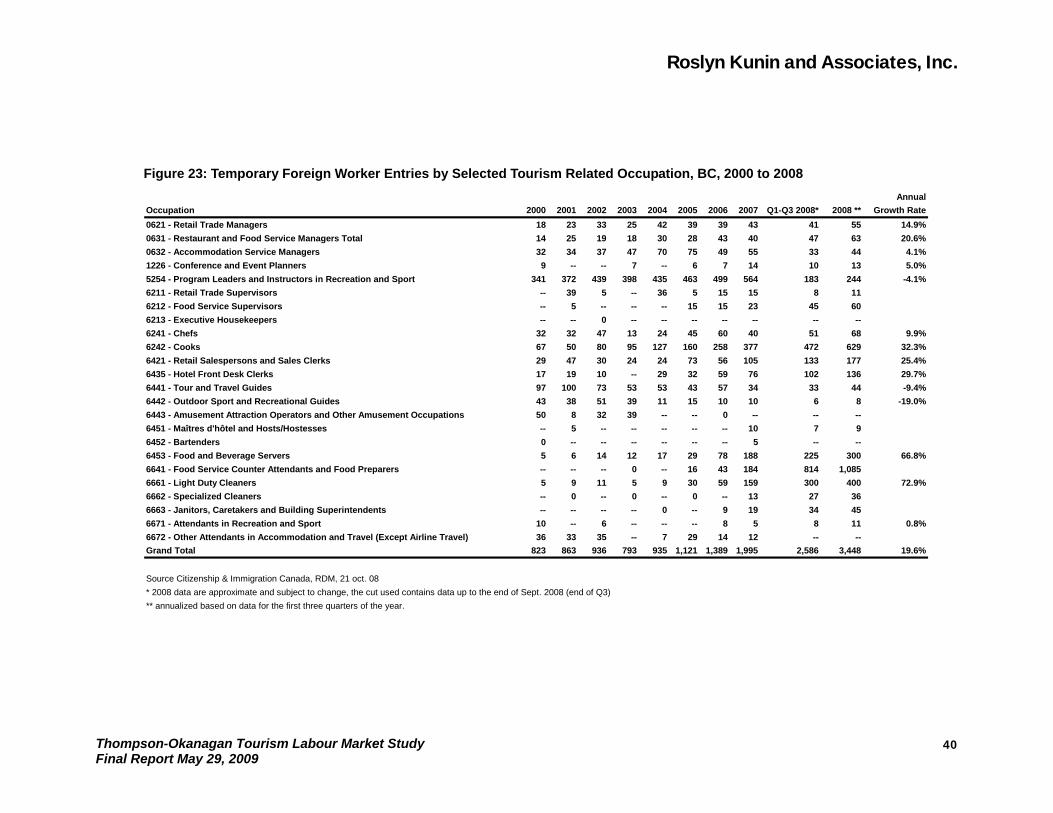
Roslyn Kunin and Associates, Inc.
Figure 23: Temporary Foreign Worker Entries by Selected Tourism Related Occupation, BC, 2000 to 2008 Annual
Occupation 2000 2001 2002 2003 2004 2005 2006 2007 Q1-Q3 2008* 2008 ** Growth Rate0621 - Retail Trade Managers 18 23 33 25 42 39 39 43 41 55 14.9%0631 - Restaurant and Food Service Managers Total 14 25 19 18 30 28 43 40 47 63 20.6%0632 - Accommodation Service Managers 32 34 37 47 70 75 49 55 33 44 4.1%1226 - Conference and Event Planners 9 -- -- 7 -- 6 7 14 10 13 5.0%5254 - Program Leaders and Instructors in Recreation and Sport 341 372 439 398 435 463 499 564 183 244 -4.1%6211 - Retail Trade Supervisors -- 39 5 -- 36 5 15 15 8 116212 - Food Service Supervisors -- 5 -- -- -- 15 15 23 45 606213 - Executive Housekeepers -- -- 0 -- -- -- -- -- -- --6241 - Chefs 32 32 47 13 24 45 60 40 51 68 9.9%6242 - Cooks 67 50 80 95 127 160 258 377 472 629 32.3%6421 - Retail Salespersons and Sales Clerks 29 47 30 24 24 73 56 105 133 177 25.4%6435 - Hotel Front Desk Clerks 17 19 10 -- 29 32 59 76 102 136 29.7%6441 - Tour and Travel Guides 97 100 73 53 53 43 57 34 33 44 -9.4%6442 - Outdoor Sport and Recreational Guides 43 38 51 39 11 15 10 10 6 8 -19.0%6443 - Amusement Attraction Operators and Other Amusement Occupations 50 8 32 39 -- -- 0 -- -- --6451 - Maîtres d'hôtel and Hosts/Hostesses -- 5 -- -- -- -- -- 10 7 96452 - Bartenders 0 -- -- -- -- -- -- 5 -- --6453 - Food and Beverage Servers 5 6 14 12 17 29 78 188 225 300 66.8%6641 - Food Service Counter Attendants and Food Preparers -- -- -- 0 -- 16 43 184 814 1,0856661 - Light Duty Cleaners 5 9 11 5 9 30 59 159 300 400 72.9%6662 - Specialized Cleaners -- 0 -- 0 -- 0 -- 13 27 366663 - Janitors, Caretakers and Building Superintendents -- -- -- -- 0 -- 9 19 34 456671 - Attendants in Recreation and Sport 10 -- 6 -- -- -- 8 5 8 11 0.8%6672 - Other Attendants in Accommodation and Travel (Except Airline Travel) 36 33 35 -- 7 29 14 12 -- --Grand Total 823 863 936 793 935 1,121 1,389 1,995 2,586 3,448 19.6%
Source Citizenship & Immigration Canada, RDM, 21 oct. 08* 2008 data are approximate and subject to change, the cut used contains data up to the end of Sept. 2008 (end of Q3)** annualized based on data for the first three quarters of the year.
Thompson-Okanagan Tourism Labour Market Study Final Report May 29, 2009
40
Roslyn Kunin and Associates, Inc.
In total, there were about 4,650 temporary foreign workers in the province in 2008 working in these tourism-related occupations. Data from the CIC also breaks down entries of temporary foreign workers by population centre within the province as a destination. Within Thompson-Okanagan, these population centres include Kamloops, Kelowna, Penticton, and Vernon.
Following is a list of the occupations for which temporary foreign workers are present, and their shares of the provincial totals by occupation are also shown.
• Program Leaders and Instructors in Recreation and Sports: Kamloops has about 2-3% of the provincial total temporary foreign workers in this category, Kelowna’s share ranges between 4% and 9% over the years, and Vernon has between 2-4% of the provincial total.
• Chefs and Cooks: Kamloops had about 10% of the provincial total temporary foreign workers in the Chefs category, and about 1% in the Cooks category. Kelowna had about 1% of the total in the Cooks category as well.
• Hotel Front Desk Clerks: Kamloops had about 6% of the provincial total temporary foreign workers in this category, and Kelowna had about 5% of the total in the category as well.
• Food and Beverage Servers: Kamloops had about 2% of the provincial total temporary foreign workers in this category, and Kelowna had about 3% of the total in the category.
• Food Services Attendants and Food Preparers: Kamloops had about 1% of the provincial total temporary foreign workers in this category, and Kelowna had about 3% of the total in the category.
• Cleaners: Kamloops had about 4% of the provincial total temporary foreign workers in the Light Duty Cleaners category, and Kelowna had about 3-6% of the total in the category. Vernon had 18% of the provincial total temporary foreign workers in the Janitor, Caretakers, and Building Superintendents category.
It should be noted that with the exception of Program Leaders and Instructors in Recreation and Sports, entries of temporary foreign workers in all other occupations shown above did not appear until after 2006.
It should also be noted that CIC data also shows entries under “Census Metropolitan Areas (CMAs) not Stated” and “Not within CMAs of the Region”. Such represents entries of foreign workers in smaller population areas. The data we have obtained does not allow us to know exactly where they work outside these major cities to draw definite conclusions. In any case, the data does confirm that temporary foreign workers have become an important source of labour supply for the region’s tourism sector.
Thompson-Okanagan Tourism Labour Market Study Final Report May 29, 2009
41
Roslyn Kunin and Associates, Inc.
Of those foreign workers admitted to the province under the Provincial Nominee Program (PNP), data we have obtained from CIC similarly indicates strong growth in recent years. However, the total number is still extremely small, and the concentration of these workers appears to be Chefs and Cooks. There is no sub-provincial data available due to the small size of this category of workers. In 2008, there were altogether 95 persons (principal applicants) admitted to the province in these tourism-related occupations.
Finally, we note that because those admitted into the province under Working Holiday and Student Work Abroad Programs do not need a visa specifying intended occupations, it is possible many of them do work in tourism-related occupations.
The ski tourism sector throughout British Columbia makes good use of the working holiday program for workers between the ages of 18 and 30. These young people, most often from England, New Zealand or Australia, are interested in a travel adventure that includes a combination of work and pleasure. At Silver Star Mountain near Vernon, as many as 30% of staff are employed on a working holiday visa.
Altogether, there were about 26,000 individuals in the province in 2008 who could potentially be temporary workers under the category of “Skills Not Stated”. Of this total, those from Australia accounted for 28%, those from Japan accounted for 15%, and those from the UK and Colonies represented another 10%.
5.7. Earnings, Hours and Non-Wage Benefits
Wages and compensation are generally considered to be very important factors when evaluating the availability of labour in any given industry. Both secondary sources and our focus groups indicated that the relatively low wages paid in the tourism industry were a factor in attracting and retaining workers. Employers such as caterers in the government sector, which offer better than average wages and working conditions, are better at attracting and retaining their workers. All are aware that market conditions including price limits on final demand for goods and services provided put a ceiling on wages, but wages also put a ceiling on the supply of available labour.
We do not have statistical data showing the level of compensation for the same occupation in various industries. However, industry sources we have been in touch with have informed us that people working as cooks, servers, and cleaners in the hospitality sector earn lower wages than those working in hospitals, care facilities, and correctional facilities. In many cases, they are not entitled to, or have only limited coverage for, non-wage benefits such as extended health benefits or pension plans.
Thompson-Okanagan Tourism Labour Market Study Final Report May 29, 2009
42

Roslyn Kunin and Associates, Inc.
Thompson-Okanagan Tourism Labour Market Study Final Report May 29, 2009
43
With respect to working conditions, part-time work, or shift work, as well as long hours during busy times also make work arrangement difficult especially for those with child care issues.
Lack of apprenticing opportunities for cooks is also cited by industry sources as another factor contributing to lack of supply.
Roslyn Kunin and Associates, Inc.
6. Assessing the Balance in the Tourism Labour Market
In this section, we will combine estimated and projected labour demand and labour supply for core tourism occupations in the Thompson-Okanagan Development Region to derive supply-demand gaps. We will also present qualitative information and analysis we conducted from the industry consultation process.
In Figure 24, we present our findings on potential supply-demand gaps among occupations under analysis. Note that in the Figure, a negative value means no gaps for the occupation in the year, while a positive value represents a shortage in labour supply. We further note that even in cases where a negative value (i.e., surplus) exists, this only means there are enough “bodies” to meet labour demand needs.
Our analysis has found that labour supply in the region lags behind labour demand for most of the core tourism related occupations. In future years, with the exception of 2009, labour shortage will prevail with many of the occupations, and the total core tourism workforce in the region. This is mainly due to the smaller than average share of the core working age population (those aged 25 to 54) in the region, as well as an ageing population and its resulting effect of limited labour force growth. This means that even if the industry hires every single individual available to work in that occupation, (therefore meaning zero unemployment), there will be a labour shortage in many of the occupations.
For individual occupations within the group, the ones where severe shortages are expected to exist include Program Leaders and Instructors in Recreation and Sports, Outdoor Sport and Recreation Guides, Operators and Attendants in Amusement Recreation and Sport, and Food Counter Attendants and Kitchen Helpers.
In Figure 25, we express the shortfall as a percentage of labour demand. Here we note that we only show values where there exists a shortage.
We further note that our gaps shown here are fairly conservative and are the minimum values representing potential shortages.
Thompson-Okanagan Tourism Labour Market Study Final Report May 29, 2009
44
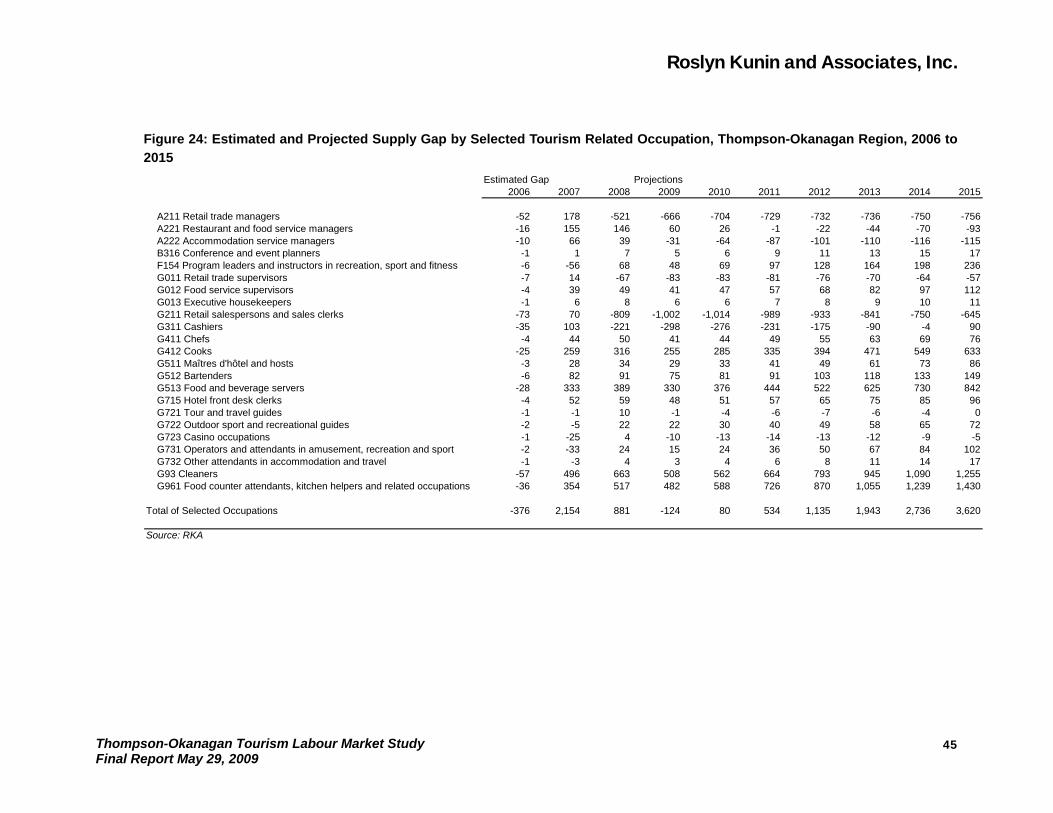
Roslyn Kunin and Associates, Inc.
Figure 24: Estimated and Projected Supply Gap by Selected Tourism Related Occupation, Thompson-Okanagan Region, 2006 to 2015
Estimated Gap Projections2006 2007 2008 2009 2010 2011 2012 2013 2014 2015
A211 Retail trade managers -52 178 -521 -666 -704 -729 -732 -736 -750 -756 A221 Restaurant and food service managers -16 155 146 60 26 -1 -22 -44 -70 -93 A222 Accommodation service managers -10 66 39 -31 -64 -87 -101 -110 -116 -115 B316 Conference and event planners -1 1 7 5 6 9 11 13 15 17 F154 Program leaders and instructors in recreation, sport and fitness -6 -56 68 48 69 97 128 164 198 236 G011 Retail trade supervisors -7 14 -67 -83 -83 -81 -76 -70 -64 -57 G012 Food service supervisors -4 39 49 41 47 57 68 82 97 112 G013 Executive housekeepers -1 6 8 6 6 7 8 9 10 11 G211 Retail salespersons and sales clerks -73 70 -809 -1,002 -1,014 -989 -933 -841 -750 -645 G311 Cashiers -35 103 -221 -298 -276 -231 -175 -90 -4 90 G411 Chefs -4 44 50 41 44 49 55 63 69 76 G412 Cooks -25 259 316 255 285 335 394 471 549 633 G511 Maîtres d'hôtel and hosts -3 28 34 29 33 41 49 61 73 86 G512 Bartenders -6 82 91 75 81 91 103 118 133 149 G513 Food and beverage servers -28 333 389 330 376 444 522 625 730 842 G715 Hotel front desk clerks -4 52 59 48 51 57 65 75 85 96 G721 Tour and travel guides -1 -1 10 -1 -4 -6 -7 -6 -4 0 G722 Outdoor sport and recreational guides -2 -5 22 22 30 40 49 58 65 72 G723 Casino occupations -1 -25 4 -10 -13 -14 -13 -12 -9 -5 G731 Operators and attendants in amusement, recreation and sport -2 -33 24 15 24 36 50 67 84 102 G732 Other attendants in accommodation and travel -1 -3 4 3 4 6 8 11 14 17 G93 Cleaners -57 496 663 508 562 664 793 945 1,090 1,255 G961 Food counter attendants, kitchen helpers and related occupations -36 354 517 482 588 726 870 1,055 1,239 1,430
Total of Selected Occupations -376 2,154 881 -124 80 534 1,135 1,943 2,736 3,620
Source: RKA
Thompson-Okanagan Tourism Labour Market Study Final Report May 29, 2009
45

Roslyn Kunin and Associates, Inc.
Figure 25: Estimated and Projected Supply Gap as a % of Labour Demand by Selected Tourism Related Occupation, Thompson-Okanagan Region, 2006 to 2015
Estimated Gapas % of Demand Projections
2006 2007 2008 2009 2010 2011 2012 2013 2014 2015
A211 Retail trade managers 0% 2% 0% 0% 0% 0% 0% 0% 0% 0% A221 Restaurant and food service managers 0% 6% 5% 2% 1% 0% 0% 0% 0% 0% A222 Accommodation service managers 0% 4% 2% 0% 0% 0% 0% 0% 0% 0% B316 Conference and event planners 0% 1% 5% 3% 4% 5% 7% 8% 9% 10% F154 Program leaders and instructors in recreation, sport and fitness 0% 0% 7% 5% 7% 9% 11% 14% 17% 19% G011 Retail trade supervisors 0% 1% 0% 0% 0% 0% 0% 0% 0% 0% G012 Food service supervisors 0% 6% 8% 6% 7% 9% 10% 12% 14% 16% G013 Executive housekeepers 0% 6% 7% 5% 6% 6% 7% 7% 8% 9% G211 Retail salespersons and sales clerks 0% 1% 0% 0% 0% 0% 0% 0% 0% 0% G311 Cashiers 0% 2% 0% 0% 0% 0% 0% 0% 0% 2% G411 Chefs 0% 7% 8% 6% 7% 7% 8% 9% 10% 11% G412 Cooks 0% 6% 7% 6% 7% 8% 9% 10% 12% 14% G511 Maîtres d'hôtel and hosts 0% 7% 8% 7% 8% 9% 11% 13% 15% 18% G512 Bartenders 0% 8% 8% 7% 7% 8% 9% 10% 11% 13% G513 Food and beverage servers 0% 7% 8% 7% 8% 9% 10% 12% 14% 16% G715 Hotel front desk clerks 0% 8% 8% 7% 7% 8% 9% 10% 11% 12% G721 Tour and travel guides 0% 0% 4% 0% 0% 0% 0% 0% 0% 0% G722 Outdoor sport and recreational guides 0% 0% 8% 8% 10% 13% 16% 18% 19% 21% G723 Casino occupations 0% 0% 2% 0% 0% 0% 0% 0% 0% 0% G731 Operators and attendants in amusement, recreation and sport 0% 0% 6% 4% 6% 9% 12% 15% 18% 21% G732 Other attendants in accommodation and travel 0% 0% 4% 3% 4% 6% 8% 10% 13% 16% G93 Cleaners 0% 5% 7% 5% 6% 7% 8% 9% 10% 11% G961 Food counter attendants, kitchen helpers and related occupations 0% 6% 8% 8% 9% 11% 13% 15% 18% 20%
Total of Selected Occupations 0.0% 3.6% 1.5% 0.0% 0.1% 0.9% 1.8% 3.0% 4.2% 5.5%
Source: RKA
Thompson-Okanagan Tourism Labour Market Study Final Report May 29, 2009
46
Roslyn Kunin and Associates, Inc.
In addition to our data analysis, we also present here results of industry consultation. The focus group discussions included questions around which job occupations are the most likely to experience shortages in the future.
Most participants said they do have some long term concerns regarding the availability of labour to fill certain tourism and/or hospitality jobs looking towards the year 2015.
Among the occupations of greatest concern are the following:
1. Housekeeping - first and foremost; and,
2. Culinary staff, specifically cooks (front-line/first), as well as sous chefs and chefs.
3. Entry level kitchen (especially dishwashers) and restaurant (i.e. bus people)
Other occupations frequently mentioned as being difficult to fill and/or hold onto good, qualified staff include:
• Foodservers and banquet staff (the Thompson Okanagan tourism and hospitality industry is looking for more people who are qualified and experienced)
• Front-line staff (including front desk)
• Sales staff. Many tourism and hospitality operators are hiring staff in these roles from other industries in order to find the people with the right skills and talent.
Looking ahead, the industry expects to continue to be in short supply of people who can fill the following skilled and semi-skilled positions:
• Building/yards/equipment maintenance/handyman
• Other cleaning/custodial/janitorial positions
Thompson-Okanagan Tourism Labour Market Study Final Report May 29, 2009
47
Roslyn Kunin and Associates, Inc.
7. Potential Labour Market and HR Development Strategies
The British Columbia tourism industry, with the help of go2, has worked hard to position itself as a strong and valuable provider of employment offering long-term job satisfaction and career growth. There was some discussion during the focus group sessions regarding successful recruitment, training and retention practises.
A very important consideration in the Thompson Okanagan region is the fact that the majority of operations are seasonal. Business during July and August reaches close to 100% capacity but approximately one third or 32% of businesses actually close completely during the winter months. (The exception to this is the ski sector.) This significant variation affects staffing needs.
With the added complication of a tight labour supply and now an economic recession, businesses must find ways to “do more with less”. In the tourism and hospitality industry, hiring the “wrong people” does not work for staff or customers. Therefore, employers must continue to find creative ways to increase efficiency in order to remain profitable while not reducing the visitor experience in any way.
This research study revealed the following on the topics of Recruitment, Training and Retention of tourism and hospitality workers in the Thompson Okanagan tourism region. Data from a survey of tourism businesses conducted in 2008 by the Okanagan Partnership is included.
7.1. Recruitment
• The internet is an inexpensive and effective way to recruit staff.
• Job fairs are frequently used in recruiting seasonal employment. Ski resorts around the province combine their efforts in this regard.
• There is interest from the ski sector to expand the already successful working holiday visa to a two year visa and also to extend the upper range of age eligibility from 30 to 35 years.
• Almost two thirds of the tourism and hospitality operators surveyed in 2008 hire a large proportion of college or university students. Many also indicated that recently retired people and recent immigrants to the area are becoming another important source of employees.
Thompson-Okanagan Tourism Labour Market Study Final Report May 29, 2009
48
Roslyn Kunin and Associates, Inc.
• Throughout the communities of the Thompson Okanagan, a lack of public transportation, at all times but especially after-hours and on weekends, has been identified as a significant hindrance to hiring young people and others who do not drive or have vehicles.
• The opportunity to hire mature workers or early-retirees on a part-time basis is something to be explored further. Offering flexible work schedules and non-monetary incentives are likely to appeal.
• There exists potential to work with the Aboriginal community. Several First Nations in the Thompson Okanagan own and operate their own resorts and have members who are trained in tourism and hospitality.
• When there is a need to hire foreign workers, the industry would like to see the length of the application process reduced so that it can be utilized to meet the employment needs of employers.
7.2. Training
• Thompson Okanagan tourism operators see value in ongoing training of staff, despite the current recession. There were also comments provided during the focus groups about the need to improve training opportunities in the tourism and hospitality industry. Specifically, employers are looking for more “hands-on experience” from graduates of formal training programs.
• Basic training in customer services skills was noted as lacking among young people entering the industry, even those coming out of formal tourism/hospitality training programs. Too often, new graduates arrive with high hopes for high wages and career status. There is a need for tourism and hospitality graduates to have realistic expectations of where they will commence their career, as there is a real need for “hands-on” customer service experience that can only be gained with on-the-job training. Co-op programs would be useful here.
• Cross-training of staff is essential to maintaining operating efficiency and is generally beneficial to both employers and employees
• Employers should participate in and develop tourism/hospitality industry training, internships, co-op and mentorship programs.
• Employers should participate in tourism and hospitality career education seminars for young people.
• There is a need to address the issue of attitude and work ethic of staff.
Thompson-Okanagan Tourism Labour Market Study Final Report May 29, 2009
49
Roslyn Kunin and Associates, Inc.
• Employees need to see a career path for themselves if they are going to stay in the industry.
7.3. Retention
Tourism and hospitality employers have long recognized that their industry’s wages are more often than not, too low. As much as possible, Thompson Okanagan tourism and hospitality employers are attempting to offer competitive wages. Many employers attempt to offer wages higher than the minimum.
• Employees appreciate when employers find ways to find as much full-time employment as possible for staff who need it.
• With a slower economy and more choice in employee hiring, recruitment budget dollars can be moved into training and/or staff benefits to help with retention.
• Transportation options for employees are needed, i.e. carpools. And the industry must have a voice in public transportation issues.
• There is a need to look at new ways to provide housing for tourism employees at reasonable cost, i.e., the dorms at Thompson Rivers University which are empty from April/May through September could provide accommodation for seasonal tourism workers.
• The non-financial benefits of working in the tourism and hospitality industry can continue to be enhanced. They are valuable and also important to people who choose to work in this industry.
Summary of Labour and Human Resource Issues and Recommendations for the Thompson Okanagan Tourism Region
The research and analysis conducted through the course of this study has shown that the tourism and hospitality industry of the Thompson Okanagan is in need of long term planning and preparation in order to face a growing tourism demand in the face of a declining local labour supply.
The priority issues to be addressed include the following:
• Seasonality – With the exception of the ski industry, most operators are busier and require more staff during the summer. Many staff are laid-off and then must be rehired, often at considerable expense, the following year. There is limited shoulder season business in the Thompson Okanagan.
Thompson-Okanagan Tourism Labour Market Study Final Report May 29, 2009
50
Roslyn Kunin and Associates, Inc.
• Demographics – Due to falling fertility rates, longer lifespans and the retirement of the baby boomer generation, the number of young people entering the workforce is insufficient to meet the demand for labour in Canada (in all industries). Baby boomers are retiring – not only are they helping to push up the demand for tourism and travel but they are also a potential source of labour for the industry, especially in the non-metro areas to which many move.
• Mobility – Employers are reliant on a local work-force unless they can offer mobile workers an employee housing situation or nearby community that offers affordable housing and cost of living. Unlike metro areas, the limited supply of appropriate housing is more of a problem than the cost.
• Aboriginal Peoples – This segment is a source of labour supply with local housing, yet most operators do not actively recruit from this population.
• Persons with Disabilities – Most tourism and hospitality operators do not actively recruit from this group.
• Unemployed – Due to seasonality, many workers are “unemployed’ during the off-season, including students returning to school. Some others in the unemployed category are not considered employable in the tourism and hospitality industry.
• Foreign Workers – The tourism and hospitality industry makes use of foreign workers, most often those on a temporary foreign worker or a working holiday visa. International students from TRU are a source of workers now that their entry conditions allow for this.
• Compensation – Relatively low wages paid throughout the tourism industry are a significant deterrent to attracting and retaining qualified workers. This is less of a constraint in smaller communities with fewer alternative employment opportunities.
• Attitudes and experience – Throughout the tourism regions, operators are faced with the challenge of finding employees who have the right attitude, experience and “willingness” to work hard and be successful in the tourism and hospitality industry. Co-op programs would help solve this problem.
The research and analysis conducted here to date suggests the following strategies be considered in preparing for future human resource needs in the Thompson Okanagan tourism region, if such strategies are deemed necessary:
1. Utilize non-traditional labour, including older workers, Aboriginals and people with disabilities. Employers must understand and create a work
Thompson-Okanagan Tourism Labour Market Study Final Report May 29, 2009
51
Roslyn Kunin and Associates, Inc.
environment that suits the needs and characteristics of individual employee groups. Older workers and some Aboriginals may find the part-year nature of the work an advantage.
2. Encourage young people to enter the industry. Despite a drop in their overall numbers, young people remain a very important source of labour for the tourism and hospitality industry. Employers must continue to develop new and innovative ways to appeal to and attract this segment of the population. By recognising, understanding and working with technology and the other “cultural” characteristics of Generation Y and others within this segment, employers may be able to find untapped potential and develop the much needed work ethic and attitude at the same time. Continued communication and connections with schools is important. An incentive program to keep youth in smaller communities and/or to encourage young people to recruit other youth could be developed. International students are a source of young workers. Given jobs with career paths on graduation, some may choose to stay.
3. Tourism must have a voice in matters concerning affordable housing and cost-of-living. This is still a concern although less so than in larger centres. Raising wages alone is not the simple answer to making a career in tourism and hospitality more attractive. Business owners and the visitor market must be able to sustain any wage increase, otherwise the result will be negative for all concerned. Tourism’s needs must also be heard in matters concerning zoning and the supply of housing, housing costs and transportation services.
4. Make non-monetary incentives attractive. These “perks” have always been an attraction of working in the tourism and hospitality industry. Input from operators has confirmed how important, as well as how varied they can be. Recognizing this reality and expanding the benefits offered to match the unique needs of different workers creates a positive working environment for everyone.
5. There must be industry coordination with educational institutions at all levels. Educators and students must be realistic to the needs of businesses, who seek graduates with hands-on experience and a willingness to learn on the job as well. Co-op programs could be the vehicle for this.
6. Retaining workers is a key human resource strategy. This is true not just in tourism but throughout the economy. Tourism and hospitality businesses are particularly challenged by this due to the seasonality factor but must continue to face the issue in creative ways. The slow down in other opportunities in the resource sector will help the tourism labour supply, but the weak resource market will not last.
Thompson-Okanagan Tourism Labour Market Study Final Report May 29, 2009
52
Roslyn Kunin and Associates, Inc.
Thompson-Okanagan Tourism Labour Market Study Final Report May 29, 2009
53
7. Make ongoing improvements to staff efficiency and productivity. This can be achieved through training programs as well as by multi-tasking and implementing cross-training initiatives. This will lead to greater cost effectiveness and staff efficiency, as well as provide a stepping stone to career experience and development, again a benefit to both employers and employees.
8. Ensure the continuation of foreign worker programs. Temporary foreign workers and working holiday visas are programs that have proved to be well-suited to filling the gaps in tourism and hospitality labour needs. This door to labour must remain open, even during recessionary times.
The Thompson Okanagan tourism and hospitality industry will move forward in the direction of positive growth only if sufficient labour is available to staff the tourism product and experiences being developed and promoted. All levels of the industry must come together to ensure its success, i.e. employees, employers, government and its agencies. The coordinated development of a Thompson Okanagan tourism and hospitality human resource plan would be the next step in that process.
Roslyn Kunin and Associates, Inc.
8. Conclusions
In this report, we examined available information regarding overall employment levels and human resource requirements for the tourism industry as a whole in the Thompson Okanagan region. We have also examined statistical data sources and survey reports to gain background information to the tourism industry in the province and in the Thompson Okanagan tourism region specifically.
We then provide estimates of employment in core tourism related occupations in the region in year 2007 and 2008, and provide projections of the same in the period from 2009 to 2015. We have also presented statistical data available concerning different sources of labour that provides for the workforce in the tourism and hospitality industry in the region. In addition, we have provided our estimates and projections of the labour force growth in the region based upon population growth patterns and labour force participation patterns among different age cohorts and gender groups. The purpose of the latter analysis is to provide an estimate of the potential labour supply for the same core tourism occupations.
We have found that employment in core tourism occupations in the region will continue to grow positively, despite a set-back in 2009. In addition, attrition will result in additional openings for replacement needs. Labour force growth, on the other hand, is expected to lag behind employment growth for many of the core tourism occupations in the Thompson-Okanagan region, and as such labour shortages in many of the occupations are expected to prevail in the future period from as soon as 2010.
This report also presents the results from two focus group sessions we conducted in Kelowna and Kamloops as well as interviews with industry stakeholders on current labour market conditions, demographic profiles, projected future labour requirement, and challenges faced by employers in recruitment and retention issues.
We have found that in general, the industry has been able to find enough people to fill in most positions throughout the year, even during summer months. However, in many cases employers do report having to take a long time to fill in the positions, and some may have to take less experienced or qualified workers to fill vacancies.
Among the occupations of greatest concern are the following:
• Housekeeping - first and foremost;
Thompson-Okanagan Tourism Labour Market Study Final Report May 29, 2009
54
Roslyn Kunin and Associates, Inc.
• Culinary staff, especially line cooks;
• Entry level kitchen (especially dishwashers) and restaurant (i.e. bus people)
Other occupations frequently mentioned as being difficult to fill and/or hold onto good, qualified staff include:
• Food servers and banquet staff (the Thompson Okanagan tourism and hospitality industry is looking for more people who are qualified and experienced)
• Front-line staff (including front desk)
• Sales staff. Many tourism and hospitality operators are hiring staff in these roles from other industries in order to find the people with the right skills and talent.
Looking ahead, the industry expects to continue to be in short supply of people who can fill the following skilled and semi-skilled positions:
• Building/yards/equipment maintenance/handyman
• Other cleaning/custodial/janitorial positions.
Many areas of the industry face a challenge in recruiting young people into the sector as well as maintaining a level of apprenticeship enrolment that is sustainable to the industry. It is important to communicate to young people the kinds of jobs available in the industry, including career and managerial positions that are in need of young recruits. High school career counsellors and parents also need to be involved to encourage more young people to enter these seemingly unskilled jobs but with potential career opportunities. Certain factors impacting apprenticeship training completions have been identified.
We have also examined other issues related to recruitment and retention of skilled workers for the industry. Utilization of non-traditional types of labour supply, temporary use of foreign workers, seasonal nature of the work, inconsistency of the availability of work, multi-tasking, wages and compensation, and other factors have been thoroughly explored and discussed throughout the report. We have also presented recommendations from industry stakeholders on potential ways to better utilize existing sources of labour, and to develop additional sources of labour supply to meet the industry’s needs.
Thompson-Okanagan Tourism Labour Market Study Final Report May 29, 2009
55
Roslyn Kunin and Associates, Inc.
References
The Report on Canada’s Tourism Competitiveness, A Call for Action for Canadian Tourism. Prepared by the Tourism Industry Association of Canada. June 2008
Tourism and Travel Trends, 2008 Statistics Compendium. Tourism Industry Association of Canada. February 2009.
Tourism Indicators Data Tables. Prepared by Tourism British Columbia. March 2009.
Province of British Columbia's Tourism Action Plan. Prepared by Ministry of Tourism, Sport and the Arts. February 2007.
Hallin, Lillian (2008). “Trends in BC’s Tourism Sector.” Business Indicators, January 2008, by BC Stats. Issue 08-01. http://www.bcstats.gov.bc.ca/pubs/bcbi/bcbi0801.pdf (accessed April 19, 2009)
BC Ministry of Finance (2009). Budget and Fiscal Plan 2009/10 – 2011/12. Government of British Columbia
BC Stats (2007). British Columbia Regional Employment Projection Model Industry and Occupation Projections: 2006 to 2011, Mainland/Southwest Development Region. http://www.bcstats.gov.bc.ca/data/lss/repm/dr2.pdf (accessed April 19, 2009)
BC Stats (2007). British Columbia Regional Employment Projection Model Industry and Occupation Projections: 2006 to 2011, Thompson-Okanagan Development Region. http://www.bcstats.gov.bc.ca/data/lss/repm/dr3.pdf (accessed April 19, 2009)
Hallin, Lillian (2009). “Tourism Sector Faced Challenges in 2008.” Tourism Sector Monitor, March 2009, by BC Stats. Issue 09-03. http://www.bcstats.gov.bc.ca/pubs/tour/tsm0903.pdf (accessed April 19, 2009)
BC Stats (2008). Tourism Sector Monitor, December 2008. Issue 08-12. http://www.bcstats.gov.bc.ca/pubs/tour/tsm0812.pdf (accessed April 19, 2009)
Cavallin, Hayley (2009). “Okanagan-Similkameen – Wine Country.” Tourism Sector Monitor, February 2009, by BC Stats. Issue 09-02. http://www.bcstats.gov.bc.ca/pubs/tour/tsm0902.pdf (accessed April 19, 2009)
Thompson-Okanagan Tourism Labour Market Study Final Report May 29, 2009
56
Roslyn Kunin and Associates, Inc.
Cavallin, Hayley (2008). “Mainland/Southwest Region.” Tourism Sector Monitor, November 2008, by BC Stats. Issue 08-11. http://www.bcstats.gov.bc.ca/pubs/tour/tsm0811.pdf (accessed April 19, 2009)
Gründlingh, Werner (2008). “BC is climbing the ‘International Traveller Destination’ Ladder.” Tourism Sector Monitor, August 2008, by BC Stats. Issue 08-08. http://www.bcstats.gov.bc.ca/pubs/tour/tsm0808.pdf (accessed April 19, 2009)
Stroomer, Chad (2008). “Canadian Travel to British Columbia.” Tourism Sector Monitor, October 2008, by BC Stats. Issue 08-10. http://www.bcstats.gov.bc.ca/pubs/tour/tsm0810.pdf (accessed April 19, 2009)
Stock, Cathy (2008). “The Aboriginal Population in BC and Recent Trends in Off Reserve Aboriginal Labour Force Participation.” Business Indicators, February 2008, by BC Stats. Issue 08-02. http://www.bcstats.gov.bc.ca/pubs/bcbi/bcbi0802.pdf (accessed April 19, 2009)
BC Stats (2009). Aboriginal Peoples Labour Force Survey, 2008. http://www.bcstats.gov.bc.ca/data/lss/abor/abo_lfs_2008.pdf (accessed April 19, 2009)
Thompson Okanagan Regional Profile. Prepared by Tourism B.C. November 2008.
Okanagan Tourism Labour Study 2008. Completed by the Okanagan Partnership with funding from Service.Canada. http://www.okanaganpartnership.ca/report/Report.pdf
BC Stats (2007). British Columbia Labour Force Participation Rate Projections to 2031. http://www.bcstats.gov.bc.ca/data/pop/pop/BC_LFPRproj_0705.pdf (accessed April 19, 2009)
Roslyn Kunin and Associates (2006). Gateway: A Means Not an End. http://www.rkunin.com/reports/gateway.doc (accessed April 19, 2009)
Canadian Tourism Research Institute, the Conference Board of Canada, and the Bristol Group (2008). The Future of Canada’s Tourism Future: Long on Prospects … Short on People. http://cthrc.ca/~/media/Files/CTHRC/Home/research_publications/labour_market_information/sd-supply-demand-report-en.ashx (accessed April 19, 2009)
British Columbia Chamber of Commerce (2008). Closing BC Skills Gap 2008: the Economic Imperative of Addressing Skills Shortages and Wastage in British Columbia. http://www.go2hr.ca/Portals/0/reports/Closing-the-Skills-Gap-II.pdf (accessed April 19, 2009)
Thompson-Okanagan Tourism Labour Market Study Final Report May 29, 2009
57
Roslyn Kunin and Associates, Inc.
Emery, Ruth (2007). Tourism Labour Market Analysis for the Kootenay Rockies Region. http://www.go2hr.ca/Portals/0/reports/KootenayRockiesLMR.pdf (accessed April 19, 2009)
Emery, Ruth (2006). Tourism Labour Market Demand Analysis for the Sea-to-Sky Region. http://www.go2hr.ca/Portals/0/reports/FinalReportRuthEmeryStSLMAMay2006.pdf (accessed April 19, 2009)
go2 (2009). Foreign Workers Guide for Tourism Employers. Edition 2.5. http://www.go2hr.ca/Portals/0/foreignworkers/ForeignWorkerGuide-Edition2.5-Jan-2009.pdf (accessed April 19, 2009)
Thompson-Okanagan Tourism Labour Market Study Final Report May 29, 2009
58
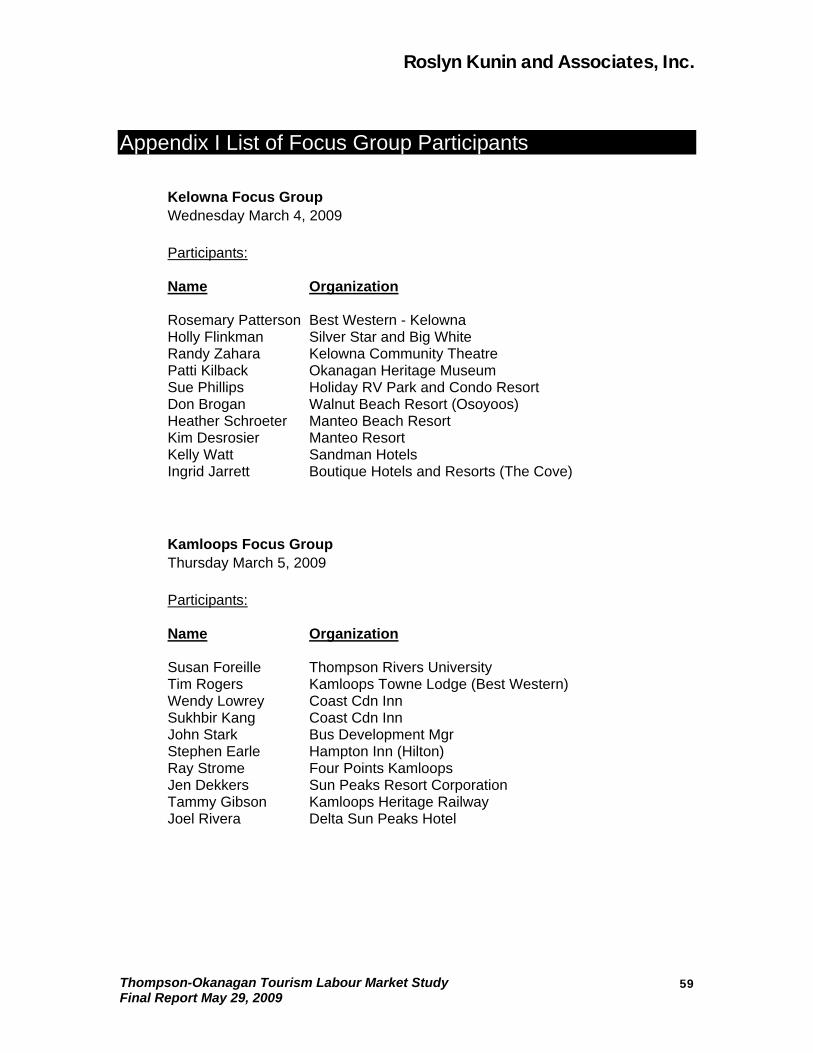
Roslyn Kunin and Associates, Inc.
Appendix I List of Focus Group Participants
Kelowna Focus Group Wednesday March 4, 2009 Participants: Name Organization Rosemary Patterson Best Western - Kelowna Holly Flinkman Silver Star and Big White Randy Zahara Kelowna Community Theatre Patti Kilback Okanagan Heritage Museum Sue Phillips Holiday RV Park and Condo Resort Don Brogan Walnut Beach Resort (Osoyoos) Heather Schroeter Manteo Beach Resort Kim Desrosier Manteo Resort Kelly Watt Sandman Hotels Ingrid Jarrett Boutique Hotels and Resorts (The Cove) Kamloops Focus Group Thursday March 5, 2009 Participants: Name Organization Susan Foreille Thompson Rivers University Tim Rogers Kamloops Towne Lodge (Best Western) Wendy Lowrey Coast Cdn Inn Sukhbir Kang Coast Cdn Inn John Stark Bus Development Mgr Stephen Earle Hampton Inn (Hilton) Ray Strome Four Points Kamloops Jen Dekkers Sun Peaks Resort Corporation Tammy Gibson Kamloops Heritage Railway Joel Rivera Delta Sun Peaks Hotel
Thompson-Okanagan Tourism Labour Market Study Final Report May 29, 2009
59

Roslyn Kunin and Associates, Inc.
Thompson-Okanagan Tourism Labour Market Study Final Report May 29, 2009
60
Appendix II Preliminary Employment Projections for Validation in Focus Group Sessions
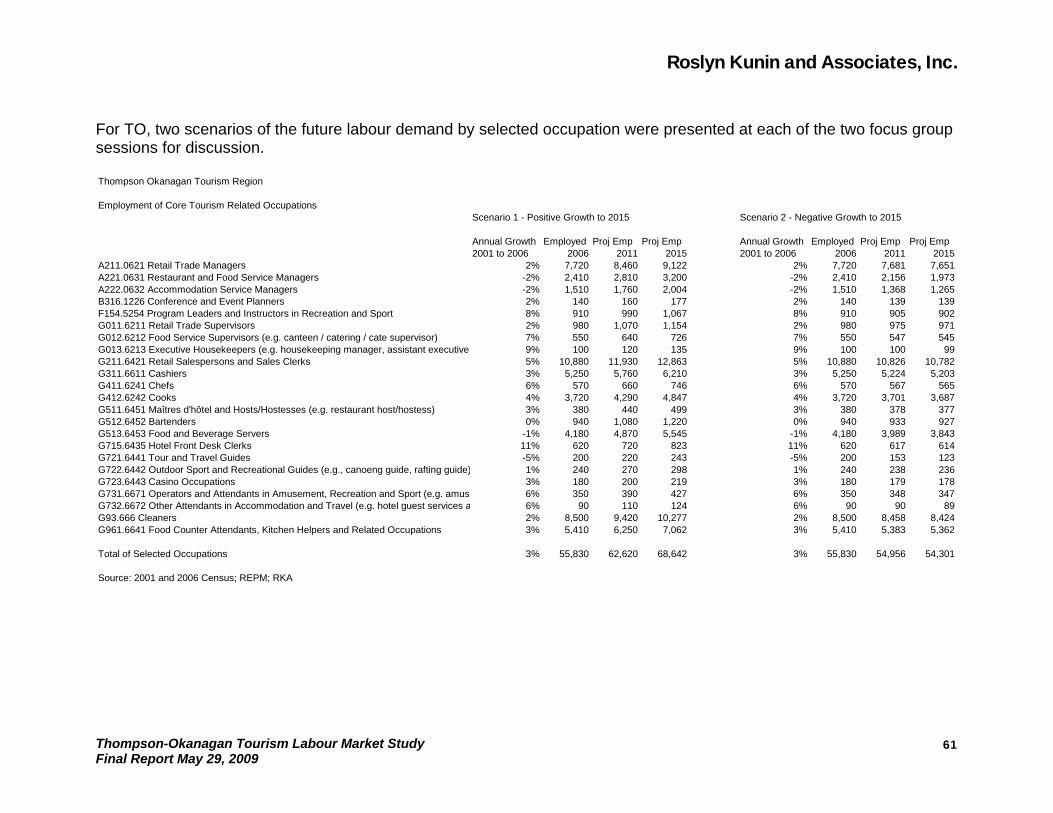
Roslyn Kunin and Associates, Inc.
For TO, two scenarios of the future labour demand by selected occupation were presented at each of the two focus group sessions for discussion. Thompson Okanagan Tourism Region
Employment of Core Tourism Related OccupationsScenario 1 - Positive Growth to 2015 Scenario 2 - Negative Growth to 2015
Annual Growth Employed Proj Emp Proj Emp Annual Growth Employed Proj Emp Proj Emp2001 to 2006 2006 2011 2015 2001 to 2006 2006 2011 2015
A211.0621 Retail Trade Managers 2% 7,720 8,460 9,122 2% 7,720 7,681 7,651A221.0631 Restaurant and Food Service Managers -2% 2,410 2,810 3,200 -2% 2,410 2,156 1,973A222.0632 Accommodation Service Managers -2% 1,510 1,760 2,004 -2% 1,510 1,368 1,265B316.1226 Conference and Event Planners 2% 140 160 177 2% 140 139 139F154.5254 Program Leaders and Instructors in Recreation and Sport 8% 910 990 1,067 8% 910 905 902G011.6211 Retail Trade Supervisors 2% 980 1,070 1,154 2% 980 975 971G012.6212 Food Service Supervisors (e.g. canteen / catering / cate supervisor) 7% 550 640 726 7% 550 547 545G013.6213 Executive Housekeepers (e.g. housekeeping manager, assistant executive 9% 100 120 135 9% 100 100 99G211.6421 Retail Salespersons and Sales Clerks 5% 10,880 11,930 12,863 5% 10,880 10,826 10,782G311.6611 Cashiers 3% 5,250 5,760 6,210 3% 5,250 5,224 5,203G411.6241 Chefs 6% 570 660 746 6% 570 567 565G412.6242 Cooks 4% 3,720 4,290 4,847 4% 3,720 3,701 3,687G511.6451 Maîtres d'hôtel and Hosts/Hostesses (e.g. restaurant host/hostess) 3% 380 440 499 3% 380 378 377G512.6452 Bartenders 0% 940 1,080 1,220 0% 940 933 927G513.6453 Food and Beverage Servers -1% 4,180 4,870 5,545 -1% 4,180 3,989 3,843G715.6435 Hotel Front Desk Clerks 11% 620 720 823 11% 620 617 614G721.6441 Tour and Travel Guides -5% 200 220 243 -5% 200 153 123G722.6442 Outdoor Sport and Recreational Guides (e.g., canoeng guide, rafting guide) 1% 240 270 298 1% 240 238 236G723.6443 Casino Occupations 3% 180 200 219 3% 180 179 178G731.6671 Operators and Attendants in Amusement, Recreation and Sport (e.g. amus 6% 350 390 427 6% 350 348 347G732.6672 Other Attendants in Accommodation and Travel (e.g. hotel guest services a 6% 90 110 124 6% 90 90 89G93.666 Cleaners 2% 8,500 9,420 10,277 2% 8,500 8,458 8,424G961.6641 Food Counter Attendants, Kitchen Helpers and Related Occupations 3% 5,410 6,250 7,062 3% 5,410 5,383 5,362
Total of Selected Occupations 3% 55,830 62,620 68,642 3% 55,830 54,956 54,301
Source: 2001 and 2006 Census; REPM; RKA
Thompson-Okanagan Tourism Labour Market Study Final Report May 29, 2009
61
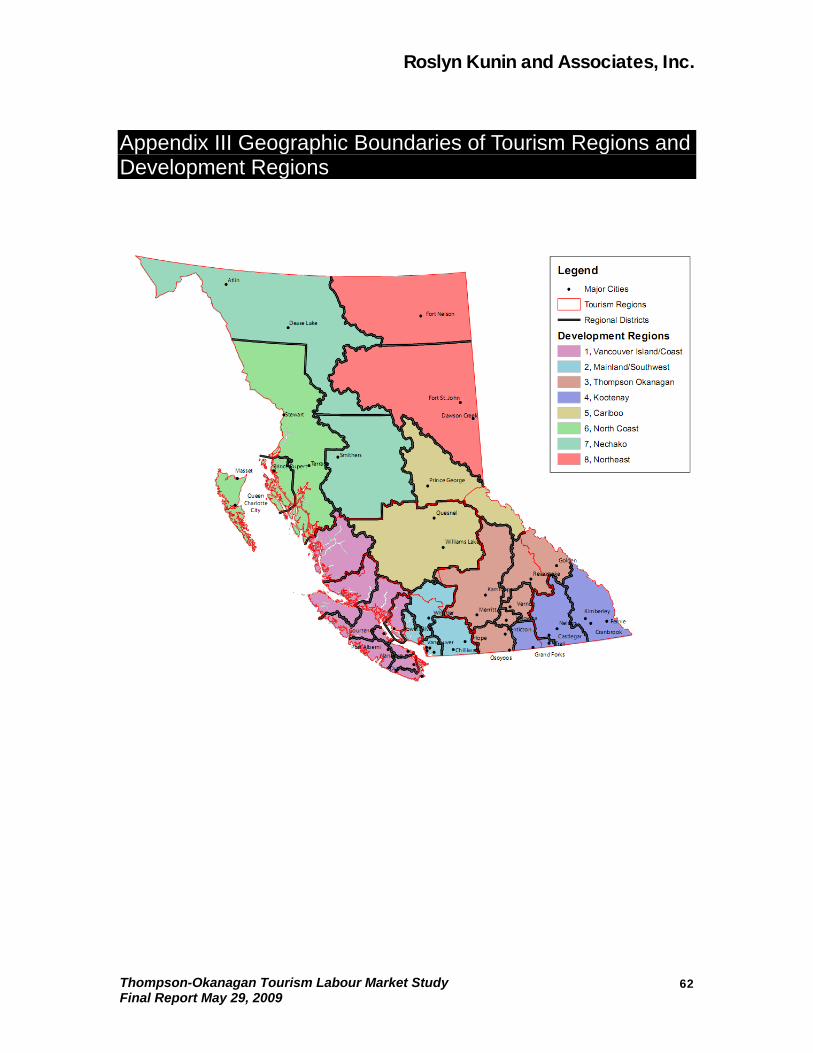
Roslyn Kunin and Associates, Inc.
Appendix III Geographic Boundaries of Tourism Regions and Development Regions
Thompson-Okanagan Tourism Labour Market Study Final Report May 29, 2009
62

Roslyn Kunin and Associates, Inc.
Appendix IV Techniques Applied to Derive Employment Estimates and Projections by Occupation
In Section 4 we estimated annual employment level in 2007 and 2008 for the core tourism occupations. We also provided projections for employment in these occupations from 2009 through 2015. Here is a description of the techniques applied to generate these estimates.
As year over year occupational data at a four-digit National Occupation Classification (NOC) level is not available, we have to rely on employment growth by industry in the region concerned to estimate employment growth with those occupations under analysis. We start from the notion that the most detailed occupational data by industry is available from the Census.
At the Development Region level, employment data available includes the following industry sub-sectors as defined by the North American Industry Classification System (NAICS):
- 111-112 Agriculture - 113-115, 21 Forestry, fishing, mining, oil and gas - 22 Utilities - 23 Construction - 31-33 Manufacturing - 41, 44-45 Trade - 48-49 Transportation and warehousing - 52-53 Finance, insurance, real estate and leasing - 54 Professional, scientific and technical services - 55-56 Business, building and other support services - 61 Educational services - 62 Health care and social assistance - 51, 71 Information, culture and recreation - 72 Accommodation and food services - 81 Other services - 91 Public administration
The first step in estimating employment growth in core tourism occupations is to calculate each occupation’s distribution by industry using 2006 Census data, based upon industry aggregation as shown in the list above. Then, based upon employment growth in these industries in the Thompson-Okanagan Development Region from 2006 to 2007 and from 2007 to 2008, we have been able to derive employment growth for each of the core tourism occupations.
Thompson-Okanagan Tourism Labour Market Study Final Report May 29, 2009
63
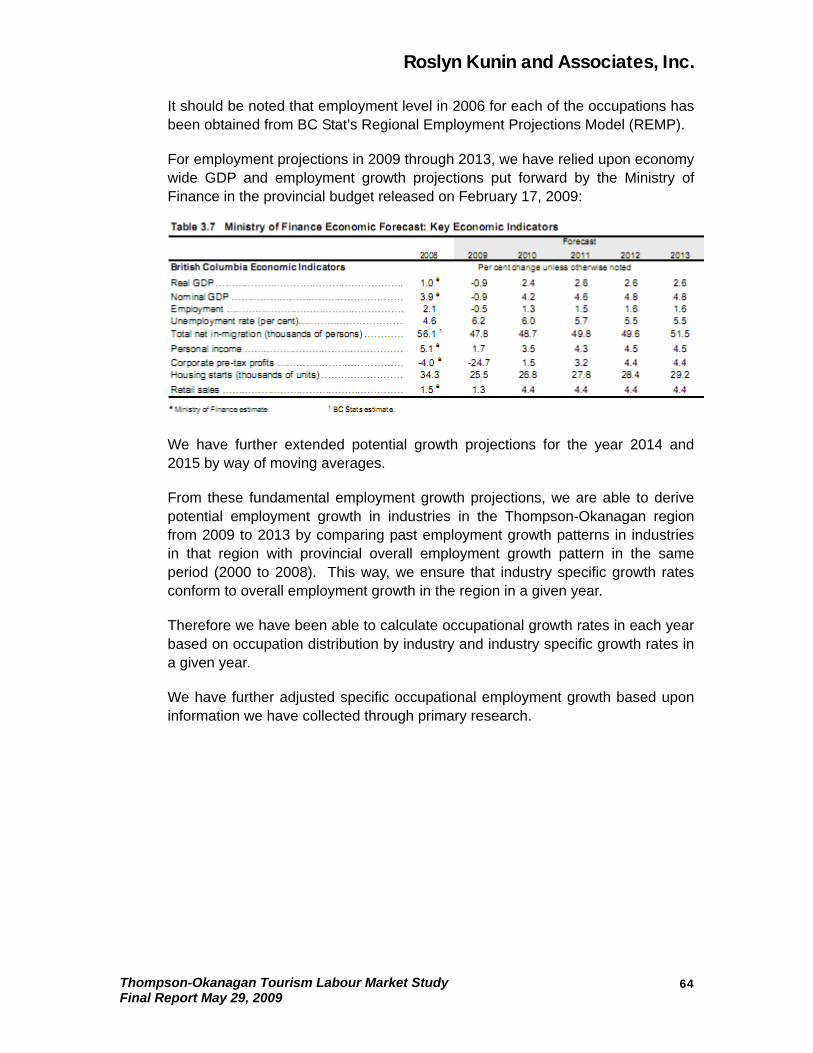
Roslyn Kunin and Associates, Inc.
Thompson-Okanagan Tourism Labour Market Study Final Report May 29, 2009
6
It should be noted that employment level in 2006 for each of the occupations has been obtained from BC Stat’s Regional Employment Projections Model (REMP).
For employment projections in 2009 through 2013, we have relied upon economy wide GDP and employment growth projections put forward by the Ministry of Finance in the provincial budget released on February 17, 2009:
We have further extended potential growth projections for the year 2014 and 2015 by way of moving averages.
From these fundamental employment growth projections, we are able to derive potential employment growth in industries in the Thompson-Okanagan region from 2009 to 2013 by comparing past employment growth patterns in industries in that region with provincial overall employment growth pattern in the same period (2000 to 2008). This way, we ensure that industry specific growth rates conform to overall employment growth in the region in a given year.
Therefore we have been able to calculate occupational growth rates in each year based on occupation distribution by industry and industry specific growth rates in a given year.
We have further adjusted specific occupational employment growth based upon information we have collected through primary research.
4