Thomas Plümper Professor of Quantitative Social Research
29
Empirical Social Research Thomas Plümper Professor of Quantitative Social Research
Transcript of Thomas Plümper Professor of Quantitative Social Research

Empirical Social Research
Thomas Plümper
Professor of Quantitative Social Research

Chapter 4.2. From Survey Research to Survey Experiments

Does traditional survey research generate reliable results?

Does traditional survey research generate reliable results? 40 years ago, quantitative research in the social sciences was dominated by survey research. One of the most bizarre assumptions of this line of research was (and still is) that survey responses provide measurements without error. For decades, the most discussed issue was non-response. (Probably because there are solutions to non respondence, but not really to systematic measurement error). Measurement error was ignored with the exception of interviewer effects (can be large) and intercoder-reliability (both problems can be controlled). But what is the most important, but largely ignored problem with survey data???

Consider the Likert-scale… Definition of Likert scales A survey scale represents a set of answer options—either numeric or verbal—that cover a range of opinions on a topic. It’s always part of a closed-ended question (a question that presents respondents with pre-populated answer choices). The Likert scale, which falls under our definition of a survey scale, is a 5 or 7-point scale that ranges from one extreme attitude to another, like “extremely likely” to “not at all likely.” Typically, they include a moderate or neutral midpoint.

Likert Scale Examples
Of course, more than 5 answer options are possible. Note that the number of option is usually odd to offer one ‘neutral’ answer.

2 Experiments Temperature: Please give the thresholds between the following office temperature response options. very cold cold neutral warm very warm
1st cut: 2nd cut: 3rd cut: 4th cut: Size: Please provide the thresholds between the following size for female adults options. very small small neutral tall very tall
1st cut: 2nd cut: 3rd cut: 4th cut: Note: you need to provide 4 numbers, for each threshold, each. Please include your answers into the ‘questions mail’.

Thresholds are Subjective and systematically influenced by covariates: - temperature depends on birth place - size depends on, well, individual size And so on.

List Experiments in the Social Sciences An Example (from students’ homework of last semester)

A Description of List Experiments Aims: - to give a relatively unbiased answer to questions that survey respondents do not usually like to answer - eliminate social desirability bias - reduce non-responses Strategy: - do not let participants answer questions they feel uncomfortable to answer - just let them answer how many claims from a list of statements they agree with Then give half of the participants (the control group) a list that excludes the claim you are interested in. And let the other half of participants (the treatment group) a list that in addition to the control group’s list also includes the statement that you are interested in.

Example 1: An African-American person becoming President of the United States. Redlawsk, D. P., Tolbert, C. J., and Franko, W. (2010). Voters, emotions, and race in 2008: Obama as the First black president. Political Research Quarterly63, 4, 875 – 889. Some people will vote for Barack Obama this fall and some people will not. Regardless of your overall feelings toward him, please indicate how many of the following five facts about Obama trouble you when you think about choosing the next president. I SHOULD ADD, TOO, THAT we are not interested in WHICH ONES trouble you, only HOW MANY. 1. During the primary campaign, he described small-town Pennsylvanians as bitter and said that they cling to guns and religion. 2. He has served in the US Senate only since 2005. 3. He used to be a smoker. 4. He was a member of Jeremiah Wrights Trinity United Church of Christ for 20 years, before he resigned in May of 2008. The treatment group received the above baseline with the above 4 items plus a fifth item: 5. If elected, he will be the first black president.

Randomization (hopefully) guarantees that the control group and the treatment group on average have the same view on items 1-4. The difference in means between the two groups can then be attributed to the response to item 5, the item that only the treatment group received. Note that it is also possible to compute the standard error of the difference in means.

Example 2: Rape in Civil Conflict in Sri Lanka Survey Q: The direct questions on sexual violence were part of an item battery capturing various direct war experiences. The introduction to the item battery read: “During the period of war, from 1983 to 2009, which of the following things did you personally directly experience, see or witness with your own eyes and ears, directed at you, your family, or community?” The answers to the items “You becoming sexually assaulted” and “Other persons being sexually assaulted” were coded 1 for “yes” and 0 for “no.”

The Share of Positive Responses in the Survey is 1.3 percent. But is that result correct or underreporting?

The List Experiment: i) Produce a List of Items including the Item you are interested in. ii) Delete the Item you are interested in from half of the questionnaires. iii) Randomize the Item Lists among participants iv) ask: how many items have you experienced/observed? Compare the mean of the answers with the item to the mean of the answers without the item of interest, and you know the sample share of positive answers.

The List Experiment Result Is 13.4 percent. suggesting severe underreporting in surveys (90 percent).


Why and When give List Experiments Roughly Accurate Answers?

List Experiments A list experiment is a questionnaire design technique used to mitigate respondent social desirability bias when eliciting information about sensitive topics. With a large enough sample size, list experiments can be used to estimate the proportion of people for whom a sensitive statement is true. A list experiment requires that you randomly divide the sample into two groups: the Direct Response Group and the Veiled Response Group. List experiments present respondents with a list of items, experiences, or statements . Respondents must then report how many items in the list pertain to them. In a list experiment, the sample is randomly divided into two groups: the Direct Response Group and the Veiled Response Group. While the Direct Response Group is presented with a list of neutral and non-sensitive items (length=N), the Veiled Response Group is presented with an identical list plus the sensitive item (length=N+1). With a large enough sample, researchers can estimate the proportion of people to whom the sensitive item pertains by subtracting the average response of the Direct Response Group from the average response of the Veiled Response Group. List experiments provide respondents with an additional level of privacy, as the researcher can never perfectly infer an individual’s answer to the sensitive item unless either 0 or N+1 items are true.

Example 3 Enumerator reads: “How many of the following statements are true for you?” Direct Response Group List: I remember where I was the day of the Challenger space shuttle disaster I spent a lot of time playing video games as a kid I would vote to legalize marijuana if there was a ballot question in my state I have voted for a political candidate who was pro-life Veiled Response Group List: I remember where I was the day of the Challenger space shuttle disaster I spent a lot of time playing video games as a kid I would vote to legalize marijuana if there was a ballot question in my state I have voted for a political candidate who was pro-life I consider myself to be heterosexual The above example comes from Coffman, Coffman, and Ericson 2016.

Example 4 Enumerator reads: “Now I am going to read you three things that sometimes make people angry or upset. After I read all, just tell me how many of them upset you. I don’t want to know which ones, just how many.” Direct Response Group List: The federal government increasing the tax on gasoline; Professional athletes earning large salaries; Requiring seat belts be used when driving; Large corporations polluting the environment Veiled Response Group A List: The federal government increasing the tax on gasoline; Professional athletes earning large salaries; Requiring seat belts be used when driving; Large corporations polluting the environment Black leaders asking the government for affirmative action

Veiled Response Group B List: The federal government increasing the tax on gasoline; Professional athletes earning large salaries; Requiring seat belts be used when driving; Large corporations polluting the environment Awarding college scholarships on the basis of race The above example comes from Gilens, Sniderman, and Kuklinski 1998.

Conjoint Experiments Hainmueller, J., Hangartner, D., & Yamamoto, T. (2015). Validating vignette and conjoint survey
experiments against real-world behavior. Proceedings of the National Academy of Sciences, 112(8), 2395-2400.
Hainmueller, J., & Hangartner, D. (2013). Who gets a Swiss passport? A natural experiment in immigrant
discrimination. American political science review, 107(1), 159-187. Bansak, K., Hainmueller, J., & Hangartner, D. (2016). How economic, humanitarian, and religious concerns
shape European attitudes toward asylum seekers. Science, 354(6309), 217-222.

Example 1: Bansak et al

How is it done? A Computer randomizes properties of two or more units in multiple dimensions, and participants have to select the ‘best’ candidate between a choice of 2 (sometimes 3) options. Relative probabilities can be estimated by a probit estimator. The more dimensions and the more characteristics in each dimension, the more participants and the more trials per participant are needed. Important: conjoint analyses compute relative probabilities. Nothing can be inferred about whether participants are in favour of or against immigration. This de facto makes immigration attitudes a 2-stage decision process: - which share of migrants do you wish to let in? - which ones of the applicants would you select given the share of migrants you let in. But we definitely learn about relative preferences in a sample of participants.

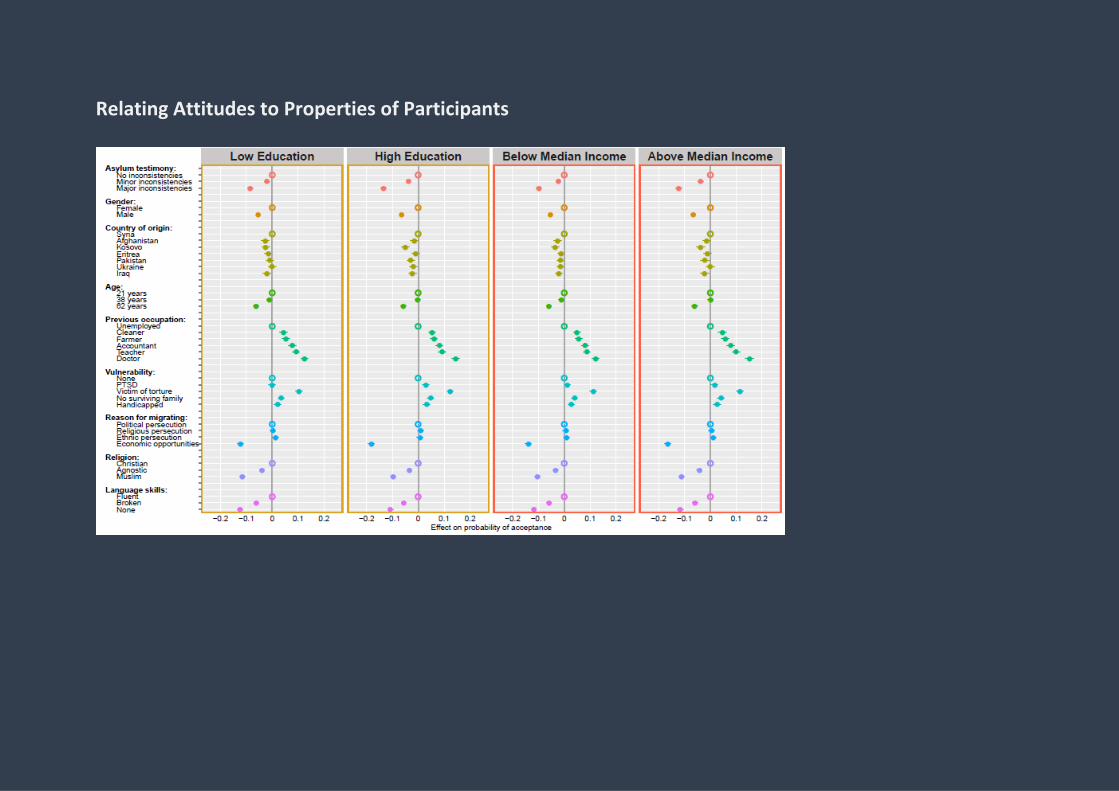
Relating Attitudes to Properties of Participants
Relating Attitudes to Properties of Participants

Conclusion

Survey Research Modern techniques for survey research partly alleviate the unreliability issue of survey research. List experiments provide respondents with a layer of anonymity that allows them to give more honest answers and to admit to socially undesirable answers. Conjoint analysis allows researchers to compute average relative probabilities in the sample. Neither technique identifies causal mechanisms. It remains rather unclear why relative probabilities exist since survey responses cannot be, at least not easily, related to properties of the survey respondents. Bansak et al. relate ‘attitudes’ to properties of the participants in a de facto bivariate regression model.