Thomas Key, EPRI Senior Technical Executive
22
© 2015 Electric Power Research Institute, Inc. All rights reserved. Thomas Key, EPRI Senior Technical Executive ISES Webinar April 22, 2016 An Integrated Grid Path for Solar
Transcript of Thomas Key, EPRI Senior Technical Executive
© 2015 Electric Power Research Institute, Inc. All rights reserved.
Thomas Key, EPRI
Senior Technical Executive
ISES Webinar
April 22, 2016
An Integrated Grid
Path for Solar

2
© 2015 Electric Power Research Institute, Inc. All rights reserved.
Changing Landscape: An Integrated Grid is a Better Grid
Combined Heat & Power
Demand Response
Energy
Management
Rooftop Solar
Electric
Vehicles
Energy Storage
Two Way
Power
3
© 2015 Electric Power Research Institute, Inc. All rights reserved.
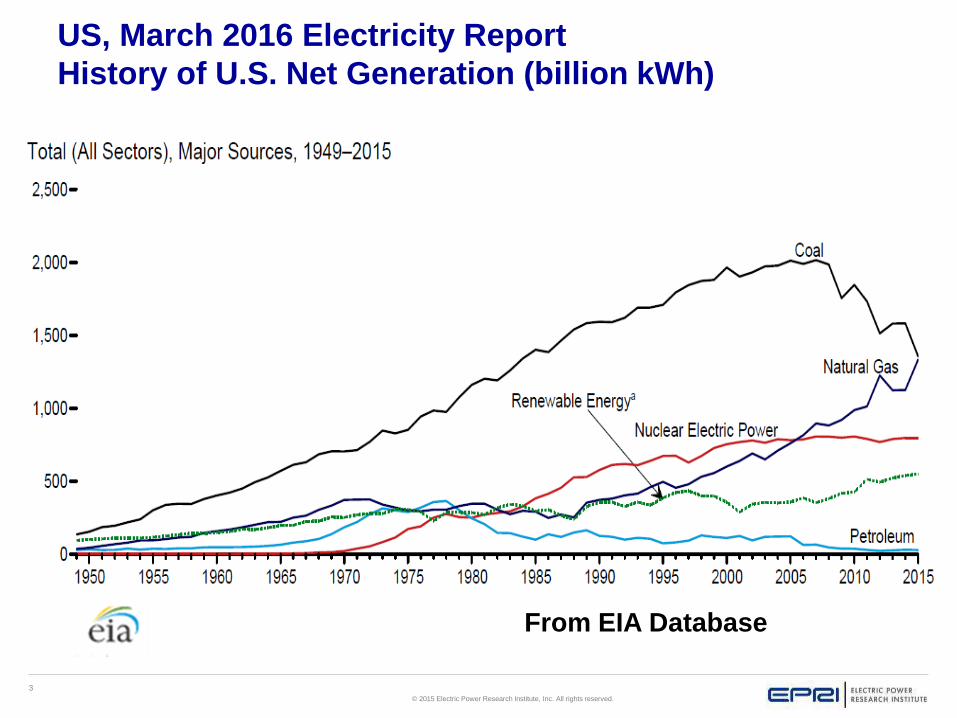
From EIA Database
US, March 2016 Electricity Report
History of U.S. Net Generation (billion kWh)

4
© 2015 Electric Power Research Institute, Inc. All rights reserved.
Noting History… PV Module Price Trajectory
$100
$1,000
$10,000
$100,000
0.00 0.01 0.10 1.00 10.00 100.00 1000.00
PV
Mo
du
le P
rice
Cumulative Sales, GWP
Source: SPV Market Strategies (adapted by EPRI)
This illustrates how the historical average module selling price has declined by
about 20% with each doubling of sales over several decades..
5
© 2015 Electric Power Research Institute, Inc. All rights reserved.
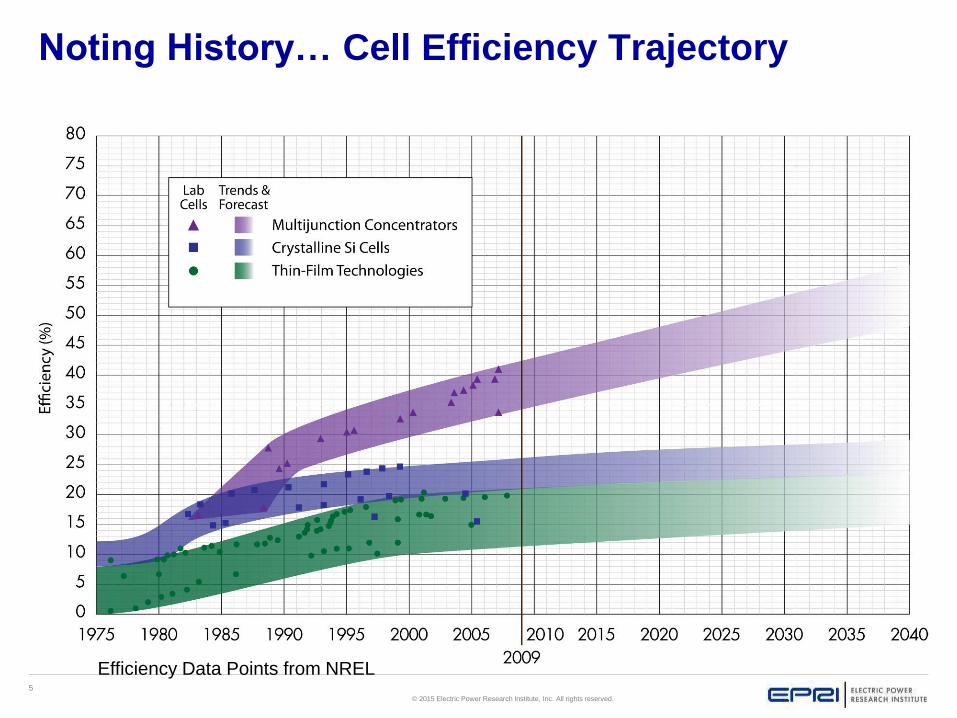
Noting History… Cell Efficiency Trajectory
Efficiency Data Points from NREL

6
© 2015 Electric Power Research Institute, Inc. All rights reserved.
Solar PV, a key driver of change
DOE “SunShot” Vision Study,
Released February 2012
Is the grid ready for PV?
US Future?
302 GW PV
by 2030
Germany Now – Power Demand
for one week in May 2015
60 GW
Export Import

7
© 2015 Electric Power Research Institute, Inc. All rights reserved.
US Solar compared to Germany Solar
Germany: >40 GW
U.S.: >25 GW in 2016
(Solar Resource Availability: NREL, PV Capacity Additions: SEPA)
Fastest growing generation technology, ~200 GW worldwide
U.S. total capacity ~25 GW at beginning of 2016

8
© 2015 Electric Power Research Institute, Inc. All rights reserved.
Solar PV Radiation at Latitude Tilt
Germany 2015 >40 GW, ~ 3.2 kWh/m2/day
U.S. 15 >20 GW, ~ 5 kWh/m2/day
(Solar Resource Availability: NREL, PV Capacity Additions: SEPA, total solar radiation latitude tilt)
Fastest growing of all renewable technologies
~180 GW installed worldwide, Germany leads with ~38 GW
U.S. total capacity ~18 GW at beginning of 2015
Solar PV the poster child of grid edge assets
Germany 2015 >40 GW, ~ 3.2 kWh/m2/day
U.S. 2015 >20 GW, ~ 5 kWh/m2/day
(Solar Resource Availability: NREL, PV Capacity Additions: SEPA, total solar radiation latitude tilt)
Fastest growing of all renewable technologies
~180 GW installed worldwide, Germany leads with ~38 GW
U.S. total capacity ~18 GW at beginning of 2015
9
© 2015 Electric Power Research Institute, Inc. All rights reserved.
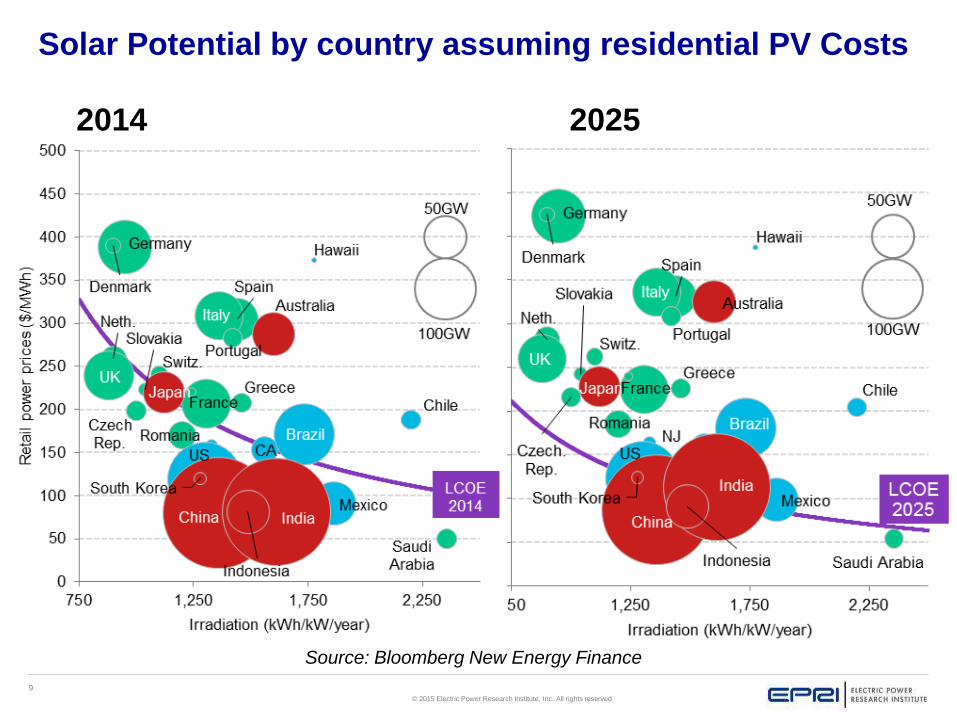
Solar Potential by country assuming residential PV Costs
Source: Bloomberg New Energy Finance
2014 2025

10
© 2015 Electric Power Research Institute, Inc. All rights reserved.
Interconnection Challenge: Solar output variability Calendar based on irradiance, 1-min averages at 30° fixed tilt, Knoxville
1 2 3 4 5
6 7 8 9 10 11 12
13 14 15 16 17 18 19
20 21 22 23 24 25 26
27 28 29 30
Tue Wed Thu Fri SatSun Mon
April 2014
11
© 2015 Electric Power Research Institute, Inc. All rights reserved.
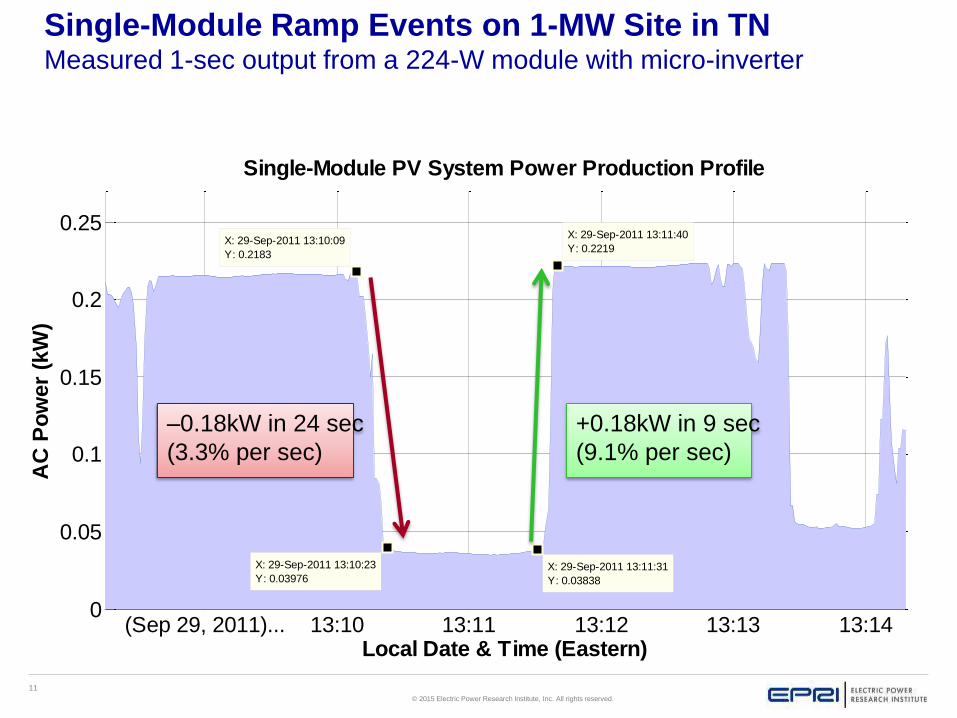
Single-Module Ramp Events on 1-MW Site in TNMeasured 1-sec output from a 224-W module with micro-inverter
(Sep 29, 2011)... 13:10 13:11 13:12 13:13 13:140
0.05
0.1
0.15
0.2
0.25
X: 29-Sep-2011 13:10:23
Y: 0.03976
AC
Po
wer
(kW
)
Single-Module PV System Power Production Profile
Local Date & Time (Eastern)
X: 29-Sep-2011 13:10:09
Y: 0.2183
X: 29-Sep-2011 13:11:31
Y: 0.03838
X: 29-Sep-2011 13:11:40
Y: 0.2219
–0.18kW in 24 sec
(3.3% per sec)
+0.18kW in 9 sec
(9.1% per sec)

12
© 2015 Electric Power Research Institute, Inc. All rights reserved.
PV variable output on distribution feeder Circuit map showing locations of pole-mount systems in Rome, GA
SubstationSubstation
© Google – Map data © Google
= DPV Site= DPV Site
0.0 mi.0.0 mi. 0.5 mi.0.5 mi. 1.0 mi.1.0 mi.
1 km2 grid
13
© 2015 Electric Power Research Institute, Inc. All rights reserved.
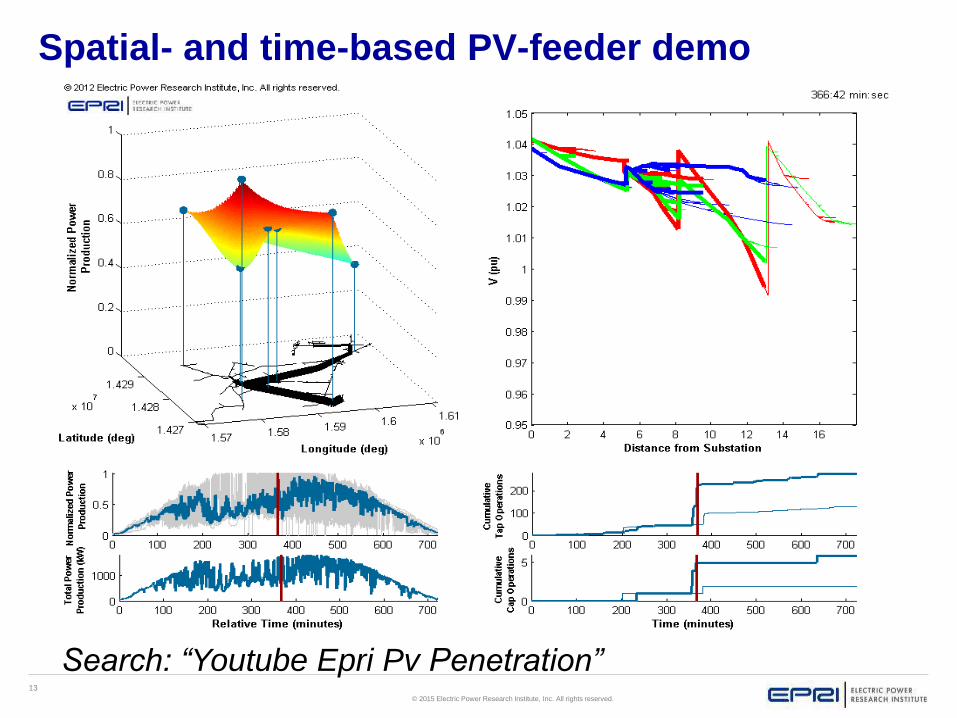
Spatial- and time-based PV-feeder demo
Search: “Youtube Epri Pv Penetration”
14
© 2015 Electric Power Research Institute, Inc. All rights reserved.
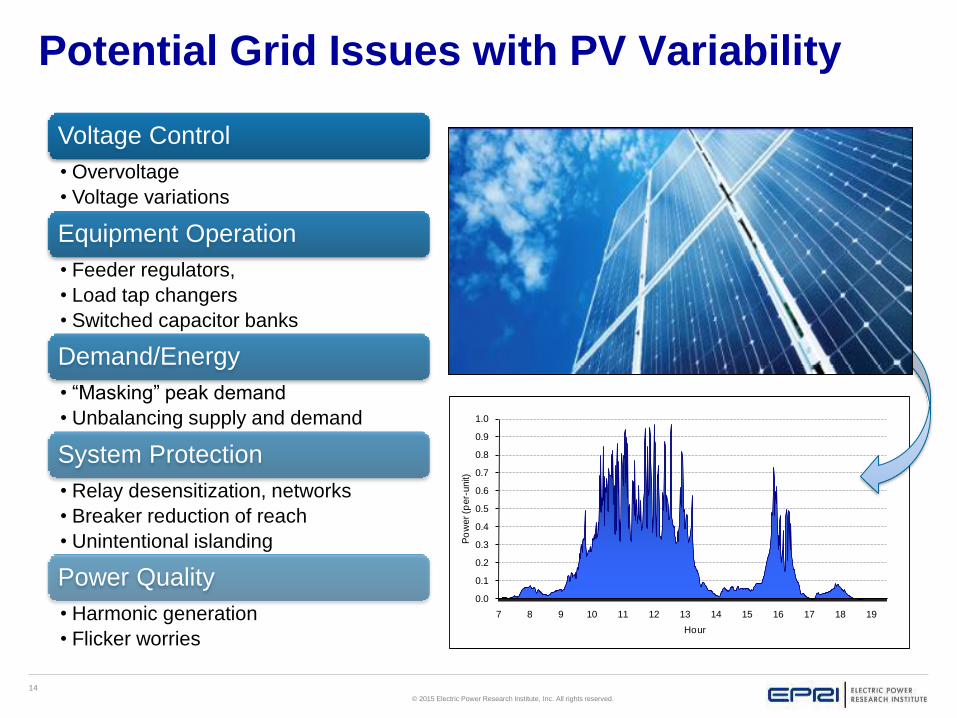
Potential Grid Issues with PV Variability
Voltage Control
• Overvoltage
• Voltage variations
Equipment Operation
• Feeder regulators,
• Load tap changers
• Switched capacitor banks
Demand/Energy
• “Masking” peak demand
• Unbalancing supply and demand
System Protection
• Relay desensitization, networks
• Breaker reduction of reach
• Unintentional islanding
Power Quality
• Harmonic generation
• Flicker worries
0.0
0.1
0.2
0.3
0.4
0.5
0.6
0.7
0.8
0.9
1.0
7 8 9 10 11 12 13 14 15 16 17 18 19
Po
wer (p
er-
unit)
Hour
15
© 2015 Electric Power Research Institute, Inc. All rights reserved.
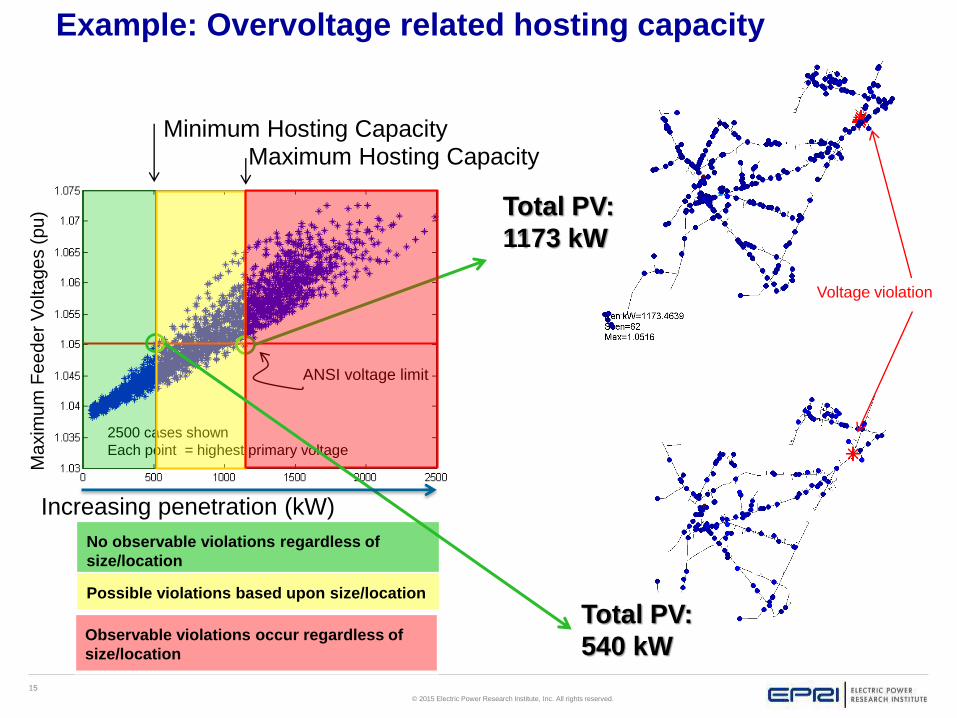
Example: Overvoltage related hosting capacity
2500 cases shown
Each point = highest primary voltage
ANSI voltage limit
Ma
xim
um
Fe
ed
er
Vo
lta
ge
s (
pu)
Increasing penetration (kW)
Minimum Hosting CapacityMaximum Hosting Capacity
Total PV:
540 kW
Total PV:
1173 kW
Voltage violation
No observable violations regardless of
size/location
Possible violations based upon size/location
Observable violations occur regardless of
size/location
16
© 2015 Electric Power Research Institute, Inc. All rights reserved.
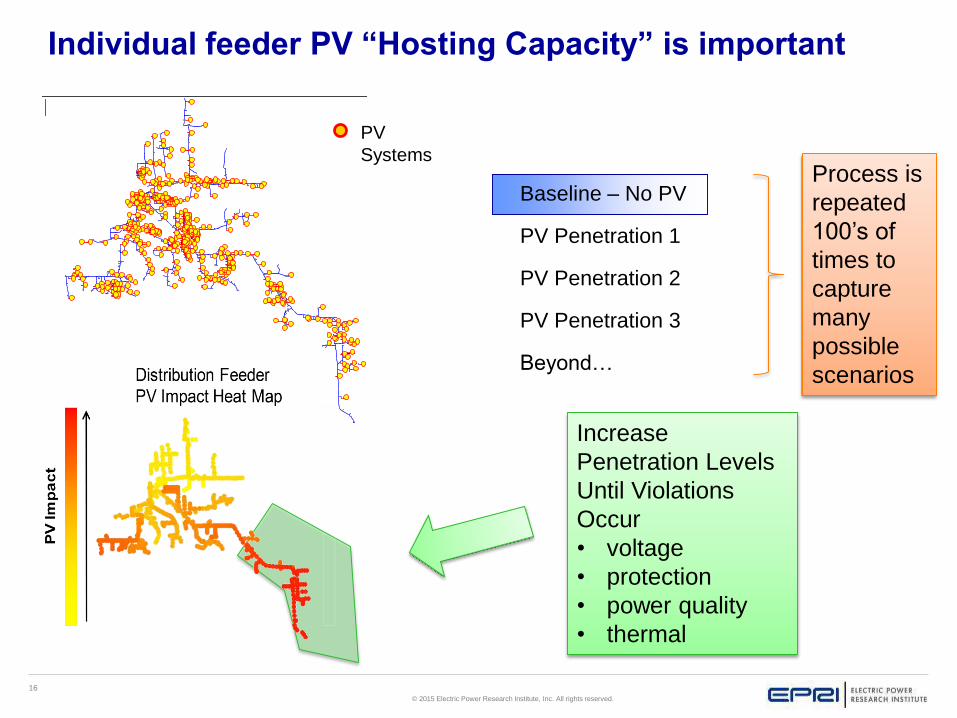
Individual feeder PV “Hosting Capacity” is important
Baseline – No PV
PV Penetration 1
PV Penetration 2
PV Penetration 3
Beyond…
Increase
Penetration Levels
Until Violations
Occur
• voltage
• protection
• power quality
• thermal
PV
SystemsProcess is
repeated
100’s of
times to
capture
many
possible
scenarios

17
© 2015 Electric Power Research Institute, Inc. All rights reserved.
Substation Marker
*hosting capacity
*Initial analysis results from TVA/EPB study, results not
finalized
Mapping Feeder Hosting Sample Chattanooga, TN, USA
System Hosting Capacity(~ 300 distribution feeders)
Substation-level
Hosting Capacity
Feeder-level
Hosting Capacity
18
© 2015 Electric Power Research Institute, Inc. All rights reserved.
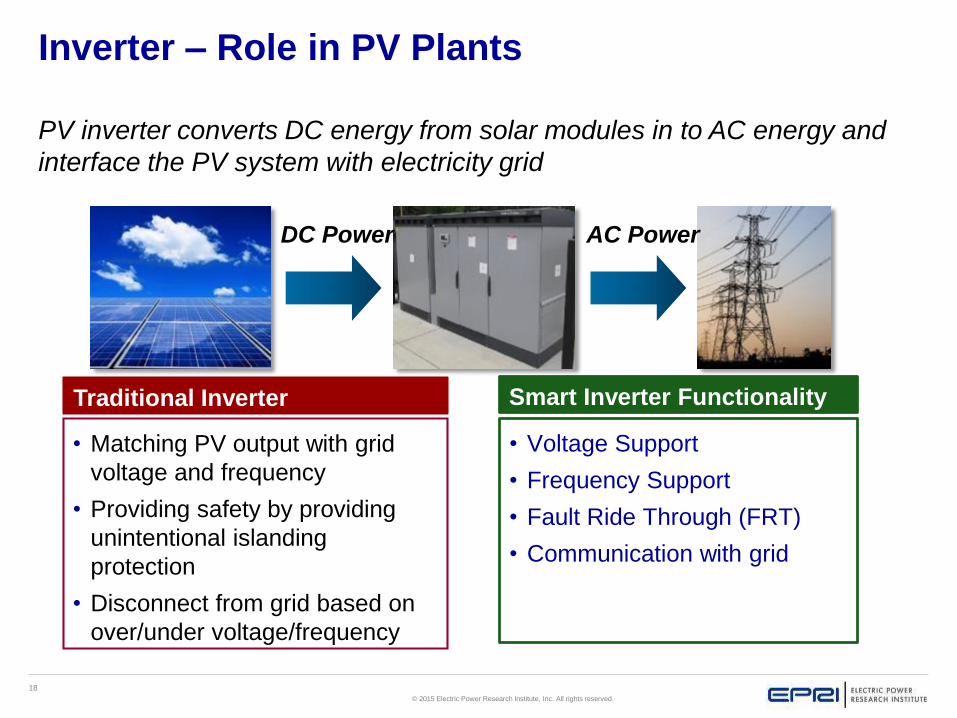
Inverter – Role in PV Plants
PV inverter converts DC energy from solar modules in to AC energy and
interface the PV system with electricity grid
DC Power AC Power
Traditional Inverter
Functionality
Smart Inverter Functionality
• Matching PV output with grid
voltage and frequency
• Providing safety by providing
unintentional islanding
protection
• Disconnect from grid based on
over/under voltage/frequency
• Voltage Support
• Frequency Support
• Fault Ride Through (FRT)
• Communication with grid

19
© 2015 Electric Power Research Institute, Inc. All rights reserved.
Planning with DER - Mitigation
Primary Voltage
0.9
0.925
0.95
0.975
1
1.025
1.05
0 4 8 12 16 20
Hour
Volta
ge
(p
u)
Baseline – No PV
20% PV20% PV with
smart inverter
24 Hour Simulation
• Often least-cost solution
• Increased hosting capacity
Improved
Integration with
Smart Inverters
Analytics
• Screening
• Hosting Capacity
• Reliability
• DER/Grid Modeling
Tools
• Advancing commercial tools
• Open-source (OpenDSS)
Mitigation
• Smart inverters
• Grid-side enhancements
Training
• Engineering Guidelines
• Planning with DG
20
© 2015 Electric Power Research Institute, Inc. All rights reserved.
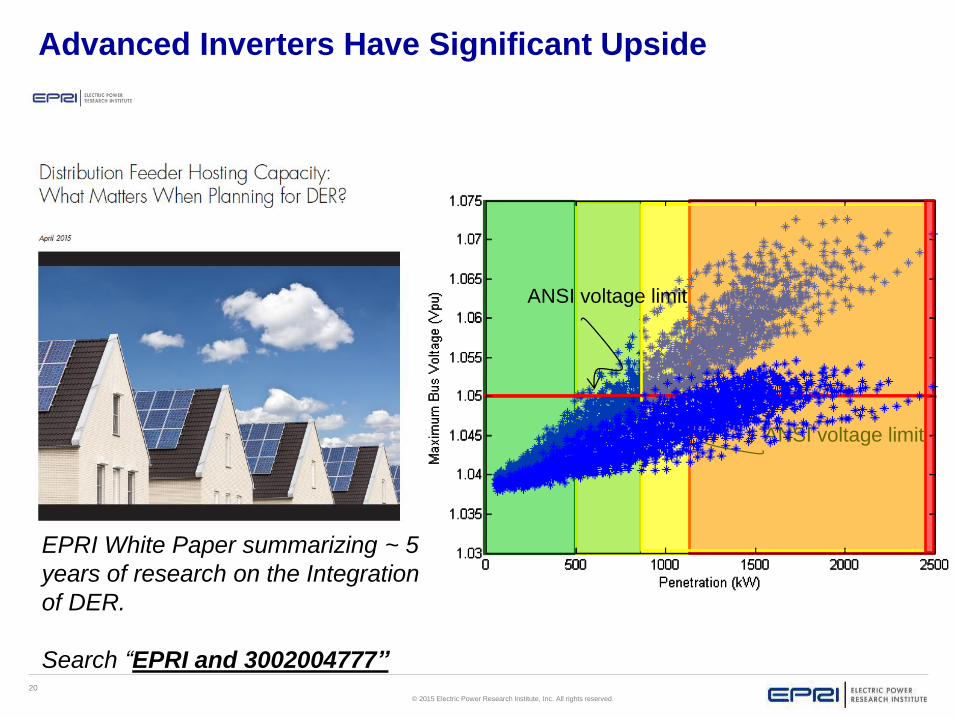
Advanced Inverters Have Significant Upside
ANSI voltage limit
ANSI voltage limit
EPRI White Paper summarizing ~ 5
years of research on the Integration
of DER.
Search “EPRI and 3002004777”
21
© 2015 Electric Power Research Institute, Inc. All rights reserved.
Conclusions: Key Takeaways
Variable PV works better with the grid
We need to leverage our existing grid,
cultivate “hosting capacity”
Grid upgrades and reinforcements
increase hosting, see PVGrid
Future DG to provide grid support
with Smart Inverters
An integrated grid approach will help
to transform the power system
Transforming the Power System will be a Journey not a Destination
IntegratedThe Whole is Greater
than the Sum of its
Parts

22
© 2015 Electric Power Research Institute, Inc. All rights reserved.
Questions?
Tom Key, [email protected]
www.epri.com
Together...Shaping the Future
of Electricity
The Integrated Grid Online Community
http://integratedgrid.epri.com