Thomas J. Curry Jennifer J. Johnson 250 E Street, S.W ...
62
October 22, 2012 Thomas J. Curry Comptroller of the Currency Office of the Comptroller of the Currency 250 E Street, S.W. Mail Stop 2-3 Washington, DC 20219 Robert E. Feldman Executive Secretary Attention: Comments/Legal ESS Federal Deposit Insurance Corporation 550 17th Street, N.W. Washington, D.C. 20429 Jennifer J. Johnson Secretary Board of Governors of the Federal Reserve System 20 th Street and Constitution Avenue, NW Washington, DC 20551 Re: Docket No. OCC-2012-0008 RIN 1557-AD46, Docket No. R [XX] RIN [XX], FDIC RIN 3064-AD95: Regulatory Capital Rules: Regulatory Capital, Implementation of Basel III, Minimum Regulatory Capital Ratios, Capital Adequacy, Transition Provisions, and Prompt Corrective Action Re: Docket No. OCC-2012-0009 RIN 1557-AD46, Docket No. R [XX] RIN [XX], FDIC RIN 3064-AD96: Regulatory Capital Rules: Standardized Approach for Risk-weighted Assets; Market Discipline, and Disclosure Requirements Re: Docket No. OCC-2012-0010 RIN 1557-AD46, Docket No. R-[XX] RIN [XX], FDIC RIN 3064-D97: Regulatory Capital Rules: Advanced Approaches Risk-based Capital Rule; Market Risk Capital Rule Dear Sirs and Madam, We write on behalf of the National Association of Insurance Commissioners (NAIC) regarding the Federal Reserve, Office of the Comptroller of the Currency, and Federal Deposit Insurance Corporation’s joint notice and proposed collective rulemakings on capital rules. Founded in 1871, the NAIC is the U.S. standard-setting and regulatory support organization created and governed by the chief insurance regulators from the 50 states, the District of Columbia and the five U.S. territories. Through the NAIC, state insurance regulators establish standards and best practices, conduct peer reviews, and coordinate their regulatory oversight. NAIC members, together with the central resources of the NAIC, form the national system of state-based insurance regulation in the U.S. The NAIC respectfully submits the following comments to the Notices of Proposed Rulemaking (NPR) and Request for Comment published in the June 7, 2012 issue of the Federal Register.
Transcript of Thomas J. Curry Jennifer J. Johnson 250 E Street, S.W ...

October 22, 2012
Thomas J. Curry
Comptroller of the Currency
Office of the Comptroller of the Currency
250 E Street, S.W.
Mail Stop 2-3
Washington, DC 20219
Robert E. Feldman
Executive Secretary
Attention: Comments/Legal ESS
Federal Deposit Insurance Corporation
550 17th Street, N.W.
Washington, D.C. 20429
Jennifer J. Johnson
Secretary
Board of Governors of the Federal Reserve
System
20th
Street and Constitution Avenue, NW
Washington, DC 20551
Re: Docket No. OCC-2012-0008 RIN 1557-AD46, Docket No. R [XX] RIN [XX], FDIC RIN
3064-AD95: Regulatory Capital Rules: Regulatory Capital, Implementation of Basel III,
Minimum Regulatory Capital Ratios, Capital Adequacy, Transition Provisions, and Prompt
Corrective Action
Re: Docket No. OCC-2012-0009 RIN 1557-AD46, Docket No. R [XX] RIN [XX], FDIC RIN
3064-AD96: Regulatory Capital Rules: Standardized Approach for Risk-weighted Assets;
Market Discipline, and Disclosure Requirements
Re: Docket No. OCC-2012-0010 RIN 1557-AD46, Docket No. R-[XX] RIN [XX], FDIC RIN
3064-D97: Regulatory Capital Rules: Advanced Approaches Risk-based Capital Rule; Market
Risk Capital Rule
Dear Sirs and Madam,
We write on behalf of the National Association of Insurance Commissioners (NAIC) regarding the
Federal Reserve, Office of the Comptroller of the Currency, and Federal Deposit Insurance
Corporation’s joint notice and proposed collective rulemakings on capital rules. Founded in 1871, the
NAIC is the U.S. standard-setting and regulatory support organization created and governed by the chief
insurance regulators from the 50 states, the District of Columbia and the five U.S. territories. Through
the NAIC, state insurance regulators establish standards and best practices, conduct peer reviews, and
coordinate their regulatory oversight. NAIC members, together with the central resources of the NAIC,
form the national system of state-based insurance regulation in the U.S. The NAIC respectfully submits
the following comments to the Notices of Proposed Rulemaking (NPR) and Request for Comment
published in the June 7, 2012 issue of the Federal Register.

2
For purposes of this comment letter, we have focused on responding to your specific questions regarding
separate accounts, the general treatment of insurance underwriting, surplus notes, and policy loans. In
addition, we offer comparison information on the substantive differences between generally accepted
accounting principles (GAAP) and statutory accounting principles (SAP) that might be useful in better
understanding the relative conservative nature of SAP and risk-based capital (RBC). We hope these
comments and the appended information will be helpful as further consideration is given to more
suitable standards for insurance enterprises with thrifts and banking entities. Our technical experts stand
ready to answer additional questions in person or by telephone.
Separate Accounts
Question 20: The agencies request comment on how the proposed definition of a separate account
interacts with state law. What are the significant differences and what is the nature of the
implications of these differences?
The definition provided by the NPR is based on the U.S. GAAP guidance contained in Statement of
Position (SOP) 03-1.1 These requirements for separate account allocation were rejected for statutory
accounting in Statement of Statutory Accounting Principles (SSAP) No. 56 as they may conflict with
existing state laws that address separate accounts. State laws regarding separate accounts are generally
broader, and based in part upon the NAIC’s Variable Contract Law.2 Consequently, the NPR’s
definition may conflict with state law since the NPR’s limitations are not required under state law.
However, it may be helpful to note that the NAIC Annual Statement, filed by insurers in all U.S.
jurisdictions, requires disclosure of the elements of the GAAP separate account requirements – including
a disclosure on whether each product would qualify for separate account treatment under GAAP.
Insurance Underwriting
Question 21: The agencies solicit comment on all aspects of the proposed treatment of insurance
underwriting activities.
In considering the appropriateness of using RBC for savings and loan holding companies, we encourage
the Board to become more familiar with the risks included in the RBC formulas – a separate formula for
filers of the life statement, property/casualty statement and health statement. RBC is indeed calculated
from statutory accounting numbers at the legal entity level and not consolidated group numbers, and it is
a tool used in the solvency oversight performed by state insurance regulators. However, the risks
included within the RBC formula include credit, interest rate and market risks as appropriate for the full
list of invested assets owned by the insurer. This includes risk charges for investments held in
subsidiary, controlled and affiliated entities, and the RBC risk charge for investments in other insurers is
based on the subsidiary’s own RBC requirement. Thus, any consideration of using amounts from RBC
must recognize this to avoid duplication of amounts. RBC formulas also account for significant
insurance underwriting risks – inadequate pricing of premiums and insufficient reserving for claims.
To consider a group of insurers, each legal insurance entity’s individual RBC requirement would be
aggregated. This does not recognize diversification benefits included in other group capital calculations.
State insurance regulators find this appropriate since capital is there to absorb unexpected results and
times of financial distress; when a group is troubled, such diversification benefits more likely turn into
contagion impacts.
1 This is currently reflected in the FASB Codification at 944-80-25-2.
2 NAIC Model # 260.

3
The Company Action Level RBC, which is twice the amount of Authorized Control Level RBC, is
neither an economic nor a regulatory target; in fact, it is not a target capital level of any sort. Rather, the
Company Action Level RBC is the amount of Total Adjusted Capital (and surplus) at which regulatory
action has been triggered per state statute. Thus, holding one dollar above Company Action Level RBC
is not an appropriate strategy for a legal entity insurer. Said another way, a state insurance regulator
would not approve a legal entity insurer transferring assets to the holding company that would leave it
with a minimum level of capital and surplus that just barely covered Company Action Level RBC
(regulatory approvals are required for dividends above a certain percentage of surplus). State insurance
regulators monitor each legal entity insurer’s financial position and results on an ongoing basis, and
require the company to address issues identified well before they become a concern from a capital and
surplus perspective.
Capital Instruments
Question 22: What are the specific terms and features of capital instruments (including surplus
notes) unique to insurance companies that diverge from current eligibility requirements under the
proposal? Are there ways in which such terms and features might be modified in order to bring the
instruments into compliance with the proposal?
SSAP No. 41 provides the basic terms that are required for Surplus Notes. Specifically, SSAP No. 41
provides that such instruments shall be reported as surplus and not debt only if the surplus note contains
the below provisions. Such provisions help to prevent payment on the note of an insurer in a weakly
capitalized position.
a. Subordination to policyholders;
b. Subordination to claimant and beneficiary claims;
c. Subordination to all other classes of creditors other than surplus note holders; and
d. Interest payments and principal repayments require prior approval of the commissioner of the
state of domicile.
It is also worth noting that insurers typically have different liquidity needs and rely more on unassigned
funds (i.e. retained earnings) than other financial institutions and, therefore, have less of a need to issue
capital instruments.
Question 23: The agencies seek data on the amount and issuers of surplus notes currently
outstanding. What proportion of insurance company capital is comprised of surplus notes?
The total amount of surplus notes is $51,536,392,299, and is located within 530 insurers out of a total of
4,584 insurers filing with the NAIC, or 11.5% of insurers.3 The total amount of $51,536,392,299 is
approximately 5.2% of the approximately $1 trillion in industry capital and surplus after eliminating
stacking.
Other Comments
We provide the following additional information with respect to policy loans and statutory accounting
versus generally accepted accounting principles.
Policy Loans
SSAP No. 49 defines a policy loan as a loan to a policyholder that is secured by the surrender value or
collateral assignment of the related policy or contract. The surrender value of the contract is earned by
3 Appendix A includes detail that shows the entities and amounts.

4
the insured over a period of time and can be withdrawn subject to certain provisions. One such provision
requires that the face amount of the policy to be reduced for any withdrawals, thus reducing the
obligations of the insurer. Another provision generally requires the policy to lapse if the unpaid balance
of the loan exceeds the cash surrender value. We submit this information to provide additional
explanation that we trust is helpful in evaluating the appropriateness of a 20% risk weight on this type of
asset.
SAP vs. GAAP
The objectives of GAAP reporting differ from the objectives of SAP. GAAP is designed to meet the
varying needs of the different users of financial statements. SAP is designed to address the concerns of
regulators, who are the primary users of statutory financial statements. As a result, GAAP stresses
measurement of emerging earnings of a business from period to period, (i.e., matching revenue to
expense), while SAP stresses measurement of ability to pay claims in the future. This difference is
illustrated by the fact that statutory policy reserves are intentionally established on a conservative basis
emphasizing the long-term nature of the liabilities. Under GAAP, the experience expected by each
company, with provision for the risk of adverse deviations, is used to determine the reserves it will
establish for its policies. GAAP reserves may be more or less than the statutory reserves.
Some other differences between SAP and GAAP have included:
GAAP has recognized certain assets which, for statutory purposes, have been either non-
admitted or immediately expensed. Policy acquisition costs are expensed as incurred under SAP
since the funds so expended are no longer available to pay future liabilities. Insurance company
financial statements prepared in accordance with GAAP defer costs incurred in the acquisition of
new business and amortize them over the premium recognition period.
Deferred income taxes are limited for recognition under SAP.
The methods of accounting for certain aspects of reinsurance under GAAP may have varied from
SAP, e.g., credit for reinsurance in unauthorized companies.
For additional information on SAP vs. GAAP accounting, please see Appendix B.
Conclusion
We are confident once a better understanding of the existing financial standards required of such
insurers is reached, more progress can be made toward developing a regulatory approach that captures
the complete risk profile of an insurance enterprise. Should you wish to discuss this comment or any
other matter relating to the NAIC’s views on this proposed rule, please do not hesitate to contact Ethan
Sonnichsen, Director of Government Relations, at (202) 471-3980 or Mark Sagat, Counsel and Manager
of Government Relations, at (202) 471-3987.
Sincerely,
Kevin M. McCarty Therese M. Vaughan, Ph.D.
Florida Commissioner of Insurance and NAIC Chief Executive Officer
NAIC President

Appendix A
2011 Surplus Notes(P/C, Life, Fraternal, Title, and Health)
Cocode Group Code Company Name Dom
Business
Type Surplus Notes Surplus % of PHS
14605 Mississippi Farm Bureau Mut Ins Co MS P $25,000,000 $475,426 5258.4%
74920 440 Regal Reins Co MA L $140,000,000 $5,725,424 2445.2%
22977 108 Lumbermens Mut Cas Co IL P $698,355,598 $31,131,758 2243.2%
12970 Touchstone Hlth HMO Inc NY X $50,073,772 $2,536,179 1974.4%
13215 4011 River Lake Ins Co SC L $1,100,000,000 $79,398,377 1385.4%
51187 4255 New Jersey Title Ins Co NJ T $4,000,000 $297,341 1345.3%
14931 497 Pawtucket Ins Co RI P $650,000 $103,705 626.8%
13073 Keystone Mut Ins Co MO P $756,350 $123,311 613.4%
13062 Olympia RRG Inc AZ P $275,000 $45,506 604.3%
13216 4011 River Lake Ins Co II SC L $850,000,000 $149,019,561 570.4%
10752 1282 Healthcare Safety & Protection RRG I SC P $12,000,000 $2,560,360 468.7%
18708 1248 Ambac Assur Corp WI P $2,000,000,000 $495,293,439 403.8%
20710 626 Century Ind Co PA P $100,000,000 $25,000,000 400.0%
13726 Simply Hlthcare Plans Inc FL X $14,559,808 $3,922,975 371.1%
10775 Physicians United Plan Inc FL X $18,050,000 $5,308,439 340.0%
20311 4676 Syncora Guar Inc NY P $625,000,000 $186,071,015 335.9%
95204 601 Kaiser Found Hlth Plan of OH OH X $94,000,000 $28,227,428 333.0%
13217 4011 River Lake Ins Co III SC L $750,000,000 $231,278,978 324.3%
12756 707 Medica Hlth Plans of FL Inc FL X $5,505,000 $1,749,651 314.6%
13628 Carilion Clinic Medicare Resources L VA X $29,000,000 $9,355,591 310.0%
12223 Santa Fe Auto Ins Co TX P $18,700,571 $6,725,015 278.1%
39675 Excalibur Reins Corp PA P $5,100,000 $1,935,283 263.5%
16667 12 United Guar Residential Ins Co of NC NC P $663,614,500 $257,838,844 257.4%
68071 4722 Puritan Life Ins Co TX L $15,262,500 $6,103,287 250.1%
16675 4011 Genworth Mortgage Ins Corp Of NC NC P $225,000,000 $100,788,712 223.2%
62065 233 Colonial Penn Life Ins Co PA L $160,000,000 $74,220,820 215.6%
32743 Alliance Mut Ins Co NC P $6,285,741 $2,973,898 211.4%
12279 Scan Hlth Plan AZ AZ X $50,000,000 $23,674,077 211.2%
96237 601 Kaiser Found Hlth Plan of GA Inc GA X $148,000,000 $70,396,061 210.2%
62650 598 Delta Life Ins Co GA L $5,000,000 $2,385,112 209.6%
1

Appendix A
2011 Surplus Notes(P/C, Life, Fraternal, Title, and Health)
13621 Star & Shield Ins Exch FL P $15,000,000 $7,186,677 208.7%
10739 176 State Farm FL Ins Co FL P $750,000,000 $368,125,709 203.7%
28452 150 Republic Mortgage Ins Co NC P $80,000,000 $40,595,583 197.1%
13219 4011 Rivermont Life Ins Co I SC L $315,000,000 $162,812,790 193.5%
13565 Arkansas Mut Ins Co AR P $5,394,750 $2,891,604 186.6%
12834 Trilogy Hlth Ins Inc WI L $3,750,000 $2,020,002 185.6%
13691 4685 Quality Hlth Plans of NY Inc NY X $11,567,000 $6,532,344 177.1%
28681 Union Mut Ins Co OK P $1,766,100 $1,010,330 174.8%
11454 3341 New Jersey Skylands Ins Assn NJ P $31,250,000 $18,190,908 171.8%
87718 Concert Hlth Plan Ins Co IL L $5,987,500 $3,525,386 169.8%
19544 111 Liberty Cnty Mut Ins Co TX P $10,000,000 $6,021,589 166.1%
13619 Sawgrass Mutual Ins Co FL P $14,500,000 $8,902,772 162.9%
13810 Physicians Benefit Resources RRG Inc NV P $665,418 $417,215 159.5%
13666 4676 Syncora Capital Assur Inc NY P $200,000,000 $132,680,535 150.7%
13179 ProAir RRG Inc NV P $775,000 $516,192 150.1%
82686 1323 Hawthorn Life Ins Co TX L $3,500,000 $2,338,165 149.7%
95722 First Medical Hlth Plan Inc PR X $20,738,860 $14,790,011 140.2%
26999 12 United Guar Mortgage Ind Co NC P $130,000,000 $93,284,914 139.4%
11091 Health Care Mut Captive Ins Co GA P $2,995,082 $2,184,729 137.1%
72087 343 Mutinational Life Ins Co PR L $5,000,000 $3,688,900 135.5%
68845 4764 Shenandoah Life Ins Co VA L $20,000,000 $15,624,942 128.0%
33030 Ins Co of The Americas FL P $10,449,557 $8,219,675 127.1%
54658 477 Delta Dental of NC NC X $15,000,000 $11,938,401 125.6%
10908 Capitol Preferred Ins Co FL P $17,350,000 $13,881,785 125.0%
95829 New W Hlth Serv MT X $24,530,841 $19,690,083 124.6%
11018 1324 Upmc Hlth Benefits Inc PA P $21,500,000 $17,683,468 121.6%
11443 Northern Plains Ins Co SD P $477,279 $401,737 118.8%
47027 4708 CDPHP Universal Benefits Inc NY X $48,500,000 $40,912,523 118.5%
54259 Sidney Hillman Hlth Centre IL X $200,000 $169,507 118.0%
13558 119 Arcadian Health Plan of NY Inc NY X $2,400,000 $2,063,246 116.3%
13589 31 MedPro RRG RRG DC P $3,250,000 $2,805,110 115.9%
68365 968 AXA Corp Solutions Life Reins Co DE L $320,000,000 $276,489,553 115.7%
2

Appendix A
2011 Surplus Notes(P/C, Life, Fraternal, Title, and Health)
11988 1129 Houston Gen Ins Exch TX P $23,706,417 $20,756,977 114.2%
10659 Diamond Ins Co IL P $7,000,000 $6,132,157 114.2%
31275 150 Republic Mortgage Ins Of NC NC P $75,000,000 $66,223,252 113.3%
73660 Directors Life Assur Co OK L $1,600,000 $1,414,469 113.1%
35424 150 Old Republic Security Assur Co AZ P $40,000,000 $35,530,719 112.6%
47012 Sightcare Inc AZ X $570,000 $507,664 112.3%
83640 671 Rightchoice Ins Co IL L $11,000,000 $10,024,835 109.7%
95232 1552 Medica Hlth Plans of WI WI X $3,250,000 $2,974,682 109.3%
11716 ARA Cas Ins Co FL P $1,000,000 $935,500 106.9%
31240 Commonwealth Mut Ins Co of Amer MD P $325,000 $307,672 105.6%
13012 Normandy Harbor Ins Co Inc FL P $6,200,000 $5,905,747 105.0%
13756 CMIC RRG DC P $3,250,000 $3,110,017 104.5%
14130 NCMIC RRG Inc VT P $2,000,000 $1,925,473 103.9%
13795 31 AttPro RRG Recip RRG DC P $1,500,000 $1,447,756 103.6%
11947 Lewis & Clark LTC RRG Inc NV P $3,700,000 $3,625,316 102.1%
10031 167 American Heartland Ins Co IL P $2,150,000 $2,120,905 101.4%
11028 311 Spring Valley Mut Ins Co MN P $4,000,000 $3,949,982 101.3%
27820 809 Farm Bureau Cnty Mut Ins Co of TX TX P $5,800,000 $5,800,000 100.0%
27863 3489 Southern Cnty Mut Ins Co TX P $30,000,000 $30,000,000 100.0%
29203 155 Progressive Cnty Mut Ins Co TX P $1,000,000 $1,000,000 100.0%
29394 660 Mercury Cnty Mut Ins Co TX P $4,000,000 $4,000,000 100.0%
47021 380 Carefirst Inc MD X $500,000 $500,000 100.0%
13705 UHAB Mut Ins Co NY P $2,000,000 $2,003,934 99.8%
14005 Artisan Contractors Ins Co RRG LLC MT P $500,000 $506,205 98.8%
29262 140 Colonial Cnty Mut Ins Co TX P $13,650,000 $13,847,002 98.6%
12985 First Medical Hlth Plan of FL Inc FL X $921,497 $938,110 98.2%
10231 586 Commonwealth Mut Ins Co MA P $5,500,000 $5,609,976 98.0%
16659 12 United Guar Comm Ins Co of NC NC P $45,000,000 $46,033,821 97.8%
13571 Select Providers Ins Recip Exch RRG DC P $500,000 $512,850 97.5%
12751 Maryland Care Medicare Inc MD X $1,500,000 $1,546,027 97.0%
25399 809 Texas Farm Bureau Underwriters TX P $19,000,000 $19,699,860 96.4%
12873 4664 Privilege Underwriters Recp Exch FL P $49,017,442 $51,444,148 95.3%
3

Appendix A
2011 Surplus Notes(P/C, Life, Fraternal, Title, and Health)
53252 936 Inter Cnty Hlth Plan Inc PA X $2,270,000 $2,396,897 94.7%
29408 3478 Hallmark Cnty Mut Ins Co TX P $5,200,000 $5,500,000 94.5%
33340 Wescap Ins Co CO P $5,552,386 $5,906,283 94.0%
29378 4762 Old Amer Cnty Mut Fire Ins Co TX P $4,700,000 $5,000,000 94.0%
11804 233 Conseco Life Ins Co of TX TX L $749,550,000 $799,060,125 93.8%
29351 215 Unitrin Cnty Mut Ins Co TX P $3,638,568 $3,938,573 92.4%
77194 1323 United Funeral Directors Benefit Lif TX L $4,100,000 $4,568,392 89.7%
13698 AGIC Inc FL P $4,500,000 $5,033,825 89.4%
12583 3703 Adirondack Ins Exch NY P $70,700,000 $81,455,160 86.8%
55239 1127 Group Hlth Inc NY X $125,311,381 $144,949,451 86.5%
29335 8 Allstate Cnty Mut Ins Co TX P $12,450,000 $14,446,716 86.2%
11260 Nevada Mut Ins Co Inc NV P $6,119,121 $7,122,875 85.9%
13763 1248 Ambac Assur Corp Segregate Account WI P $89,081,612 $105,899,246 84.1%
52006 Michigan Eyecare Assoc Inc MI X $205,000 $251,648 81.5%
12911 Carolina Crescent Hlth Plan Inc SC X $4,950,000 $6,205,368 79.8%
27944 111 National Ins Assn IN P $10,000,000 $12,678,886 78.9%
26530 8 Allstate TX Lloyds TX P $12,600,000 $16,566,611 76.1%
80802 549 US Br Sun Life Assur Co of Canada MI L $760,000,000 $1,017,587,580 74.7%
95216 1324 UPMC Hlth Plan Inc PA X $100,000,000 $134,091,894 74.6%
81396 2479 Delta Dental Ins Co DE L $45,750,000 $61,768,814 74.1%
42862 1326 Universal Cas Co IL P $6,500,000 $8,784,891 74.0%
29327 1318 AAA TX Cnty Mut Ins Co TX P $5,750,000 $7,914,282 72.7%
95764 UTMB Hlth Plans Inc TX X $5,094,258 $7,025,962 72.5%
10992 306 CMG Mortgage Reins Co WI P $10,000,000 $13,797,270 72.5%
91693 315 IA Amer Life Ins Co TX L $50,000,000 $70,013,668 71.4%
16373 3500 Battle Creek Mut Ins Co NE P $3,000,000 $4,232,721 70.9%
14136 Select MD RRG Inc MT P $700,000 $993,449 70.5%
10080 Health Providers Ins Recip RRG HI P $30,000,000 $43,533,810 68.9%
51209 250 Conestoga Title Ins Co PA T $8,900,000 $12,922,769 68.9%
11997 3569 Caterpillar Life Ins Co MO L $32,583,374 $47,744,936 68.2%
73814 Triple S Vida Inc PR L $37,000,000 $54,628,085 67.7%
43486 1226 Warranty Underwriters Ins Co TX P $4,000,000 $5,925,762 67.5%
4

Appendix A
2011 Surplus Notes(P/C, Life, Fraternal, Title, and Health)
14012 4717 Stonegate Ins Co IL P $1,800,000 $2,673,637 67.3%
13820 3495 Infinity Cnty Mut Ins Co TX P $3,400,000 $5,061,644 67.2%
41114 Atlantic Bonding Co MD P $6,948,028 $10,435,130 66.6%
13044 4755 Americas 1st Choice Ins Co of NC Inc NC L $5,020,817 $7,621,670 65.9%
13600 Black Diamond Ins Co Inc NV P $1,000,000 $1,527,885 65.4%
11809 Ponce De Leon LTC RRG Inc FL P $5,349,951 $8,193,746 65.3%
12213 Dental Practice Assn of NJ Inc NJ X $125,000 $191,999 65.1%
19950 291 Wilson Mut Ins Co WI P $13,000,000 $20,094,242 64.7%
13613 College RRG Inc VT P $2,500,000 $3,932,459 63.6%
12957 4686 Modern USA Ins Co FL P $6,279,412 $9,947,874 63.1%
12538 3484 Tower Hill Signature Ins Co FL P $23,529,412 $38,042,180 61.9%
95206 623 Health Net of AZ Inc AZ X $55,300,000 $89,531,569 61.8%
11994 1324 UPMC Hlth Ntwrk Inc PA L $64,000,000 $103,792,199 61.7%
12532 New Star RRG Inc SC P $2,500,000 $4,070,823 61.4%
37613 Farmers Union Mut Ins Co AR P $700,000 $1,142,590 61.3%
11132 2479 Delta Dental of DE Inc DE X $1,000,000 $1,632,885 61.2%
13893 Community Blood Cntr Exch RRG IN P $7,767,574 $12,687,788 61.2%
11263 United Business Ins Co GA P $673,016 $1,106,261 60.8%
40789 150 American Bus & Personal Ins Mut Inc DE P $15,500,000 $25,526,138 60.7%
12913 1 Missouri Care Inc MO X $12,251,101 $20,374,764 60.1%
74918 Kilpatrick Life Ins Co LA L $4,000,000 $6,696,539 59.7%
12041 528 MBIA Ins Corp NY P $952,655,000 $1,596,556,017 59.7%
16683 North Carolina Grange Mut Ins Co NC P $2,260,000 $3,802,824 59.4%
19720 361 American Alt Ins Corp DE P $92,500,000 $156,224,860 59.2%
29300 257 Oak Brook Cnty Mut Ins Co TX P $2,000,000 $3,394,530 58.9%
13067 Professionals RRG Inc MT P $750,000 $1,279,062 58.6%
12976 Catholic Special Needs Plan LLC NY X $4,000,000 $6,871,121 58.2%
54763 936 Inter Cty Hospitalization Plan Inc PA X $2,630,000 $4,534,132 58.0%
73121 526 Champions Life Ins Co TX L $2,298,085 $3,984,083 57.7%
13974 Virginia Physicians RRG Inc MT P $500,000 $871,143 57.4%
14486 111 Liberty Mut Mid Atlantic Ins Co MA P $9,500,000 $16,563,756 57.4%
43419 176 State Farm Lloyds TX P $525,272,727 $916,854,758 57.3%
5

Appendix A
2011 Surplus Notes(P/C, Life, Fraternal, Title, and Health)
37109 503 Landcar Cas Co UT P $9,800,000 $17,645,080 55.5%
12924 4380 UCare WI Inc WI X $3,000,000 $5,404,105 55.5%
29181 761 Firemans Fund Cnty Mut Ins Co TX P $1,586,378 $2,900,000 54.7%
88340 517 Hannover Life Reassur Co of Amer FL L $94,045,538 $172,763,560 54.4%
43982 415 MT WA Assur Corp NH P $1,700,000 $3,147,467 54.0%
14532 50 Middlesex Mut Assur Co CT P $50,000,000 $96,989,771 51.6%
95192 Group Hlth Coop of Eau Claire WI X $6,000,000 $11,716,123 51.2%
11699 4597 Essence Hlthcare Inc MO X $26,875,315 $53,150,756 50.6%
12577 4091 Universal Hlth Care Ins Co Inc FL L $18,250,000 $36,579,328 49.9%
68322 769 Great W Life & Ann Ins Co CO L $527,762,324 $1,062,420,380 49.7%
21709 212 Truck Ins Exch CA P $275,000,000 $554,496,411 49.6%
21652 212 Farmers Ins Exch CA P $1,881,805,000 $3,820,221,342 49.3%
10078 200 USAA Cnty Mut Ins Co TX P $2,500,000 $5,095,725 49.1%
32085 175 Litchfield Mut Fire Ins Co CT P $2,100,000 $4,299,463 48.8%
29823 4011 Genworth Residential Mortgage Ins Co NC P $50,000,000 $104,748,857 47.7%
11968 Pennsylvania Physicians Recip Insur PA P $2,500,000 $5,245,663 47.7%
21563 220 Oklahoma Farm Bureau Mut Ins Co OK P $40,550,789 $85,716,492 47.3%
16212 316 Omega One Ins Co AL P $3,500,000 $7,437,496 47.1%
34487 831 Professional Underwriters Liab Ins C UT P $20,000,000 $43,277,913 46.2%
87882 Associated Mut MI L $4,322,000 $9,409,664 45.9%
12594 JM Woodworth RRG Inc NV P $1,950,000 $4,254,219 45.8%
11536 Community Hlth Alliance Recip RRG VT P $6,750,000 $14,826,850 45.5%
10783 Cornerstone Natl Ins Co MO P $5,029,726 $11,151,459 45.1%
10084 Title Industry Assur Co RRG VT P $1,000,000 $2,248,765 44.5%
69485 454 Security Natl Life Ins Co UT L $9,400,000 $21,707,274 43.3%
79065 549 Sun Life Assur Co Of Canada US DE L $565,000,000 $1,308,833,218 43.2%
95145 3486 Community Hlth Plan MO X $1,162,460 $2,739,456 42.4%
10897 First Protective Ins Co FL P $8,767,500 $21,430,167 40.9%
17000 586 Arbella Mut Ins Co MA P $166,403,806 $407,990,325 40.8%
11864 Comcare Pro Ins Recip RRG VT P $1,000,000 $2,454,230 40.7%
41203 1230 Capital Advantage Ins Co PA P $150,000,000 $370,909,927 40.4%
81000 1137 Cambridge Life Ins Co MO L $18,970,363 $47,214,497 40.2%
6

Appendix A
2011 Surplus Notes(P/C, Life, Fraternal, Title, and Health)
10282 Midwestern Equity Title Ins Co IN P $950,000 $2,375,505 40.0%
12511 Samaritan RRG Inc SC P $5,000,000 $12,703,245 39.4%
23108 Lumbermens Underwriting Alliance MO P $22,484,660 $57,706,700 39.0%
12841 American Integrity Ins Co of FL FL P $9,132,353 $23,530,006 38.8%
15512 1318 Automobile Club Interins Exch MO P $67,583,904 $175,409,352 38.5%
11125 1198 MVP Hlth Ins Co NY L $47,000,000 $123,102,692 38.2%
10953 3456 Cypress Prop & Cas Ins Co FL P $10,889,706 $28,606,380 38.1%
12018 Indemnity Ins Corp RRG DE P $5,500,000 $14,448,130 38.1%
41688 212 Foremost Lloyds Of TX TX P $1,420,000 $3,743,575 37.9%
11844 St Johns Ins Co Inc FL P $17,352,941 $45,787,418 37.9%
67296 3766 Laurel Life Ins Co TX L $18,370,016 $48,492,979 37.9%
12601 1344 American Capital Assur Corp FL P $21,879,483 $58,106,698 37.7%
32450 4711 Attorneys Liab Protection Soc RRG MT P $11,543,921 $30,724,133 37.6%
31399 383 United Intl Ins Co NY P $1,700,000 $4,561,449 37.3%
10132 Florida Peninsula Ins Co FL P $21,507,353 $58,064,157 37.0%
10119 4755 Freedom Hlth Inc FL X $6,100,000 $16,559,508 36.8%
13791 Aviation Alliance Ins RRG Inc MT P $360,000 $982,114 36.7%
12520 Utah Business Ins Co Inc UT P $1,500,000 $4,128,811 36.3%
79715 Cooperativa De Seguros De Vida PR L $5,107,000 $14,315,315 35.7%
14041 707 Care Improvement Plus WI Ins Co WI L $1,554,000 $4,387,091 35.4%
10969 United Prop & Cas Ins Co FL P $17,058,823 $48,187,978 35.4%
10786 361 Princeton Excess & Surplus Lines Ins DE P $20,100,000 $57,934,070 34.7%
50520 150 Old Republic Natl Title Ins Co MN T $77,500,000 $224,102,988 34.6%
10136 Southern Fidelity Ins Co Inc FL P $20,955,882 $62,187,564 33.7%
95639 601 Kaiser Found Hlth Plan Mid Atlanti MD X $50,000,000 $150,008,798 33.3%
12198 Pinelands Ins Co RRG Inc DC P $200,000 $603,915 33.1%
62944 968 AXA Equitable Life Ins Co NY L $1,524,924,800 $4,622,316,095 33.0%
16713 46 Buckeye State Mut Ins Co OH P $6,200,000 $18,830,886 32.9%
79057 421 Southland Natl Ins Corp AL L $3,000,000 $9,343,908 32.1%
50020 Dakota Homestead Title Ins Co SD T $400,000 $1,257,382 31.8%
14550 2758 Wea Prop & Cas Ins Co WI P $1,600,000 $5,110,552 31.3%
11589 Jamestown Ins Co RRG SC P $420,000 $1,363,989 30.8%
7

Appendix A
2011 Surplus Notes(P/C, Life, Fraternal, Title, and Health)
87572 3506 Scottish Re Us Inc DE L $100,000,000 $325,026,457 30.8%
19623 732 American Summit Ins Co TX P $7,500,000 $24,554,235 30.5%
27669 483 Mississippi Farm Bureau Cas Ins Co MS P $54,000,000 $180,986,014 29.8%
65870 1117 Manhattan Life Ins Co NY L $10,000,000 $33,623,833 29.7%
30180 194 Assured Guar Corp MD P $300,000,000 $1,021,499,197 29.4%
16985 Conemaugh Valley Mut Ins Co PA P $1,000,000 $3,427,896 29.2%
67466 709 Pacific Life Ins Co NE L $1,599,396,089 $5,546,981,424 28.8%
13207 Lighthouse Prop Ins Corp LA P $2,850,000 $9,937,510 28.7%
47098 1313 ODS Hlth Plan Inc OR X $23,000,000 $80,826,023 28.5%
10891 CEM Ins Co IL P $1,300,000 $4,614,854 28.2%
61883 1117 Central United Life Ins Co AR L $15,000,000 $53,865,023 27.8%
43265 Gramercy Ins Co TX P $3,150,000 $11,336,296 27.8%
67253 4732 American Life & Security Corp AZ L $950,000 $3,425,659 27.7%
83445 1199 Wellcare Hlth Ins of AZ Inc AZ L $25,000,000 $90,207,153 27.7%
14265 246 Indiana Lumbermens Mut Ins Co IN P $7,000,000 $25,510,746 27.4%
11675 Professional Cas Assn PA P $3,800,000 $13,950,720 27.2%
12878 Sterling Cas Ins Co CA P $1,400,000 $5,155,287 27.2%
10293 Integra Ins Inc MN P $503,000 $1,863,717 27.0%
52554 Heart of Amer Hlth Plan ND X $320,000 $1,185,918 27.0%
29955 Legal Mut Liab Ins Society Of MD MD P $155,000 $579,028 26.8%
36340 Camico Mut Ins Co CA P $10,000,000 $37,426,397 26.7%
21660 212 Fire Ins Exch CA P $173,330,050 $653,088,624 26.5%
14842 324 North Carolina Farm Bur Mut Ins Co NC P $200,085,800 $762,257,641 26.2%
75027 Life Assur Co Of Amer IL L $600,000 $2,299,632 26.1%
10708 Lemic Ins Co LA P $5,000,000 $19,167,099 26.1%
14427 Louisiana Farm Bureau Mut Ins Co LA P $19,641,987 $77,352,301 25.4%
71412 261 Mutual Of Omaha Ins Co NE L $583,926,892 $2,314,875,191 25.2%
67644 850 Penn Mut Life Ins Co PA L $388,762,467 $1,542,747,721 25.2%
21300 1326 Kingsway Amigo Ins Co FL P $2,600,000 $10,325,949 25.2%
12329 2479 Delta Dental of W VA WV X $1,000,000 $4,013,798 24.9%
83860 American Home Life Ins Co AR L $100,000 $403,770 24.8%
68675 431 Security Benefit Life Ins Co KS L $149,779,579 $605,839,490 24.7%
8

Appendix A
2011 Surplus Notes(P/C, Life, Fraternal, Title, and Health)
95713 4512 DentaQuest VA Inc VA X $550,000 $2,225,109 24.7%
88099 1167 Optimum Re Ins Co TX L $5,800,000 $23,654,777 24.5%
67814 403 Phoenix Life Ins Co NY L $174,167,170 $718,787,462 24.2%
92649 863 American Underwriters Life Ins Co AZ L $3,000,000 $12,539,717 23.9%
12307 4512 DentaQuest USA Ins Co Inc TX L $4,000,000 $16,722,421 23.9%
68284 953 Pyramid Life Ins Co KS L $60,000,000 $250,970,431 23.9%
28649 1226 Eastern Atlantic Ins Co PA P $8,000,000 $33,580,219 23.8%
30058 749 Scor Reins Co NY P $156,766,000 $658,654,474 23.8%
13035 Healthfirst Healthplan of NJ Inc NJ X $3,473,660 $14,741,042 23.6%
10346 3363 Employers Preferred Ins Co FL P $32,000,000 $136,112,207 23.5%
11197 National Independent Truckers IC RRG SC P $1,203,208 $5,146,539 23.4%
64076 863 Great Fidelity Life Ins Co IN L $400,000 $1,727,680 23.2%
87645 449 United Fidelity Life Ins Co TX L $86,085,754 $372,871,002 23.1%
29149 4703 Kentucky Natl Ins Co KY P $1,000,000 $4,361,590 22.9%
11074 242 Selective Auto Ins Co of NJ NJ P $13,766,670 $60,139,859 22.9%
20966 50 Cotton States Mut Ins Co GA P $15,000,000 $65,787,973 22.8%
60040 1203 Cox Hlth Systems Ins Co MO L $2,709,003 $11,910,980 22.7%
97780 12 AGC Life Ins Co MO L $2,533,206,472 $11,159,514,336 22.7%
12257 Samaritan Hlth Plans Inc OR X $1,500,000 $6,618,155 22.7%
41050 831 Underwriter For The Professions Ins CO P $15,000,000 $66,484,997 22.6%
78743 520 New Era Life Ins Co TX L $10,000,000 $44,620,049 22.4%
29513 1228 The Bar Plan Mut Ins Co MO P $5,011,139 $22,395,969 22.4%
15059 853 Public Serv Mut Ins Co NY P $52,000,000 $233,715,675 22.2%
23329 226 Merchants Mut Ins Co NY P $32,000,000 $144,277,226 22.2%
11697 4713 Businessfirst Ins Co FL P $3,000,000 $13,567,998 22.1%
10860 4689 Sunshine State Ins Co FL P $3,000,000 $13,580,325 22.1%
26034 203 Virginia Farm Bureau Mut Ins Co VA P $30,000,000 $136,478,651 22.0%
15172 Southern Mut Ins Co GA P $2,500,000 $11,389,338 22.0%
12868 Mutual Benefit Assn of HI HI X $800,000 $3,658,103 21.9%
70688 468 Transamerica Financial Life Ins Co NY L $150,000,000 $689,640,717 21.8%
12631 American Builders Ins Co RRG Inc MT P $150,000 $698,128 21.5%
15474 732 National Lloyds Ins Co TX P $20,000,000 $94,154,004 21.2%
9

Appendix A
2011 Surplus Notes(P/C, Life, Fraternal, Title, and Health)
23787 140 Nationwide Mut Ins Co OH P $2,200,000,000 $10,434,888,740 21.1%
24910 167 United Equitable Ins Co IL P $700,000 $3,361,764 20.8%
68772 Security Mut Life Ins Co Of NY NY L $25,000,000 $120,419,834 20.8%
67539 525 Pan Amer Life Ins Co LA L $50,506,868 $243,433,427 20.7%
50031 Aviation Title Ins Co AR T $50,000 $245,013 20.4%
13572 Dealers Choice Mut Ins Inc NC P $2,000,000 $9,819,518 20.4%
11042 Stonetrust Commercial Ins Co LA P $4,000,000 $19,688,391 20.3%
95160 812 United Concordia Dental Plans TX Inc TX X $155,000 $764,518 20.3%
65838 904 John Hancock Life Ins Co (USA) MI L $989,518,901 $4,966,417,290 19.9%
26697 Casualty Underwriters Ins Co UT P $1,000,000 $5,019,136 19.9%
14001 561 Georgia Farm Bureau Mut Ins Co GA P $45,000,000 $226,584,989 19.9%
52053 707 DENTAL BENEFIT PROVIDERS OF IL INC IL X $410,000 $2,082,813 19.7%
14370 3407 Lebanon Valley Ins Co PA P $2,100,000 $10,704,416 19.6%
80942 229 ING USA Ann & LIfe Ins Co IA L $435,000,000 $2,219,507,144 19.6%
66869 140 Nationwide Life Ins Co OH L $700,000,000 $3,587,098,338 19.5%
95453 Grand Valley Hlth Plan Inc MI X $500,000 $2,581,972 19.4%
65676 20 Lincoln Natl Life Ins Co IN L $1,300,000,000 $6,729,781,890 19.3%
40673 878 Colonial Lloyds TX P $2,000,000 $10,424,795 19.2%
70769 213 Erie Family Life Ins Co PA L $45,000,000 $241,072,532 18.7%
83836 Selected Funeral & Life Ins Co AR L $4,000,000 $21,579,727 18.5%
66583 1211 National Guardian Life Ins Co WI L $33,750,000 $182,404,384 18.5%
10852 8 Allstate NJ Ins Co IL P $150,000,000 $813,362,331 18.4%
10130 SU Ins Co WI P $2,000,000 $11,016,851 18.2%
10103 American Agricultural Ins Co IN P $77,322,498 $430,179,486 18.0%
11989 831 Advocate MD Ins of the SW Inc TX P $7,500,000 $41,804,100 17.9%
76694 769 London Life Reins Co PA L $10,000,000 $55,859,041 17.9%
13687 Prepared Ins Co FL P $2,200,000 $12,383,235 17.8%
29246 210 Consumers Cnty Mut Ins Co TX P $400,000 $2,262,158 17.7%
10861 4663 Universal Prop & Cas Ins FL P $21,691,176 $122,955,611 17.6%
57088 Degree Of Honor Protective Assn MN F $1,000,000 $5,688,381 17.6%
66680 634 National Life Ins Co VT L $200,000,000 $1,140,159,354 17.5%
10

Appendix A
2011 Surplus Notes(P/C, Life, Fraternal, Title, and Health)
47490 Dental Hlth Serv WA X $800,000 $4,597,928 17.4%
44369 Imperial Fire & Cas Ins Co LA P $5,000,000 $28,991,169 17.2%
11711 Access Ins Co TX P $5,000,000 $29,077,788 17.2%
11592 4705 International Fidelity Ins Co NJ P $16,000,000 $94,054,412 17.0%
10704 1302 Builders Ins GA P $27,000,000 $159,156,461 17.0%
11878 MutualAid eXchange KS P $2,759,030 $16,417,119 16.8%
18732 1135 PMI Mortgage Assur Co AZ P $5,000,000 $29,937,132 16.7%
66281 468 Monumental Life Ins Co IA L $160,000,000 $970,716,230 16.5%
55263 Delta Dental of NY NY X $1,360,000 $8,357,461 16.3%
82252 Landmark Life Ins Co TX L $310,000 $1,923,788 16.1%
63983 2878 United Heritage Life Ins Co ID L $7,100,000 $44,124,001 16.1%
13978 349 Florists Mut Ins Co IL P $7,000,000 $43,548,644 16.1%
14125 62 Hamilton Mut Ins Co IA P $4,500,000 $28,059,469 16.0%
13528 Brotherhood Mut Ins Co IN P $22,000,000 $146,116,857 15.1%
16330 Ram Mut Ins Co MN P $4,895,000 $32,566,773 15.0%
25402 3363 Employers Assur Co FL P $12,000,000 $80,468,788 14.9%
95835 1127 GHI Hmo Inc NY X $5,350,000 $35,947,184 14.9%
95807 4637 MDwise Inc IN X $5,250,000 $35,286,141 14.9%
87726 241 Metlife Ins Co of CT CT L $750,000,000 $5,046,844,626 14.9%
11574 4091 Universal Hlth Care Inc FL X $3,750,000 $25,645,833 14.6%
61689 44 Aviva Life & Ann Co IA L $390,000,000 $2,668,608,622 14.6%
10158 Ocean RRG Inc DC P $200,000 $1,373,474 14.6%
13580 ARISE Boiler Inspection & Ins Co RRG KY P $250,000 $1,723,423 14.5%
18287 194 Assured Guar Municipal Corp NY P $175,000,000 $1,209,303,982 14.5%
96911 595 Harvard Pilgrim Hlth Care Inc MA X $68,196,609 $479,479,984 14.2%
70211 181 Reassure Amer Life Ins Co IN L $150,000,000 $1,086,959,440 13.8%
15067 1275 Quincy Mut Fire Ins Co MA P $100,000,000 $729,059,765 13.7%
63665 241 General Amer Life Ins Co MO L $110,739,427 $822,148,364 13.5%
15199 Standard Mut Ins Co IL P $4,000,000 $29,850,000 13.4%
10863 62 Dakota Fire Ins Co ND P $6,000,000 $44,804,419 13.4%
15113 Security Mut Ins Co NY P $5,000,000 $37,410,618 13.4%
14826 787 New London Cnty Mut Ins Co CT P $7,500,000 $56,262,630 13.3%
11

Appendix A
2011 Surplus Notes(P/C, Life, Fraternal, Title, and Health)
33162 689 Bankers Ins Co FL P $5,000,000 $37,555,453 13.3%
93572 4639 RGA Reins Co MO L $200,597,417 $1,513,433,750 13.3%
88625 Fiduciary Ins Co Of Amer NY P $992,197 $7,493,200 13.2%
95561 3383 Priority Hlth MI X $30,039,572 $227,802,872 13.2%
66915 826 New York Life Ins Co NY L $1,990,816,795 $15,128,949,008 13.2%
12718 75 Developers Surety & Ind Co IA P $10,000,000 $76,127,131 13.1%
24139 150 Old Republic Gen Ins Corp IL P $40,000,000 $307,976,426 13.0%
13781 US Lloyds Ins Co TX P $910,068 $7,134,272 12.8%
10857 250 Michigan Ins Co MI P $5,000,000 $39,264,423 12.7%
40371 807 Columbia Mut Ins Co MO P $20,082,566 $158,562,594 12.7%
12628 119 Arcadian Hlth Plan of GA Inc GA X $800,000 $6,331,428 12.6%
65978 241 Metropolitan Life Ins Co NY L $1,705,000,000 $13,501,824,444 12.6%
16535 212 Zurich Amer Ins Co NY P $883,000,000 $7,018,779,407 12.6%
32808 62 Illinois Emcasco Ins Co IA P $9,000,000 $72,466,712 12.4%
10859 4675 First Nonprofit Ins Co DE P $6,500,000 $52,654,247 12.3%
10385 FFVA Mut Ins Co FL P $12,000,000 $97,243,299 12.3%
15032 303 Guideone Mut Ins Co IA P $50,000,000 $408,447,469 12.2%
67172 704 Ohio Natl Life Ins Co OH L $109,164,465 $892,515,974 12.2%
51586 670 Fidelity Natl Title Ins Co CA T $30,000,000 $246,378,096 12.2%
25860 195 Union Mut Fire Ins Co VT P $7,500,000 $62,450,449 12.0%
10389 2538 Agent Alliance Ins Co AL P $350,000 $2,923,590 12.0%
15571 Illinois Cas Co A Mut Co IL P $2,882,143 $24,093,971 12.0%
10191 Missouri Employers Mut Ins Co MO P $20,035,920 $167,699,533 11.9%
67091 860 Northwestern Mut Life Ins Co WI L $1,750,000,000 $14,813,430,882 11.8%
11155 1211 Preneed Reins Co of Amer AZ L $2,000,000 $17,020,755 11.8%
65935 435 Massachusetts Mut Life Ins Co MA L $1,340,338,750 $11,417,365,503 11.7%
60186 8 Allstate Life Ins Co IL L $400,000,000 $3,450,254,245 11.6%
68241 304 Prudential Ins Co Of Amer NJ L $942,119,974 $8,157,220,092 11.5%
10186 Fidelity Fire & Cas Co FL P $2,250,000 $19,869,498 11.3%
43915 3485 Rainier Ins Co AZ P $2,400,000 $21,348,220 11.2%
26190 210 Consolidated Ins Assoc TX P $350,000 $3,120,581 11.2%
14990 271 Pennsylvania Natl Mut Cas Ins Co PA P $50,000,000 $451,150,572 11.1%
12

Appendix A
2011 Surplus Notes(P/C, Life, Fraternal, Title, and Health)
10798 2778 VFH Captive Ins Co GA P $225,000 $2,030,473 11.1%
80837 943 Union Central Life Ins Co NE L $50,000,000 $451,405,153 11.1%
10051 17 Lyndon Southern Ins Co DE P $2,000,000 $18,150,986 11.0%
21407 62 Emcasco Ins Co IA P $10,000,000 $91,140,016 11.0%
68713 229 Security Life Of Denver Ins Co CO L $165,031,867 $1,516,636,247 10.9%
69116 619 State Life Ins Co IN L $30,000,000 $276,715,152 10.8%
10730 American Access Cas Co IL P $5,000,000 $46,409,520 10.8%
47051 First Comm Hlth Plan Inc AL X $500,000 $4,648,176 10.8%
14338 291 Iowa Mut Ins Co IA P $3,000,000 $28,050,592 10.7%
24350 421 Triad Guar Ins Corp IL P $25,000,000 $234,118,496 10.7%
96628 Health Tradition Hlth Plan WI X $1,250,000 $11,875,678 10.5%
12999 119 Arcadian Hlth Plan of NC Inc NC X $400,000 $3,813,139 10.5%
11863 Positive Physicians Ins Exch PA P $1,141,332 $10,883,607 10.5%
12005 Sentinel Assur RRG Inc HI P $1,080,000 $10,573,040 10.2%
37028 Citizens United Recip Exch NJ P $2,418,898 $24,034,691 10.1%
43664 State Natl Fire Ins Co LA P $200,000 $1,999,158 10.0%
42617 413 MAG Mut Ins Co GA P $60,000,000 $610,096,938 9.8%
42706 Roche Surety & Cas Co Inc FL P $800,000 $8,171,281 9.8%
14046 3498 Volunteer State Hlth Plan Inc TN X $17,000,000 $175,035,109 9.7%
33758 2498 Associated Industries Of MA Mut Ins MA P $15,000,000 $154,788,273 9.7%
65110 119 Kanawha Ins Co SC L $18,000,000 $185,897,321 9.7%
34924 1124 Dakota Truck Underwriters SD P $3,000,000 $31,054,504 9.7%
28401 408 American Natl Prop & Cas Co MO P $36,968,750 $383,599,232 9.6%
10930 1227 High Point Prop & Cas Ins Co NJ P $25,000,000 $262,702,816 9.5%
12320 Innovative Physician Solutions RRG AZ P $230,000 $2,421,527 9.5%
30317 Hospitals Ins Co Inc NY P $17,000,000 $179,488,430 9.5%
15873 12 United Guar Residential Ins Co NC P $100,000,000 $1,062,459,791 9.4%
44504 California Hlthcare Ins Co Inc RRG HI P $4,000,000 $42,939,576 9.3%
68632 4668 Vantis Life Ins Co CT L $6,250,000 $67,270,510 9.3%
43877 First Mut Ins Co NC P $350,000 $3,771,211 9.3%
93440 812 HM LIfe Ins Co PA L $20,000,000 $216,498,077 9.2%
10790 Federated Natl Ins Co FL P $3,600,000 $39,306,791 9.2%
13

Appendix A
2011 Surplus Notes(P/C, Life, Fraternal, Title, and Health)
11118 Federated Rural Electric Ins Exch KS P $11,111,111 $122,135,165 9.1%
36277 Medical Mut Ins Co Of ME ME P $10,000,000 $110,332,656 9.1%
36072 National Guardian RRG Inc HI P $500,000 $5,529,049 9.0%
60895 619 American United Life Ins Co IN L $75,000,000 $830,921,425 9.0%
15377 309 Western Natl Mut Ins Co MN P $24,000,000 $269,598,798 8.9%
12471 Retailers Mut Ins Co MI P $750,000 $8,473,078 8.9%
13854 Farmers Mut Fire Ins Co of Salem Cn NJ P $4,000,000 $45,553,314 8.8%
11030 1332 Memic Ind Co NH P $6,000,000 $68,459,663 8.8%
24147 150 Old Republic Ins Co PA P $75,000,000 $859,621,344 8.7%
11853 3497 Ranchers & Farmers Ins Co TX P $400,000 $4,606,332 8.7%
64246 429 Guardian Life Ins Co Of Amer NY L $395,981,220 $4,572,642,330 8.7%
65331 290 Liberty Natl Life Ins Co NE L $50,000,000 $579,979,117 8.6%
12944 Homeowners Choice Prop & Cas Ins Co FL P $4,000,000 $46,503,317 8.6%
36307 1208 Gray Ins Co LA P $9,000,000 $105,488,772 8.5%
33812 Reciprocal of Amer VA P $6,875,000 $80,680,888 8.5%
64505 Homesteaders Life Co IA L $10,000,000 $119,692,483 8.4%
60445 3766 Sagicor Life Ins Co TX L $4,175,000 $50,280,459 8.3%
15326 Utica First Ins Co NY P $7,500,000 $90,380,164 8.3%
14761 333 Mutual Of Enumclaw Ins Co WA P $20,000,000 $248,083,160 8.1%
12522 Agents Natl Title Ins Co MO T $151,047 $1,879,631 8.0%
47074 Denta Chek of MD Inc MD X $7,000 $87,563 8.0%
71439 Assurity Life Ins Co NE L $20,000,000 $255,316,444 7.8%
60227 4752 Trinity Life Ins Co OK L $250,000 $3,203,946 7.8%
10023 Alliance Of Nonprofits For Ins RRG VT P $2,000,000 $25,952,875 7.7%
35599 812 Highmark Cas Ins Co PA P $10,000,000 $131,256,278 7.6%
11530 Healthcare Providers Ins Exch PA P $2,750,000 $36,355,069 7.6%
81043 689 Bankers Life Ins Co FL L $1,000,000 $13,484,899 7.4%
69345 1216 Teachers Ins & Ann Assoc Of Amer NY L $2,000,000,000 $27,128,396,352 7.4%
75485 Mulhearn Protective Ins Co LA L $100,000 $1,369,682 7.3%
33502 Machinery Ins Inc Assessable Mut Co FL P $163,500 $2,243,055 7.3%
10906 225 Commercial Alliance Ins Co TX P $1,823,528 $25,134,232 7.3%
11109 Neighborhood Hlth Plan Inc MA X $10,000,000 $140,953,279 7.1%
14

Appendix A
2011 Surplus Notes(P/C, Life, Fraternal, Title, and Health)
95733 Colorado Access CO X $1,250,000 $17,717,467 7.1%
65056 918 Jackson Natl Life Ins Co MI L $249,354,101 $3,632,016,298 6.9%
16705 Dealers Assur Co OH P $3,000,000 $44,155,680 6.8%
89004 4639 Reinsurance Co Of MO Inc MO L $100,346,250 $1,478,264,286 6.8%
23965 144 Norfolk & Dedham Mut Fire Ins Co MA P $10,000,000 $148,140,380 6.8%
10699 FHM Ins Co FL P $3,800,000 $56,469,384 6.7%
65242 836 Lafayette Life Ins Co OH L $10,000,000 $149,835,497 6.7%
95657 1230 Dominion Dental Serv Inc VA X $250,000 $3,777,919 6.6%
95819 3503 Willamette Dental of ID Inc ID X $850,000 $12,878,481 6.6%
10095 901 Bravo Hlth Mid Atlantic Inc MD X $1,600,000 $24,480,326 6.5%
15024 Preferred Mut Ins Co NY P $10,000,000 $155,131,913 6.4%
26257 Medamerica Mut RRG Inc HI P $2,000,000 $31,117,994 6.4%
10834 536 Comp Options Ins Co Inc FL P $1,400,000 $21,861,344 6.4%
26077 456 Lancer Ins Co IL P $10,000,000 $157,271,172 6.4%
12259 4755 Optimum Hlthcare Inc FL X $700,000 $11,139,316 6.3%
34762 Sunz Ins Co FL P $360,000 $5,903,954 6.1%
62626 306 CMFG Life Ins Co IA L $85,000,000 $1,400,972,719 6.1%
22050 1227 Palisades Safety & Ins Assoc NJ P $18,300,000 $304,620,584 6.0%
66168 869 Minnesota Life Ins Co MN L $120,000,000 $2,032,133,792 5.9%
14559 303 Guideone Specialty Mut Ins Co IA P $5,000,000 $85,333,127 5.9%
13919 Dryden Mut Ins Co NY P $4,650,000 $79,406,008 5.9%
23043 111 Liberty Mut Ins Co MA P $795,539,370 $13,596,435,060 5.9%
64688 749 SCOR Global Life Amer Reins Co DE L $10,000,000 $172,578,843 5.8%
44377 Halifax Mut Ins Co NC P $100,000 $1,771,417 5.6%
12309 Alliant Natl Title Ins Co Inc CO T $200,000 $3,547,232 5.6%
18686 Co Operative Ins Co VT P $3,000,000 $53,770,210 5.6%
65528 634 Life Ins Co Of The Southwest TX L $30,000,000 $563,974,150 5.3%
95812 Southeastern IN Hlth Organization IN X $300,000 $5,708,220 5.3%
13049 Park Ins Co NY P $225,000 $4,584,495 4.9%
15105 3098 Safety Natl Cas Corp MO P $41,283,333 $844,471,876 4.9%
67105 229 Reliastar Life Ins Co MN L $100,000,000 $2,101,719,922 4.8%
95696 4745 The Vt Hlth Plan LLC VT X $1,388,560 $29,823,101 4.7%
15

Appendix A
2011 Surplus Notes(P/C, Life, Fraternal, Title, and Health)
36226 United Cas & Surety Ins Co MA P $200,000 $4,300,880 4.7%
11948 Global Hawk Ins Co RRG VT P $201,500 $4,348,329 4.6%
29122 Delaware Grange Mut Ins Co DE P $50,000 $1,083,409 4.6%
14108 PIA Professional Liab Ins Co A RRG MT P $70,000 $1,563,582 4.5%
12262 150 Pennsylvania Manufacturers Assoc Ins PA P $10,000,000 $230,122,428 4.3%
33200 1282 Norcal Mut Ins Co CA P $25,000,000 $579,475,221 4.3%
29050 3484 Tower Hill Preferred Ins Co FL P $1,400,000 $32,505,344 4.3%
38954 2698 ProAssurance Cas Co MI P $22,093,603 $526,440,442 4.2%
14060 267 Grange Mut Cas Co OH P $35,000,000 $838,590,410 4.2%
66974 431 North Amer Co Life & Hlth Ins IA L $35,000,000 $840,364,513 4.2%
15563 SeaBright Ins Co IL P $12,000,000 $291,530,294 4.1%
10655 4717 Unique Ins Co IL P $370,000 $9,323,621 4.0%
14788 311 NGM Ins Co FL P $30,000,000 $770,467,130 3.9%
11534 American T & T Ins Co RRG MT P $151,981 $3,913,883 3.9%
12167 Charitable Serv Providers Recip RRG AZ P $124,891 $3,244,008 3.8%
63274 4731 Fidelity & Guar Life Ins Co MD L $30,000,000 $843,434,036 3.6%
15210 Sterling Ins Co NY P $2,400,000 $67,591,067 3.6%
16993 635 Continental Mut Ins Co PA P $30,000 $854,269 3.5%
95169 671 Healthkeepers Inc VA X $8,716,141 $252,731,505 3.4%
39969 1346 American Safety Cas Ins Co OK P $2,500,000 $75,360,153 3.3%
36684 98 Riverport Ins Co MN P $1,300,000 $39,224,128 3.3%
28207 671 Anthem Ins Co Inc IN P $25,095,000 $770,471,395 3.3%
92738 2658 American Equity Invest Life Ins Co IA L $51,000,000 $1,594,517,660 3.2%
86231 468 Transamerica Life Ins Co IA L $150,000,000 $5,113,283,787 2.9%
13014 Lancet Ind RRG Inc NV P $75,000 $2,773,867 2.7%
11152 American Hlth Inc PR X $480,000 $17,768,930 2.7%
20443 218 Continental Cas Co IL P $250,000,000 $9,887,580,448 2.5%
11539 New Jersey Physicians United Recip NJ P $409,111 $16,942,178 2.4%
13641 Colorado Farm Bureau Mut Ins Co CO P $1,000,000 $41,812,851 2.4%
26816 176 State Farm Cnty Mut Ins Co Of TX TX P $1,000,000 $42,420,127 2.4%
61271 332 Principal Life Ins Co IA L $99,318,800 $4,215,693,715 2.4%
95402 Neighborhood Hlth Plan of RI Inc RI X $1,000,000 $43,367,290 2.3%
16

Appendix A
2011 Surplus Notes(P/C, Life, Fraternal, Title, and Health)
18380 Pacific Ind Ins Co GU P $292,000 $13,615,305 2.1%
38490 800 Arizona Home Ins Co AZ P $235,000 $12,155,196 1.9%
11398 Guarantee Ins Co FL P $851,000 $46,729,525 1.8%
13587 4727 First Chicago Ins Co IL P $100,000 $6,359,099 1.6%
82392 1339 Regal Life Of Amer Ins Co TX L $100,000 $7,684,874 1.3%
34495 831 Doctors Co An Interins Exch CA P $13,000,000 $1,191,951,377 1.1%
11806 National Assisted Living RRG Inc DC P $30,000 $3,087,614 1.0%
95253 812 UNITED CONCORDIA DENTAL PLANS MD X $75,000 $8,765,969 0.9%
11522 901 Healthspring of TN Inc TN X $900,000 $106,435,943 0.8%
37370 Associated Loggers Exch ID P $47,474 $11,714,832 0.4%
13838 140 Farmland Mut Ins Co IA P $500,000 $150,195,071 0.3%
66370 968 Mony Life Ins Co NY L $1,090,548 $437,682,241 0.2%
53872 1185 KPS Hlth Plans WA X $4,637 $11,033,612 0.0%
27251 1135 PMI Mortgage Ins Co AZ P $285,000,000 ($2,086,502,558) -13.7%
12155 707 Medica HlthCare Plans Inc FL X $1,210,000 ($5,342,908) -22.6%
13162 CAGC Ins Co NC P $1,000,000 ($1,682,048) -59.5%
12524 Scaffold Industry Ins Co RRG Inc DC P $140,189 ($190,604) -73.5%
42544 Academic Hlth Professionals Ins NY P $21,462,794 ($17,027,366) -126.0%
66265 440 Monarch Life Ins Co MA L $1,500,000 ($833,238) -180.0%
60246 Netcare Life & Hlth Ins Co GU L $1,935,000 ($560,171) -345.4%
37958 Acceptance Ins Co NE P $20,000,000 ($5,451,936) -366.8%
$51,536,392,299 $1,205,222,061,281* 4.3%
* Total surplus does not include elimination entries and contains stacking
17

1
Statutory Accounting
Principles 101
SAP, GAAP and IFRS
APPENDIX - B
© 2008 National Association of Insurance Commissioners
2
Objectives
Identify specific items of difference between a GAAP
and SAP balance sheet
Distinguish between how GAAP and SAP handle
specific accounting elements on the balance sheet
Recognize admitted and nonadmitted assets
Recognize liabilities
Describe IFRS and how it may impact the future of
GAAP and statutory accounting.

© 2008 National Association of Insurance Commissioners
3
GAAP and SAP Differences
GAAP
Designed to meet the
varying needs of
different users
Stresses measurement
of profitability/income
Emphasis on earnings
Going concern concept
SAP
Designed to address
concerns of regulators
Stresses ability to
satisfy policyholder
obligations
Balance sheet
emphasis
Focuses on liquidity

© 2008 National Association of Insurance Commissioners
4
Foundation Concepts
GAAP
Relevance
Reliability
Neutrality
Comparability
Materiality
SAP
Additional Emphasis:
Conservatism
Consistency
Recognition

© 2008 National Association of Insurance Commissioners
5
GAAP vs. SAP
Assets

© 2008 National Association of Insurance Commissioners
6
Burning Down the House
Illustration of complete GAAP and SAP balance sheets (see Attachment)
Identifies significant differences in accounting and reporting for GAAP and SAP financial statements.
For illustrative purposes, differences from both Life and P&C companies are included.

© 2008 National Association of Insurance Commissioners
7
Nonadmitted Assets
GAAP does not
recognize the concept of
“nonadmitted assets”.
SAP does not allow
certain assets to be “admitted” in the balance sheet.
A nonadmitted asset is one which is accorded limited or no value in statutory reporting.
Assets Not Net Admitted Assets Admitted Assets
GAAP Balance Sheet Statutory Balance Sheet
$2,794,000 $ 260,000 $ 2,534,000
$3,111,000 Total Assets

© 2008 National Association of Insurance Commissioners
8
Investments GAAP
Classifies investments as follows in FAS 115: Securities held to maturity are
reported at amortized cost;
Securities available for sale are reported at fair value;
Trading securities are reported at fair value.
GAAP does not recognize the concept of nonadmitted assets or investment limitations.
SAP
Bonds are reported at
amortized cost except
those that are low quality –
lower of amortized cost or
market (SSAP No. 26).
Common Stocks are
generally reported at SVO
fair value (SSAP No. 30).
Nonadmitted assets due to state investment limitations

© 2008 National Association of Insurance Commissioners
9
Investments
In the case of the investments above, the total $17,000
nonadmitted asset represents investments that exceed
the statutory investment limitations imposed by the state
of domicile. Most states impose such limitations.
Assets Not Net Admitted
Assets Admitted Assets
Investments: Investments:
Trading securities 56,000$ Bonds 600,000$ 2,000$ 598,000$
Securities available for sale 1,200,000 Common stocks 1,119,000 15,000 1,104,000
Securities held to maturity 600,000
GAAP Balance Sheet Statutory Balance Sheet

© 2008 National Association of Insurance Commissioners
10
Goodwill
GAAP goodwill =
purchase price less
market value
GAAP does not limit
goodwill.
SSAP No. 68 goodwill = purchase price less book value
Goodwill in excess of 10% of adj. capital & surplus is nonadmitted.
Assets
Not
Net
Admitted
Assets Admitted Assets Investment in
Firemen's Insurance
Company Goodwill 50,000 33,000 17,000
20,000
GAAP Balance Sheet Statutory Balance Sheet

© 2008 National Association of Insurance Commissioners
11
Mortgage Loans
Mortgage loans are
valued at the unpaid
principal amount and
impairment of the
asset can be
measured using
varying methods.
Mortgage loans are also
valued at the unpaid
principal amount pursuant to
SSAP No. 37.
Many states have investment
limitations on the ratio of loan
value to property value.
Assets Not Net Admitted
Assets Admitted Assets
Mortgage loans on real Mortgage loans on real
estate 500,000 estate 500,000 500,000
GAAP Balance Sheet Statutory Balance Sheet

© 2008 National Association of Insurance Commissioners
12
Real Estate
GAAP requires real estate
investments to be reported at depreciated cost and net of any allowance for impairment in value.
GAAP requires real estate held for sale to be reported at the lower of depreciated cost or fair value less costs to sell.
Properties occupied by the company
and properties held for the production of income are reported at depreciated cost.
Property held for sale is reported at the lower of depreciated cost or fair value less costs to sell.
Additionally, all properties are recorded NET of any related debt.
Assets Not Net Admitted
Assets Admitted Assets
Real estate 50,000 Real estate 25,000 25,000
GAAP Balance Sheet Statutory Balance Sheet

© 2008 National Association of Insurance Commissioners
13
Cash & S/T Investments
GAAP requires
companies with multiple
cash accounts to
reclassify individual
negative cash account
balances to liabilities.
SSAP No. 2 allows
negative cash to be
reported as a negative
asset, consistent with the
statutory concept of
conservatism.
Assets Not Net Admitted
Assets Admitted Assets
Cash and cash equivalents 50,000 Cash and short-term
investments 30,000 30,000
GAAP Balance Sheet Statutory Balance Sheet

© 2008 National Association of Insurance Commissioners
14
Other Invested Assets
GAAP does not use the
classification of “Other
Invested Assets.”
SAP requires certain
assets to be recorded as
“Other Invested Assets”
separately from “Other
Assets.”
Assets Not Net Admitted
Assets Admitted Assets
Other invested assets 30,000 30,000
GAAP Balance Sheet Statutory Balance Sheet
© 2008 National Association of Insurance Commissioners
15
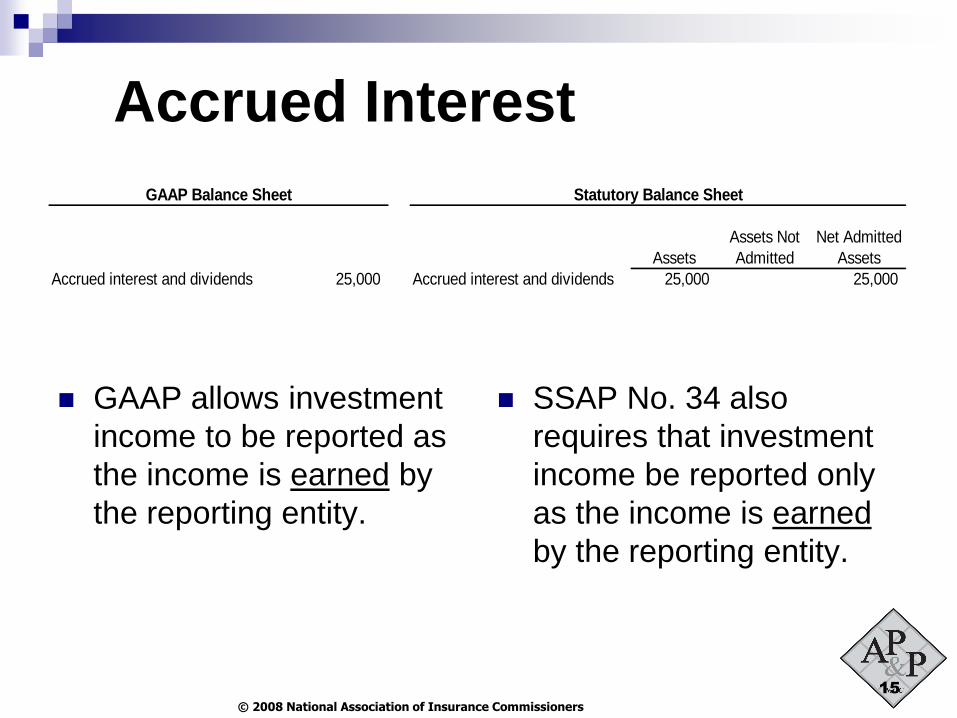
Accrued Interest
GAAP allows investment
income to be reported as
the income is earned by
the reporting entity.
SSAP No. 34 also
requires that investment
income be reported only
as the income is earned
by the reporting entity.
Assets Not Net Admitted
Assets Admitted Assets
Accrued interest and dividends 25,000 Accrued interest and dividends 25,000 25,000
GAAP Balance Sheet Statutory Balance Sheet

© 2008 National Association of Insurance Commissioners
16
Agents Balances
GAAP requires receivables for premiums and agents’ balances to be reported net of a valuation allowance for doubtful accounts.
Companies are simply required to nonadmit any premium receivable balances greater than 90 days past due. (Exception for government insured plans is within SSAP No. 84.)
Uncollectible amounts are written off.
Assets Not Net Admitted
Assets Admitted Assets
Premiums receivable and Agents' balances and uncollected
agents' balances 55,000 premium 55,000 5,000 50,000
GAAP Balance Sheet Statutory Balance Sheet

© 2008 National Association of Insurance Commissioners
17
Reinsurance Recoverable
GAAP requires all amounts
due from reinsurers to be
recorded as assets.
SSAP No. 61 and SSAP No.
62 requires reinsurance recoverables on unpaid claims and IBNR to be recorded as a contra-liability and netted against gross losses and loss adjustment expenses or in cases where the right of offset exists, reinsurance payables.
Assets Not Net Admitted
Assets Admitted Assets
Reinsurance recoverables 50,000 Reinsurance recoverables 30,000 30,000
GAAP Balance Sheet Statutory Balance Sheet

© 2008 National Association of Insurance Commissioners
18
Deferred Acquisition Costs
DAC calculation includes:
Commissions;
State premium taxes;
Underwriting; and
Issuance costs.
DAC is usually the largest difference
between GAAP and SAP

© 2008 National Association of Insurance Commissioners
19
DAC
FAS 60 allows acquisition costs and commissions to be capitalized and amortized to expense over the life of the policy.
SSAP No. 71 requires acquisition costs and commissions to be expensed as incurred.
Premiums are recognized as income on a pro rata basis.
Assets Not Net Admitted
Assets Admitted Assets
Deferred policy acquisition costs 170,000
GAAP Balance Sheet Statutory Balance Sheet

© 2008 National Association of Insurance Commissioners
20
DAC Example Assumptions
Annual premium is $1,200;
Policy term is one year;
Policy is effective December 1; and
Acquisition expenses for commissions,
taxes, policy issuance, etc., are $360.

© 2008 National Association of Insurance Commissioners
21
SAP Income Statement
Year 1 Year 2
Premiums Written $1,200 $ -0-
Change in UPR 1,100 (1,100)
Premiums Earned $ 100 $1,100
Acq. Expenses 360 -0-
Net Income (Loss): $ (260) $1,100

© 2008 National Association of Insurance Commissioners
22
GAAP Income Statement
Year 1 Year 2
Premiums Written $1,200 $ -0-
Change in UPR 1,100 (1,100)
Premiums Earned $ 100 $1,100
Acquisition Expenses 30 330
Net Income $ 70 $ 770
At the end of year 1, the company would show
the unamortized acquisition costs of $330 as an
asset on the GAAP balance sheet.

© 2008 National Association of Insurance Commissioners
23
Furniture, Fixtures & Equip.
FF&E is capitalized and depreciated over its useful life.
FAS 13 requires reporting entities to classify leases as capital or operating leases.
SSAP No. 19 nonadmits all such equipment.
SSAP No. 22 requires all leases to be considered operating leases.
Assets Not Net Admitted
Assets Admitted Assets
Furniture, fixtures and equipment 15,000 Furniture, fixtues and equipment 10,000 10,000 -
GAAP Balance Sheet Statutory Balance Sheet

© 2008 National Association of Insurance Commissioners
24
EDP Equipment
EDP equipment is
capitalized and depreciated
over its useful life.
SSAP No. 16 requires EDP equipment and operating system software that exceeds 3% of adjusted capital and surplus to be nonadmitted.
Depreciation period is specified by SSAP No. 79 and SSAP No. 16.
Assets Not Net Admitted
Assets Admitted Assets
EDP equipment and operating EDP equipment and operating
software 25,000 software 25,000 20,000 5,000
GAAP Balance Sheet Statutory Balance Sheet

© 2008 National Association of Insurance Commissioners
25
Healthcare Delivery Assets
GAAP does not distinguish between health care delivery assets and other assets.
GAAP requires that health care delivery assets be depreciated over est. useful lives.
SAP requires that assets not used in the direct delivery of care be nonadmitted.
SAP requires that all health care delivery assets be depreciated over their useful lives but no more than three years.
Assets Not Net Admitted
Assets Admitted Assets Fixed assets 250,000
Fixed assets 250,000 175,000
75,000
GAAP Balance Sheet Statutory Balance Sheet

© 2008 National Association of Insurance Commissioners
26
Other Assets
GAAP does not require
assets to be classified
between “Other Invested
Assets” and “Other
Assets”.
SAP requires certain assets (e.g., transportation equipment, mineral rights, certain fixed or variable interest rate investments, etc.) to be recorded as “Other Invested Assets” separately from “Other Assets”.
Assets Not Net Admitted
Assets Admitted Assets
Other assets 45,000 Other assets 15,000 15,000
GAAP Balance Sheet Statutory Balance Sheet

© 2008 National Association of Insurance Commissioners
27
A & H Premiums Due and Unpaid
GAAP requires receivables for
premiums and agents’
balances to be reported net of
any allowance for doubtful
accounts.
The allowance method is not used for SAP purposes. Rather, under SSAP No. 6 companies are required to nonadmit any receivable balances greater than 90 days past due. (Again, exception exists in SSAP No. 84 for government insured plans.)
Assets Not Net Admitted
Assets Admitted Assets Premiums receivable and 55,000
Accident and health premiums 55,000 5,000
50,000
agents' balances due and unpaid
GAAP Balance Sheet Statutory Balance Sheet

© 2008 National Association of Insurance Commissioners
28
Healthcare Receivables
GAAP does not distinguish between different types of health care receivables.
GAAP only requires receivables to be reported net of any allowance for doubtful accounts.
SSAP No. 84 provides a listing
of those health care receivables that might be considered an admitted asset.
The allowance method is not used for SAP purposes. Rather, the admissibility rules in SSAP No. 84 must be followed.
Assets Not Net Admitted Assets Admitted Assets
Health care receivables 250,000 Health care receivables 250,000
150,000 100,000
GAAP Balance Sheet Statutory Balance Sheet

© 2008 National Association of Insurance Commissioners
29
GAAP vs. SAP
Liabilities

© 2008 National Association of Insurance Commissioners
30
P & C Reserves
Management’s best estimate of the liability
Generally allows discounting of this liability
Requires recording of the minimum point in a range as its liability when all points are equally probable
Management’s best estimate of the liability
Generally does not allow discounting of this liability
Requires recording of the mid-point in a range as its liability when all points are equally probable
Reserve for property-liability claims 800,000 $ Reserve for property-liability claims 900,000 $ 9
GAAP Balance Sheet Statutory Balance Sheet

© 2008 National Association of Insurance Commissioners
31
A & H Reserves
Management’s best estimate
of the liability
Generally allows discounting of this liability
Requires recording of the minimum point in a range as its liability when all points are equally probable
Management’s best estimate
of the liability
Generally does not allow discounting of this liability
Requires recording of the mid-point in a range as its liability when all points are equally probable
Reserve for A&H claims 900,000 Reserve for A&H claims 900,000
GAAP Balance Sheet Statutory Balance Sheet

© 2008 National Association of Insurance Commissioners
32
Unearned Premiums
FAS 60 only allows premiums
to be recognized on a pro-rata basis (daily pro-rata or monthly pro-rata). This results in the recording of an unearned premium liability for the portion of premium received but not yet earned.
SSAP No. 53 also only
allows premiums to be recognized on a pro-rata basis (daily pro-rata or monthly pro-rata).
SSAP No. 54 requires premiums to be recognized when due.
Unearned premiums 250,000 Unearned premiums 10,000 Advance premiums 240,000
GAAP Balance Sheet Statutory Balance Sheet

© 2008 National Association of Insurance Commissioners
33
SSAP No. 10 - Income Taxes
Temporary difference – a difference between the tax basis of an asset or liability and its book amount that will result in taxable or deductible amounts in future years
Deferred tax asset – an item was taken as a deduction for financial reporting before the deduction was allowed on the tax return; or an item of income was included in the tax return before it was income for financial reporting
Deferred tax liability – an item was taken as a deduction on the tax return before the deduction was allowed for financial reporting purposes; or item of income was included for financial reporting before it was included as income on the tax return
Deferred tax provision – the deferred tax provision is determined by comparing the beginning deferred tax accrual amount to the computation of the year-end deferred tax accrual amount
© 2008 National Association of Insurance Commissioners
34
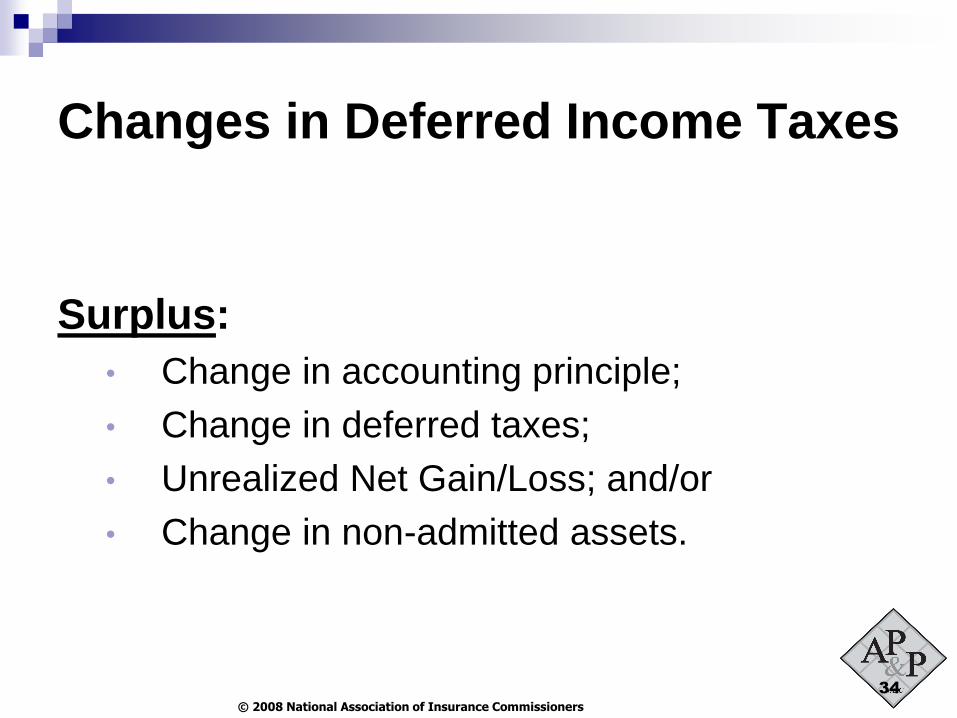
Changes in Deferred Income Taxes
Surplus:
• Change in accounting principle;
• Change in deferred taxes;
• Unrealized Net Gain/Loss; and/or
• Change in non-admitted assets.

© 2008 National Association of Insurance Commissioners
35
Deferred Income Taxes
GAAP requires
DTAs/DTLs to be recorded for temporary differences between GAAP book income and taxable income.
GAAP does not limit DTAs (or DTLs).
SSAP No. 10 requires
DTAs/ DTLs to be recorded for temporary differences between SAP book income and taxable income.
Net DTAs limited by an admissibility test; no limit on net DTLs
Deferred income taxes 15,000 Deferred income taxes 5,000
GAAP Balance Sheet Statutory Balance Sheet

© 2008 National Association of Insurance Commissioners
36
Other Liabilities
GAAP records “other liabilities” when the liability:
(1) is probable; and
(2) can be reasonably estimated.
When both criteria are met,
the liability is required to be recorded.
SAP requires other liabilities to be recorded and presented consistent with GAAP.
Other liabilities 30,000 Other liabilities 10,000
GAAP Balance Sheet Statutory Balance Sheet
Note: In the case of Burning Down the House, the GAAP liability
is $20,000 higher because Burning Down the House has
one negative cash account with a balance of $20,000.

© 2008 National Association of Insurance Commissioners
37
Debt
GAAP requires L/T debt to
be recorded as a separate liability on the balance sheet. GAAP generally does not allow debt to be used as an offset against the related asset acquired with the debt.
SAP allows certain debt to
be used as an offset to the related asset for which the debt was obtained.
SAP No. 41 allows reporting entities to issue instruments with characteristics of both debt and equity, referred to as surplus notes. These are reported in surplus.
Long-term debt 100,000 Borrowed money 25,000
GAAP Balance Sheet Statutory Balance Sheet

© 2008 National Association of Insurance Commissioners
38
Burning Down the House
Under SAP, $25,000 of long-term debt (i.e., Borrowed Money) is used to offset the related real estate investment. Rather than presenting the $25,000 as a separate liability, the real estate investment is reduced by $25,000 which explains the difference between the GAAP and SAP balances for real estate of $50,000 and $25,000, respectively.

© 2008 National Association of Insurance Commissioners
39
Long-term Debt, continued
The remaining difference between the GAAP and SAP long-term debt balances is the $50,000 that is recorded as surplus notes in the “Surplus” section of the SAP financial statements.
Note: SAP balances of $25,000 (included as
offset to real estate asset), $50,000 (included as surplus notes) and the $25,000 of borrowed money equals the GAAP long-term debt balance of $100,000.
© 2008 National Association of Insurance Commissioners
40
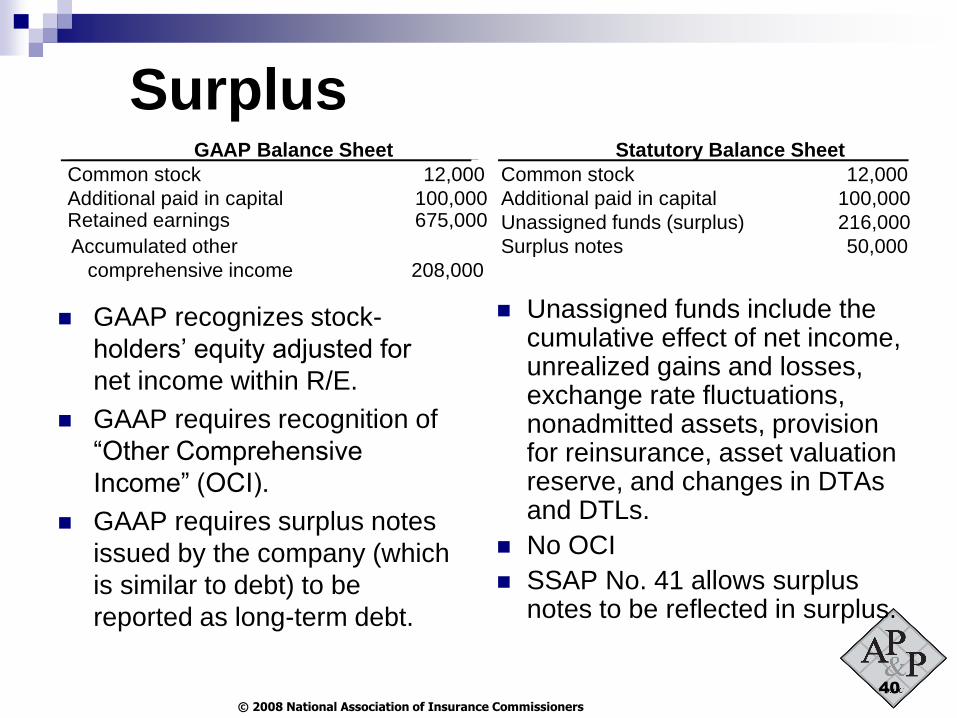
Surplus
GAAP recognizes stock-
holders’ equity adjusted for
net income within R/E.
GAAP requires recognition of
“Other Comprehensive
Income” (OCI).
GAAP requires surplus notes
issued by the company (which
is similar to debt) to be
reported as long-term debt.
Unassigned funds include the cumulative effect of net income, unrealized gains and losses, exchange rate fluctuations, nonadmitted assets, provision for reinsurance, asset valuation reserve, and changes in DTAs and DTLs.
No OCI
SSAP No. 41 allows surplus notes to be reflected in surplus.
Common stock 12,000 Common stock 12,000
Additional paid in capital 100,000 Additional paid in capital 100,000 Retained earnings 675,000 Unassigned funds (surplus) 216,000
Accumulated other
comprehensive income
208,000
Surplus notes 50,000
GAAP Balance Sheet Statutory Balance Sheet

© 2008 National Association of Insurance Commissioners
41
Final Thoughts
GAAP and SAP have fundamentally
different approaches.
Although SAP reviews and uses some of
the GAAP pronouncements, the objectives
are different.