
Thomas Gumbricht [email protected]
71
Introduktion till dataanalys i GIS 1 Thomas Gumbricht [email protected] www.karttur.com Dataanalys, Thomas Gumbricht, 2007
Transcript of Thomas Gumbricht [email protected]
Introduktion till dataanalys i GIS
1
Thomas [email protected]
www.karttur.com
Dataanalys, Thomas Gumbricht, 2007
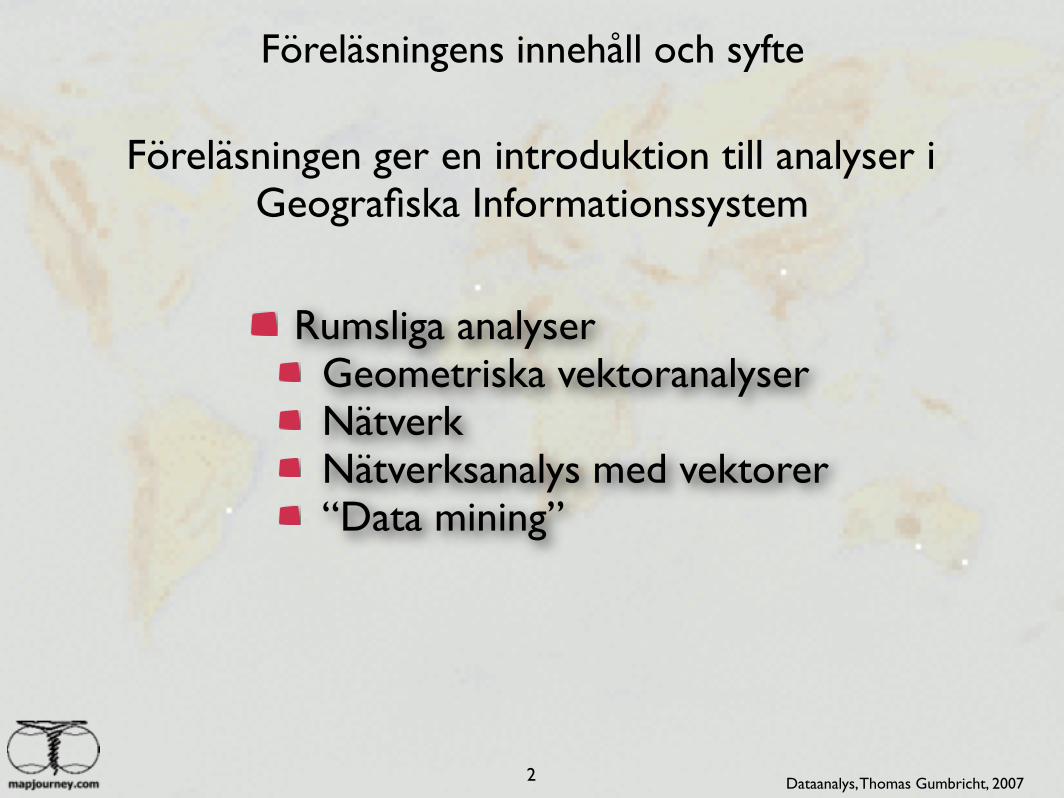
Föreläsningens innehåll och syfte
Rumsliga analyserGeometriska vektoranalyserNätverkNätverksanalys med vektorer“Data mining”
Föreläsningen ger en introduktion till analyser i Geografiska Informationssystem
2 Dataanalys, Thomas Gumbricht, 2007
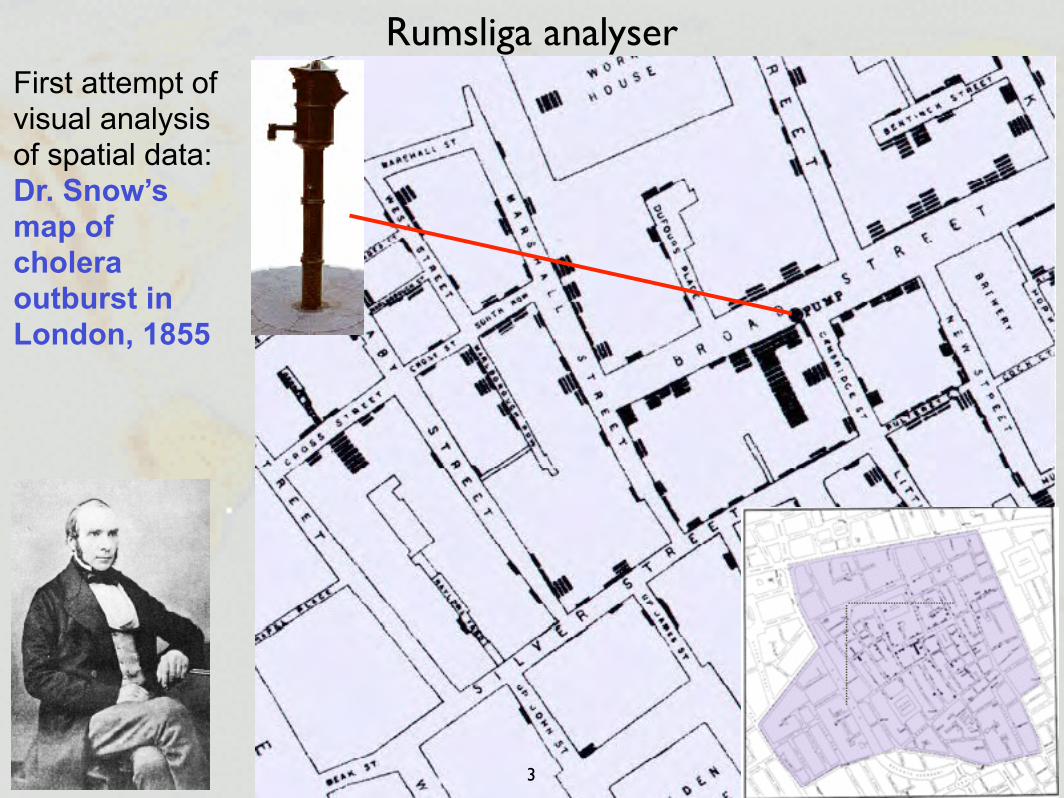
Rumsliga analyser
3
First attempt of visual analysis of spatial data: Dr. Snow’s map of cholera outburst in London, 1855

Rumsliga analyser
Lokal (punkt)Fokal (grannar)Regional (nätverk)
4
Profildata (2D, 2.5D, 3D)
Tidsserier
Dataanalys, Thomas Gumbricht, 2007
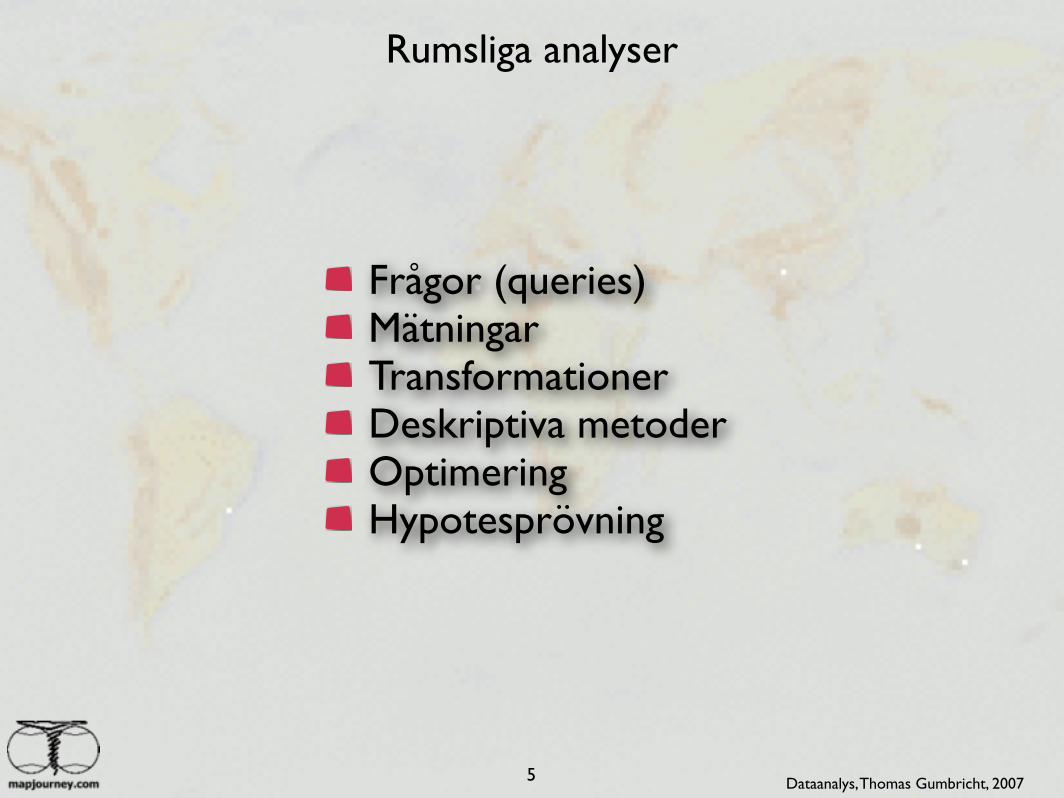
Rumsliga analyser
Frågor (queries)MätningarTransformationerDeskriptiva metoderOptimeringHypotesprövning
5 Dataanalys, Thomas Gumbricht, 2007
Rumsliga analyser ...
6
! Can handle the multiple perspectives of doing science ! Constructive/Inductive or Positivist/Deductive
! Either build theory or test theory ! Ultimately for a normative purpose – best, good, ideal based
on your value system ! Mode II or Post-Normal too
! Problem solving with transdisciplinary approach ! Qualitative or Quantitative
! Verbal descriptions, Quantitative ability ! In database fields – vector ! In grid values - raster
Dataanalys, Thomas Gumbricht, 2007

Rumsliga analyser
7
! In essence GIS can handle any model that you can conceive that uses attribute, spatial, and temporal components
! You’ve done a lot of it already in your labs! ! Exploration of spatial data, measurements, sampling representation,
mapping, evaluation, overlay multiply, overlay site analysis, watersheds and pollution susceptibility, land use and cover change
! Some processes change or create new data, others just use the data as is
! Again, all of this is to build information to help solve your problem, support your decision making, and aid your research
! You determine its value and how that information is used!!!! ! Finally, we should be thinking of the output or deliverables
! NOT JUST MAPS! ! For some results of analysis it may be more appropriate to use
report/memo, charts, and/or tables, simulation videos
Dataanalys, Thomas Gumbricht, 2007
Rumsliga analyser
8
Exploration and Queries! Exploration and Mapping of existing data – just
examining the variables in question from viewing the data ! In essence simple and superficial query ! No real GIS operations except displaying the tables and/or
map display, turning layers “on” or “off” ! Symbolization and Cartography may be more important
! Queries answer questions based on existing data ! No new data generated and existing data is not revised
! But may be temporarily and then eventually permanently manipulated to pull together all necessary data (e.g. new table creation, or subset of spatial data selected)
Dataanalys, Thomas Gumbricht, 2007
Rumsliga analyser
9
Query
! Two basic questions ! What is where – Query by location ! Where is what – Query by attribute ! Those are the two “basic” questions, but I can
get more complex with my query ! In GIS we can query by using map display,
tables, or catalogs (databases)
Dataanalys, Thomas Gumbricht, 2007
Rumsliga analyser
10
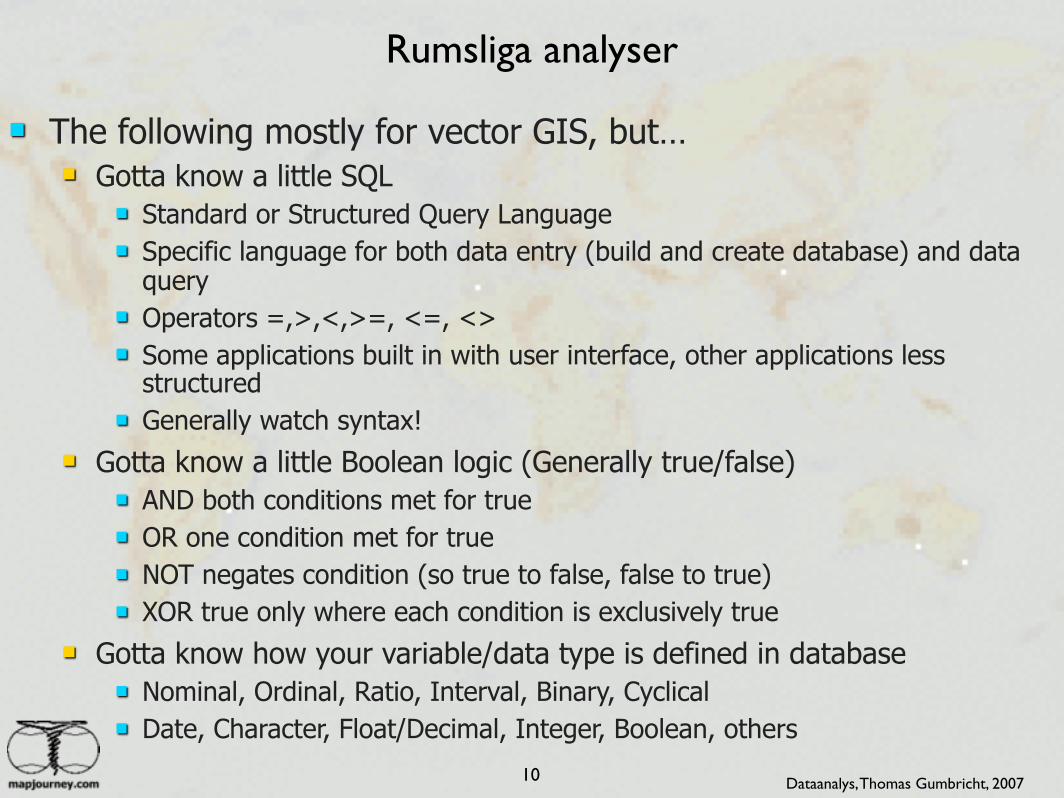
! The following mostly for vector GIS, but… ! Gotta know a little SQL
! Standard or Structured Query Language ! Specific language for both data entry (build and create database) and data
query ! Operators =,>,<,>=, <=, <> ! Some applications built in with user interface, other applications less
structured ! Generally watch syntax!
! Gotta know a little Boolean logic (Generally true/false) ! AND both conditions met for true ! OR one condition met for true ! NOT negates condition (so true to false, false to true) ! XOR true only where each condition is exclusively true
! Gotta know how your variable/data type is defined in database ! Nominal, Ordinal, Ratio, Interval, Binary, Cyclical ! Date, Character, Float/Decimal, Integer, Boolean, others
Dataanalys, Thomas Gumbricht, 2007

Rumsliga analyser
11
Query – More ! For spatial queries, we can also do other simple queries that used to
require overlay analysis, which is even better in the object-oriented programs like ArcGIS
! Most of these searches must use some form of topology, logic, and advanced SQL to work
! Remember that I get the attributes with these ! Finally, have to know your dimensionality (0,1,2,3) for application, but
most of these relate to the vector model ! Equal – are the geometries the same? ! Disjoint – do the geometries share a common point? ! Intersects – do the geometries intersect? ! Touches – do the geometries intersect at their boundaries? ! Crosses – do the geometries overlap? ! Within – is one geometry within another? ! Contains – does one geometry completely contain another? ! Overlaps – do the geometries overlap? ! Relate – are there intersections between the interior, boundary, or exterior of the
geometries?Dataanalys, Thomas Gumbricht, 2007
Rumsliga analyser
12
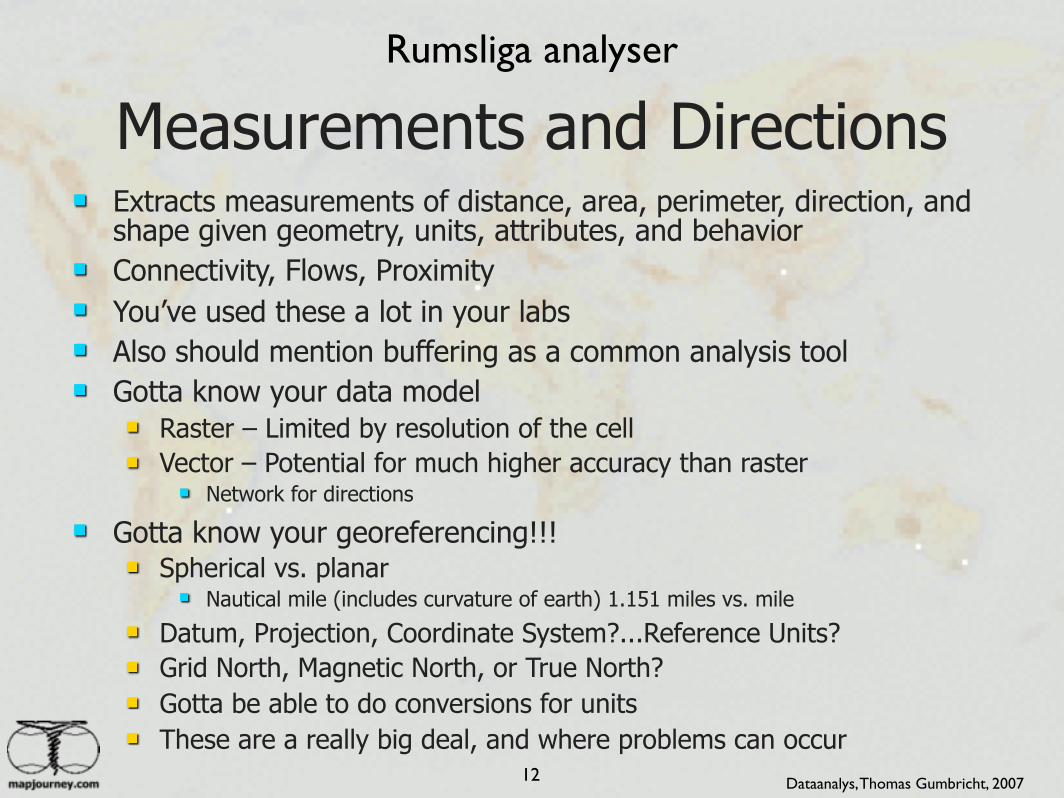
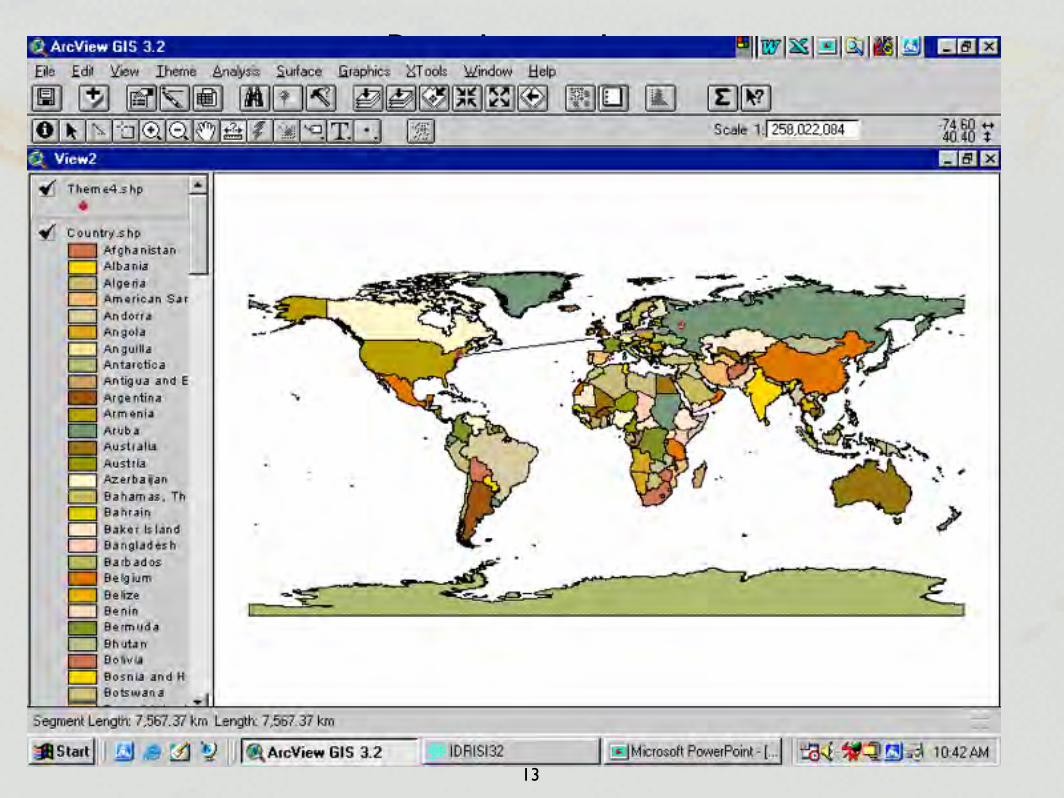
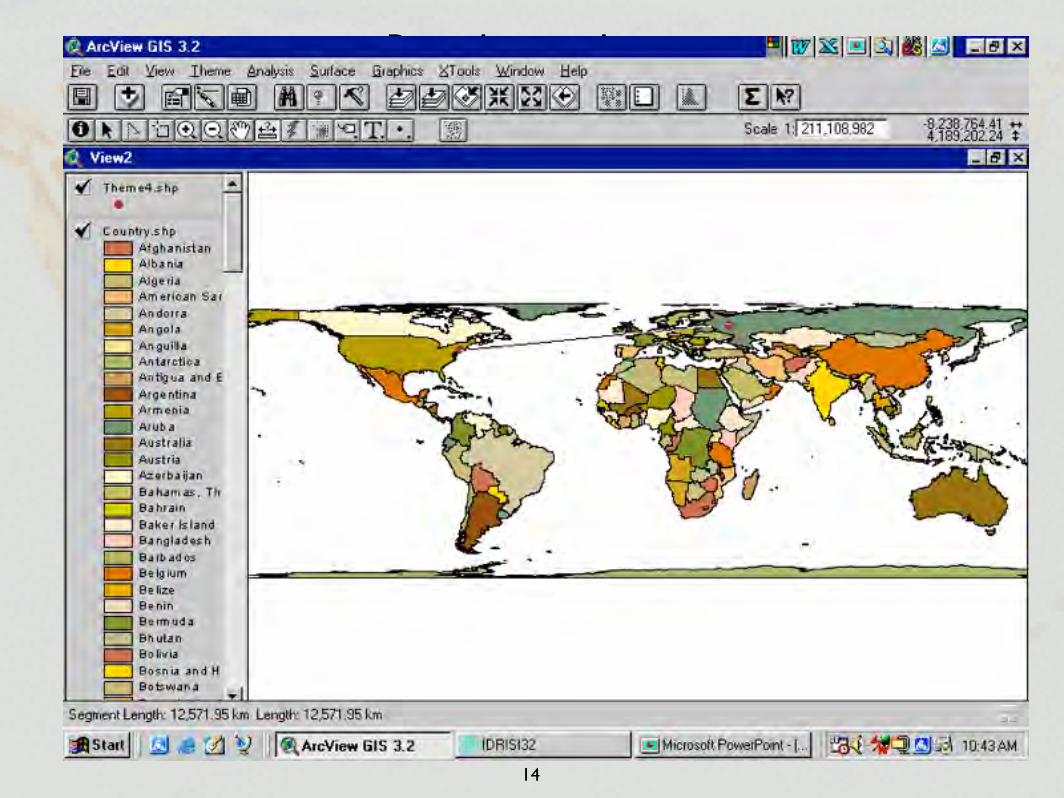
Measurements and Directions! Extracts measurements of distance, area, perimeter, direction, and
shape given geometry, units, attributes, and behavior ! Connectivity, Flows, Proximity ! You’ve used these a lot in your labs ! Also should mention buffering as a common analysis tool ! Gotta know your data model
! Raster – Limited by resolution of the cell ! Vector – Potential for much higher accuracy than raster
! Network for directions
! Gotta know your georeferencing!!! ! Spherical vs. planar
! Nautical mile (includes curvature of earth) 1.151 miles vs. mile ! Datum, Projection, Coordinate System?...Reference Units? ! Grid North, Magnetic North, or True North? ! Gotta be able to do conversions for units ! These are a really big deal, and where problems can occur
Dataanalys, Thomas Gumbricht, 2007
Rumsliga analyser
13
Rumsliga analyser
14

Rumsliga analyser
15
Rumsliga analyser
16
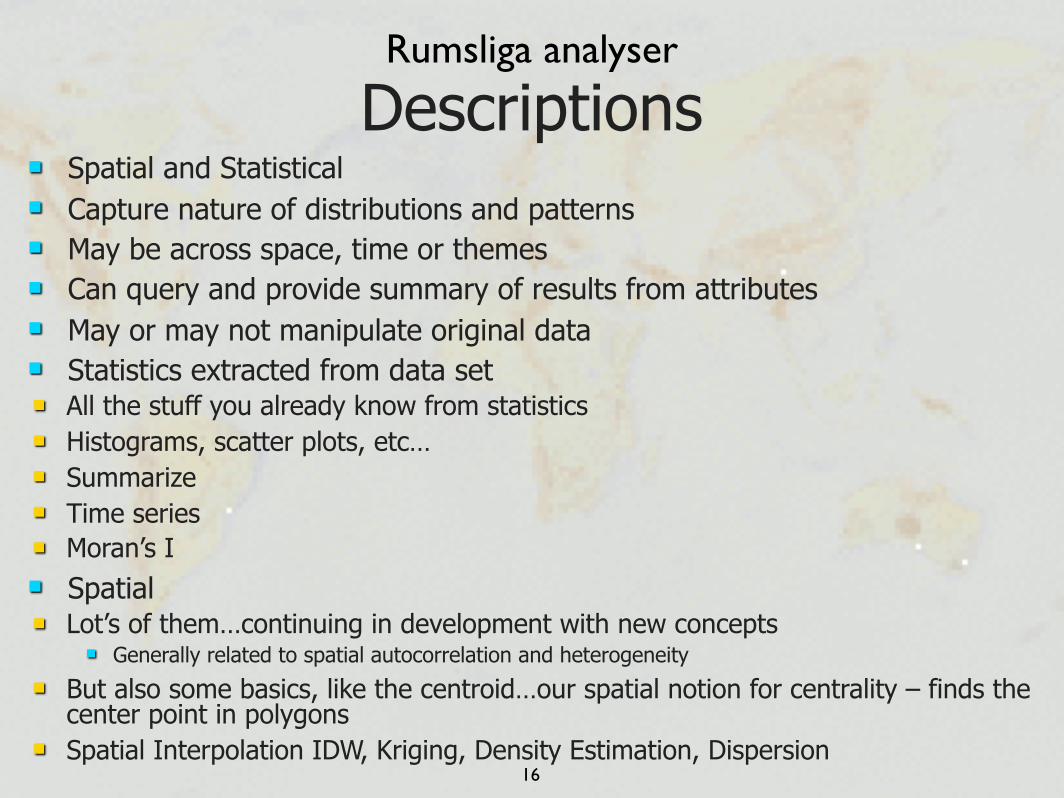
Descriptions! Spatial and Statistical ! Capture nature of distributions and patterns ! May be across space, time or themes ! Can query and provide summary of results from attributes ! May or may not manipulate original data ! Statistics extracted from data set ! All the stuff you already know from statistics ! Histograms, scatter plots, etc… ! Summarize ! Time series ! Moran’s I ! Spatial ! Lot’s of them…continuing in development with new concepts
! Generally related to spatial autocorrelation and heterogeneity ! But also some basics, like the centroid…our spatial notion for centrality – finds the
center point in polygons ! Spatial Interpolation IDW, Kriging, Density Estimation, Dispersion
Rumsliga analyser
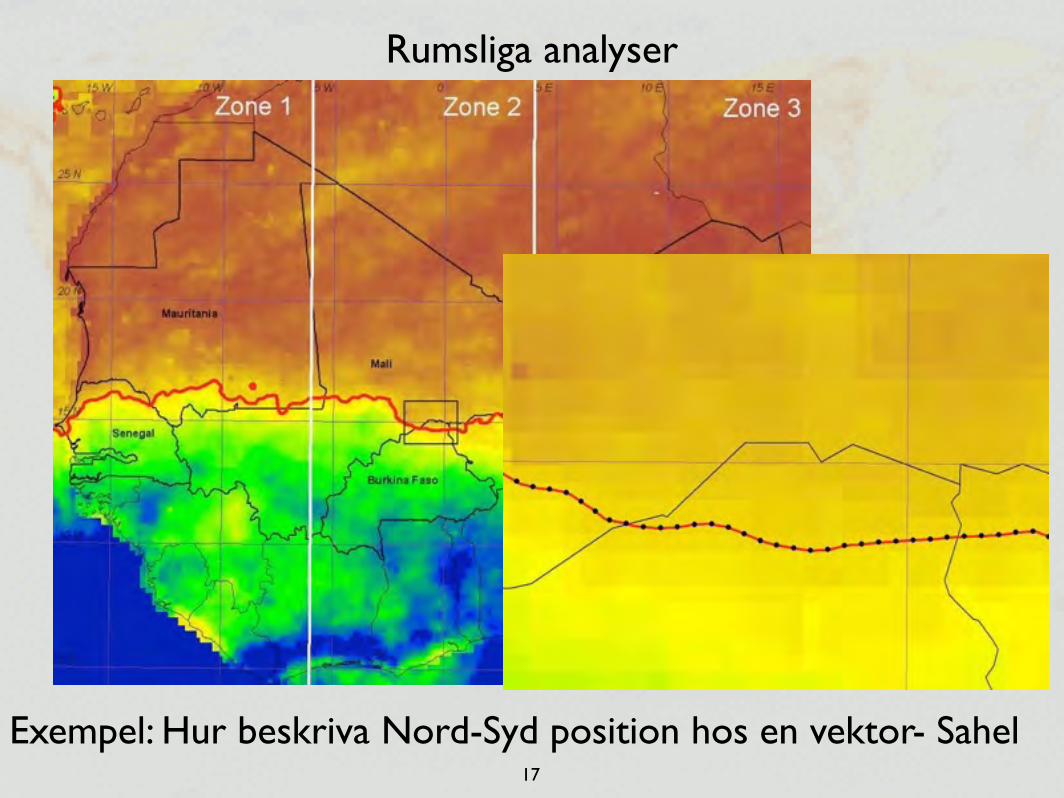
17
Exempel: Hur beskriva Nord-Syd position hos en vektor- Sahel
Geometriska vektoroperationer
18
Beräkning av längdaxel och riktning
Exempel Okavango
Dataanalys, Thomas Gumbricht, 2007

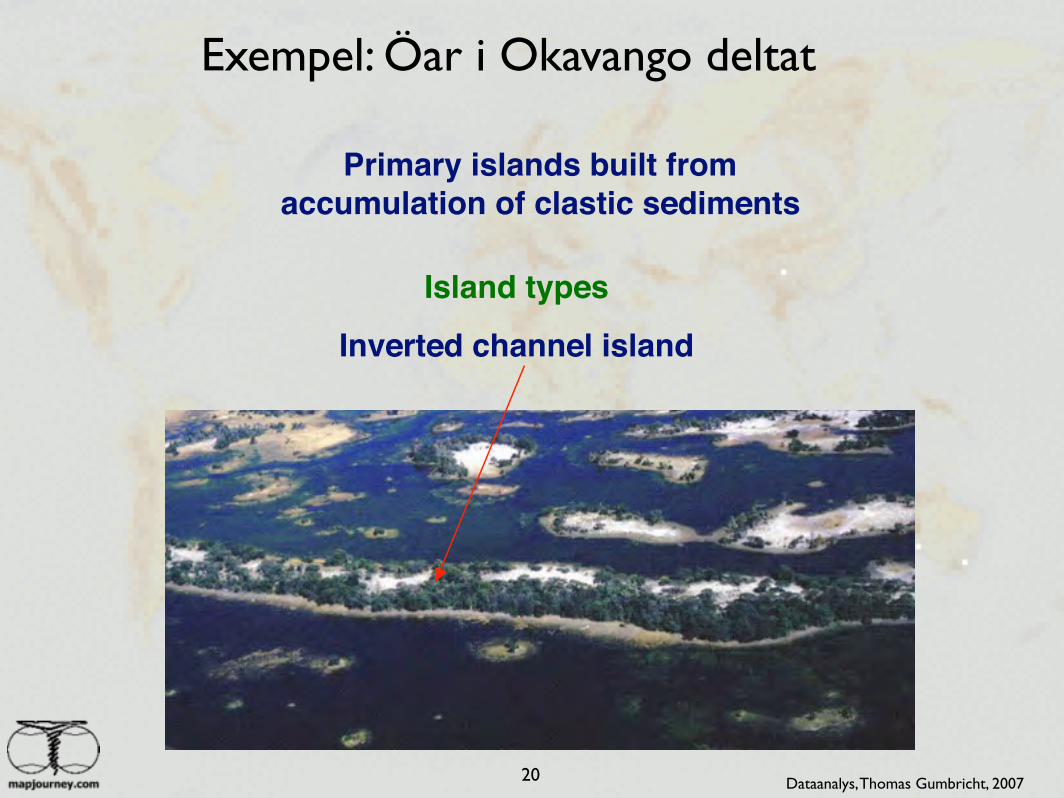
Exempel: Öar i Okavango deltat
19 Dataanalys, Thomas Gumbricht, 2007
Exempel: Öar i Okavango deltat
20
Island types
Inverted channel island
Primary islands built from accumulation of clastic sediments
Dataanalys, Thomas Gumbricht, 2007

Exempel: Öar i Okavango deltat
21
Island types
Scroll bar island
Primary islands built from accumulation of clastic sediments
Dataanalys, Thomas Gumbricht, 2007
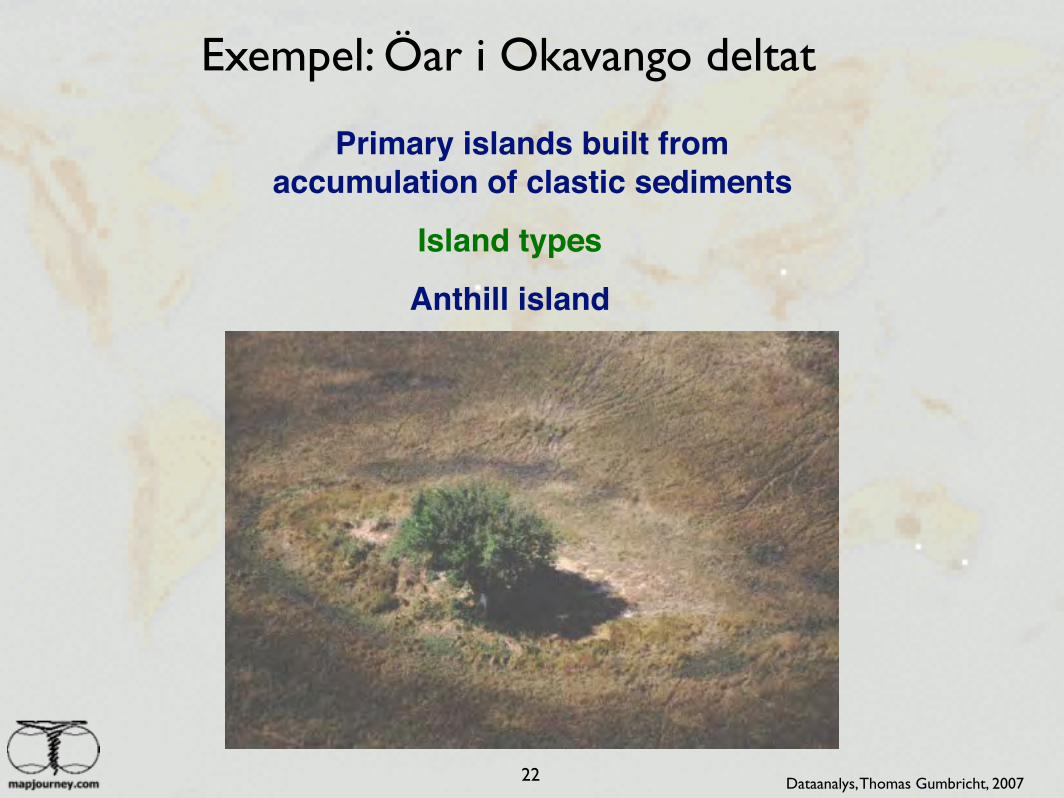
Exempel: Öar i Okavango deltat
22
Island types
Anthill island
Primary islands built from accumulation of clastic sediments
Dataanalys, Thomas Gumbricht, 2007
Exempel: Öar i Okavango deltat
23
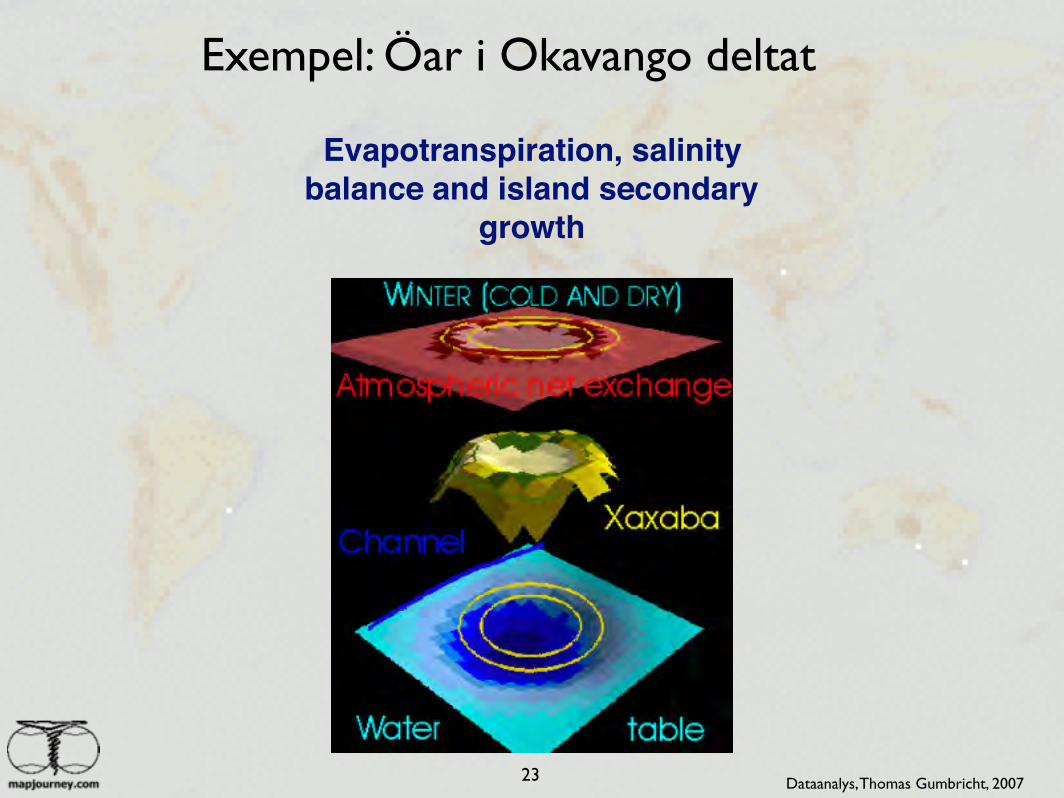
Evapotranspiration, salinity balance and island secondary
growth
Dataanalys, Thomas Gumbricht, 2007
Exempel: Öar i Okavango deltat
24
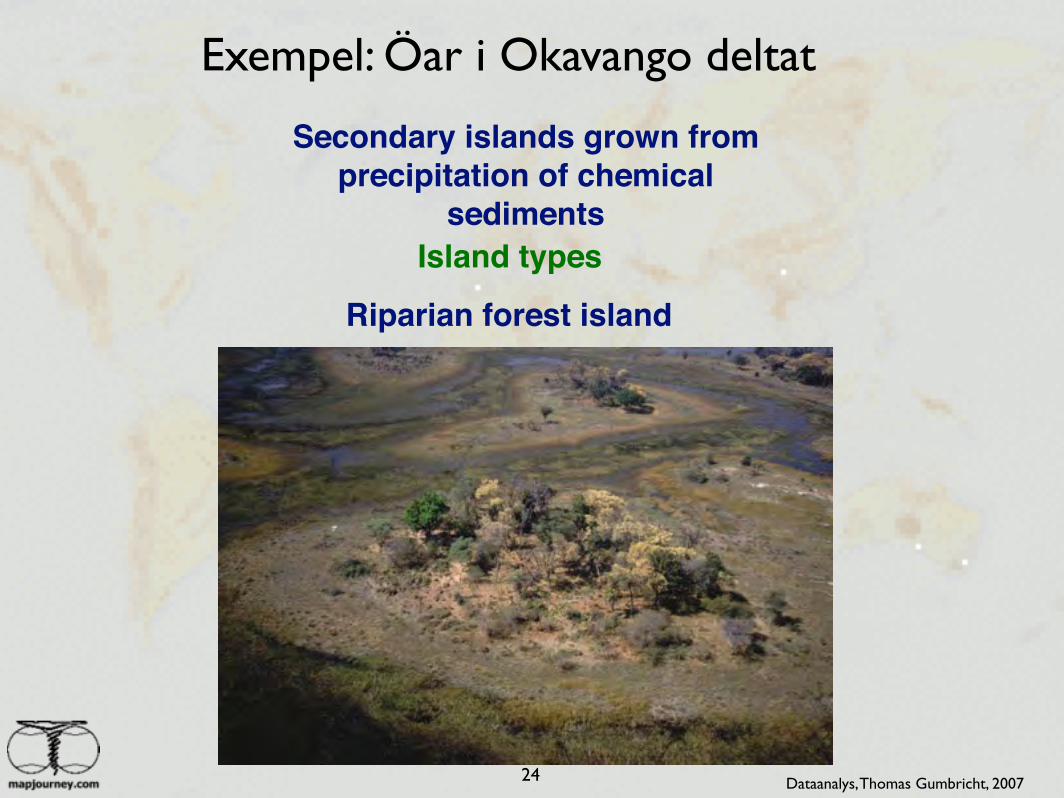
Island types
Riparian forest island
Secondary islands grown from precipitation of chemical
sediments
Dataanalys, Thomas Gumbricht, 2007

Exempel: Öar i Okavango deltat
25
Island types
Salt island
Secondary islands grown from precipitation of chemical
sediments
Dataanalys, Thomas Gumbricht, 2007
Exempel: Öar i Okavango deltat
26
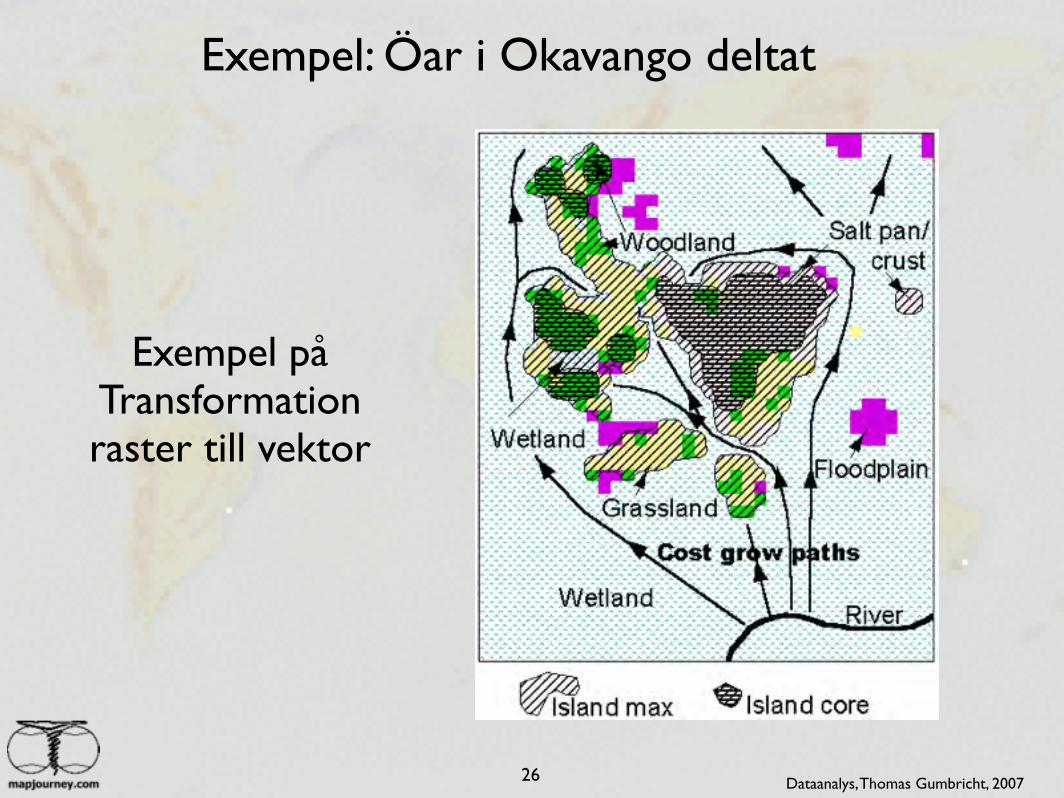
Exempel på Transformationraster till vektor
Dataanalys, Thomas Gumbricht, 2007
Exempel: Öar i Okavango deltat
27
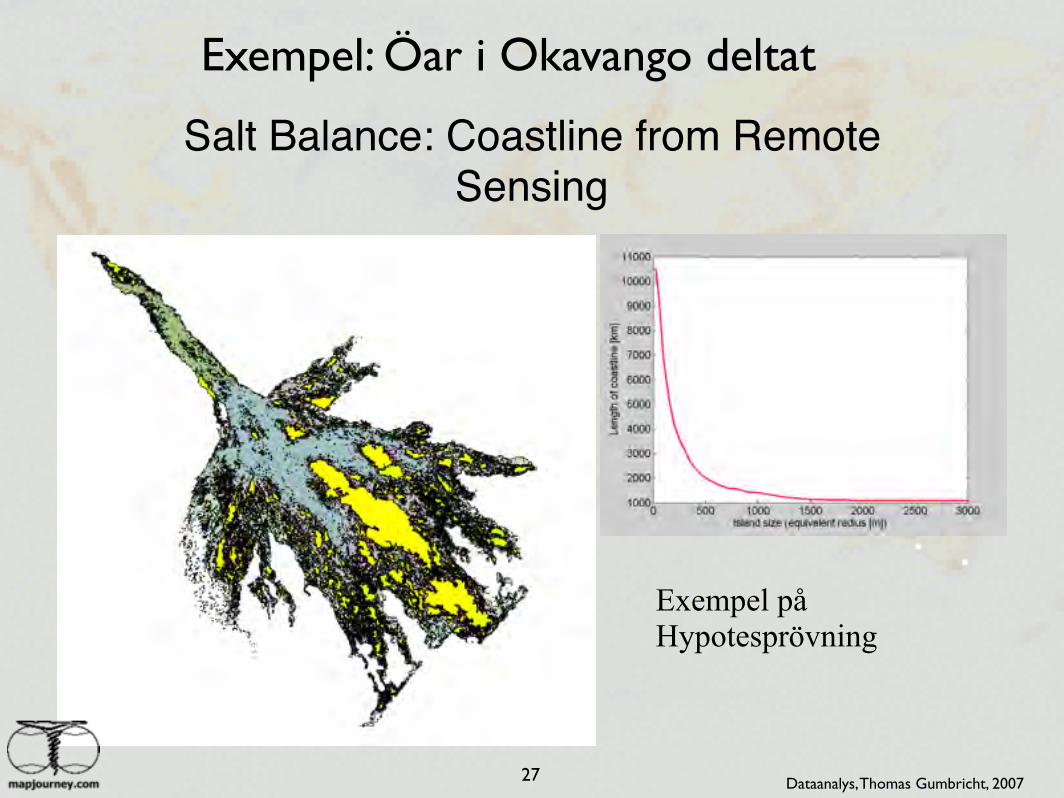
Salt Balance: Coastline from Remote Sensing
Exempel på Hypotesprövning
Dataanalys, Thomas Gumbricht, 2007
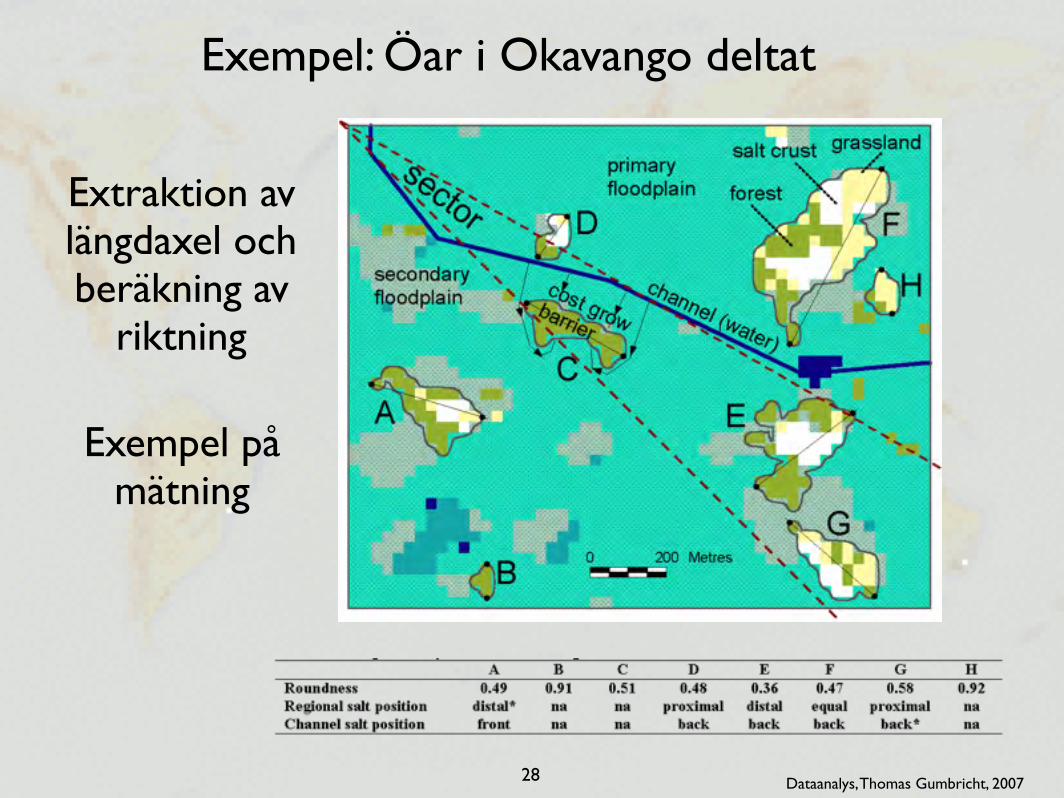
Exempel: Öar i Okavango deltat
28
Extraktion av längdaxel och beräkning av
riktning
Exempel påmätning
Dataanalys, Thomas Gumbricht, 2007
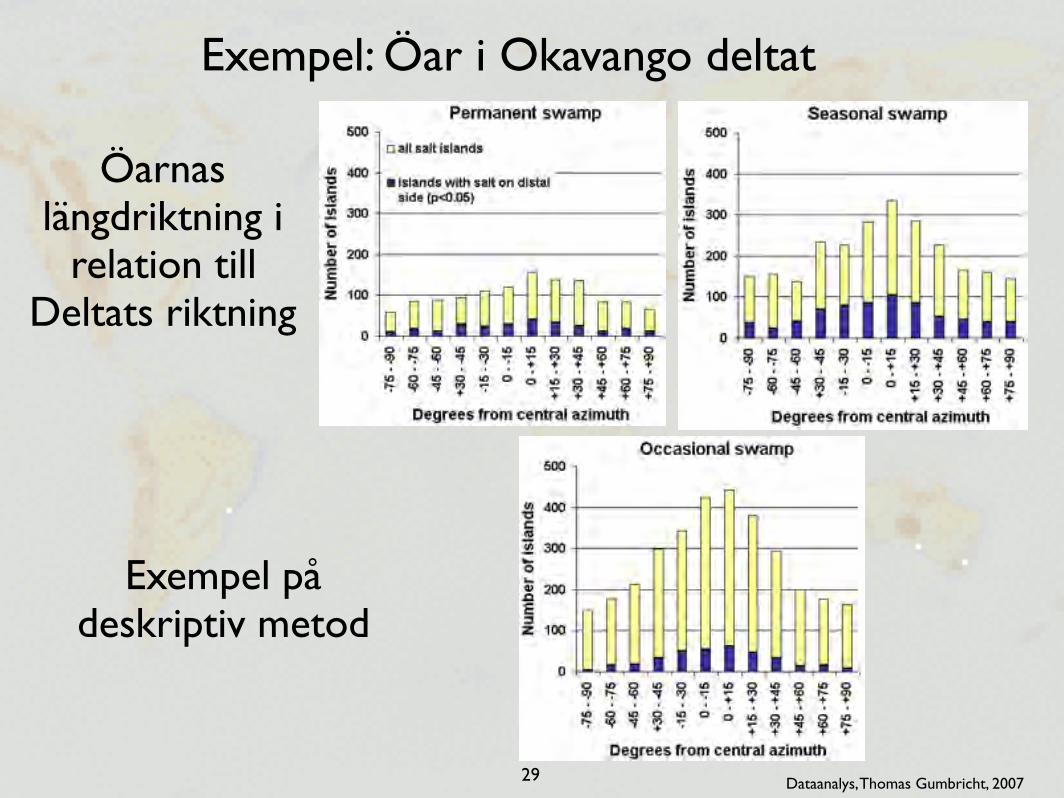
Exempel: Öar i Okavango deltat
29
Öarnas längdriktning i
relation till Deltats riktning
Exempel på deskriptiv metod
Dataanalys, Thomas Gumbricht, 2007
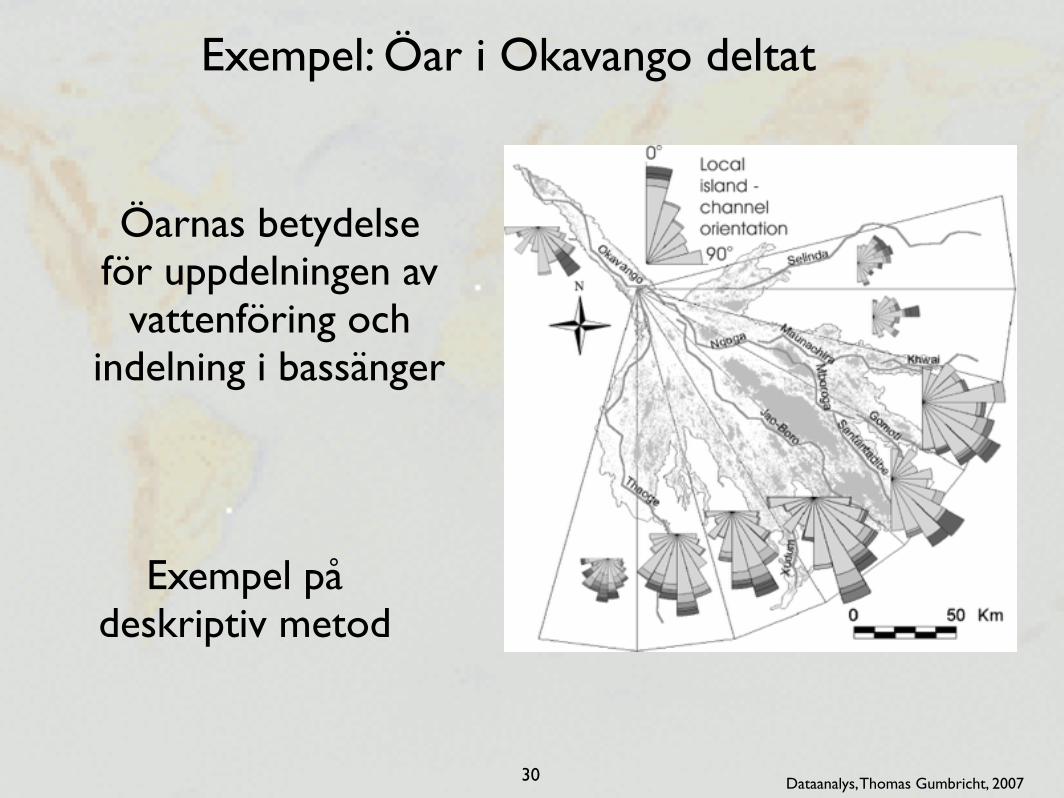
Exempel: Öar i Okavango deltat
30
Öarnas betydelse för uppdelningen av
vattenföring och indelning i bassänger
Exempel på deskriptiv metod
Dataanalys, Thomas Gumbricht, 2007
Geometriska vektoranalyser
31 Dataanalys, Thomas Gumbricht, 2007
Geometriska vektoroperationer
32
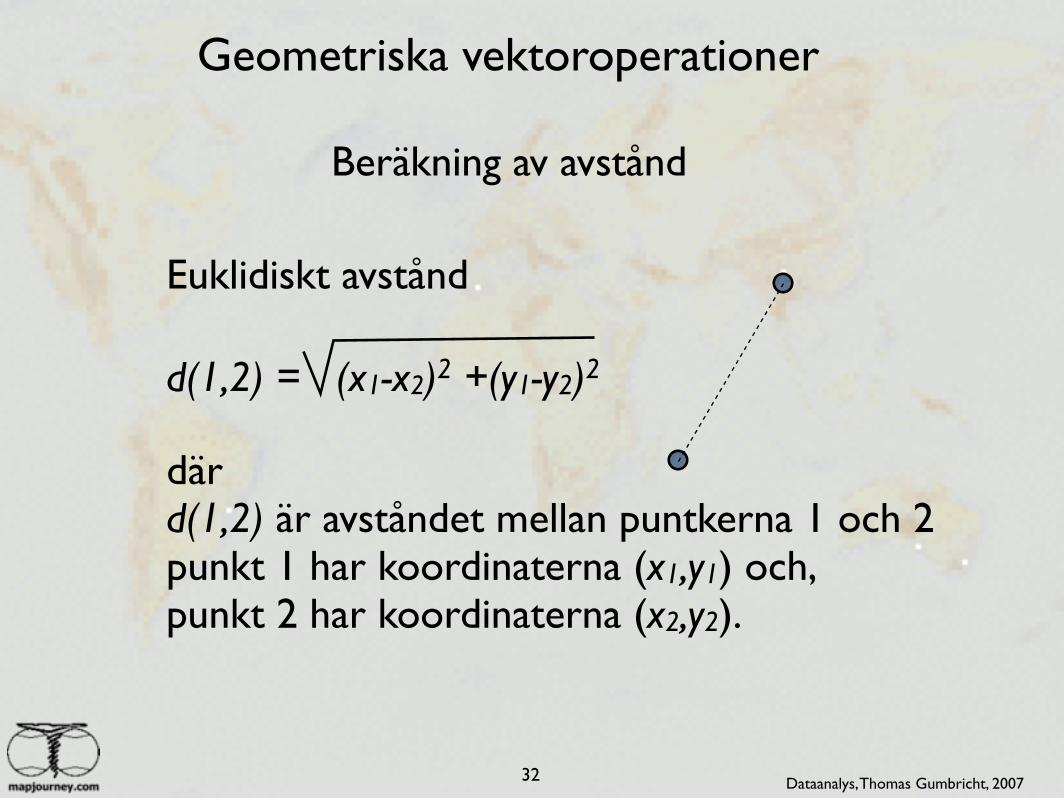
Beräkning av avstånd
Euklidiskt avstånd
d(1,2) = (x1-x2)2 +(y1-y2)2
därd(1,2) är avståndet mellan puntkerna 1 och 2punkt 1 har koordinaterna (x1,y1) och,punkt 2 har koordinaterna (x2,y2).
Dataanalys, Thomas Gumbricht, 2007
Geometriska vektoroperationer
33
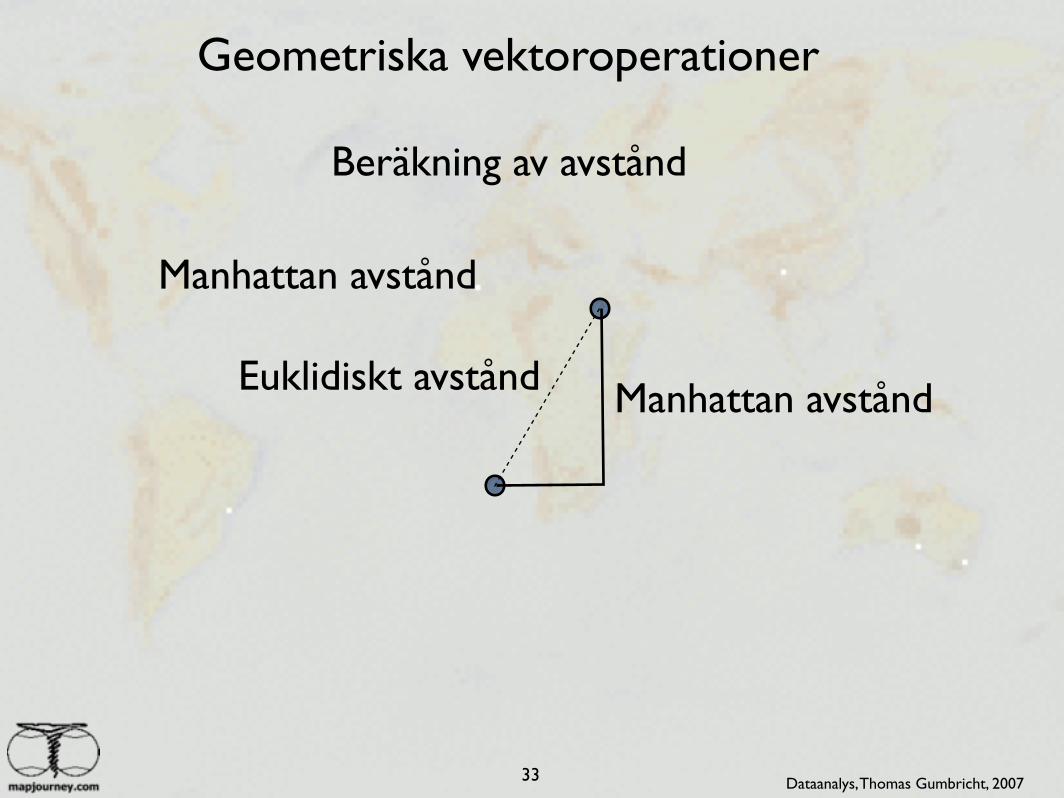
Beräkning av avstånd
Manhattan avstånd
Euklidiskt avstånd Manhattan avstånd
Dataanalys, Thomas Gumbricht, 2007
Geometriska vektoroperationer
34
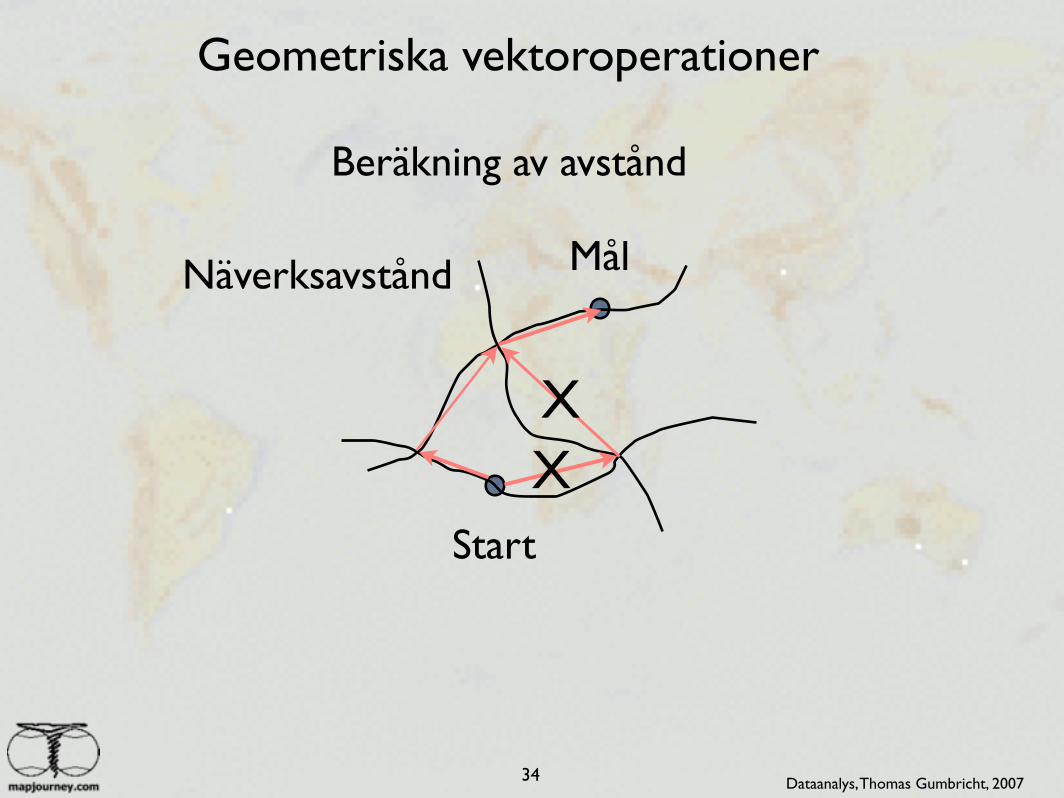
Beräkning av avstånd
Näverksavstånd
Start
Mål
XX
Dataanalys, Thomas Gumbricht, 2007
Geometriska vektoroperationer
35
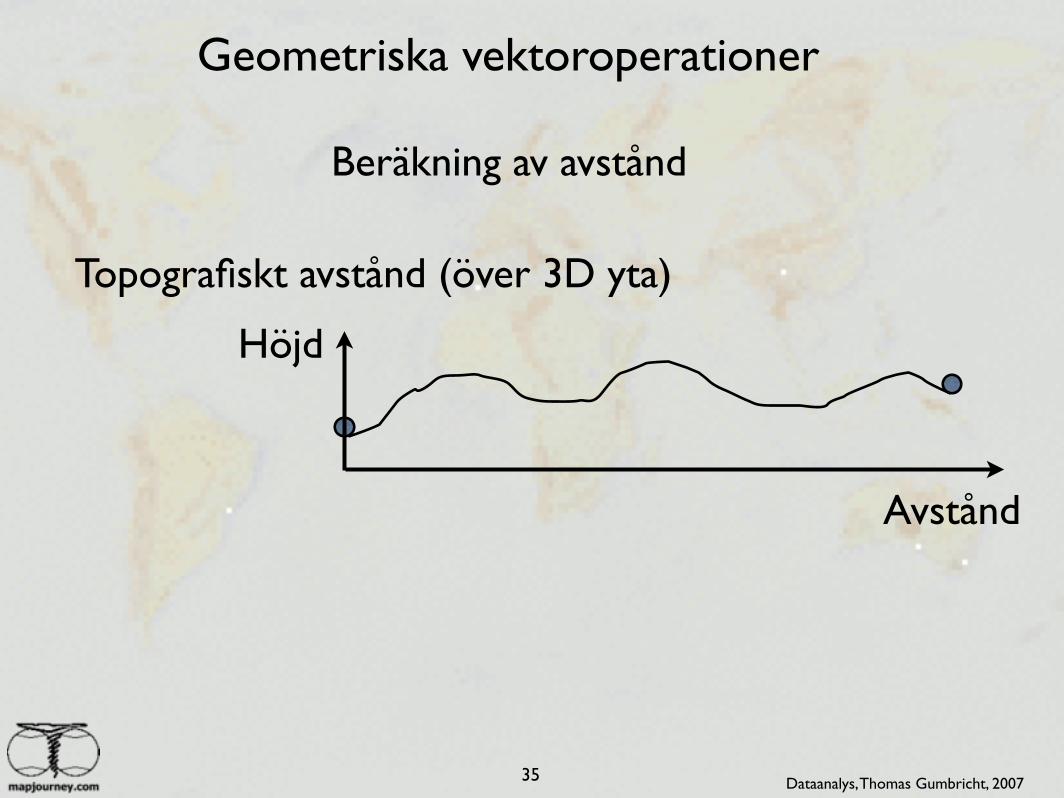
Beräkning av avstånd
Topografiskt avstånd (över 3D yta)
Avstånd
Höjd
Dataanalys, Thomas Gumbricht, 2007

Geometriska vektoroperationer
36
Beräkning av avstånd
Sfärsikt avstånd (med hänsyn till jordyans rundning)
Dataanalys, Thomas Gumbricht, 2007
Nätverk
37 Dataanalys, Thomas Gumbricht, 2007
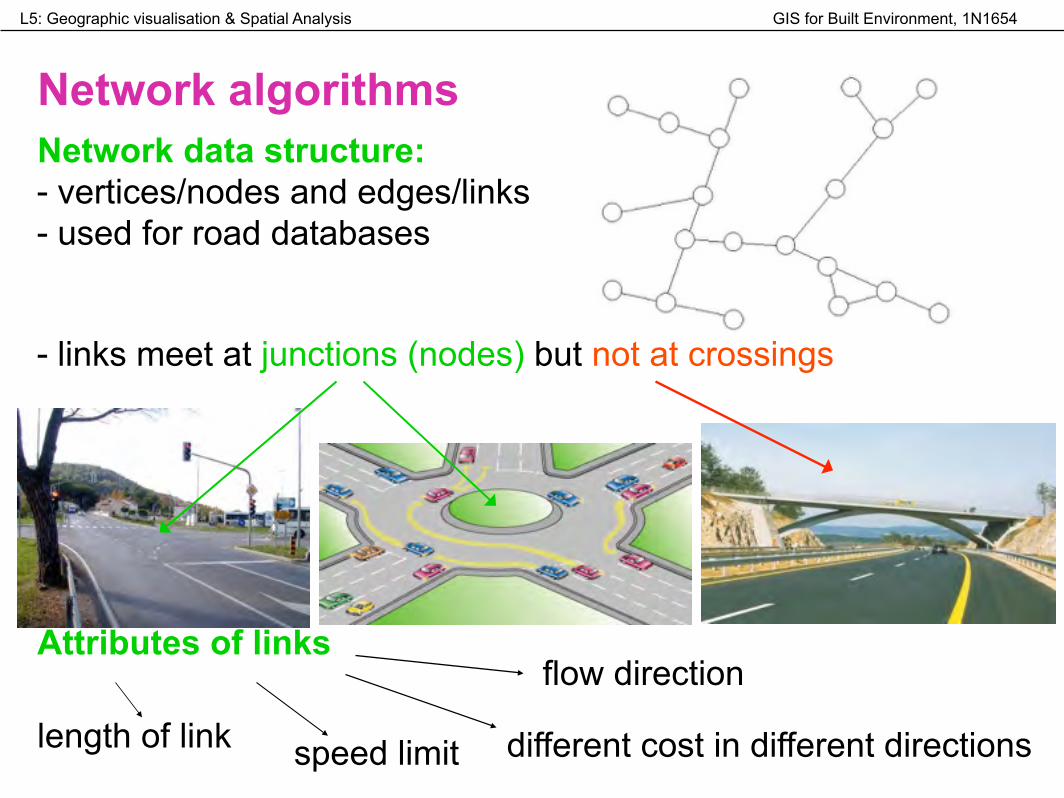
GIS for Built Environment, 1N1654L5: Geographic visualisation & Spatial Analysis
Network algorithmsNetwork data structure: - vertices/nodes and edges/links - used for road databases
- links meet at junctions (nodes) but not at crossings
Attributes of links
length of link speed limit different cost in different directions
flow direction
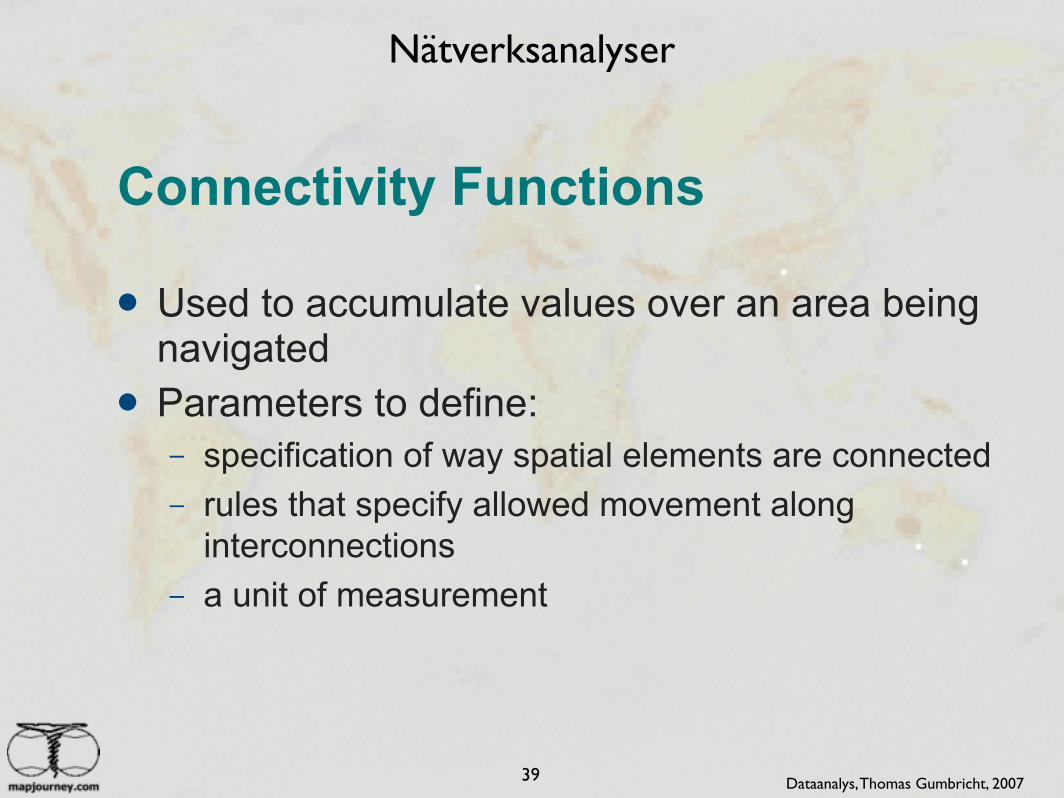
Nätverksanalyser
39
Connectivity Functions
" Used to accumulate values over an area being navigated
" Parameters to define: – specification of way spatial elements are connected – rules that specify allowed movement along
interconnections – a unit of measurement
Dataanalys, Thomas Gumbricht, 2007
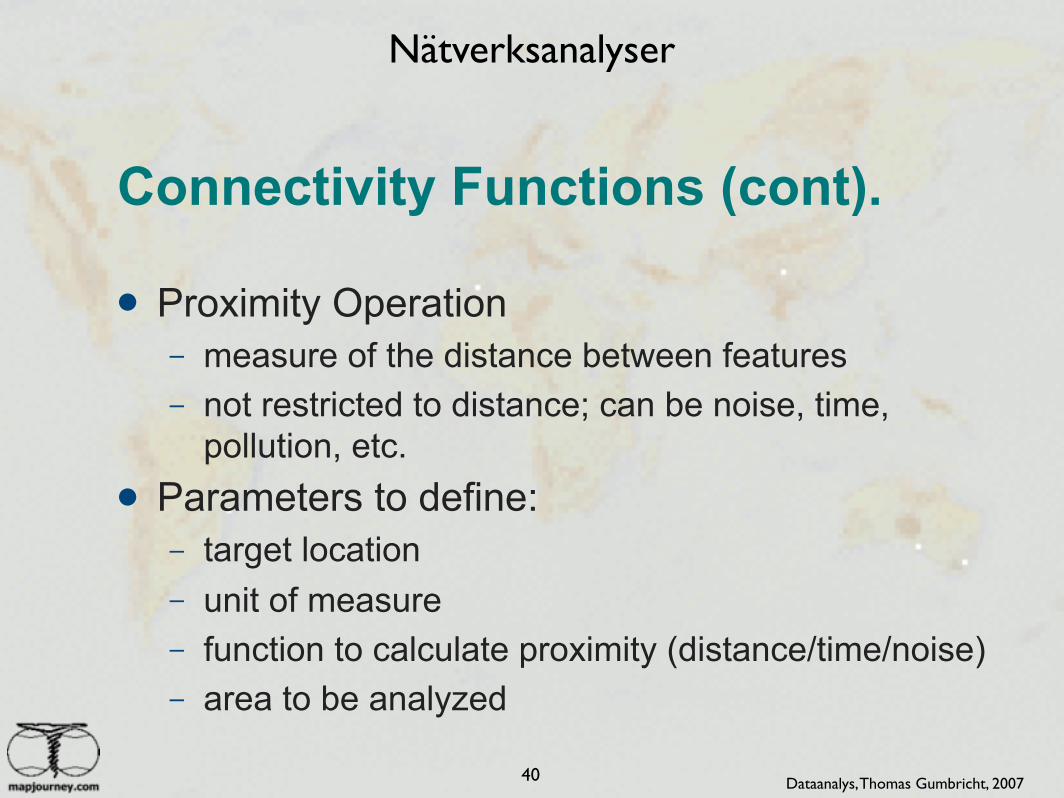
Nätverksanalyser
40
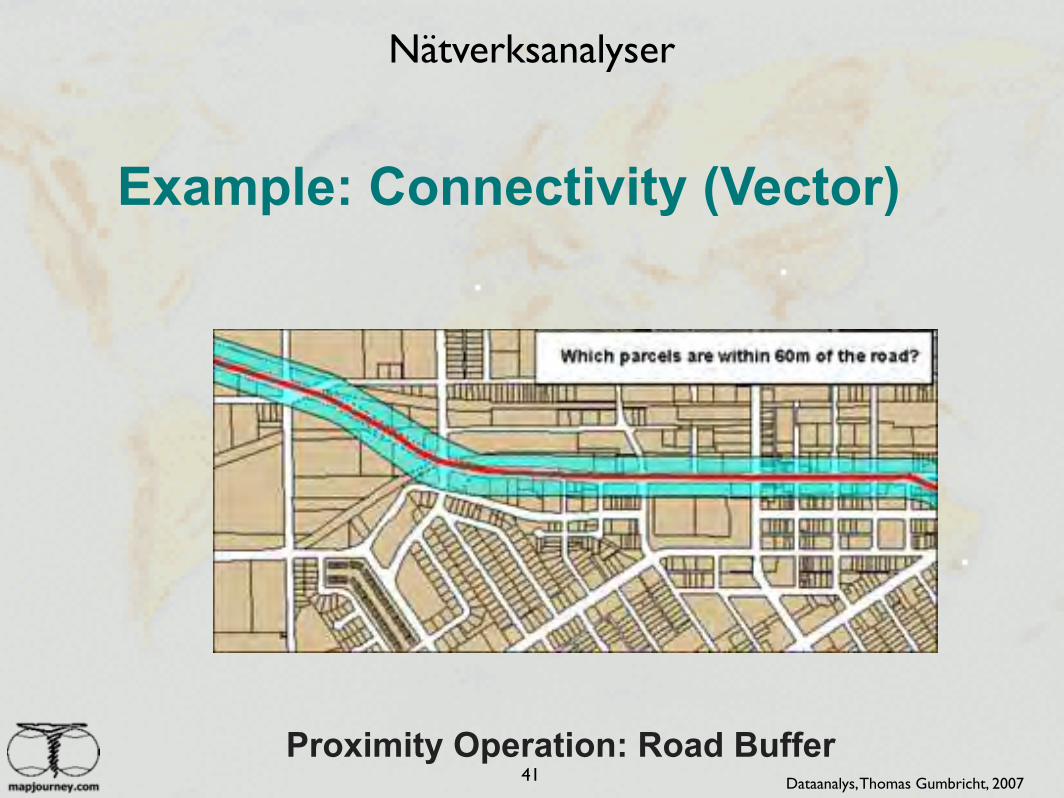
Connectivity Functions (cont).
" Proximity Operation – measure of the distance between features – not restricted to distance; can be noise, time,
pollution, etc. " Parameters to define:
– target location – unit of measure – function to calculate proximity (distance/time/noise) – area to be analyzed
Dataanalys, Thomas Gumbricht, 2007
Nätverksanalyser
41
Example: Connectivity (Vector)
Proximity Operation: Road BufferDataanalys, Thomas Gumbricht, 2007
Nätverksanalyser
42
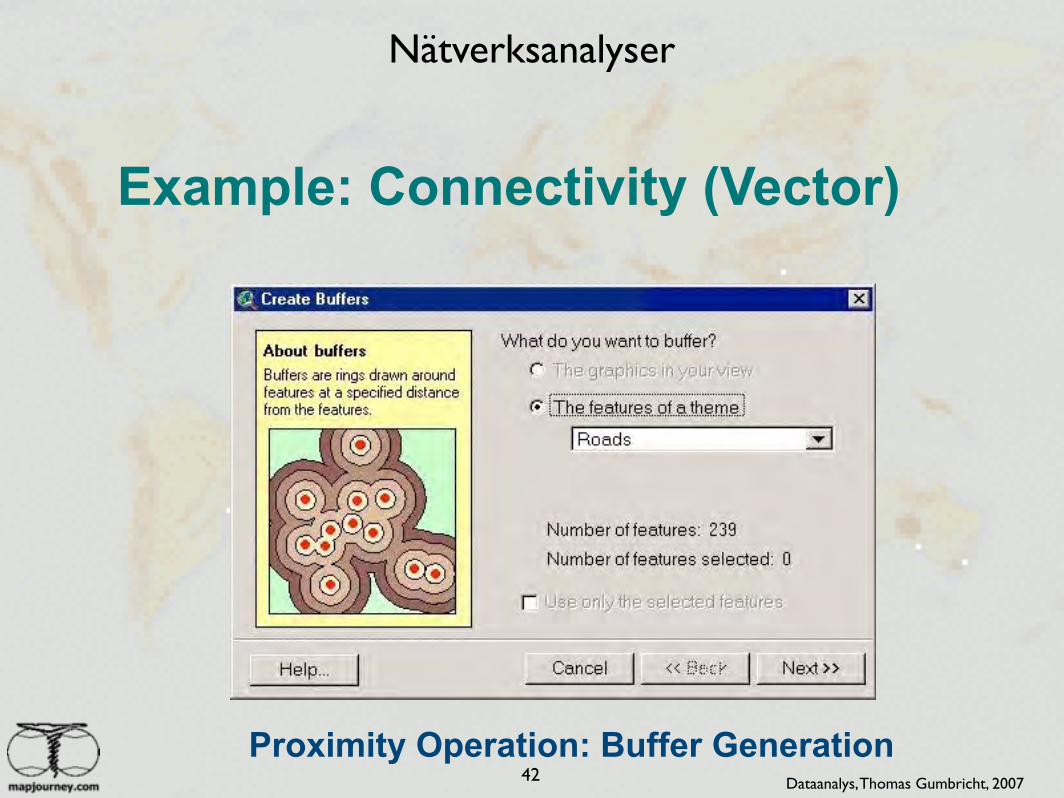
Example: Connectivity (Vector)
Proximity Operation: Buffer GenerationDataanalys, Thomas Gumbricht, 2007
Nätverksanalyser
43
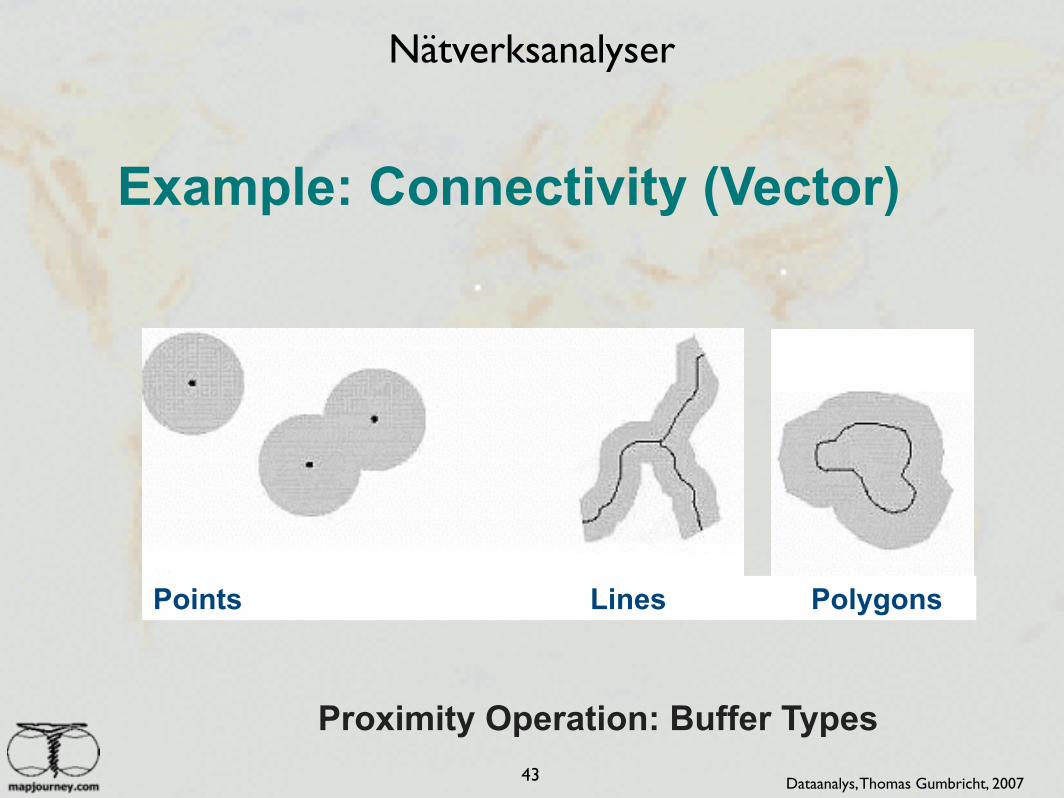
Example: Connectivity (Vector)
Proximity Operation: Buffer Types
Points Lines Polygons
Dataanalys, Thomas Gumbricht, 2007
Nätverksanalyser
44
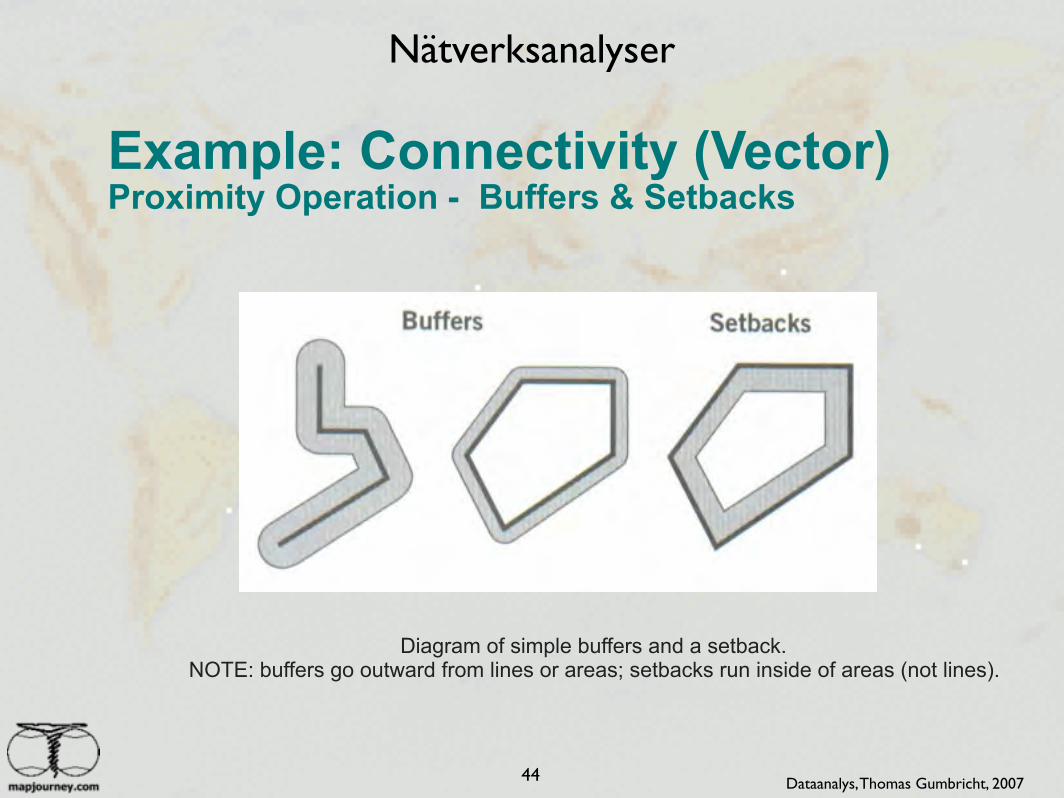
Diagram of simple buffers and a setback. NOTE: buffers go outward from lines or areas; setbacks run inside of areas (not lines).
Example: Connectivity (Vector) Proximity Operation - Buffers & Setbacks
Dataanalys, Thomas Gumbricht, 2007
Nätverksanalyser
45
Connectivity Functions (cont).
" Contiguity Operation – spatial units are connected - defines “unbroken area” " Contiguity measures: – size of neighboring area(s) – shortest/longest straight line distance across adjacent
area(s) – specific shape of neighboring area(s)
Dataanalys, Thomas Gumbricht, 2007
Nätverksanalyser
46
Connectivity Functions (cont).
" Network Operations – set of interconnected lines that represent a set of
features through which resources flow " Common network functions – shortest path problem (route optimization) – location-allocation modeling (resource allocation) – traveling salesperson problem (route optimization) – route tracing (prediction of network loading)
Dataanalys, Thomas Gumbricht, 2007
Nätverksanalyser
47
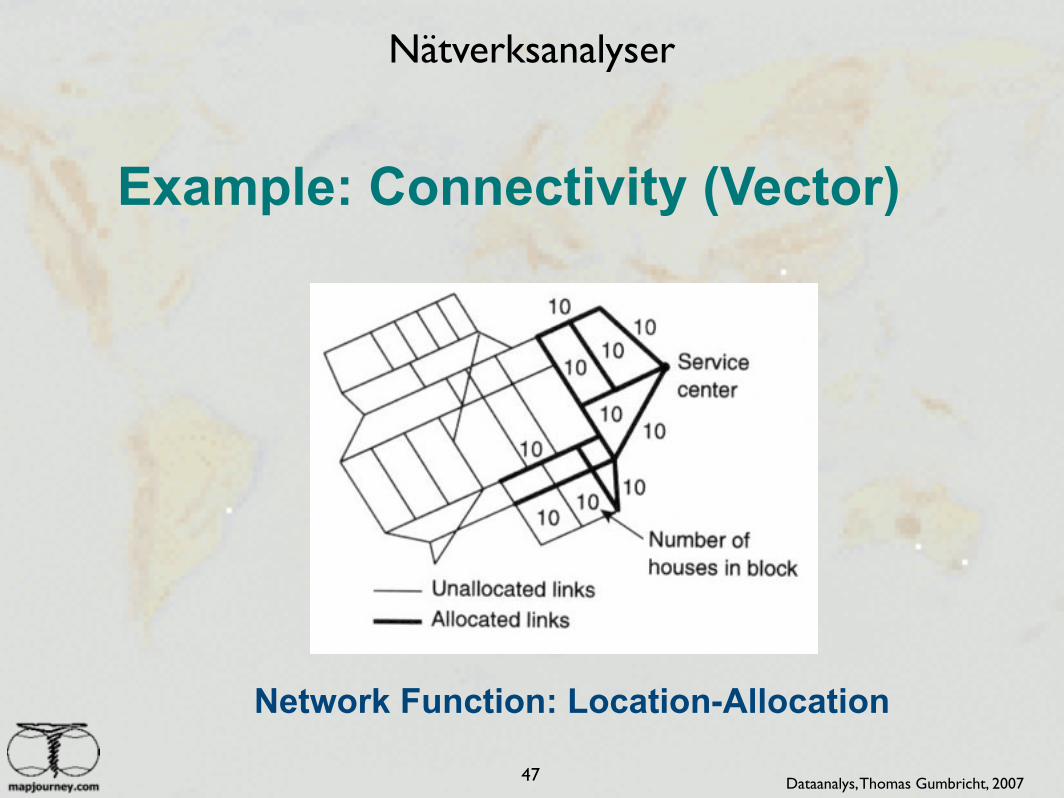
Example: Connectivity (Vector)
Network Function: Location-Allocation
Dataanalys, Thomas Gumbricht, 2007
Nätverksanalyser
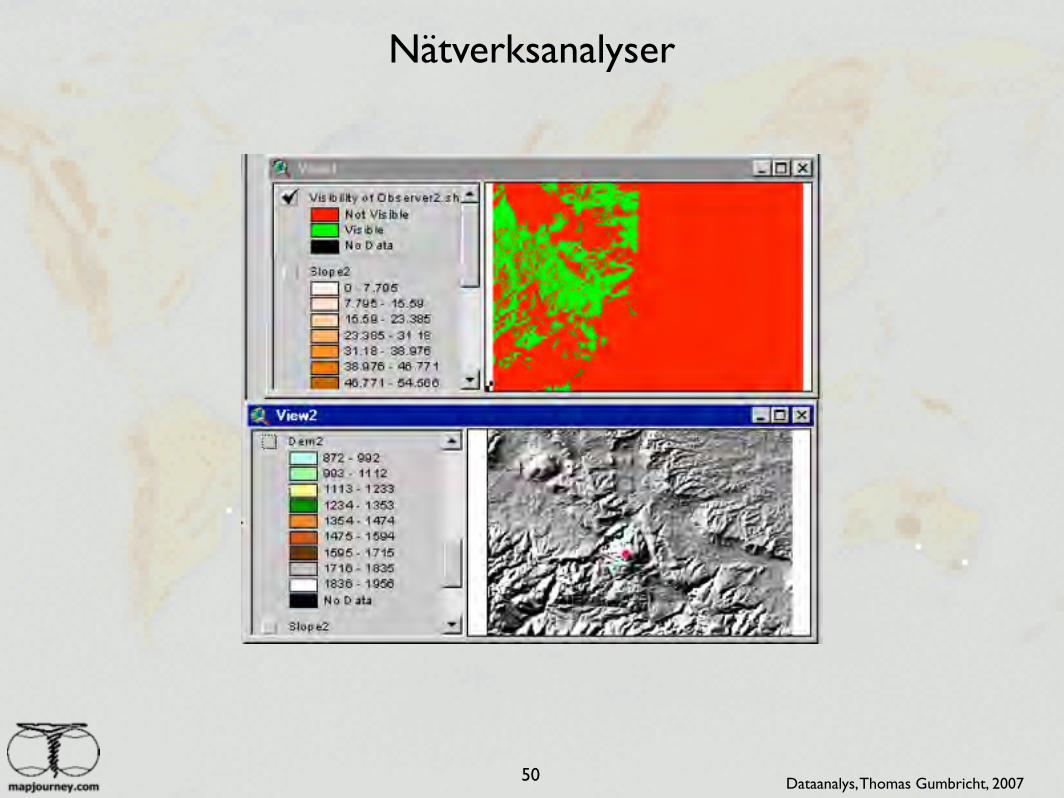
48
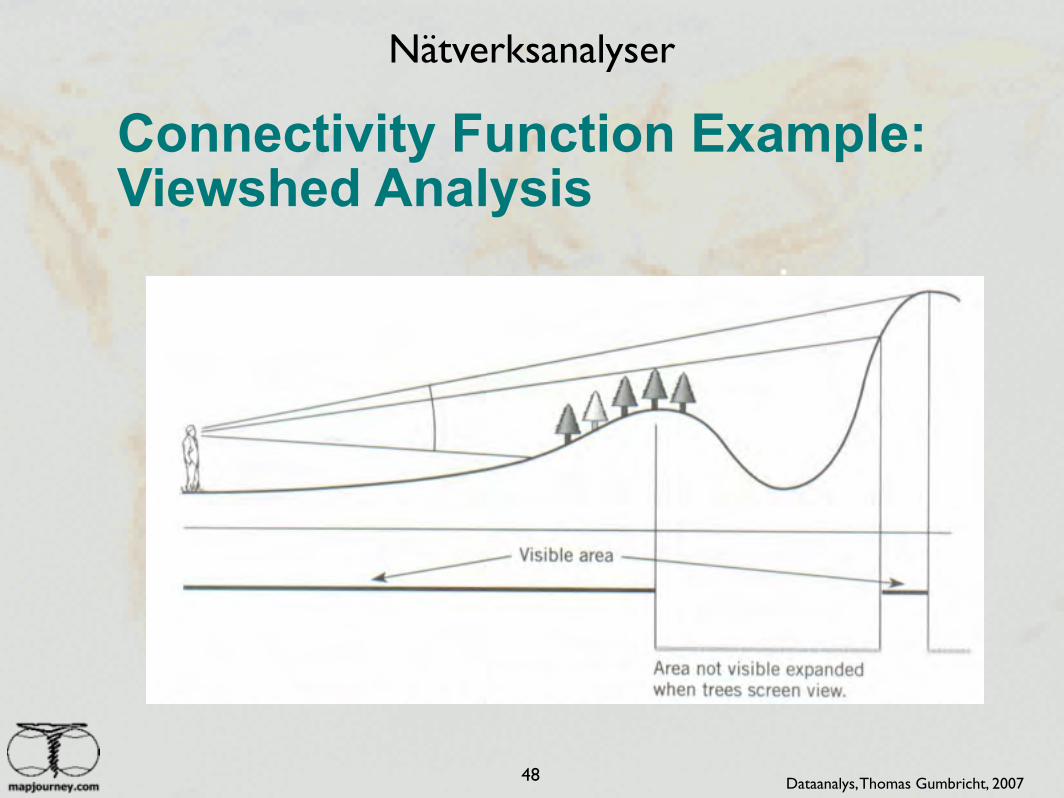
Connectivity Function Example:Viewshed Analysis
Dataanalys, Thomas Gumbricht, 2007
Nätverksanalyser
49
Connectivity Functions (cont).
" Visibility Analysis Operations – identification of areas of terrain that can be seen from a
particular point on the surface " Viewshed Operation – uses digital elevation model data (DEMs) or..... – digital terrain model data (DTMs) or...... – triangulated irregular network data (TINs)?
Dataanalys, Thomas Gumbricht, 2007
Nätverksanalyser
50 Dataanalys, Thomas Gumbricht, 2007
GIS for Built Environment, 1N1654L5: Geographic visualisation & Spatial Analysis
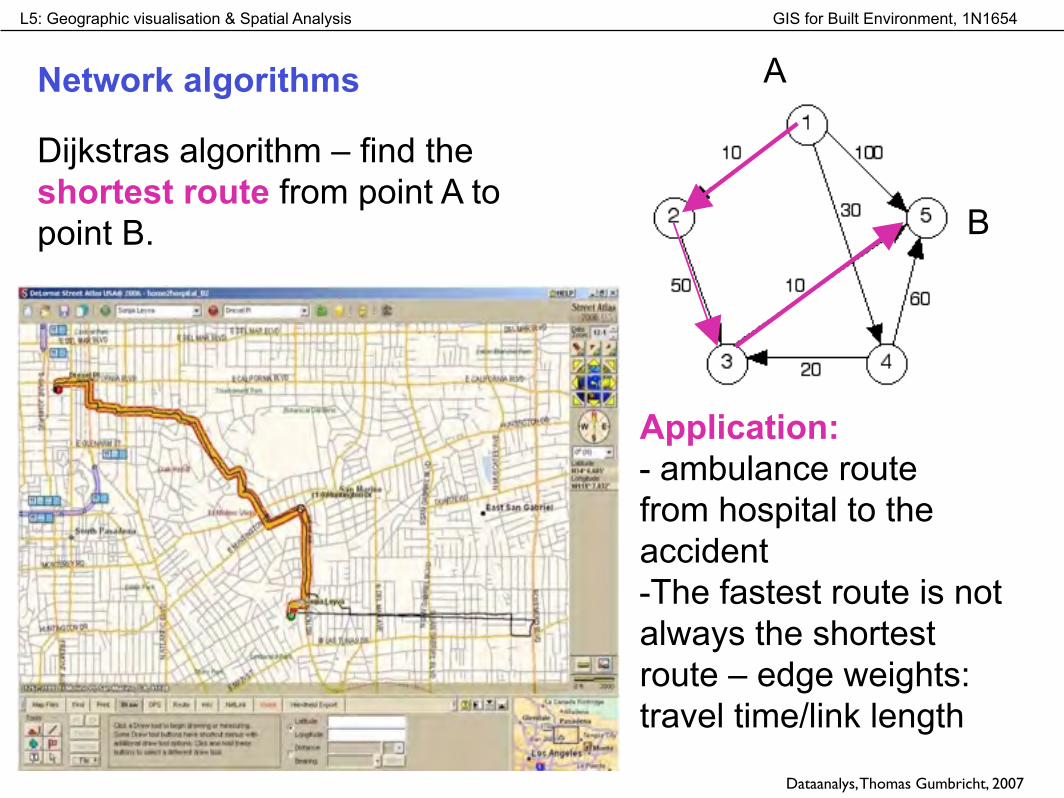
Dijkstras algorithm – find the shortest route from point A to point B.
Network algorithms A
B
Application: - ambulance route from hospital to the accident -The fastest route is not always the shortest route – edge weights: travel time/link length
Dataanalys, Thomas Gumbricht, 2007
GIS for Built Environment, 1N1654L5: Geographic visualisation & Spatial Analysis
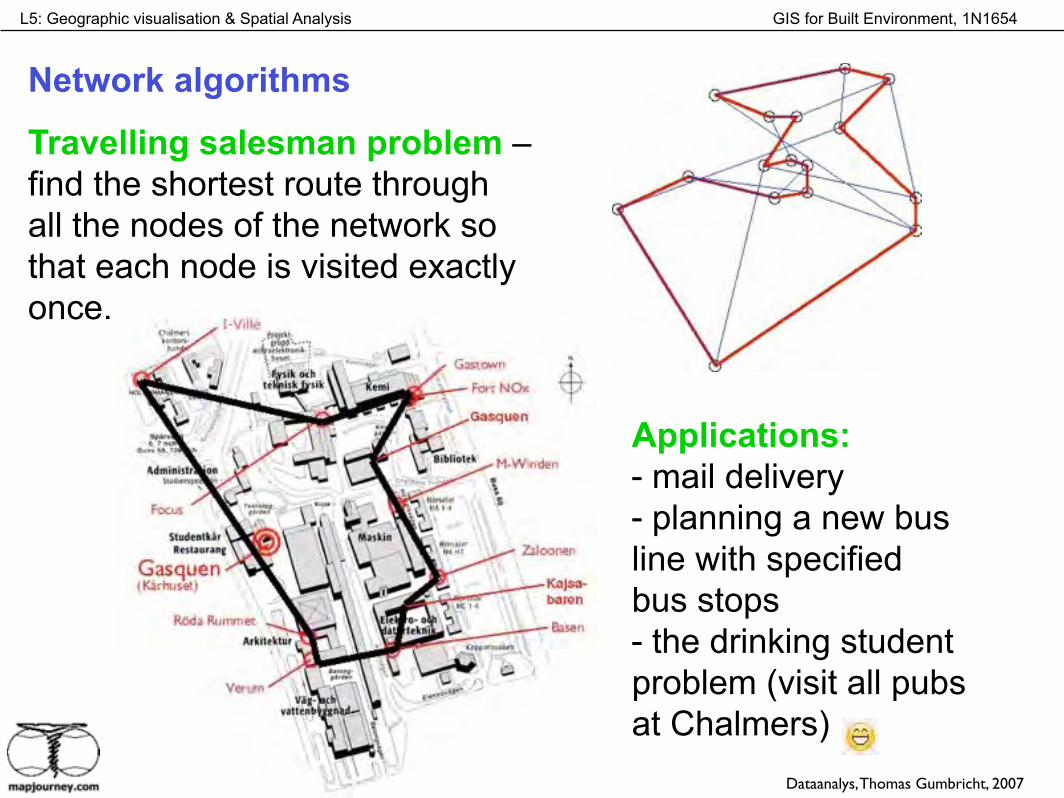
Network algorithms
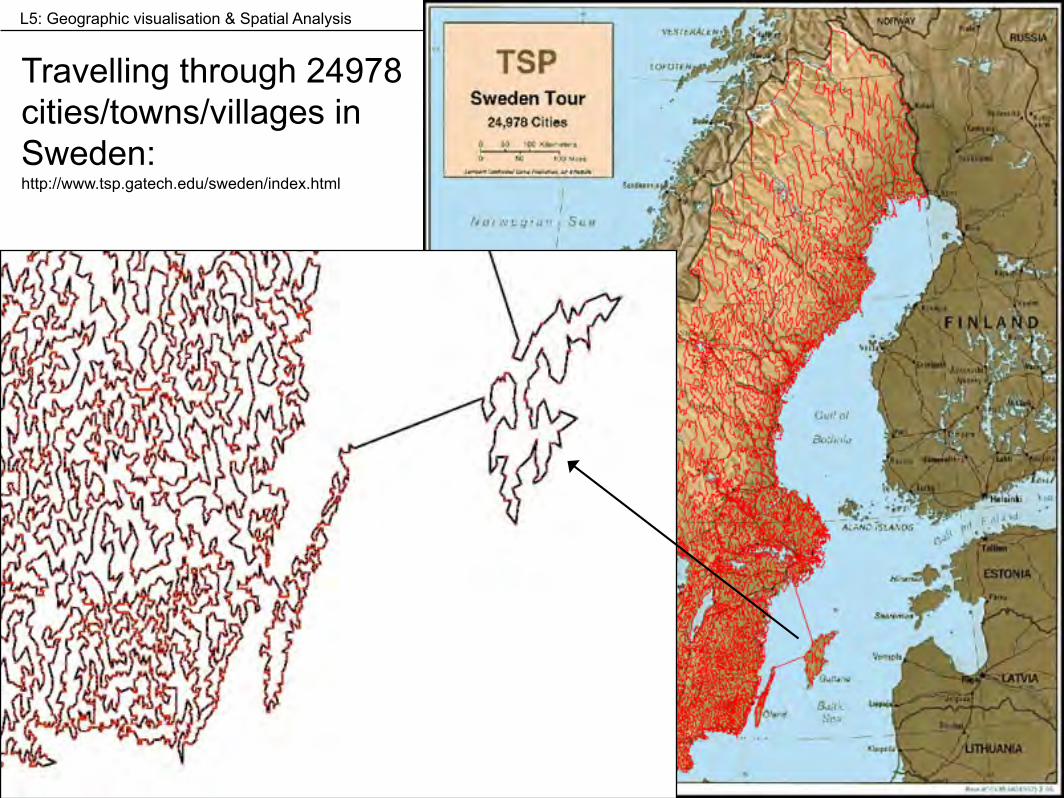
Travelling salesman problem – find the shortest route through all the nodes of the network so that each node is visited exactly once.
Applications: - mail delivery - planning a new bus line with specified bus stops - the drinking student problem (visit all pubs at Chalmers)
Dataanalys, Thomas Gumbricht, 2007
GIS for Built Environment, 1N1654L5: Geographic visualisation & Spatial Analysis
Travelling through 24978 cities/towns/villages in Sweden: http://www.tsp.gatech.edu/sweden/index.html
Nätverksanalys
54
Sammanflöden och bifurkationer
Exempel Okavango
Dataanalys, Thomas Gumbricht, 2007
55
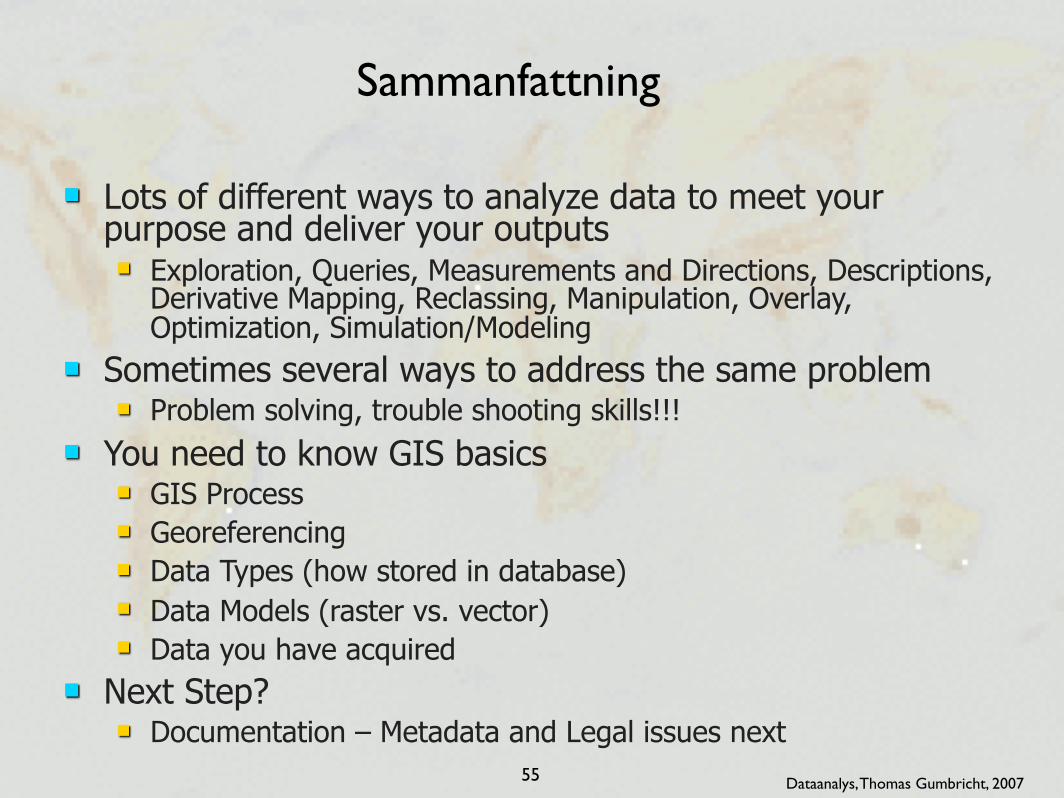
! Lots of different ways to analyze data to meet your purpose and deliver your outputs ! Exploration, Queries, Measurements and Directions, Descriptions,
Derivative Mapping, Reclassing, Manipulation, Overlay, Optimization, Simulation/Modeling
! Sometimes several ways to address the same problem ! Problem solving, trouble shooting skills!!!
! You need to know GIS basics ! GIS Process ! Georeferencing ! Data Types (how stored in database) ! Data Models (raster vs. vector) ! Data you have acquired
! Next Step? ! Documentation – Metadata and Legal issues next
Sammanfattning
Dataanalys, Thomas Gumbricht, 2007
“Data mining”
56 Dataanalys, Thomas Gumbricht, 2007
GIS for Built Environment, 1N1654L5: Geographic visualisation & Spatial Analysis
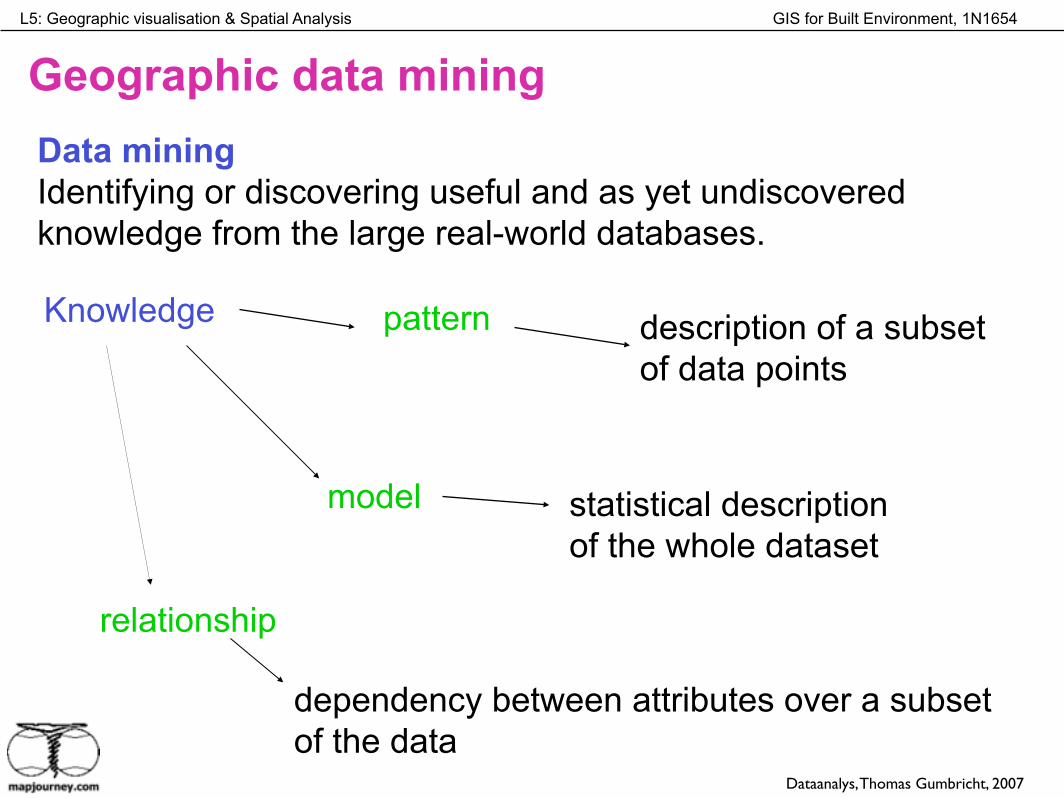
Data mining Identifying or discovering useful and as yet undiscovered knowledge from the large real-world databases.
Knowledge pattern
model
relationship
description of a subset of data points
statistical description of the whole dataset
dependency between attributes over a subset of the data
Geographic data mining
Dataanalys, Thomas Gumbricht, 2007
GIS for Built Environment, 1N1654L5: Geographic visualisation & Spatial Analysis
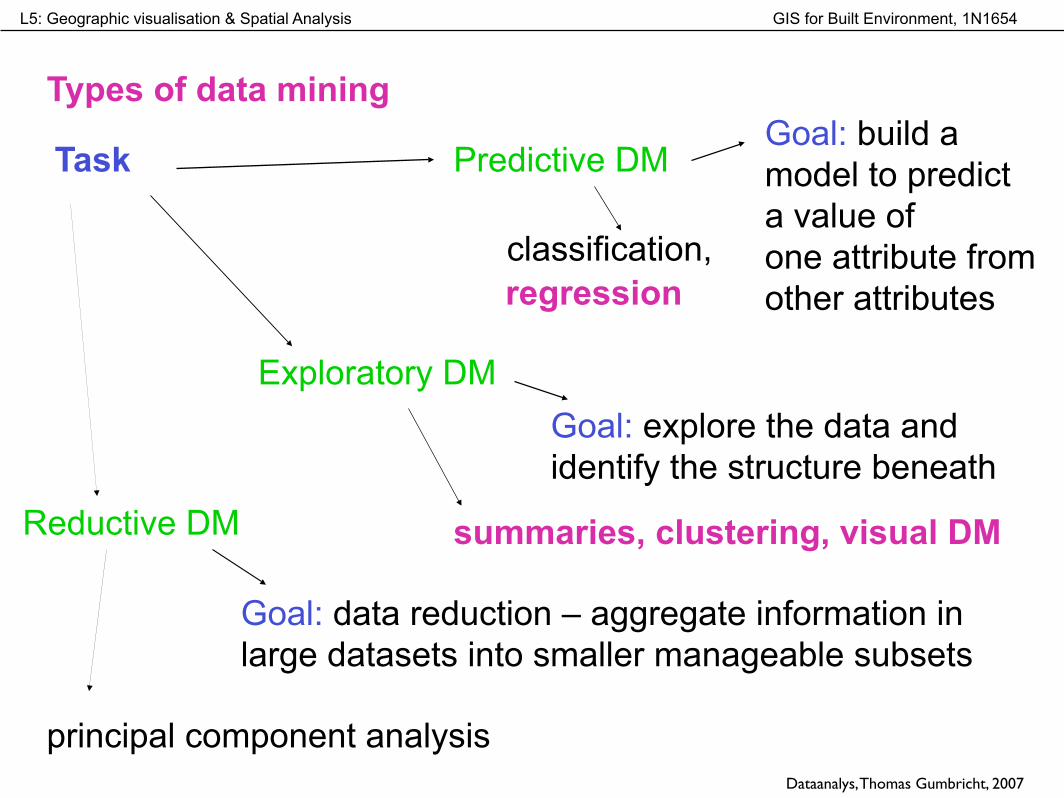
Types of data mining
Task Predictive DM
Exploratory DM
Reductive DM
Goal: build a model to predict a value of one attribute from other attributes
Goal: explore the data and identify the structure beneath
classification, regression
summaries, clustering, visual DM
Goal: data reduction – aggregate information in large datasets into smaller manageable subsets
principal component analysis
summaries, clustering, visual DM
regression
Dataanalys, Thomas Gumbricht, 2007
GIS for Built Environment, 1N1654L5: Geographic visualisation & Spatial Analysis
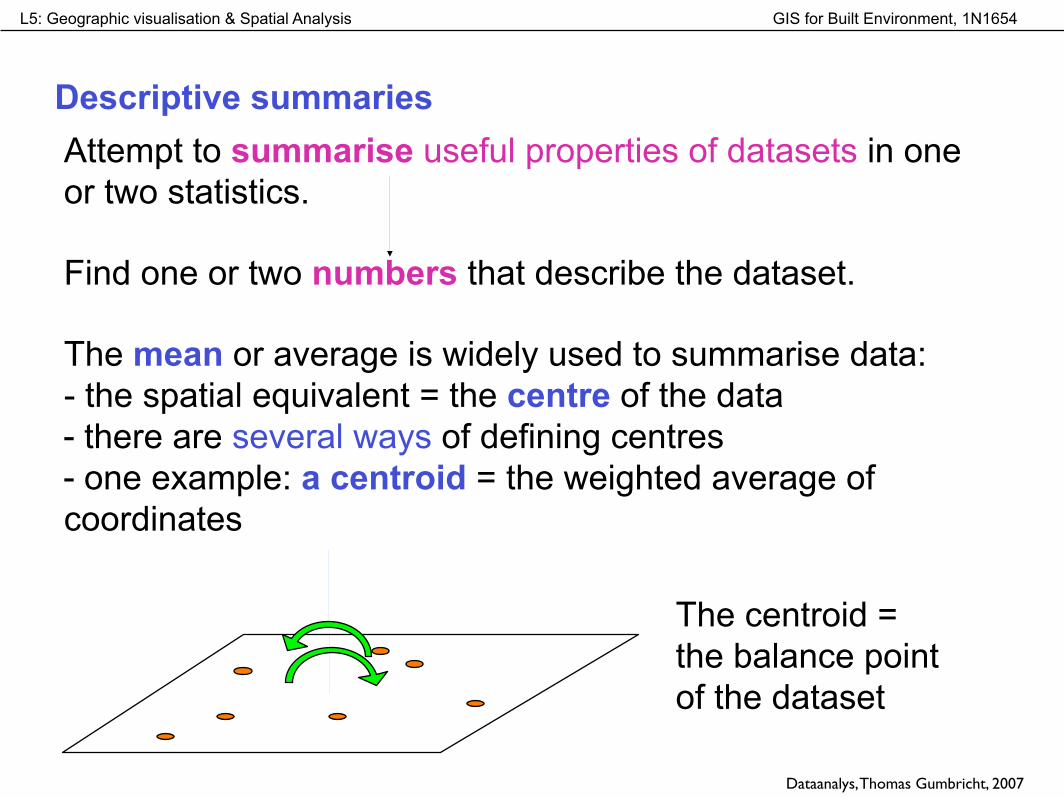
Descriptive summariesAttempt to summarise useful properties of datasets in one or two statistics.
Find one or two numbers that describe the dataset.
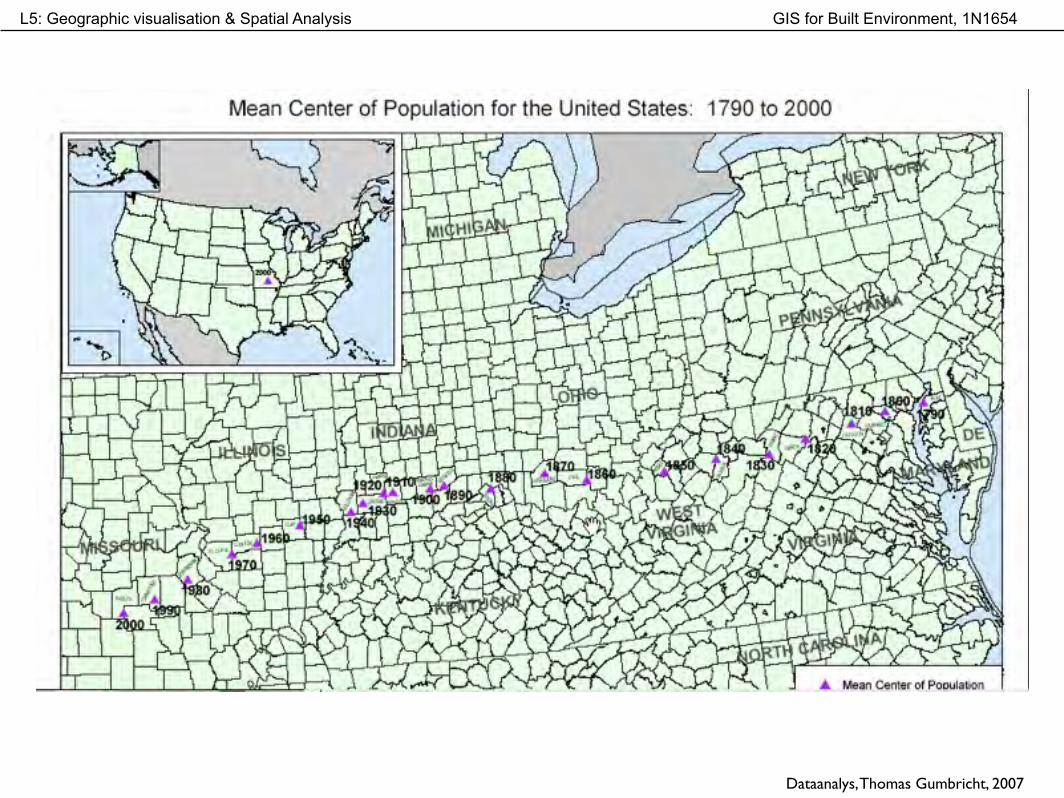
The mean or average is widely used to summarise data: - the spatial equivalent = the centre of the data - there are several ways of defining centres - one example: a centroid = the weighted average of coordinates
The centroid = the balance point of the dataset
Dataanalys, Thomas Gumbricht, 2007
GIS for Built Environment, 1N1654L5: Geographic visualisation & Spatial Analysis
Dataanalys, Thomas Gumbricht, 2007
GIS for Built Environment, 1N1654L5: Geographic visualisation & Spatial Analysis
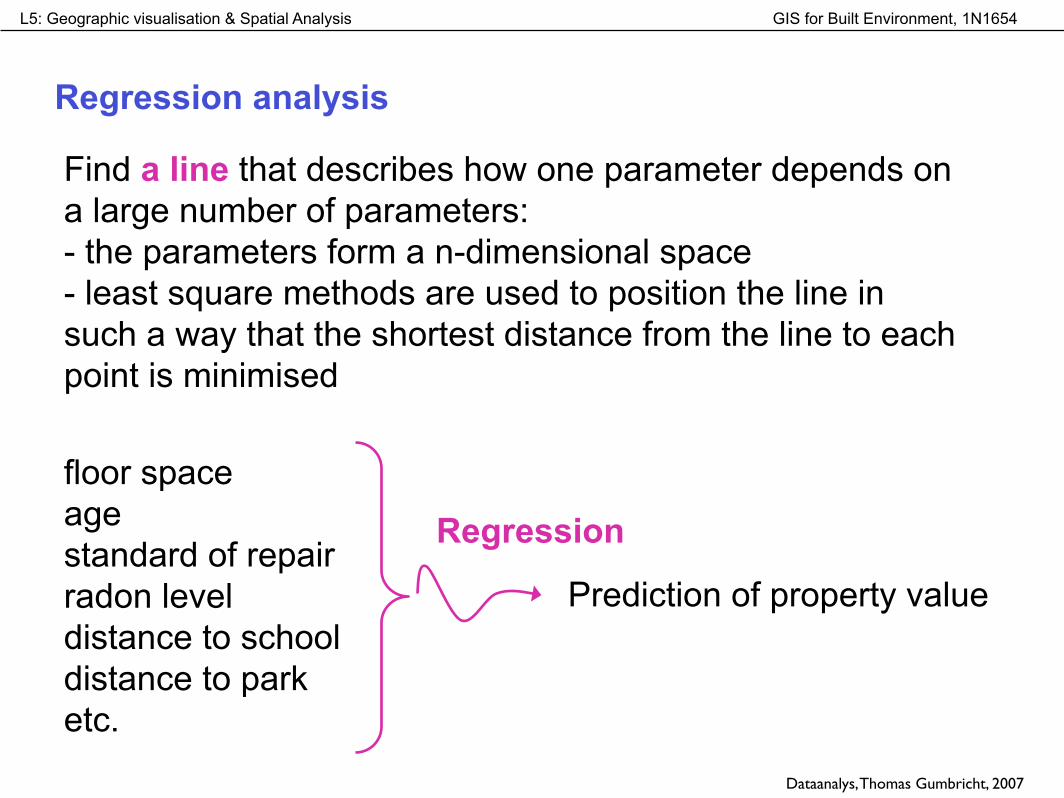
Regression analysis
Find a line that describes how one parameter depends on a large number of parameters: - the parameters form a n-dimensional space - least square methods are used to position the line in such a way that the shortest distance from the line to each point is minimised
floor space age standard of repair radon level distance to school distance to park etc.
Prediction of property value
Regression
Dataanalys, Thomas Gumbricht, 2007
GIS for Built Environment, 1N1654L5: Geographic visualisation & Spatial Analysis
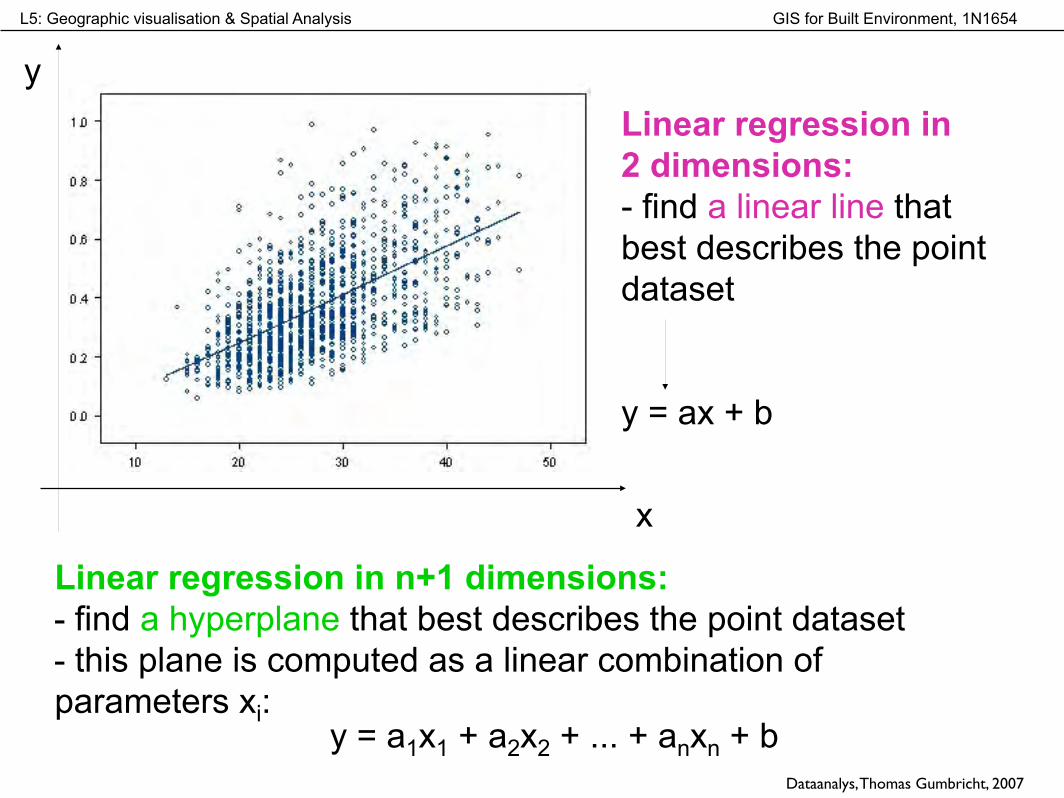
x
yLinear regression in 2 dimensions: - find a linear line that best describes the point dataset
y = ax + b
Linear regression in n+1 dimensions: - find a hyperplane that best describes the point dataset - this plane is computed as a linear combination of parameters xi:
y = a1x1 + a2x2 + ... + anxn + bDataanalys, Thomas Gumbricht, 2007
GIS for Built Environment, 1N1654L5: Geographic visualisation & Spatial Analysis
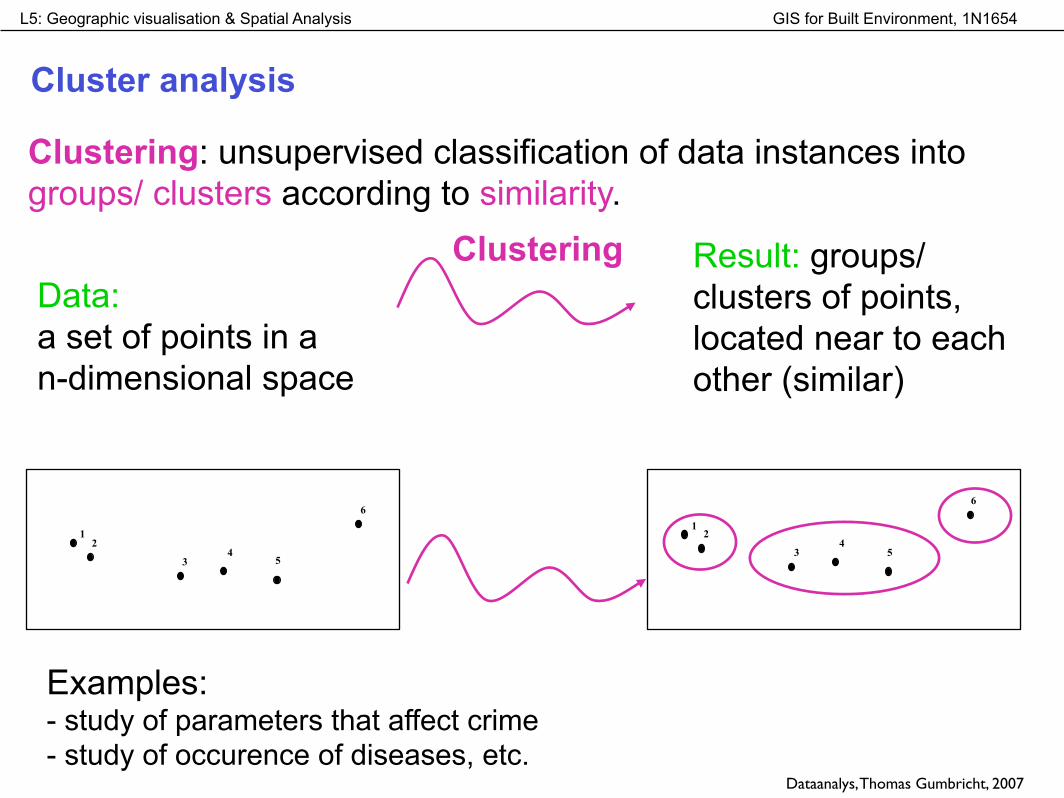
Clustering: unsupervised classification of data instances into groups/ clusters according to similarity.
Cluster analysis
Result: groups/clusters of points, located near to each other (similar)
Data: a set of points in a n-dimensional space
12
34
5
612
34
5
6
Clustering
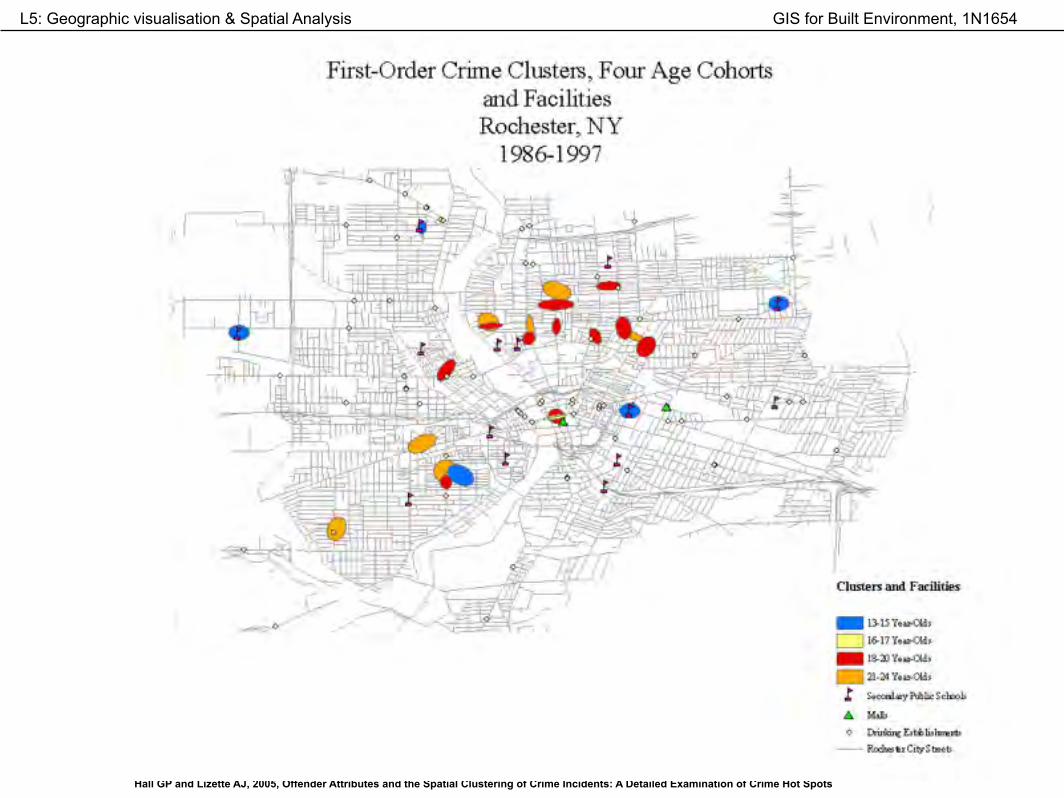
Examples: - study of parameters that affect crime - study of occurence of diseases, etc.
Dataanalys, Thomas Gumbricht, 2007
GIS for Built Environment, 1N1654L5: Geographic visualisation & Spatial Analysis
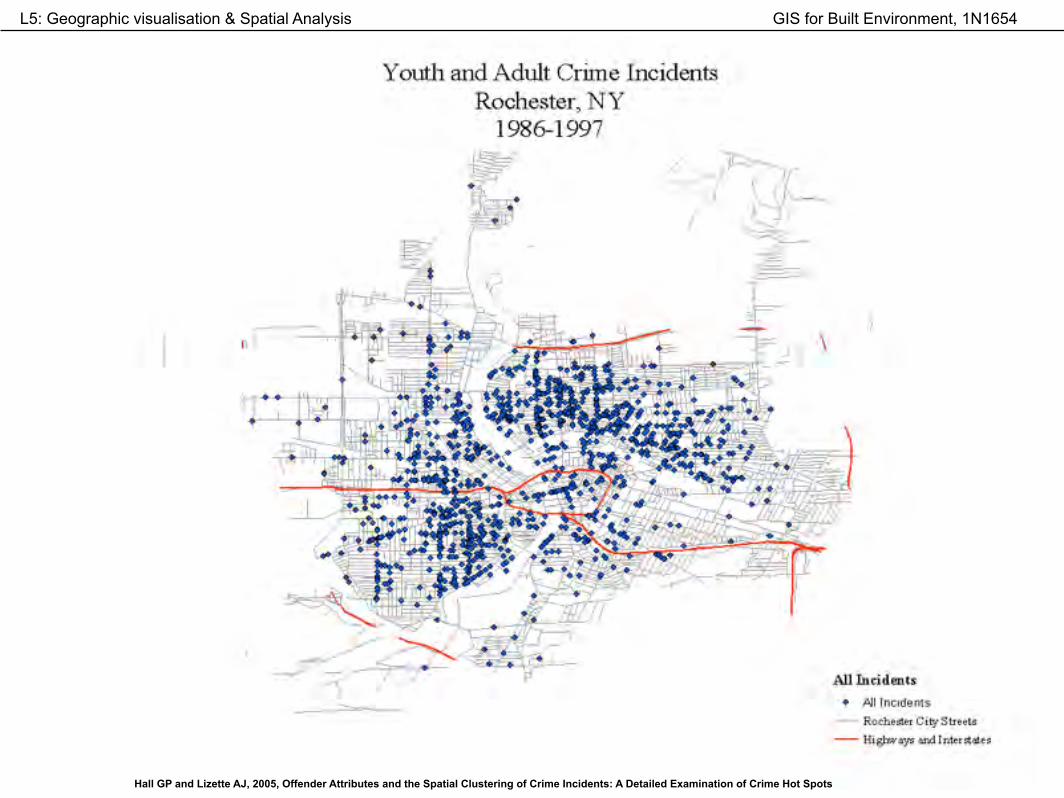
Hall GP and Lizette AJ, 2005, Offender Attributes and the Spatial Clustering of Crime Incidents: A Detailed Examination of Crime Hot Spots
GIS for Built Environment, 1N1654L5: Geographic visualisation & Spatial Analysis
Hall GP and Lizette AJ, 2005, Offender Attributes and the Spatial Clustering of Crime Incidents: A Detailed Examination of Crime Hot Spots
GIS for Built Environment, 1N1654L5: Geographic visualisation & Spatial Analysis
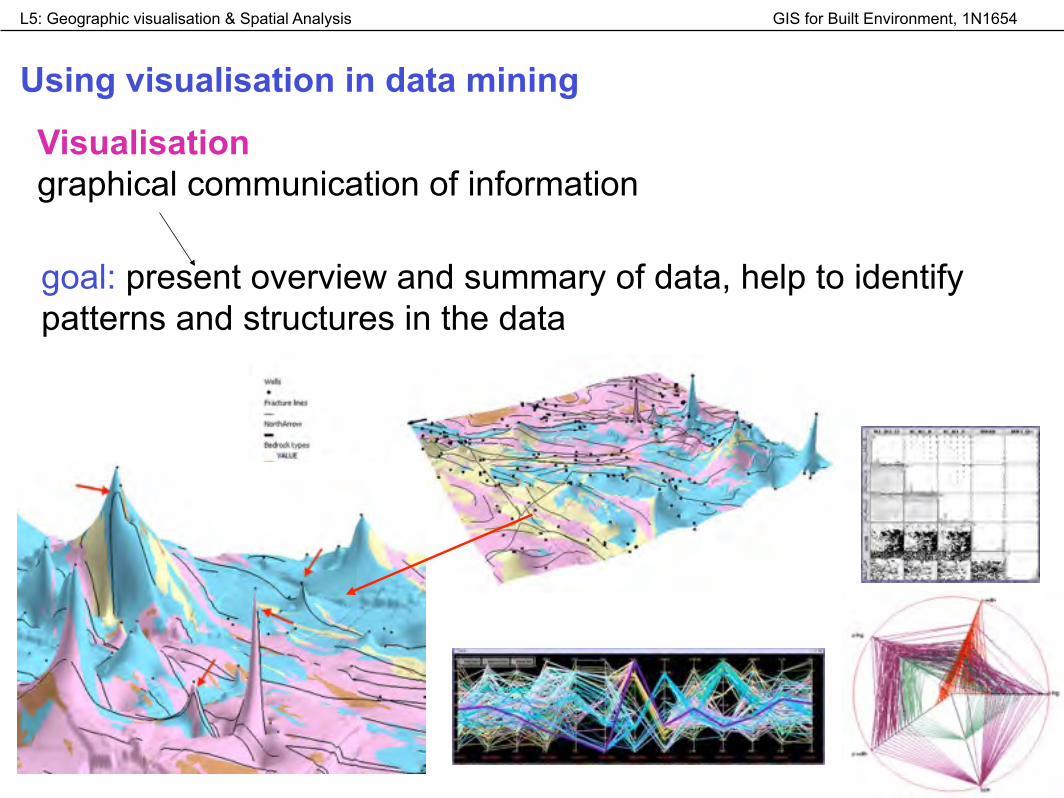
Visualisation graphical communication of information
goal: present overview and summary of data, help to identify patterns and structures in the data
Using visualisation in data mining
GIS for Built Environment, 1N1654L5: Geographic visualisation & Spatial Analysis
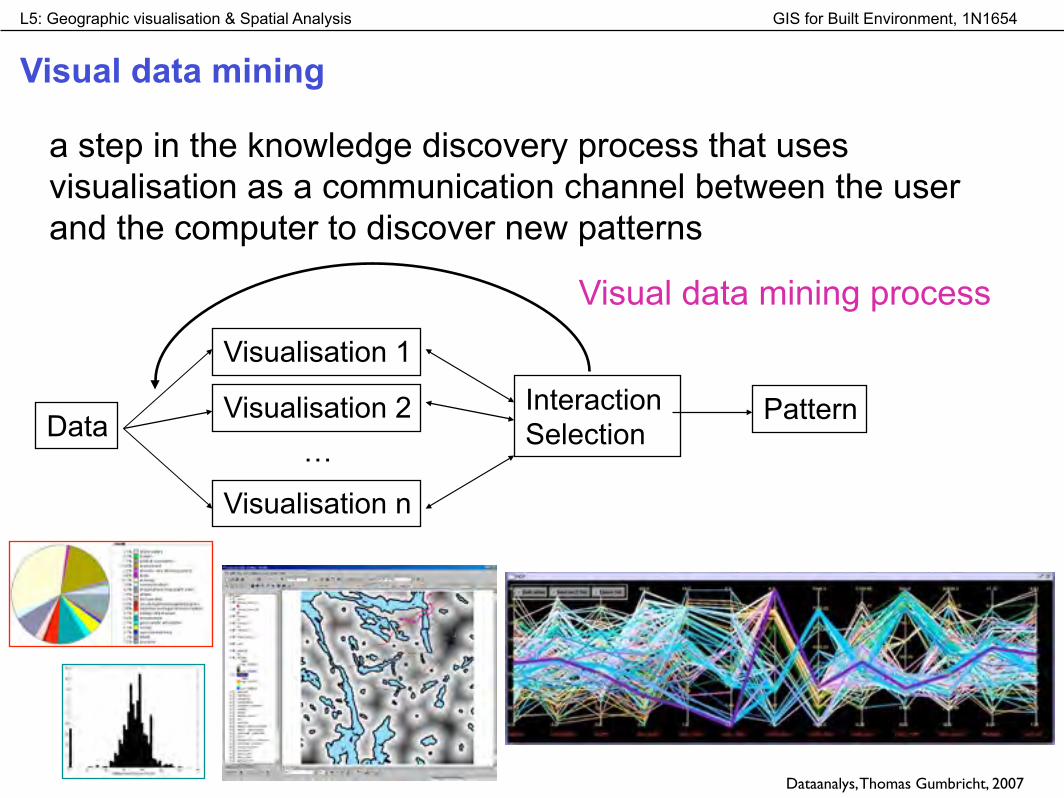
a step in the knowledge discovery process that uses visualisation as a communication channel between the user and the computer to discover new patterns
Visual data mining
Data
Visualisation 1
Visualisation 2
Visualisation n
…PatternInteraction
Selection
Visual data mining process
Dataanalys, Thomas Gumbricht, 2007
GIS for Built Environment, 1N1654L5: Geographic visualisation & Spatial Analysis
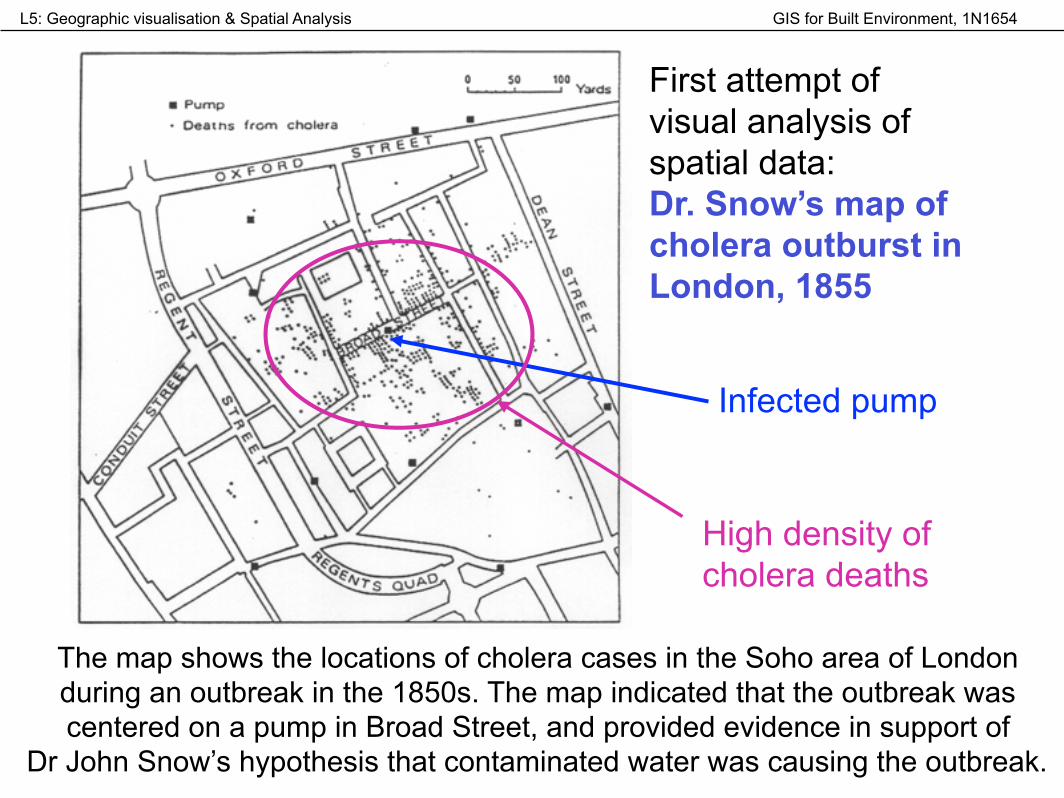
First attempt of visual analysis of spatial data: Dr. Snow’s map of cholera outburst in London, 1855
Infected pump
High density of cholera deaths
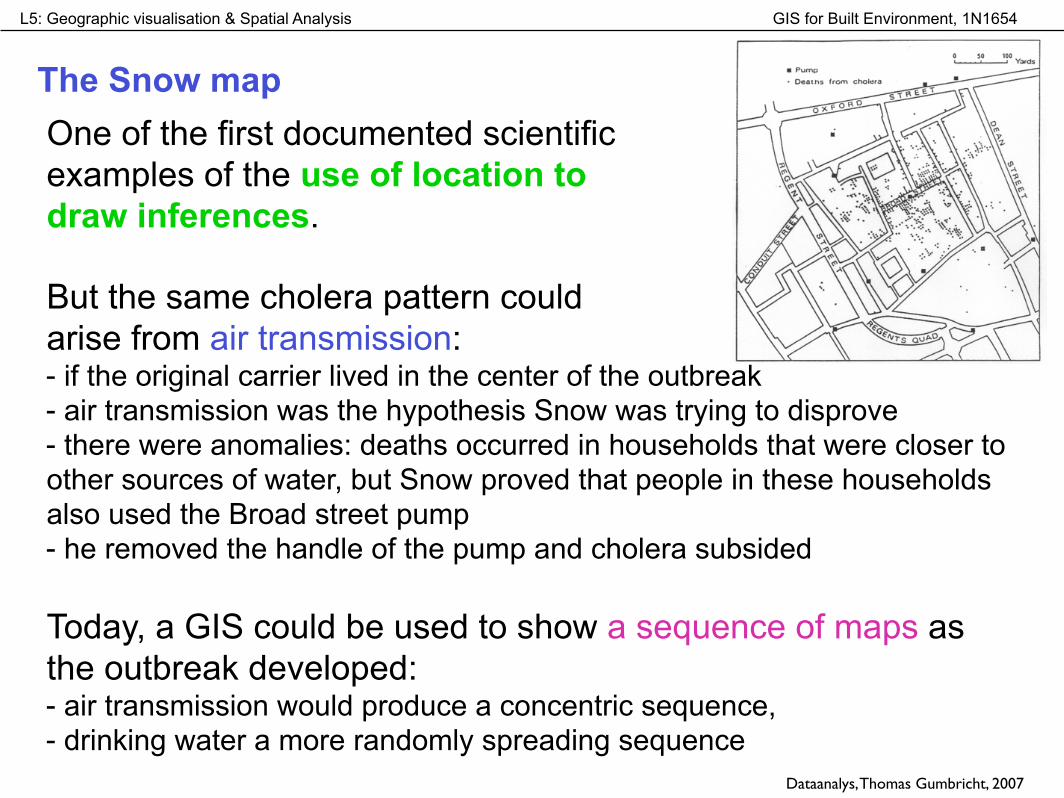
The map shows the locations of cholera cases in the Soho area of London during an outbreak in the 1850s. The map indicated that the outbreak was centered on a pump in Broad Street, and provided evidence in support of
Dr John Snow’s hypothesis that contaminated water was causing the outbreak.
GIS for Built Environment, 1N1654L5: Geographic visualisation & Spatial Analysis
One of the first documented scientific examples of the use of location to draw inferences.
But the same cholera pattern could arise from air transmission: - if the original carrier lived in the center of the outbreak - air transmission was the hypothesis Snow was trying to disprove - there were anomalies: deaths occurred in households that were closer to other sources of water, but Snow proved that people in these households also used the Broad street pump - he removed the handle of the pump and cholera subsided
Today, a GIS could be used to show a sequence of maps as the outbreak developed: - air transmission would produce a concentric sequence, - drinking water a more randomly spreading sequence
The Snow map
Dataanalys, Thomas Gumbricht, 2007
GIS for Built Environment, 1N1654L5: Geographic visualisation & Spatial Analysis
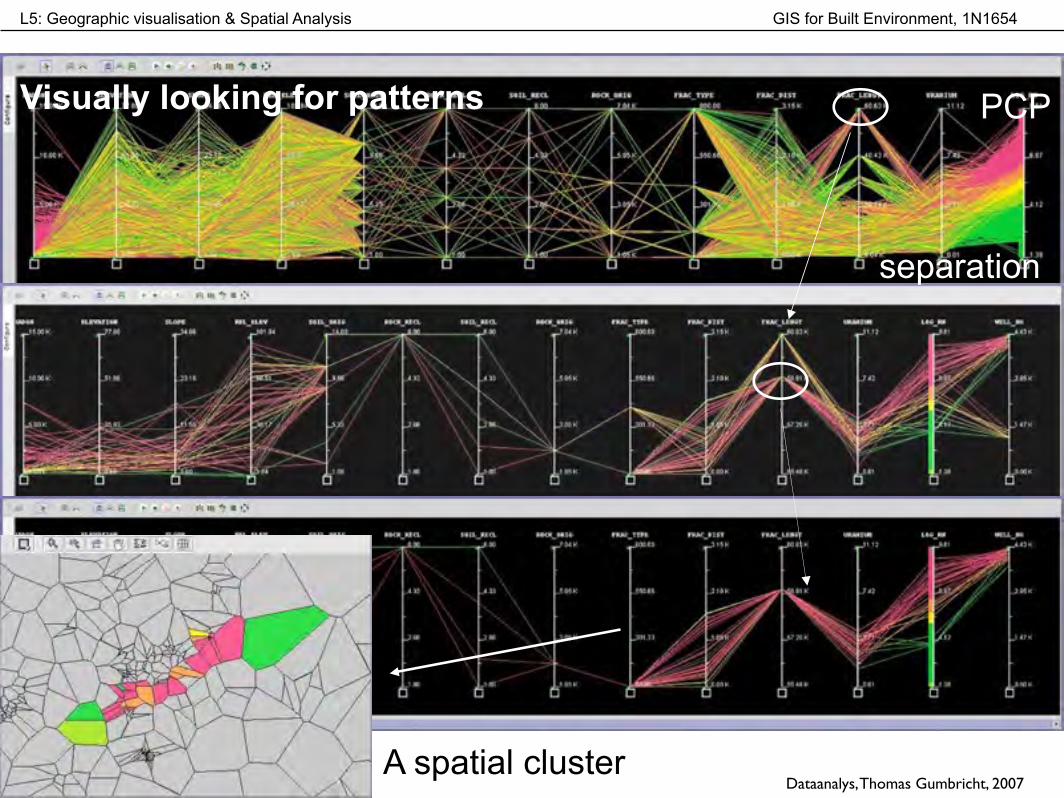
Visually looking for patterns PCP
separation
A spatial clusterDataanalys, Thomas Gumbricht, 2007
GIS for Built Environment, 1N1654L5: Geographic visualisation & Spatial Analysis
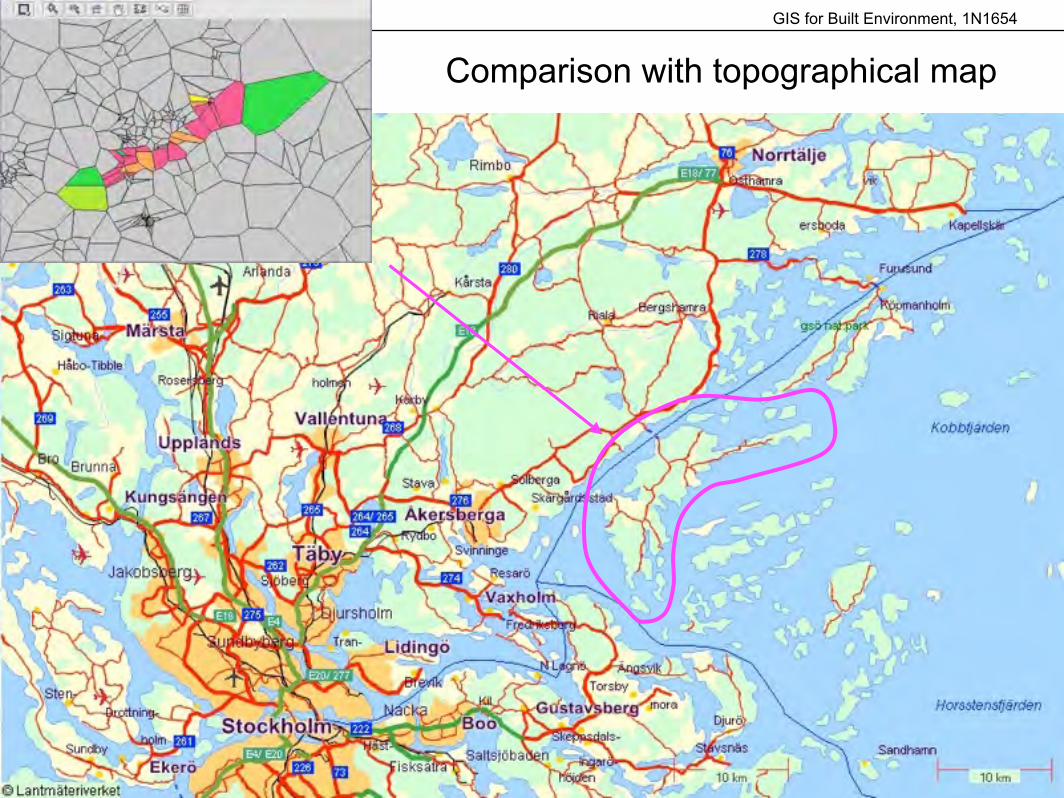
Comparison with topographical map