Thomas D. Gatlin Vice-President Nuclear Operations (803 ...
12
Thomas D. Gatlin Vice-President Nuclear Operations (803)345-4342 March 26, 2014 RC-1 4-0050 A SCANA COMPANY U.S. Nuclear Regulatory Commission Document Control Desk Washington, DC 20555-0001 Dear Sir/Madam: Subject: VIRGIL C. SUMMER NUCLEAR STATION (VCSNS) UNIT 1 DOCKET NO. 50-395 OPERATING LICENSE NO. NPF-12 SOUTH CAROLINA ELECTRIC & GAS (SCE&G) RESPONSE TO NRC REQUEST FOR ADDITIONAL INFORMATION ASSOCIATED WITH NEAR- TERM TASK FORCE RECOMMENDATION 2.1, FLOODING REEVALUATION References: 1. NRC Letter, Request for Information Pursuant to Title 10 of the Code of Federal Regulations 50.54(f) Regarding Recommendations 2.1, 2.3, and 9.3, of the Near-Term Task Force Review of Insights from the Fukushima Dai-ichi Accident, dated March 12, 2012 [ML12053A340] 2. SCE&G to NRC, Flooding Reevaluation Results for Virgil C. Summer Unit 1 dated March 12, 2013 [ML13073A117] 3. Letter from Shawn Williams to Thomas D. Gatlin dated January 30, 2014, Virgil C. Summer Nuclear Station, Unit 1 (VCSNS) - Request for Additional Information (TAC NO. MF1112) [ML14023A740] On March 12, 2012, the NRC issued Reference 1 to all power reactor licensees and holders of construction permits which are either active or deferred status. Enclosure 2 of Reference 1 contains specific Requested Actions, Requested Information, and Required Responses associated with Recommendation 2.1: Flooding Reevaluation. In response to this request, South Carolina Electric & Gas (SCE&G) provided a Flood Hazard Analysis Reevaluation Report (Reference 2). The NRC Staff reviewed SCE&G's response in Reference 2 and determined that additional information is necessary (Reference 3). SCE&G, acting for itself and as agent for South Carolina Public Service Authority is submitting this response to request for additional information. SCE&G's response is provided within Enclosure I. Virgil C. Summer Station . Post Office Box 88. Jenkinsville, SC . 29065 . F (803) 941-9776
Transcript of Thomas D. Gatlin Vice-President Nuclear Operations (803 ...
Thomas D. GatlinVice-President Nuclear Operations
(803)345-4342
March 26, 2014RC-1 4-0050
A SCANA COMPANY
U.S. Nuclear Regulatory CommissionDocument Control DeskWashington, DC 20555-0001
Dear Sir/Madam:
Subject: VIRGIL C. SUMMER NUCLEAR STATION (VCSNS) UNIT 1DOCKET NO. 50-395OPERATING LICENSE NO. NPF-12SOUTH CAROLINA ELECTRIC & GAS (SCE&G) RESPONSE TO NRCREQUEST FOR ADDITIONAL INFORMATION ASSOCIATED WITH NEAR-TERM TASK FORCE RECOMMENDATION 2.1, FLOODING REEVALUATION
References:1. NRC Letter, Request for Information Pursuant to Title 10 of the Code of Federal
Regulations 50.54(f) Regarding Recommendations 2.1, 2.3, and 9.3, of the Near-TermTask Force Review of Insights from the Fukushima Dai-ichi Accident, dated March 12,2012 [ML12053A340]
2. SCE&G to NRC, Flooding Reevaluation Results for Virgil C. Summer Unit 1 datedMarch 12, 2013 [ML13073A117]
3. Letter from Shawn Williams to Thomas D. Gatlin dated January 30, 2014, Virgil C.Summer Nuclear Station, Unit 1 (VCSNS) - Request for Additional Information(TAC NO. MF1112) [ML14023A740]
On March 12, 2012, the NRC issued Reference 1 to all power reactor licensees and holders ofconstruction permits which are either active or deferred status. Enclosure 2 of Reference 1contains specific Requested Actions, Requested Information, and Required Responsesassociated with Recommendation 2.1: Flooding Reevaluation. In response to this request,South Carolina Electric & Gas (SCE&G) provided a Flood Hazard Analysis Reevaluation Report(Reference 2). The NRC Staff reviewed SCE&G's response in Reference 2 and determined thatadditional information is necessary (Reference 3).
SCE&G, acting for itself and as agent for South Carolina Public Service Authority is submittingthis response to request for additional information. SCE&G's response is provided withinEnclosure I.
Virgil C. Summer Station . Post Office Box 88. Jenkinsville, SC . 29065 . F (803) 941-9776
Document Control DeskCR-12-01098RC-14-0050Page 2 of 2
This letter contains no new regulatory commitments.
Should you have any questions concerning the content of this letter, please contact Bruce L.Thompson at (803) 931-5042.
I declare under penalty of perjury that the foregoing is true and correct.
Executed on Thomas D. Gatlin
BD/TDG/rp
Enclosure:I. SCE&G Response to Request for Additional Information
II. Disks containing FLO-2D input files
c: K. B. MarshS. A. ByrneJ. B. ArchieN. S. CamsJ. H. HamiltonJ. W. WilliamsW. M. CherryE. J. LeedsV. M. McCreeS. A. WilliamsK. M. SuttonNRC Resident InspectorRTS (CR-12-01098)File (815.07)PRSF (RC-14-0050)
Document Control DeskCR-12-01098RC-14-0050Enclosure IPage 1 of 10
VIRGIL C. SUMMER NUCLEAR STATION (VCSNS) UNIT I
ENCLOSURE I
SCE&G Response to Request for Additional Information
RAI No. I - Local Intense Precipitation Flooding
Background: Given the significant role that the FLO-2D model performs in the licensee'sanalysis of the probable maximum flood (PMF) caused by local intense precipitation andthe need to review the formulation of the model's complex spatially and temporallydistributed input, the staff requests that the licensee provide FLO-2D input files.
Request: Provide electronic versions of the input files for the FLO-2D model in the FloodHazard Reevaluation Report (FHRR) related to local intense precipitation analysis.Provide a discussion regarding assumptions associated with functionality of the sitedrainage system during the event.
SCE&G Response RAI-1:The requested input files are provided on the enclosed CDs.
In all five simulations, the underground drainage systems were assumed plugged (non-functional). Calculation DC02060-005, Revision 0 is provided in its entirety on the VCSNSFukushima E-Portal. The below is a summary of information contained in CalculationDC02060-005, Revision 0, beginning page 5 of 34:
"Calculation Overview"The objective of this calculation is to model the Probable Maximum Precipitation (PMP) event atthe V.C. Summer Nuclear Generating Station Unit 1 in Jenkinsville, South Carolina. TheFLO-2D PRO Program was used to calculate the maximum water surface elevation onsite dueto the PMP. Multiple simulations were run in FLO-2D to represent different storm conditions. InSimulation 1, the PMP 1 hour rainfall was run for 24 hours, (1 hour of rain and 23 hours ofdrainage) to allow the FLO-2D program to calculate maximum water levels in the Service WaterPond (SWP). Water levels were reduced by overland flow only. In Simulation 2, the currentlicense basis PMP 6 hour rainfall was run for 24 hours, (6 hours of rain and 18 hours ofdrainage) to allow the FLO-2D program to calculate maximum water levels in the SWP. Waterlevels were reduced by overland flow only (underground storm drainage system assumed to beplugged). Simulation 3 assumed overland flow only, 1 hour PMP, and included additionalproposed channels to more quickly drain the site with the goal of reducing maximum floodingelevation. Simulation 3 was modeled for 24 hours (1 hour of rain, 23 hours to drain). Simulation4 assumed overland flow only, 1 hour PMP, and included proposed construction and demolitionassociated with the Independent Spent Fuel Storage Installation (ISFSI) design. Simulation 4was modeled for 24 hours (1 hour of rain, 23 hours to drain). Simulation 5 added extra buildingsto Simulation 4 to simulate the effect of future construction onsite.
Document Control DeskCR-12-01098RC-14-0050Enclosure IPage 2 of 10
RAI No.2 - Local Intense Precipitation Flooding
Background: Given the significant role that elevation data is in defining slopes andflow paths, the staff requests that the licensee provide a description of the methodsused to incorporate elevation measurements into the FLO-2D analyses.
Request: Provide a description of the methods used to incorporate elevationmeasurements and the likely magnitude of the errors associated with these elevations.
SCE&G Response RAI-2Calculation DC02060-005, Revision 0 is provided in its entirety on the VCSNS Fukushima E-Portal. The below is a summary of information contained in Calculation DC02060-005, Revision0, beginning page 5 of 34:
"Elevation Model Creation Process"An aerial survey of the VC Summer Unit 1 plant area was performed by GeoData Corp forGlenn Associates (surveyor). The color aerial photography was taken at a nominal scale of1 inch = 166 feet using a Wild RC-30 aerial camera and compiled by standard photogrammetricmeans using a Datum Evolution softcopy system. The data was compiled at 1 inch = 166 feetat a 0.5 ft contour interval. The surveyor provided a CAD deliverable, (see Reference 1 ofCalculation DC02060-005, Revision 0), which consisted of elevation points spaced on a 10 by10 grid with break lines. Reference 1 in Calculation DC02060-005, Revision 0 was submitted inthe V.C. Summer Plant horizontal and vertical data which are the State Plane CoordinateSystem of South Carolina North American Datum of 1927 (NAD27) horizontal datum and theNational Geodetic Vertical Datum of 1929 (NGVD29). Elevation point information was removedfrom the file in building areas and along the rock levees. This drawing served as the basis forbare-earth elevations that were input into the Grid Developer System [GDS] model.
Before importing into GDS, the bare-earth elevations were imported into Global Mapper. Breaklines were converted to points while maintaining elevation data from the original file. Atriangulated grid connecting all the points, a Digital Terrain Model (DTM), was created withinGlobal Mapper. This file was saved and is referred to as the bare-earth plant DTM.
Glenn Associates also prepared an AutoCAD drawing of the building roofs at the V.C. SummerPlant. The drawing contained lines that outlined each roof. Also included in the file wereelevation shots within the roof outlines, generally spaced in a 10 feet x 10 feet grid pattern.These were brought into Global Mapper separately in the plant coordinate system. Points werecreated from 3D lines and the elevation data from the original CAD drawing was preserved.The created 3D points (from roof outline) and the grid points within each roof area wereexported as a simple ASCII text file (.xyz) to add roof data to the bare-earth DTM model.
After initial simulations, the FLO-2D model was extended beyond the limits of the survey fromGlenn Associates to better simulate site flooding. Additional high resolution (1/9 arc-second)elevation data from the U.S. Geological Survey (USGS), Earth Resources Observation andScience Center was downloaded. The Digital Elevation Model (DEM) datasets for portions ofFairfield County in South Carolina were entitled "46101272.bil" and "73595868.bil" (Reference 3in Calculation DC02060-005, Revision 0). This data was recorded in the State PlaneCoordinate System of South Carolina, NAD83 horizontal datum and NAVD88 vertical datum. Itconsists of 3-meter or better point spacing from various sources. The data was imported into a
Document Control DeskCR-12-01098RC-14-0050Enclosure IPage 3 of 10
separate file in Global Mapper and converted from NAD83 to NAD27 to match plant datum. TheNational Geodetic Survey calculates a vertical difference of +0.869 feet when converting fromNAVD88 to NGVD29 at a point in the general center of the site. Therefore, a global shift of+0.869 feet was applied to the entire elevation dataset to shift the data from the NAVD88vertical datum to the NGVD29 vertical datum. Global Mapper was used to create points fromthe DEM at a 10 feet by 10 feet spacing. The point elevation data was retained from the DEM.
The extended points from USGS, building roof, and the bare-earth elevation data were openedand combined in Global Mapper and an elevation grid was created. The combined elevationgrid was broken back into points on 3ft spacing and exported as a simple ASCII text file. Thisfile was then scrubbed of erroneous elevation points such as -99999.99, below 200 feet andabove 602 feet, which, by inspection, were out of the elevation range of the area of study. Theresultant simple ASCII file was renamed to an ASCII PTS file (points) and imported into FLO-2DPRO GDS as the project elevation file.
Within the limits of the new topographical survey (plant proper including SWP embankments),the expected accuracy of elevation data values is one-half contour interval or 0.25 ft averagedwithin each 10 ft x 10 ft grid. Outside the new survey limits the area was modeled with DEMdatasets for portions of Fairfield County in South Carolina. The files are named "46101272.bil"and "73595868.bil". Those files were created from source data: Sixteen-County Area of SouthCarolina, 2008, 1/9-Arc Second National Elevation Dataset, a .bil file is the DEM data roundedup or down to the nearest meter. The original metadata for the .bil have a vertical accuracy of0.22m. The data are then translated and averaged to a 10 ft xl0 ft grid single elevation. Thestarting water surface elevations were set equal to exact values.
Errors resulting from vertical data are expected to be insignificant since the area modeled by .bilfiles represents a small percentage of the total drainage area. The tributary area to MonticelloReservoir upland of the water surface is a fraction of the water surface area of the reservoir.Additionally, conservative assumptions are used in the calculation including the startingelevation of the reservoir set at the maximum operating level as controlled by the FairfieldPumped Storage Facility, and that no water is released from the reservoir during the model runduration.
RAI No.3 - Streams and Rivers Flooding
Background: Given the significant role that Frees Creek/Monticello Reservoir plays in thelicensee's analysis of the PMF from rivers and streams and the need to review theformulation of the model's complex spatially and temporally distributed input, the staffrequests that the licensee provide a detailed description of the analysis it completed tosupport its conclusions.
Request: Provide detailed information and model inputs, if applicable, to support theconclusion in the FHRR related to the estimation of flooding due to the PMF event onFrees Creek/Monticello Reservoir (including wind and wave effects).
Document Control DeskCR-12-01098RC-14-0050Enclosure IPage 4 of 10
SCE&G Response RAI-3Calculation DC-02060-007, Revision 0 and Calculation DC02060-008, Revision 0 are providedin their entirety on the VCSNS Fukushima E-Portal. Below is a summary of informationcontained within Calculation DC-02060-007, Revision 0 and Calculation DC02060-008,Revision 0.
Calculation DC-02060-007, Revision 0, determined the PMF depth from the guidelines outlinedin Section 4.4.3.3 of HMR 52 (Reference 2 of Calculation DC-02060-007, Revision 0 ) andFigures 18 through 27 of HMR 51 (Reference 3 of Calculation DC-02060-007, Revision 0). Thetributary area (Figure 1 on page 6 of 16) to Frees Creek/Monticello Reservoir consists of a16.5016-mi2 drainage area. The PMP to be used in PMF calculation was determined to be the72-hour PMP for the Monticello Reservoir watershed and equal to 47.7 inches (page 4 of 16).
Calculation DC02060-008, Revision 0, determined the PMF water levels in Monticello Reservoir.Model input and starting conditions used were:
" Starting water level was assumed to be 425.0 ft (maximum operating levelcontrolled by Fairfield Pumped Storage Facility) (page 6 of 27).
* No discharge from reservoir during model run duration therefore no reservoirrouting required (page 6 of 27).
" 72-hour PMP applied to tributary area. Upland tributary area runoff factored byNRCS TR-55 Curve Numbers conservatively selected. Total PMP = 47.7 inches.Factored runoff = 46.73 inches (page 6 of 27).
" Resulting still water surface elevation determined to be 431.37 ft (page 7 of 27)." Wind effective fetch length determined to be 15,579 feet (2.95 miles) (page 8 of
27).* Alternative I, Section 9.2.1.1 of ANSI/ANS-2.8-1992, Figure 3, the annual,
extreme-mile, 2-year wind speed at Monticello Reservoir is 50 mph with averageduration of 72 seconds (pages 9-10 of 27).
* Wave heights, spectral periods, runup, and setup determined by usingmethodology in EM 1110-2-1100 (pages 11-19 of 27).
* The PMF elevation for Monticello Reservoir at the North Berm was determined tobe 437.00 feet (page 18 of 27).
* The PMF elevation for Monticello Reservoir at the North Dam (SWP) wasdetermined to be 434.77 feet (page 19 of 27).
RAI No.4 - Streams and Rivers Flooding
Background: Given the control of the Service Water Pond (SWP) pool elevation by theoperation of the isolation valve on the interconnecting pipe between the SWP andMonticello Reservoir, the staff requests that the licensee provide a detailed description ofconditions leading to the valve's operation, frequency of operation, and any assumptionsrelated to the state of the isolation valve used in the reevaluation of the PMF for the SWP.
Request: Provide a detailed description of conditions leading to the operation of thevalve, frequency of operation, any assumptions related to the state of the isolation valveused in the reevaluation of the PMF for the SWP. Describe whether the conclusions madein the FHRR are affected by the assumptions about the state of the valve.
Document Control DeskCR-12-01098RC-14-0050Enclosure IPage 5 of 10
SCE&G Response RAI-4The SWP to Monticello reservoir interconnecting pipe is normally isolated by Valve XVB00832-CW. XVB00832-CW is operated as directed by Operations when low-water or high temperatureconditions exist in the SWP. Due to chemicals present in the SWP the valve is not operatedwhen the SWP level is greater than the water level in Monticello Reservoir. System OperatingProcedure (SOP) 207 Section H "Infrequent Operations" provides a detailed summary of stepsrequired to open the valve. The VCSNS Control Room verifies levels in SWP and Monticelloreservoir and allows opening of the cross-connect valve.
XVB00832-CW is normally locked closed locally at the valve hand-wheel and the electricalbreaker feed at the Motor Control Center is locked open to prevent operation. Security Controlsthese locks per site procedure, General Maintenance Procedure (GMP) GMP-101.002, andopens at request of Operations when performing the applicable steps of SOP-207. Security isrequired to man the valve location continuously while the valve is open and locks on breaker arenot in place. Due to security requirement, the valves are normally closed prior to shift changes.
XVB00832-CW is not operated on a set periodicity; the valve is operated very infrequently andas previously noted is only operated due to low-water or high temperature conditions in theSWP. Water level in the SWP is maintained by normal precipitation. For reference regardingfrequency of valve operation, VCSNS OPS Autolog archives was retrieved from January 2010thru March 10, 2014 and filtered by "SOP-207" and a separate filtering for "Pond". The resultsof the database retrieval determined that there were four different SW Pond filling evolutions.The filling evolutions sometimes extended over multiple days, with the valve being open forseveral hours at a single time and then closed prior to shift turnover. In total, from review of thedescribed database retrieval, the valve opened/closed 26 times as part of the four separatefilling evolutions.
The FHRR assumed the valve was closed during all applicable flooding events. Conclusionsmade in the FHRR are not affected by the assumptions about the state of XVB00832.
RAI No. 5 - Streams and Rivers Flooding
Background: Given the significant role that the SWP has in the licensee's analysis of thePMF from rivers and streams and the need to review the formulation of the model'scomplex spatially and temporally distributed input, the staff requests that the licenseeprovide a detailed description of the analysis it completed to support its conclusions.
Request: Provide detailed information and model inputs, if applicable, to support theconclusion in the FHRR related to the estimation of flooding due to the PMP (includingwind effects) event on the SWP.
SCE&G Response RAI-5Calculation DC02060-005, Revision 0 and Calculation DC02060-008, Revision 0 are provided intheir entirety on the VCSNS Fukushima E-Portal. Below is a summary of information containedwithin Calculation DC02060-005, Revision 0 and Calculation DC02060-008, Revision 0.
Document Control DeskCR-12-01098RC-14-0050Enclosure IPage 6 of 10
Calculation DC02060-005, Revision 0, determined the water levels in the SWP resulting fromthe PMP on the site plus the SWP area. Model input and starting conditions used were:
* Starting water level was assumed to be 422.0 ft per Figure 15 (page 19 of 34).* No discharge from SWP during model run duration therefore no reservoir routing
required (Calculation DC02060-008, page 6 of 27).* One-hour PMP and 72-hour PMP (licensing basis) were applied to tributary area
in separate Simulation runs. Upland tributary areas runoff factored by Rationalcoefficients conservatively selected. Total 1 hr PMP = 19.0 inches, 72-hourPMP = 29.83 inches (page 13 of 34).
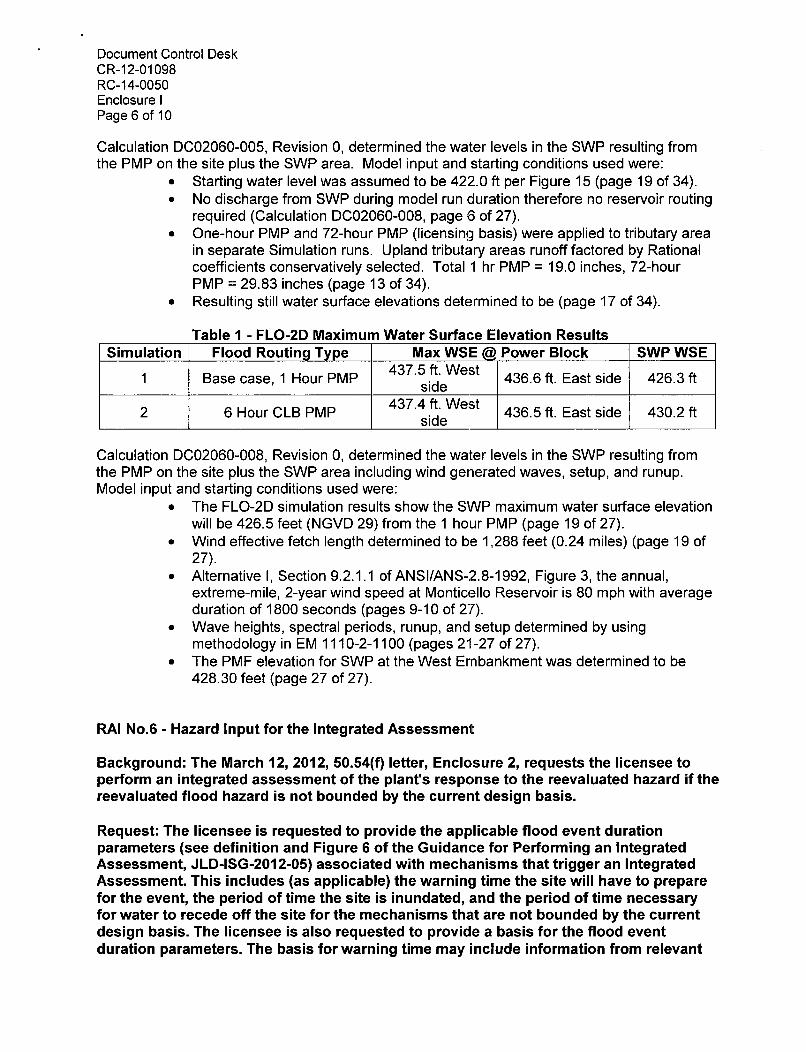
• Resulting still water surface elevations determined to be (page 17 of 34).
Table 1 - FLO-2D Maximum Water Surface Elevation ResultsSimulation Flood Routing Type Max WSE @ Power Block SWP WSE
1 Base case, 1 Hour PMP 437.5 ft. West 436.6 ft. East side 426.3 ft
2 6 Hour CLB PMP 437.4 ft. West 436.5 ft. East side 430.2 ftside
Calculation DC02060-008, Revision 0, determined the water levels in the SWP resulting fromthe PMP on the site plus the SWP area including wind generated waves, setup, and runup.Model input and starting conditions used were:
* The FLO-2D simulation results show the SWP maximum water surface elevationwill be 426.5 feet (NGVD 29) from the 1 hour PMP (page 19 of 27).
* Wind effective fetch length determined to be 1,288 feet (0.24 miles) (page 19 of27).
" Alternative I, Section 9.2.1.1 of ANSI/ANS-2.8-1992, Figure 3, the annual,extreme-mile, 2-year wind speed at Monticello Reservoir is 80 mph with averageduration of 1800 seconds (pages 9-10 of 27).
* Wave heights, spectral periods, runup, and setup determined by usingmethodology in EM 1110-2-1100 (pages 21-27 of 27).
" The PMF elevation for SWP at the West Embankment was determined to be428.30 feet (page 27 of 27).
RAI No.6 - Hazard Input for the Integrated Assessment
Background: The March 12, 2012, 50.54(f) letter, Enclosure 2, requests the licensee toperform an integrated assessment of the plant's response to the reevaluated hazard if thereevaluated flood hazard is not bounded by the current design basis.
Request: The licensee is requested to provide the applicable flood event durationparameters (see definition and Figure 6 of the Guidance for Performing an IntegratedAssessment, JLD-ISG-2012-05) associated with mechanisms that trigger an IntegratedAssessment. This includes (as applicable) the warning time the site will have to preparefor the event, the period of time the site is inundated, and the period of time necessaryfor water to recede off the site for the mechanisms that are not bounded by the currentdesign basis. The licensee is also requested to provide a basis for the flood eventduration parameters. The basis for warning time may include information from relevant
Document Control DeskCR-12-01098RC-14-0050Enclosure IPage 7 of 10
forecasting methods (e.g., products from local, regional, or national weather forecastingcenters).
SCE&G Response RAI-6Calculation DC02060-005 is provided in its entirety on the VCSNS Fukushima E-Portal. Thebelow is a summary of information contained in Calculation DC02060-005, Revision 0.
Period of Site Inundation:Calculation DC02060-005 includes graphs that show water surface elevation (WSE) versus timefor Power Block West, Power Block East, and the SWP. At the Power Block West area, whichis the area where runoff is most impeded, the majority of ponded water drains from the site bythe 6 th or 7 th hour into the 24 hour simulation. The rising limb is steep since the 1 hour PMPoccurs in the first hour. The last 0.1 ft of ponding reaches the starting elevation between hours12 through 24. Drainage continues reaching the starting elevation at 24 hours (Figure 13, page17 of 34).
Realistically, the underground stormwater drainage will be at least partially functional and thefinal 0.1 to 0.3 ft of ponding will be quickly drained from the site within 12 to 14 hours of the startof the storm.
Warning Time:The local intense precipitation (LIP) event is the only flood hazard event at VCSNS whichrequires any response actions. Operations Administrative Procedure (OAP) 109.1 "Guidelinefor Severe Weather" is an operations procedure that is used to provide response to severeweather conditions, including the LIP. OAP-109.1 is provided in its entirety on the VCSNSFukushima E-Portal. OAP-109.1 Section 6.5 "Heavy Rainfall Guideline" details responseactions for the LIP event; per procedure the response actions are initiated at the direction of theShift Supervisor and/or Control Room Supervisor. OAP-100.4 "Communication" Section 12"Shift Engineer's Communication" requires the Shift Engineer to check and forecast outapproximately 24 hours for weather instabilities that could affect power distribution capabilitiesor impact decision to remove safety related equipment from service.
As referenced in OAP-1 09.1 VCSNS utilizes ImpactWeather.com to monitor weather forecastsand potential weather instabilities. Additionally, VCSNS has a service contract withImpactWeather.com to provide warning for severe weather conditions. One of the contractedwarnings is "Area Flood Watch - issued for when conditions are favorable for meteorological,soil, and/or hydrologic conditions to lead to flooding within 48 hours". If flooding is predicted atVCSNS, the following actions are initiated to provide warning to VCSNS Control Room Staff:
1. an alpha numerical text message is sent to a pager located in Control Room; a pagercontrolled by security receives the same text message
2. an email message is automatically printed on both printers in 463 ft. elevation of ControlBuilding
3. an automated system sends a voice message to standard Bell telephone line in ControlRoom
In conclusion, the warning time the site is expected to have to prepare for LIP event is in excessof 24 hours.
Document Control DeskCR-12-01098RC-1 4-0050Enclosure IPage 8 of 10
RAI No. 7 - Hazard Input for the Integrated Assessment
Background: The March 12, 2012, 50.54(f) letter, Enclosure 2, requests the licensee toperform an integrated assessment of the plant's response to the reevaluated hazard if thereevaluated flood hazard is not bounded by the current design basis.
Request: The licensee is requested to provide the flood height and associated effects (asdefined in Section 9 of JLD-ISG-2012-05) that are not described in the flood hazardreevaluation report for mechanisms that trigger an Integrated Assessment. This includesthe following quantified information for each mechanism (as applicable):
* Debris impacts,* Effects caused by sediment deposition and erosion (e.g., flow velocities, scour),* Concurrent site conditions, including adverse weather, and* Groundwater ingress
SCE&G Response RAI-7* Debris impacts:
No flooding enters the site from external/upstream tributary areas; the site floodingoccurs solely as the result of LIP. Therefore, the only potential debris will be fromunsecured materials on the plant site. Normal housekeeping practices minimize theamount of materials/debris that can be moved by LIP runoff. Also, flow velocities on siteare very low (see discussion below) and it is not practical to assume any debris couldadversely impact plant flood protection features.
* Effects caused by sediment deposition and erosion (e.g., flow velocities, scour):
The site grades are minimal, resulting in stormwater runoff velocities in the subcriticalrange. Minor, insignificant erosion/sedimentation is expected. The majority of LIP runoffflows into the SWP. The 6.70 feet of physical margin existing in the SWP is sufficient toaccommodate any expected sedimentation (Calculation DC02060-008, page 27 of 27).
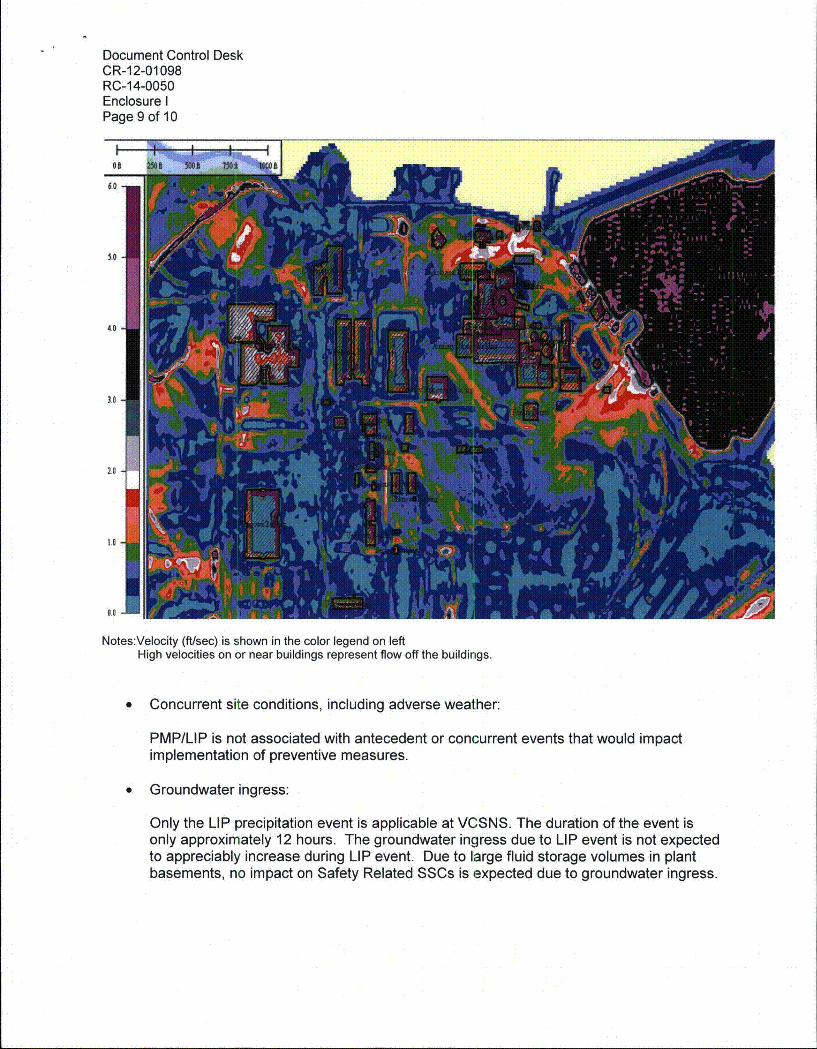
Maximum flow velocities were reviewed and found to be less than 2 fps for about 97% ofthe yard areas. The only areas where velocities exceed 2 fps are in portions of the flowpath north of the power block and at the southeast of the main plant just before therunoff enters the SWP. Velocities are higher where the runoff flows down the westembankment slope. That slope is protected by riprap. See attached figure, velocitycolor legend on left.
Document Control DeskCR-12-01098RC-14-0050Enclosure IPage 9 of 10
016o.7
5.0 -
4k0
3.0
2.0
1.0
0.0
Notes:Velocity (ft/sec) is shown in the color legend on leftHigh velocities on or near buildings represent flow off the buildings.
* Concurrent site conditions, including adverse weather:
PMP/LIP is not associated with antecedent or concurrent events that would impactimplementation of preventive measures.
" Groundwater ingress:
Only the LIP precipitation event is applicable at VCSNS. The duration of the event isonly approximately 12 hours. The groundwater ingress due to LIP event is not expectedto appreciably increase during LIP event. Due to large fluid storage volumes in plantbasements, no impact on Safety Related SSCs is expected due to groundwater ingress.
Document Control DeskCR-12-01098RC-14-0050Enclosure IPage 10 of 10
References:
1. NRC Letter, "Request for Information Pursuant to Title 10 of the Code of FederalRegulations 50.54(0 Regarding Recommendations 2.1, 2.3, and 9.3, of the Near-TermTask Force Review of Insights from the Fukushima Dai-ichi Accident," March 12, 2012[ML12053A340]
2. NRC Japan Lessons-Learned Project Directorate, JLD-ISG-2012-05, "Guidance forPerforming the Integrated Assessment for External Flooding," Revision 0, November30, 2012 [ML12311A214]
3. NRC Letter, D.L. Skeen (NRC) to J.E. Pollock (NEI), "Trigger Conditions forPerforming an Integrated Assessment and Due Date for Response," December 3, 2012[ML12326A912]
4. SCE&G to NRC, Flooding Reevaluation Results for Virgil C. Summer Unit 1 dateda. March 12, 2013 [ML13073A117]
5. Calculation DC02060-005, Revision 0, Stormwater Runoff from Fukushima NTTFRecommendation 2.1 PMP Event on Plant Site and Service Water Pond for Unit 1 datedApril 29, 2013.
6. Calculation DC02060-007, Revision 0, Estimation of Fukushima NTTF Recommendation2.1 Probable Maximum Precipitation (PMP) for Monticello Reservoir for Unit 1 datedApril 29, 2013.
7. Calculation DC02060-008, Revision 0, Est of Fukushima NTTF Recommendation 2.1Probable Max Flood (PMF) Elev for Monticello Reservoir & the SWP for Unit 1 datedApril 29, 2013.
8. GMP-101.002 " Identification, Restoration or Modification Control of Security Barriers"Revision 6 Change A
9. Operations Administrative Procedure OAP -100.4 "Communication" Revision 2
10. Operations Administrative Procedure OAP-1 09.1 "Guideline for Severe Weather"Revision 3, Attachment I
11. System Operating Procedure SOP-207 "Circulating Water" Revision 22 Section IV. H.
12. Letter from Shawn Williams to Thomas D. Gatlin dated January 30, 2014, Virgil C.Summer Nuclear Station, Unit 1 (VCSNS) - Request for Additional Information (TAC NO.MF1 112) [ML14023A740]