Thomas A. Russo - Value Investor Conference VIC 15 New... · Musings on “Global Value” Equity...
35
Thomas A. Russo Omaha Value Dinner Omaha April 30, 2015
Transcript of Thomas A. Russo - Value Investor Conference VIC 15 New... · Musings on “Global Value” Equity...
Thomas A. Russo
Omaha Value DinnerOmaha
April 30, 2015

2

3

4

Musings on “Global Value” Equity Investing
5
• Value Investing – 50 Cent Dollar Bills• Stanford Business and Law School, 1982
• “Capacity to Reinvest”• 2008 market collapse
• “Capacity to Suffer”• Berkshire Hathaway
• Nestlé – 35 year “planning horizon”
• Pernod Ricard – credit default swap mayhem
• SABMiller emerging market beer specialist
• Invest for the long term• White space
• Position capital globally
• Currency gains
• Circle of competence
• Tax efficiency
• Virtues of low expectations!
• Concentrate – few great ideas
• Market volatility is long-term investor friend

6
“Capacity to Suffer”
• BERKSHIRE HATHAWAY INC.
• GEICO
• Equity index put options
• Extraordinarily cautious short-term deposits,
fiscal year, 2007
7
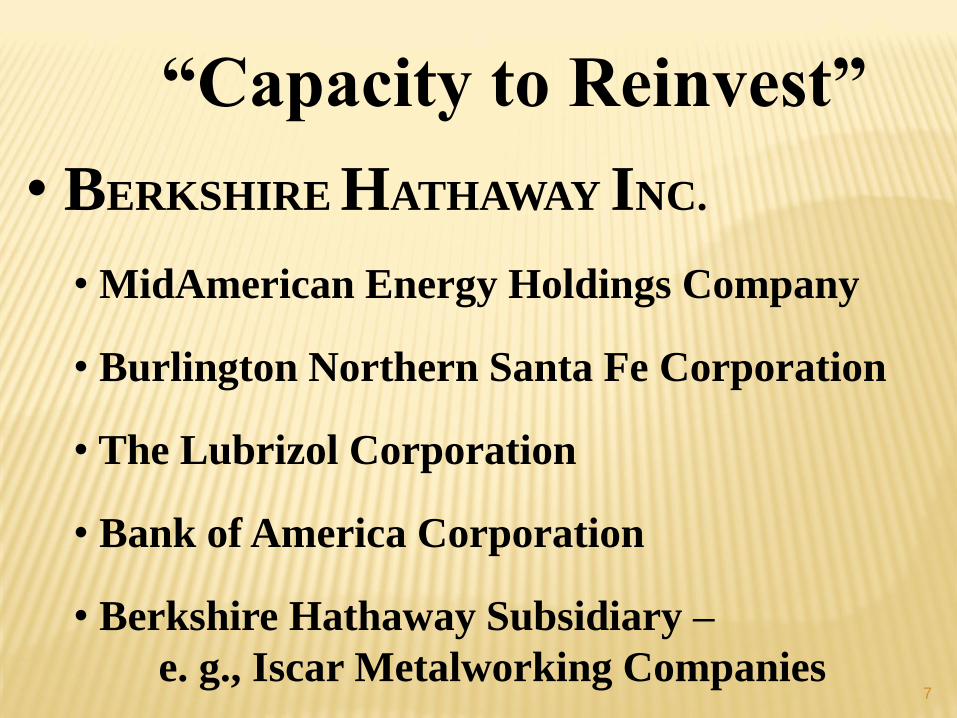
“Capacity to Reinvest”
• BERKSHIRE HATHAWAY INC.
• MidAmerican Energy Holdings Company
• Burlington Northern Santa Fe Corporation
• The Lubrizol Corporation
• Bank of America Corporation
• Berkshire Hathaway Subsidiary –
e. g., Iscar Metalworking Companies

8
Nestlé S.A.“Capacity to Reinvest”
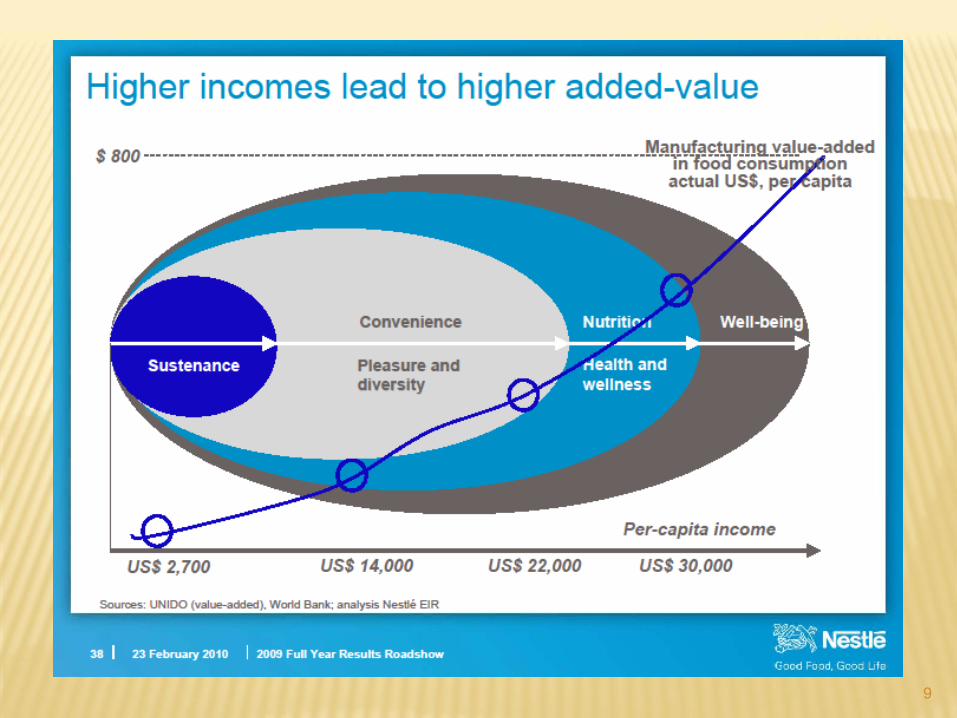
9

YE 2008 Billionaire Brands Presentation
10
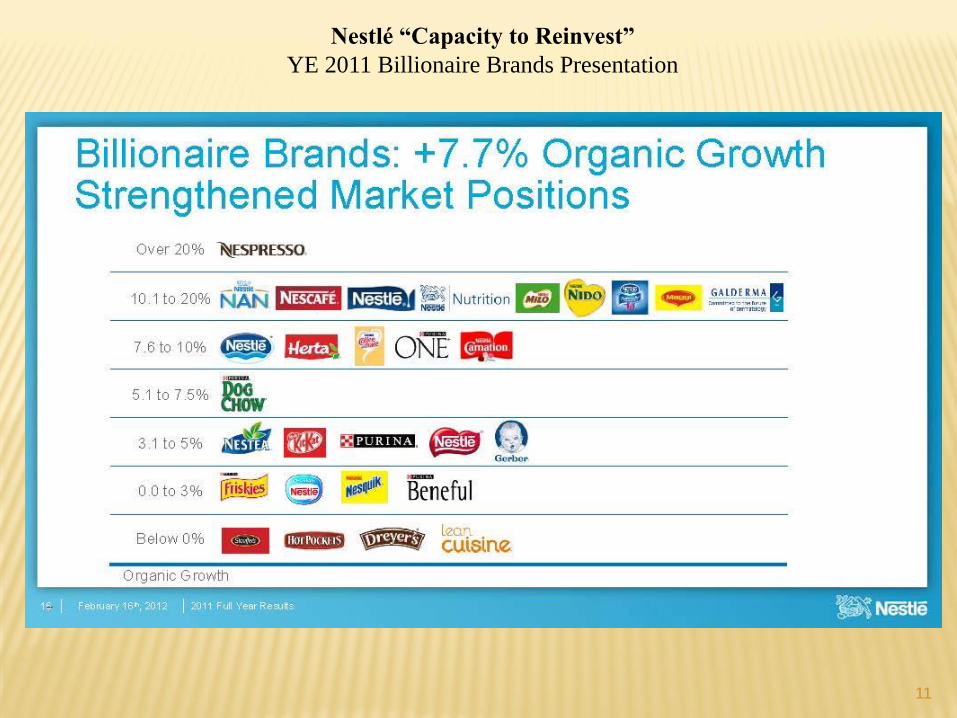
Nestlé “Capacity to Reinvest”
YE 2011 Billionaire Brands Presentation
11

Nestlé “Capacity to Suffer”
• Russian Ruble crisis (1998)
• Nespresso
• China and India
• Alcon (1970’s through 2010)
• Novartis payment/DiGiorno acquisition (2010)
• 2011 Chinese acquisitions in confectionary (Hsu Fu Chi International)
and beverage (Yinlu.)
• 2012 Wyeth Infant Health and Nutrition Acquisition
12

13
Pernod Ricard“Capacity to Reinvest”
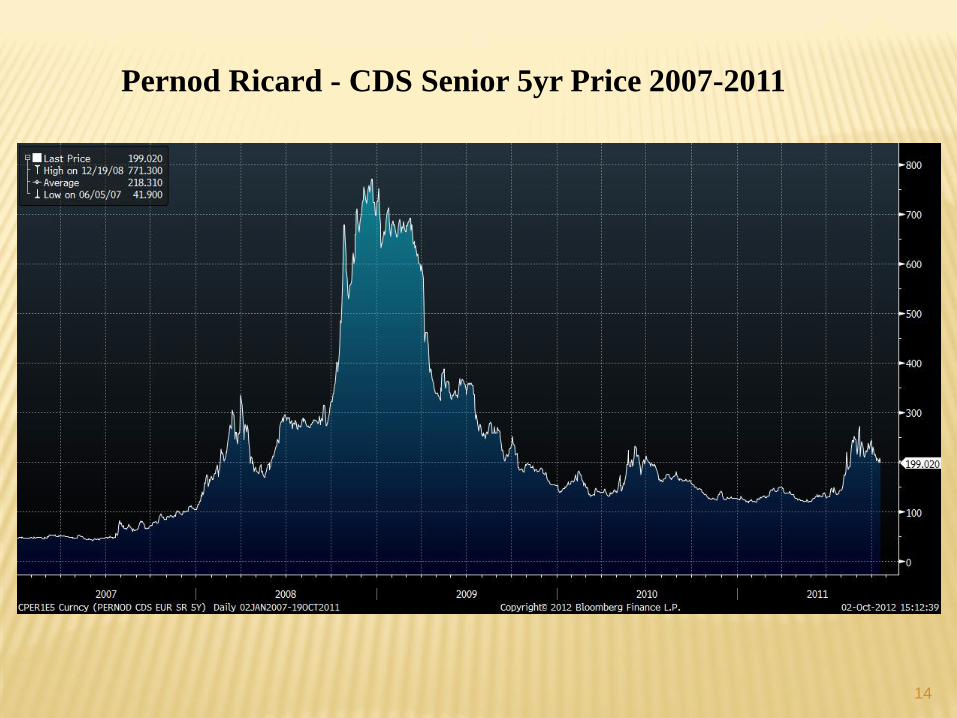
14
Pernod Ricard - CDS Senior 5yr Price 2007-2011

Pernod Ricard “Capacity to Suffer”
• China (early 2000’s)
• Addressable market -- over 500 million cases local spirits
• Absolut (2009) – global leader & premium vodka
• India (2012)
• Addressable market -- over 100 million cases of India made
Scotch Whiskey currently consumed
• Leading premium priced local Scotch Whiskey brand
• Patrick Ricard – “Making Mistakes Today…”
15

16
SABMiller “Capacity to Reinvest”

17
Credit Default Swap Mayhem: 2008-2009SABMiller CDS Senior 5yr Price 2007-2011
18

SABMiller “Capacity to Suffer”
• China
• 50% interest in Snow, China’s leading brewer
• Sub-Saharan Africa
• Addressable market – 400 million barrels beer consumption
• “Double the price, halve the price, go farming”
• Indian Market
• Addressable market – current consumption 1 liter per capita
• Recently completed Foster’s acquisition
• Strategic partnership with Efes to coordinate Russian operations
and expand together in Turkey, Efes’ home market
19
20
“Capacity to Suffer” – Necessary
But Not Sufficient
21
Market Volatility is a Friend of the Long-term
“Global Value” Investor
1. Permits more effective reinvestment.
2. Offers merger and acquisition opportunity.
3. Enhances return from share repurchase.

22
“Capacity to Suffer”

23
Semper Vic Partners, L.P., Annual ReturnSemper Vic Dow Jones S & P
Year Partners Industrials 500
2015 (thru 3/31) 0.9% 0.3% 1.0%
2014 6.1% 10.0% 13.7%
2013 21.9% 29.7% 32.4%
2012 24.2% 10.2% 16.0%
2011 6.7% 8.4% 2.1%
2010 21.5% 14.0% 15.1%
2009 25.8% 22.7% 26.5%
2008 -31.5% -31.9% -37.0%
2007 7.7% 8.9% 5.5%
2006 20.8% 19.1% 15.8%
2005 3.2% 1.7% 4.9%
2004 11.9% 5.3% 10.9%
2003 33.5% 28.3% 28.7%
2002 -1.0% -15.1% -22.1%
2001 0.1% -5.4% -11.9%
2000 15.6% -4.7% -9.1%
1999 -2.1% 27.2% 21.0%
1998 23.8% 18.1% 28.6%
1997 24.7% 24.9% 33.4%
1996 19.0% 28.8% 23.0%
1995 23.6% 36.9% 37.5%
1994 12.4% 5.0% 1.3%
1993 22.1% 16.7% 10.1%
1992 13.4% 7.4% 7.6%
1991 27.4% 24.5% 30.5%
1990 5.3% -0.7% -3.1%
1989 24.6% 31.8% 31.7%
1988 19.8% 16.2% 16.5%
1987 37.1% 5.5% 5.2%
1986 24.8% 27.2% 18.8%
1985 43.9% 33.6% 31.7%
1984 13.6% 1.0% 6.2%
Compound Annual Return 15.1% 11.9% 11.1%
*Please see important disclosure information that accompanies this presentation.

24
*Please see important disclosure information that accompanies this presentation.

25
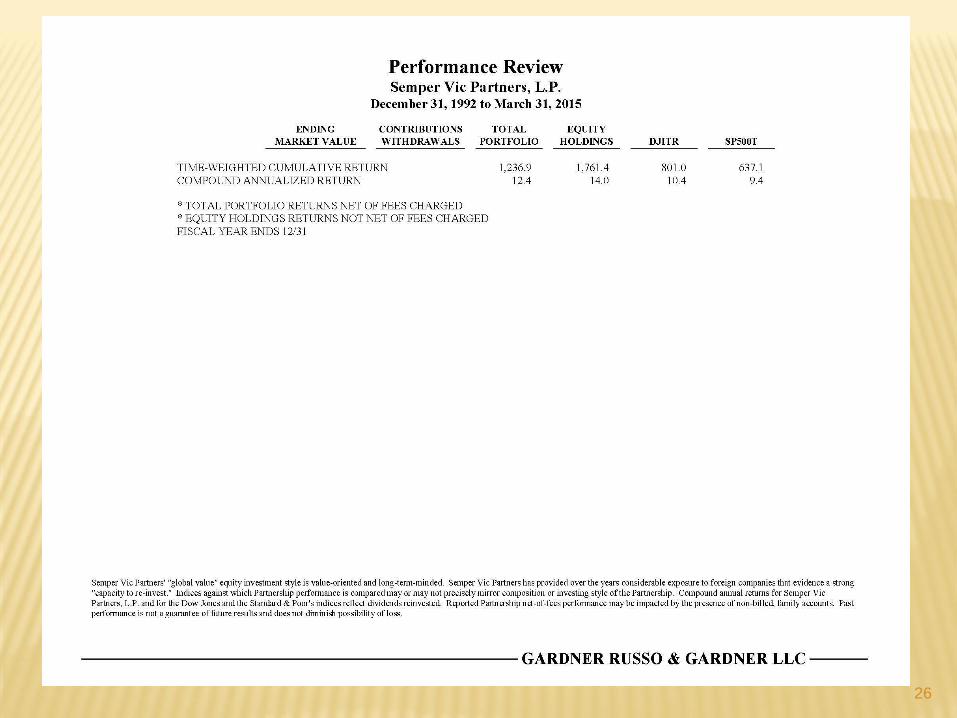
26
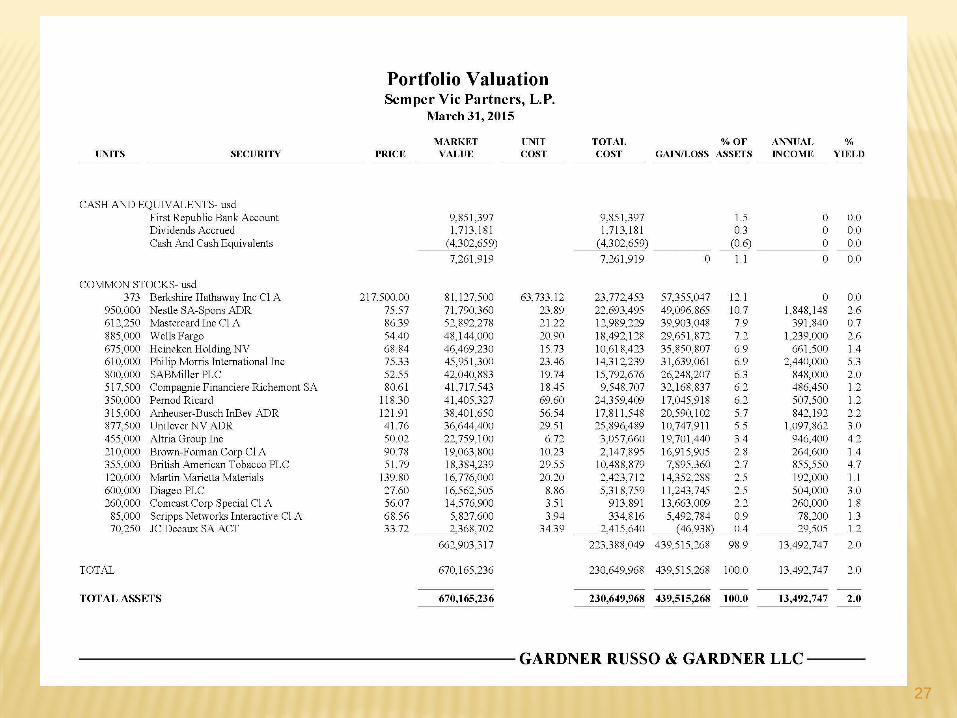
27

28
Summary Table
Semper Vic Partners, L.P.
Weighted Average Analysis of Emerging Market Revenue
Company 2015E 2014E 2013 2012 2011 2010 2009 2008
Phillip Morris International 4.5% 4.4% 4.3% 4.6% 4.9% 4.5% 3.8% 3.6%
SABMiller 4.5% 4.4% 4.1% 4.2% 4.5% 4.4% 4.3% 3.0%
Nestle 5.0% 4.8% 4.6% 4.5% 4.3% 4.2% 4.0% 4.1%
Heineken 4.5% 4.4% 4.3% 4.5% 4.0% 3.5% 2.9% 2.0%
British American Tobacco 2.3% 2.3% 2.2% 2.8% 3.0% 2.7% 2.5% 1.5%
Compagnie Financiere Richemont 3.2% 3.0% 2.4% 2.7% 2.9% 2.5% 2.5% 1.3%
Pernod Ricard 2.6% 2.5% 2.3% 2.6% 2.5% 2.0% 2.0% 1.5%
Unilever 2.8% 2.7% 2.7% 2.3% 2.2% 2.2% 2.0% 1.4%
Anheuser-Busch InBev 2.5% 2.4% 2.3% 2.0% 1.6% 1.0% na na
Mastercard 2.2% 2.1% 2.0% 1.3% 1.1% 0.6% na na
Diageo 1.4% 1.3% 1.2% 1.3% 1.2% 1.0% 1.0% 1.1%
Brown-Forman 0.4% 0.4% 0.4% 0.4% 0.4% 0.3% 0.3% 0.4%
Hasbro na na na 0.0% 0.1% 0.1% 0.1% 0.1%
Altria 0.0% 0.0% 0.0% 0.0% 0.0% 0.0% 0.0% 0.0%
Berkshire Hathaway 0.0% 0.0% 0.0% 0.0% 0.0% 0.0% 0.0% 0.0%
Berner Gruppen na 0.0% 0.0% 0.0% 0.0% 0.0% 0.0% 0.0%
Cadbury na na na na na na na 0.6%
Comcast 0.0% 0.0% 0.0% 0.0% 0.0% 0.0% 0.0% 0.0%
Martin Marietta Materials 0.0% 0.0% 0.0% 0.0% 0.0% 0.0% 0.0% 0.0%
Norges Handels na 0.0% 0.0% 0.0% 0.0% 0.0% 0.0% 0.0%
Scripps Networks Interactive 0.0% 0.0% 0.0% 0.0% 0.0% 0.0% 0.0% 0.0%
Washington Post 0.0% 0.0% 0.0% 0.0% 0.0% 0.0% 0.0% 0.0%
Wells Fargo 0.0% 0.0% 0.0% 0.0% 0.0% 0.0% 0.0% 0.0%
Semper Vic Partners Emerging
Market Revenue as % of Total 36.0% 34.8% 32.7% 33.3% 32.4% 29.1% 25.4% 20.6%
Notes:
Analysis excludes cash held in portfolio, which is generally less than 2% of portfolio.
Data from company reports, Capital IQ and GRG estimates.
29
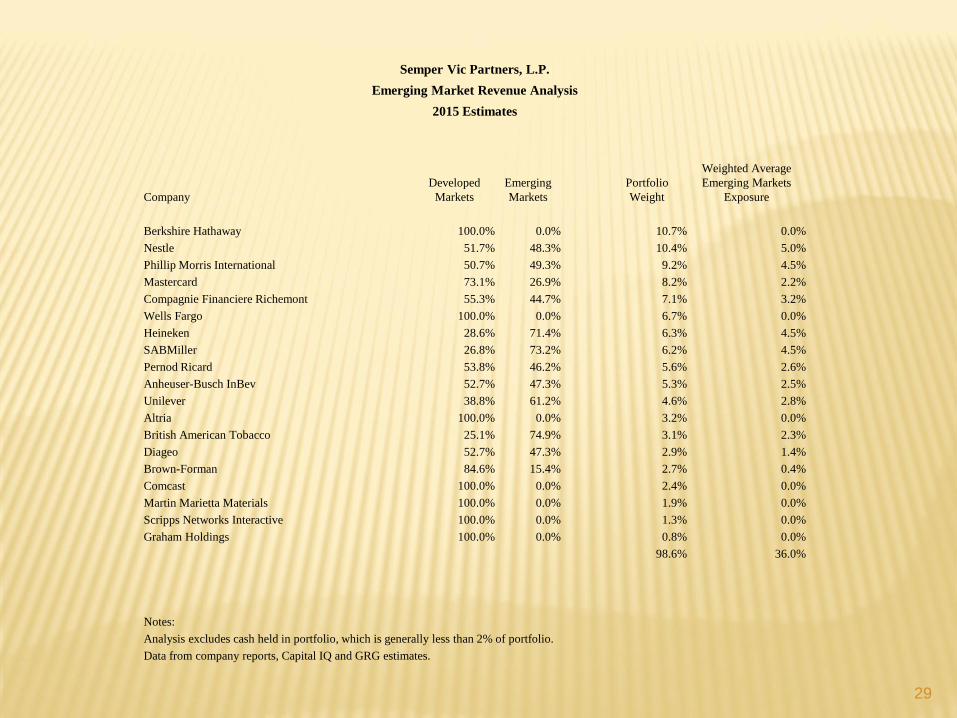
Semper Vic Partners, L.P.
Emerging Market Revenue Analysis
2015 Estimates
Company
Developed
Markets
Emerging
Markets
Portfolio
Weight
Weighted Average
Emerging Markets
Exposure
Berkshire Hathaway 100.0% 0.0% 10.7% 0.0%
Nestle 51.7% 48.3% 10.4% 5.0%
Phillip Morris International 50.7% 49.3% 9.2% 4.5%
Mastercard 73.1% 26.9% 8.2% 2.2%
Compagnie Financiere Richemont 55.3% 44.7% 7.1% 3.2%
Wells Fargo 100.0% 0.0% 6.7% 0.0%
Heineken 28.6% 71.4% 6.3% 4.5%
SABMiller 26.8% 73.2% 6.2% 4.5%
Pernod Ricard 53.8% 46.2% 5.6% 2.6%
Anheuser-Busch InBev 52.7% 47.3% 5.3% 2.5%
Unilever 38.8% 61.2% 4.6% 2.8%
Altria 100.0% 0.0% 3.2% 0.0%
British American Tobacco 25.1% 74.9% 3.1% 2.3%
Diageo 52.7% 47.3% 2.9% 1.4%
Brown-Forman 84.6% 15.4% 2.7% 0.4%
Comcast 100.0% 0.0% 2.4% 0.0%
Martin Marietta Materials 100.0% 0.0% 1.9% 0.0%
Scripps Networks Interactive 100.0% 0.0% 1.3% 0.0%
Graham Holdings 100.0% 0.0% 0.8% 0.0%
98.6% 36.0%
Notes:
Analysis excludes cash held in portfolio, which is generally less than 2% of portfolio.
Data from company reports, Capital IQ and GRG estimates.

30

Semper Vic Partners, L.P.
Table of Historical Holdings
Presented as of December 31, 2014
Company 2014 2013 2012 2011 2010 2009 2008 2007 2006 2005 2004 2003 2002 2001 2000
Berkshire Hathaway Inc 12.6% 10.7% 10.4% 9.7% 10.2% 9.9% 11.4% 11.0% 9.1% 8.4% 7.2% 7.2% 7.7% 7.3% 5.0%
Nestle SA 10.3% 10.4% 10.5% 10.3% 11.8% 12.1% 11.9% 9.1% 6.8% 6.3% 5.1% 5.1% 5.2% 5.2% 5.2%
Mastercard Inc 7.9% 8.2% 6.0% 5.3% 2.8% - - - - - - - - - -
Wells Fargo & Company 7.3% 6.7% 5.6% 4.7% 4.5% 3.8% 5.1% 4.2% 4.0% 4.2% 3.6% 3.9% 4.1% 3.8% 5.0%
Philip Morris International Inc 7.2% 9.2% 9.4% 12.9% 10.4% 9.1% 9.0% - - - - - - - -
CIE Financiere Richemont SA 6.7% 7.1% 8.2% 6.4% 8.3% 7.2% 5.0% 5.2% 5.1% 4.9% 4.8% 3.9% 3.3% 3.0% 3.9%
Heineken Holding NV 6.2% 6.4% 7.3% 6.2% 6.5% 7.9% 6.4% 7.5% 5.8% 4.8% 4.8% 4.6% 4.8% 5.2% 6.7%
SABMiller PLC 6.2% 6.2% 6.6% 6.4% 6.7% 7.0% 4.6% - - - - - - - -
Pernod-Ricard SA 5.7% 5.6% 6.4% 6.1% 6.2% 6.1% 4.9% 3.0% 2.6% 2.3% 1.6% - - - -
Anheuser-Busch InBev 5.3% 5.3% 4.9% 3.7% 2.9% - - - - - - - - - -
Unilever NV 5.0% 4.6% 4.4% 4.3% 4.1% 4.1% 3.0% 3.4% 2.6% 2.4% 2.0% - - - -
Altria Group Inc 3.6% 3.2% 3.4% 4.5% 3.9% 3.9% 3.9% 9.5% 9.0% 9.1% 7.7% 7.7% 7.2% 8.3% 7.6%
British American Tobacco PLC 2.9% 3.1% 3.6% 4.6% 4.0% 3.4% 2.3% - - - - - - - -
Brown-Forman Corp 2.7% 2.7% 2.8% 3.2% 3.0% 3.0% 3.8% 3.1% 3.0% 3.9% 3.0% 3.2% 2.9% 2.6% 2.6%
Diageo PLC 2.5% 2.9% 3.1% 3.0% 3.0% 3.4% 3.5% 3.4% 3.6% 3.2% 3.1% 2.8% 3.0% 3.6% 3.8%
Comcast Corp 2.2% 2.4% 2.4% 1.9% 3.1% 4.1% 4.4% 3.7% 5.5% 3.5% 4.3% 3.9% 4.1% 3.3% 3.4%
Martin Marietta Materials Inc 1.9% 1.9% 2.1% 2.3% 2.9% 3.4% 4.7% 4.9% 4.3% 4.2% 3.6% 3.5% 2.8% 3.2% 2.7%
Scripps Networks Interactive 0.9% 1.3% 1.3% 1.4% 1.9% 3.1% 1.9% - - - - - - - -
Graham Holdings Co 0.6% 0.8% 0.6% 1.0% 1.6% 2.5% 2.2% 2.9% 2.7% 3.1% 4.3% 3.9% 5.5% 4.6% 4.8%
Berner Gruppen AS 0.2% 0.3% 0.4% 0.5% 0.4% 0.7% 1.2% 1.0% 1.1% 1.0% 0.8% 1.1% 0.5% 0.6%
NHST Media Group 0.1% 0.1% 0.2% 0.2% 0.2% 0.3% 0.5% 0.4% 0.4% 0.3% 0.3% 0.5% 0.4% 1.1%
Hasbro Inc 0.3% 0.4% 0.9% 0.8% 1.0% 1.6% 2.1% 2.3% 2.5% 3.2% 1.9% 2.3% 0.7%
Cadbury 3.9% 1.7% 2.7% 2.4% 2.2% 1.7% - - - -
Telegraaf Holding 1.0% 3.4% 3.3% 3.3% 4.5% 4.8% 4.6% 4.4% 5.3%
Philip Morris CR 0.5% 0.4% 0.5% 0.8% 0.9% 1.0% 1.7% 1.6% 0.9%
EW Scripps Company 0.1% 2.8% 3.0% 3.3% 3.4% 3.8% 4.7% 4.7% 5.4%
UST Inc 4.8% 4.8% 4.0% 4.9% 3.8% 5.1% 5.7% 3.8%
American International Group Inc 4.0% 4.1% 4.4% 3.8% 3.8% 3.2% 4.6% 4.4%
H&R Block Inc 1.4% 2.1% 2.7% 2.9% 3.7% 3.1% 3.5% -
McClatchy Company 1.4% 2.7% 2.0% 2.3% 2.5% 2.7% 2.2% 1.6%
Kraft Foods Inc 1.3% 1.4% 2.1% 2.9% 2.7% 3.3% 2.9% -
Schweitzer-Mauduit International Inc 1.1% 1.6% 1.9% 3.0% 2.9% 3.2% 3.1% 2.0%
International Speedway Corp 1.0% 1.4% 1.5% 1.7% 1.5% 1.6% 1.7% 1.7%
Readymix PLC 0.2% 0.4% 0.8% 1.0% 1.3% 1.0% 0.9% 1.1%
Partridge Fine Art 0.1% 0.1% 0.1% 0.2% 0.2% 0.2% 0.2% 0.3%
Citigroup Inc 3.2% 3.1% 3.0% 3.3% 3.1% 1.7% 2.0%
Wegener NV 0.9% 1.5% 2.0% 1.6% 1.1% 0.5% 0.4%
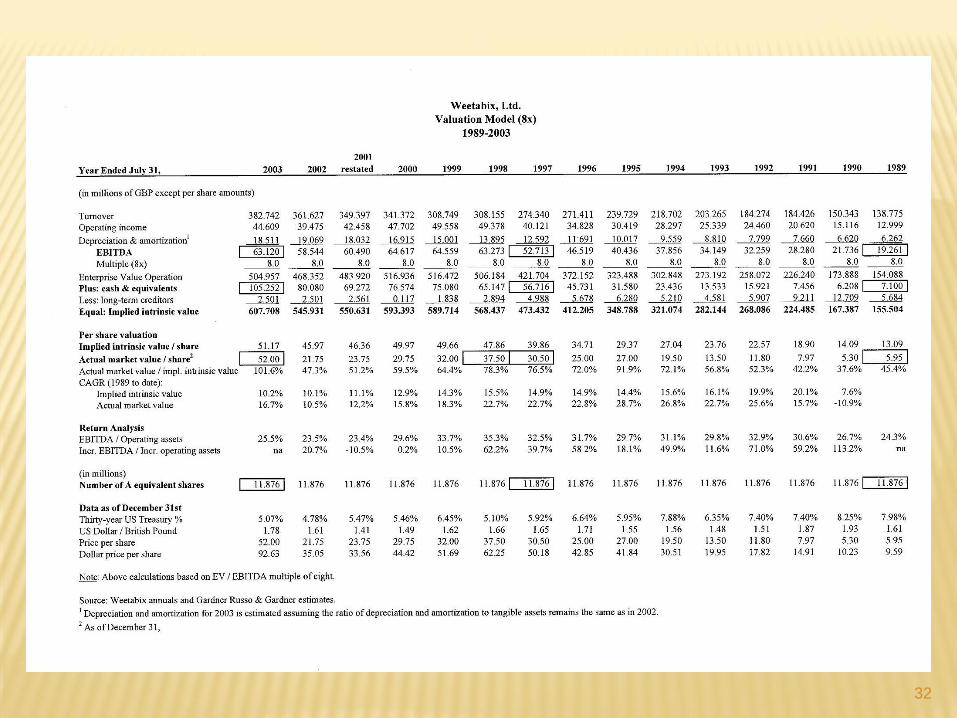
Weetabix 8.2% 4.2% 5.0% 4.7%
Corby Distilleries Ltd 0.3% 0.4%
Morgan Stanley Dean Witter Discover 1.3%
Fortnum & Mason PLC 0.1%
Total common equity 97.9% 99.0% 99.7% 98.8% 99.5% 99.2% 93.2% 98.6% 99.4% 97.8% 97.2% 99.2% 97.1% 96.5% 88.4%
Cash and other 2.1% 1.0% 0.3% 1.2% 0.5% 0.8% 6.8% 1.4% 0.6% 2.2% 2.8% 0.8% 2.9% 3.5% 11.6%
Total partnership 100.0% 100.0% 100.0% 100.0% 100.0% 100.0% 100.0% 100.0% 100.0% 100.0% 100.0% 100.0% 100.0% 100.0% 100.0%
32
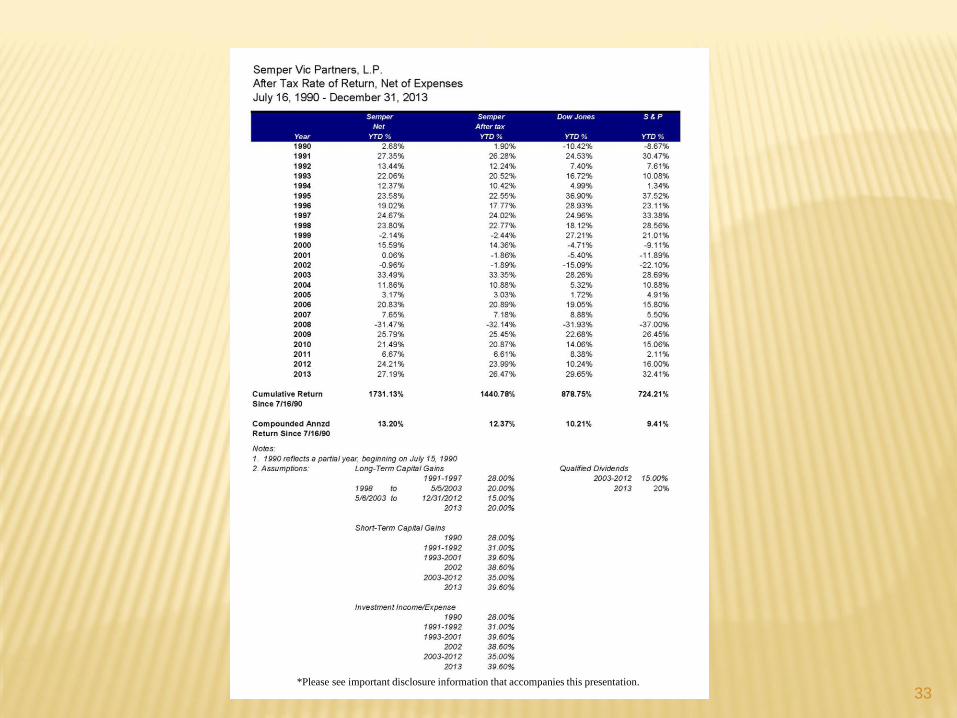
33*Please see important disclosure information that accompanies this presentation.

34
35
Disclosure
* Semper Vic Partners' "global value" equity investment style is value-oriented and
long-term-minded. Semper Vic Partners has provided over the years considerable
exposure to foreign companies that evidence a strong "capacity to re-invest".
Indices against which Partnership performance is compared may or may not precisely
mirror composition or investing style of the Partnership. Compound annual returns
for Semper Vic Partners, L.P. and for the Dow Jones and the Standard & Poor's
indices reflect dividends reinvested. Semper Vic Partners' results are for Semper Vic,
a general partnership, through July 15, 1990 and for its successor limited partnership,
Semper Vic Partners, L.P., thereafter. Annual returns are audited limited partner
returns and are expressed net of all expenses. Reported Partnership net-of-fees
performance may be impacted by the presence of non-billed, family accounts.
Any results that include Semper Vic Partners, L.P. estimated monthly performance
(including year-to-date and compound annual performance) are unaudited. Past
performance is not a guarantee of future results and does not diminish possibility
of loss.