![[Albania] New Albania I.pdf](https://static.fdocuments.net/doc/165x107/544cfeb4b1af9f710c8b499e/albania-new-albania-ipdf.jpg)
This report has been prepared on the basis of the ... · Turkey Greece Croatia Hungary Italy Poland...
71
Transcript of This report has been prepared on the basis of the ... · Turkey Greece Croatia Hungary Italy Poland...


�
�
This report has been prepared on the basis of the limitations set out in the engagement letter and the matters noted in the Important Notice From Deloitte on page 1.
Deloitte refers to one or more of Deloitte Touche Tohmatsu Limited (“DTTL”), a UK private company limited by guarantee, and its network of member firms, each of which is a legally separate and independent entity. Please see www.deloitte.co.uk/about for a detailed description of the legal structure of DTTL and its member firms. Deloitte LLP is a limited liability partnership registered in England and Wales with registered number OC303675 and its registered office at 2 New Street Square, London, EC4A 3BZ, United Kingdom. Deloitte LLP is the United Kingdom member firm of DTTL.
© 2012 Deloitte LLP

�
©�2012�Deloitte�LLP.���
Contents
Important�notice�from�Deloitte�.........................................................................................�4�
Mobile�communications�and�taxation�in�Turkey�...........................................................�2�
1.� Mobile�communications�in�Turkey�..............................................................................................�2�2.� The�economic�contribution�of�mobile�telephony�to�the�economy�...........................................�2�3.� Taxation�on�consumers�and�MNOs�.............................................................................................�5�4.� Impacts�of�taxation�reductions�...................................................................................................�10�
Appendix�A� The�economic�impact�of�mobile�telephony�in�Turkey�....................�13�
A.1� Approach�to�estimating�the�economic�impact�..........................................................................�13�A.2� Benefits�to�the�supply�side�of�the�economy�..............................................................................�14�A.3� Impact�on�employment�...............................................................................................................�18�A.4� Value�add�from�taxation�..............................................................................................................�20�A.5� Overall�benefits�to�the�economy�.................................................................................................�21�A.6� Other�potential�impacts�...............................................................................................................�22�
Appendix�B� Taxation�on�MNOs�and�consumers�in�Turkey�................................�27�
B.1� Mobile�specific�taxation�...............................................................................................................�27�B.2� Mobile�specific�taxation�on�consumers�.....................................................................................�27�B.3� Taxation�on�MNOs�.......................................................................................................................�36�B.4� Implications�for�MNOs�................................................................................................................�37�B.5� Impact�of�changes�in�taxation�policy�.........................................................................................�40�
Appendix�C� Methodology�and�assumptions�.........................................................�47�
C.1� Estimation�of�the�economic�impact�of�mobile�telephony�........................................................�47�C.2� Impacts�of�the�reduction�of�mobile�specific�taxes�....................................................................�58�
�
��������������

�
©�2012�Deloitte�LLP.���
�
Important�notice�from�Deloitte�
This�report�(the�“report”)�has�been�prepared�by�Deloitte�LLP�(“Deloitte”)�for�the�GSM�Association�in�accordance�with�the�engagement�letter�dated�1�July�2011,�and�on�the�basis�of�the�scope�and�limitations�set�out�below.�
The�report�has�been�prepared�solely�for�the�purposes�of�assessing�the�structure�and�impact�of�mobile�telephony�and�taxation�of�mobile�telephony�in�Turkey�as�part�of�a�wider�study�on�taxation�of�mobile�telecommunications�services.�It�should�not�be�used�for�any�other�purpose�or�in�any�other�context,�and�Deloitte�accepts�no�responsibility�for�its�use�in�either�regard.�
The�report�is�provided�exclusively�for�the�GSMA’s�use�under�the�terms�of�the�Contract.��No�party�other�than�the�GSMA�is�entitled�to�rely�on�the�report�for�any�purpose�whatsoever�and�Deloitte�accepts�no�responsibility�or�liability�or�duty�of�care�to�any�party�other�than�the�GSMA�in�respect�of�the�report�and/or�any�of�its�contents.�
As�set�out�in�the�engagement�letter,�the�scope�of�our�work�has�been�limited�by�the�time,�information�and�explanations�made�available�to�us.�The�information�contained�in�the�report�has�been�obtained�from�the�GSMA,�its�members�and�third�party�sources�that�are�clearly�referenced�in�the�appropriate�sections�of�the�report.��Deloitte�has�neither�sought�to�corroborate�this�information�nor�to�review�its�overall�reasonableness.��Further,�any�results�from�the�analysis�contained�in�the�report�are�reliant�on�the�information�available�at�the�time�of�writing�the�report�and�should�not�be�relied�upon�in�subsequent�periods.�
Accordingly,�no�representation�or�warranty,�express�or�implied,�is�given�and�no�responsibility�or�liability�is�or�will�be�accepted�by�or�on�behalf�of�Deloitte�or�by�any�of�its�partners,�employees�or�agents�or�any�other�person�as�to�the�accuracy,�completeness�or�correctness�of�the�information�contained�in�this�document�or�any�oral�information�made�available�and�any�such�liability�is�expressly�disclaimed.�
All�copyright�and�other�proprietary�rights�in�the�report�remain�the�property�of�Deloitte�LLP�and�any�rights�not�expressly�granted�in�these�terms�or�in�the�change�order�are�reserved.�
This�report�and�its�contents�do�not�constitute�financial�or�other�professional�advice,�and�specific�advice�should�be�sought�about�your�specific�circumstances.��In�particular,�the�report�does�not�constitute�a�recommendation�or�endorsement�by�Deloitte�to�invest�or�participate�in,�exit,�or�otherwise�use�any�of�the�markets�or�companies�referred�to�in�it.��To�the�fullest�extent�possible,�both�Deloitte�and�the�GSM�Association�disclaim�any�liability�arising�out�of�the�use�(or�non�use)�of�the�report�and�its�contents,�including�any�action�or�decision�taken�as�a�result�of�such�use�(or�non�use).�
�

�
©�2012�Deloitte�LLP. 2
Mobile communications and taxation in Turkey
This�report�was�commissioned�by�the�GSM�Association�(‘the�GSMA’)�to�examine�the�economic�contribution�of�mobile�telephony�and�the�impact�of�mobile�specific�taxation�in�Turkey.�The�report�provides�an�analysis�of�the�impact�of�mobile�telephony�on�Turkish�citizens�and�the�economy�in�the�last�four�years�(2008�2011).�It�also�describes�the�level�of�taxation�that�applies�to�mobile�consumers�and�Mobile�Network�Operators�(‘MNOs’)�in�Turkey,�evaluating�the�effects�that�mobile�specific�taxes�have�on�the�industry�and�the�wider�economy.��
The�report�summarises�the�detailed�analysis�contained�in�a�series�of�annexes�and�is�based�on�discussions�and�data�provided�by�Turkcell�and�Vodafone,�and�on�discussions�undertaken�with�Avea�and�other�stakeholders.��Additional�data�has�been�provided�by�the�GSMA�and�taken�from�publicly�available�sources�that�are�referenced�in�the�report�or�annexes.�
1. Mobile communications in Turkey
Turkey�has�a�well�established�mobile�market�characterised�by�three�MNOs,�Turkcell,�Vodafone�and�Avea,�each�enjoining�a�market�share�of�approximately�52.8%,�27.6%�and�19.6%�respectively�in�2011.�
Total�mobile�subscribers�were�over�65�million�in�Q4�2011,�representing�a�penetration�of�88.5%.�Mobile�penetration�in�Turkey�increased�until�2008,�since�when�it�has�slightly�fallen�as�a�result�of�mobile�number�portability,�while�taxation�on�SIM�cards�and�connections�discourages�consumers�from�owning�more�than�one�SIM�card.�Notably,�penetration�has�failed�to�reach�the�100%�milestone�that�is�common�in�European�countries.��
GSM�networks�cover�99%�of�the�population.��Mobile�telephony�also�provides�wireless�data�and�broadband�to�38.2%�of�the�total�mobile�customers,�with�3G�services�launched�in�2009�and�the�expectation�from�the�MNOs�that�LTE�trials�will�be�rolled�out�by�the�end�of�this�year.�
Figure�1:�Mobile�and�3G�penetration�levels�in�Turkey,�2011�
�Source:�Wireless�intelligence�and�MNOs’�data�
2. The economic contribution of mobile telephony to the economy
Mobile�telephony�in�Turkey�generates�significant�economic�impacts�through�effects�on�the�supply�side�of�the�economy,�employment,�increases�in�productivity�and�benefits�gained�by�Turkish�consumers.�
In�addition�to�the�three�MNOs,�the�mobile�communications�ecosystem�in�Turkey�is�formed�by�players�such�as�equipment�providers,�typically�international�equipment�manufacturers�with�offices�in�Turkey,�and�providers�of�other�network�services�such�as�installation�and�maintenance;�handset�importers�and�distributors;�airtime�distributors�and�sellers,�which�include�a�host�of�retail�points�throughout�the�country;�and�suppliers�of�other�services�to�MNOs�such�as�advertising,�accounting�and�other�support�services.�
�
� �
0%
10%
20%
30%
40%
50%
60%
70%
80%
90%
100%
2001 2002 2003 2004 2005 2006 2007 2008 2009 2010 2011
Mobile�penetration 3G�penetration

�
©�2012�Deloitte�LLP. 3
Figure�2:�Mobile�communications�ecosystem�in�Turkey�
�
This�report�estimates�the�economic�impact�of�the�mobile�industry�in�terms�of�the�direct�and�indirect�effects�provided�to�the�supply�side�of�the�Turkish�economy�by�the�MNOs�and�by�players�in�the�wider�mobile�ecosystem,�and�of�direct�and�indirect�employment�from�firms�in�the�ecosystem.��
The�report�also�discusses�the�potential�productivity�increases�resulting�from�mobile�workers�using�their�phones�for�business�purposes�and�the�social�benefits�enjoyed�by�consumers�as�a�result�of�access�to�mobile�services.�
Supply side impact
MNOs�provide�numerous�benefits�to�the�supply�side�of�the�Turkish�economy�through�the�direct�effect�of�their�expenditure,�and�these�benefits�are�then�transmitted�to�related�industries�in�the�mobile�ecosystem�and�more�widely�across�the�economy.��
In�2011�the�mobile�communications�industry�has�contributed�TRY�28.8�billion�from�supply�side�impacts�to�the�Turkish�economy.��
Figure�3:�Supply�side�value�add�of�mobile�communications�in�Turkey,�TRY�millions�
�Source:�Deloitte�analysis�
To�calculate�the�value�add�generated�by�the�industry,�firstly�the�value�add�created�by�the�mobile�communications�industry�was�estimated.�This�consists�of�the�value�created�by�MNOs’�expenditure�on�wages,�corporate�and�social�responsibility�(‘CSR’)�programmes,�dividends�paid�by�MNOs�and�taxes�recovered�as�a�result�of�the�MNOs’�operations.��
In�addition,�the�indirect�impacts�from�MNOs�expenditure�to�parties�in�the�wider�mobile�ecosystem�have�been�estimated,�i.e.�what�percentage�of�any�amount�spent�by�the�end�users�remains�within�the�national�boundaries�to�be�spent�in�the�next�round.�Finally,�a�spend�multiplier�was�applied�to�capture�the�effects�on�the�wider�economy.�
In�2011�MNOs�in�Turkey�are�estimated�to�have�provided�a�direct�contribution�of�TRY�11.3�billion�to�the�country’s�economy,�while�the�indirect�impacts�amounted�to�TRY�9.2�billion,�with�a�multiplier�effect�of�TRY�8.2�billion.��The�direct�contribution�includes�the�2009�purchase�of�3G�spectrum�by�the�MNOs,�which�amounted�to�TRY�1.6�billion.��
0
5,000
10,000
15,000
20,000
25,000
30,000
2008 2009 2010 2011
Supply side impact
Mobile�operators�Turkcell,�
Vodafone,�Avea�
Suppliers�of�support�services���Legal�services���Advertising���Accounting����services�
Other�suppliers�of�capital�items�Computer�equipment�Motor�vehicles�Furniture�and�other�office�equipment�
Network�equipment�suppliers�Suppliers�with�local�offices�in�Turkey�(eg�Motorola,�Huawei,�NSN,�Ericsson)�Local�subcontractors�working�on�installation�and�maintenance�
Fixed�line�operator�Turk�Telecom�
Airtime�and�handset�retailers�Wholesalers�(eg�Brightstar,�Genpa,�KVK,�Telpa,�Mobitel)�Operator�exclusive�retailers�Non�exclusive�retail�points�such�as�supermarkets,�technology�stores�
Handset�importers�and�dealers�A�number�of�international�handset�manufacturers�have�offices�in�Turkey�(eg�HTC,�Nokia,�Huawei,�Blackberry,�Samsung,�LG,�Apple�Importers�include�Brightstar,�Genpa,�KVK,�Telpa,�Mobitel�

�
©�2012�Deloitte�LLP. 4
Figure�4:�Supply�side�value�add�from�mobile�communications�by�component,�TRY�millions�
�
Source:�Deloitte�analysis�
The�value�add�relationship�between�the�MNOs�and�related�industries�in�the�ecosystem�is�shown�below.�The�estimates�of�value�add�include�the�multiplier�effect�on�the�wider�economy�which�is�assumed�to�be�40%�of�the�revenues�generated�directly�by�the�MNOs�and�the�related�supply�chain.�
Figure�5:�Mobile�value�chain�and�value�add�in�Turkey�in�2011,�TRY�millions�
�
Source:�Deloitte�analysis,�values�in�brackets�represent�value�add�
The�overall�estimated�impact�generated�by�the�mobile�telephony�ecosystem�in�2011�represented�2.3%�of�Gross�Domestic�Product�(‘GDP’),��
Figure�6:�Supply�side�value�add�as�a�proportion�of�GDP�
�
Source:�Deloitte�analysis�
Impact on employment
Mobile�services�in�Turkey�contribute�to�employment�in�several�ways,�including�direct�employment�of�the�MNOs,�the�employment�in�the�related�industries�described�above,�the�support�employment�created�by�outsourced�work�and�taxes�that�the�government�subsequently�spends�on�employment�generating�activities.�Additional�induced�employment�is�created�by�employees�and�beneficiaries�spending�their�earnings,�thereby�creating�more�employment.��
While�many�services�related�to�mobile�telephony�(such�as�radio�and�network�equipment,�handsets�and�smartphones)�are�designed�and�produced�abroad,�international�providers�recognise�the�importance�of�the�Turkish�market�and�have�established�offices�and�operations�in�the�country,�e.g.�network�equipment�providers�such�as�Ericsson,�Huawei�and�Motorola,�and�handset�producers�such�as�HTC,�Nokia�and�LG�have�local�offices�in�Turkey.��
Figure�7�Employment�generated�by�the�mobile�communications�ecosystem�in�2011�(FTEs)�
�
Source:�Deloitte�analysis�
0
5,000
10,000
15,000
20,000
25,000
30,000
2008 2009 2010 2011
Direct Indirect Multiplier
MobileNetwork�Operators
()
Payment for mobile services and connectionsPayment for handsetsFixed to mobile calls
Interconnectionpayments
Tax�Revenues(xxx)
1,118866 5,996322
19
17,408
Network equipment suppliers
(738)
Fixed line operators
(738)
Suppliers of support services
(4,198)
Other suppliers of capital items
(173)
Airtime and handset retailers
(900)
Handset importers and
dealers(2,489)
Fixed line operators
1,125
Economic multiplier(8,230)
Mobile operators(11,338)
End users
2,490
GovernmentTax
Revenues(19,871)
0.0%
0.5%
1.0%
1.5%
2.0%
2.5%
3.0%
3.5%
2008 2009 2010 2011
Supply side impact
9,3003,830
19,320
270
4,660
1,860
53,200
56,350
Mobile network operators
Fixed telecommunications operators
Suppliers of network capital items
Handset importers and dealers
Handset and airtime wholesale distributors
Other suppliers of capital items
Suppliers of support services
Airtime dealers and retailers
��� �

�
©�2012�Deloitte�LLP. 5
It�is�estimated�that�in�2011�the�mobile�communication�industry�employed�nearly�150,000�Full�Time�Equivalents�(‘FTEs’)�in�Turkey.�A�further�55,800�FTEs�are�estimated�to�be�generated�in�the�wider�economy�as�a�result�of�the�interactions�with�the�MNOs.�
While�MNOs�employed�over�9,000�FTEs�in�2011,�the�wider�mobile�ecosystem�employed�almost�140,000�additional�FTEs.�Of�these,�over�56,000�are�the�airtime�dealers�and�retailers�operating�from�supermarkets,�technology�stores�and�smaller�independent�points�of�sale.��
Other potential impacts
In�addition�to�benefits�to�the�supply�side�of�the�economy,�mobile�telephony�generates�potential�productivity�increases�through�the�use�of�mobile�telephony�for�business�purposes�as�well�as�intangible�and�social�benefits�to�consumers.��
Discussions�with�MNOs�and�other�stakeholders�identified�numerous�ways�in�which�mobile�services�have�led�to�productivity�increases�in�Turkey.�Of�particular�note�were:�
� Improvements�related�to�the�provision�of�3G�and�other�high�value�services�such�as�wireless�data,�enhanced�by�the�proliferation�of�smartphones,�tablets,�dongles�and�Machine�To�Machine�(‘M2M’)�operations.�
� Improved�efficiency�in�payments:�Avea�has�a�near�field�communication�(‘NFC’)�service�which�for�example�enables�users�to�store�their�credit�cards,�ID�cards�and�transport�tickets�within�an�NFC�enabled�SIM�card,�thereby�saving�time�for�these�transactions.�
� Improved�efficiency�of�agricultural�production�and�distribution�of�food�supplies.�The�Vodafone�Farmer’s�club�provides�farmers�with�weather�alerts�and�local�market�price�information.����
� Development�of�M2M�operations:�Turkcell�has�provided�over�750,000�SIM�cards�on�automated�platforms�for�wireless�usage�(including�e.g.�health�and�agriculture)�for�a�number�of�companies�in�the�public�and�private�sector.�
� Contribution�to�regional�economic�development,�e.g.�the�creation�of�Turkcell�Global�Bilgi�Erzurum�Call�
Centre�and�Avea�Erzincan�Call�Centre�in�Eastern�Turkey.�
While�these�productivity�impacts�cannot�be�accurately�quantified,��an�economic�value�approach�can�be�employed�to�provide�a�high�level�estimation�of�potential�productivity�benefits.�This�indicates�that,�if�mobile�workers�in�Turkey�achieved�a�5%�increase�on�their�productivity�as�a�result�of�using�mobile�phones,��the�potential�productivity�impact�of�mobile�services�on�the�economy�could�be�up�to�TRY�28�billion�in�2011.�
Figure�8:�Potential�economic�impact�in�2011�of�increased�productivity�amongst�high�mobility�workers�
�Source:�Deloitte�analysis�based�on�Deloitte�assumptions,�interviews�and�Turkey�Bureau�of�Statistics�
Mobile�communications�also�provide�a�number�of�intangible�benefits�to�consumers.�These�include�the�development�of�interpersonal�and�family�communications,�the�promotion�of�social�cohesion,�the�extension�of�communication�to�those�on�low�incomes�and�the�assistance�in�disaster�relief.�Consumers�also�benefit�through�corporate�and�social�responsibility�programmes�undertaken�by�the�MNOs,�including�health�and�education�programmes.�
While�such�intangible�consumer�benefits�cannot�be�accurately�quantified,��a�willingness�to�pay�analysis�that�combines�data�on�usage�increases�and�price�decreases�over�the�years�can�be�employed�to�estimate�how�consumer�benefits�have�increased�over�time�in�the�last�four�years.�This�approach�suggests�that�consumers�potentially�enjoyed�the�equivalent�of�up�to�TRY�8.2�billion�in�intangible�benefits�in�2011.�
3. Taxation on consumers and MNOs
Despite�the�economic�contribution�estimated�above,�mobile�consumers�and�MNOs�in�Turkey�suffer�a�taxation�
��
= ���
TRY 28 billion��� �� ���Total productivity increase�������
Key: ����Input ������Calculation �����
� �29
millionTotal workforce���
��
38% of workers arehigh mobility� ����
TRY 59,500��average GDP contributionper mobile worker�
����
��
�����
87% of HM workforce is able to use mobile communications��� ���
5% average productivity
increase�����
���
�� �� ��TRY 650 billion
output of workers thatwould use mobile communications �
����
��TRY 567 billion total output of workers using mobilecommunications�
�� � ����
����
X���X���
X���
X���= ���
= ���

�
©�2012�Deloitte�LLP. 6
regime�which�is�specific�to�this�industry�and�more�severe�than�that�faced�by�consumers�in�European�countries.�
Figure�9:�Mobile�specific�taxation�on�consumers�and�MNOs,�2011�
�
Source:�MNOs�data�
Taxes�on�mobile�consumers�include:�
� A�25%�Special�Communications�Tax�(‘SCT’)�on�usage��that�is�paid�directly�by�mobile�users�and�is�applied�on�call�minutes�and�messages�on�top�of�VAT�(a�reduced�rate�of�5%�is�applied�on�data�usage�and�was�introduced�in�2009).��As�such,�for�every�TRY�100�of�net�airtime�and�SMS�usage�purchased�by�customers,�a�tax�of�TRY�43�(VAT�plus�SCT)�is�paid�by�local�consumers�and�businesses�as�tax�in�addition�to�the�net�price.�The�SCT�applies�in�a�discriminatory�way�to�mobile�telephony�usage:�the�SCT�applying�to�fixed�telephony�is�set�at�15%,�a�notably�lower�level,�creating�distortions�in�the�market�for�telephone�calls.��
� Handsets�are�subject�to�heavy�taxation�in�Turkey.�A�Special�Consumption�Tax�of�25%�is�levied�on�the�Cost,�Insurance�and�Freight�(‘c.i.f.’)�price�for�each�handset�imported.�This�tax�has�also�a�TRY�100�‘floor’�amount�that�is�applied�when�25%�of�the�import�price�of�a�handset�amounts�to�less�than�TRY�100.�The�Special�Consumption�Tax�was�increased�from�20%�to�25%�in�2011,�while�the�minimum�floor�level�was�increased�from�TRY�50�to�TRY�100.�In�addition�to�the�Special�Consumption�Tax,�handsets�price�is�also�subject�to�a�6%�tax�that�benefits�the�Turkish�Radio�Television�Foundation.��
� An�Initial�Subscription�Charge�(TRY�34�in�2011)�applies.�This�is�an�additional�fixed�component�of�the�Special�Communications�Tax�and�consists�of�a�fixed�amount�to�be�paid�once�by�consumers�when�a�new�SIM�card�is�purchased.�It�is�adjusted�every�year�according�to�inflation�and�has�been�set�at�TRY�37�for�2012.�
� A�Wireless�Licence�Fee�(TRY�13.2�in�2011)�is�also�paid�by�consumers�when�a�new�connection�is�purchased.�This�can�be�thought�of�as�a�registration�fee�and�is�paid�regardless�of�whether�the�connection�is�used�for�voice�services�or�mobile�broadband.�It�is�adjusted�every�year�according�to�inflation�and�has�been�set�at�TRY�14.56�for�2012.�
� Additionally,�an�annual�Wireless�Usage�Fee�(TRY�13.2�in�2011)�applies�as�a�rental�fee�that�users�pay�annually�for�their�active�subscriptions�and�has�been�set�at�TRY�14.56�for�2012.�
In�addition�to�standard�corporate�and�other�spectrum�and�numbering�fees�paid�to�the�government�and�regulator,�MNOs�in�Turkey�are�subject�to�a�mobile�specific�licence�fee�calculated�as�15%�of�their�turnover.�However,�fixed�telecom�operators�are�not�subject�to�the�Treasury�Share�fee�as�a�similar�fee�applying�to�them�was�removed�in�2004�prior�to�the�fixed�operator’s�privatisation.�
MNOs�are�also�subject�to�a�‘Telecommunications�Regulation�Authority�Share’�paid�as�a�contribution�to�the�expenses�of�the�regulatory�authority,�calculated�as�the�0.35%�of�the�operator’s�net�sales�per�annum.��
Taxation�on�mobile�consumers�in�Turkey�is�complex�and�affects�all�components�(e.g.�handsets,�subscription�and�usage)�of�mobile�consumers’�spend.�In�addition,�as�some�of�the�fixed�taxes�are�linked�to�inflation,�taxation�increases�over�time�while�competition�and�developments�in�the�mobile�market�act�to�reduce�prices�and�improve�service�quality.��
According�to�a�recent�benchmarking�study�conducted�by�Deloitte�for�the�GSMA,�the�mobile�telecommunications�sector�in�Turkey�showed�the�highest�taxation�as�a�proportion�of�mobile�service�costs�among�the�111�global�countries�included�in�the�research.�Taxes�represented�48.2%�of�the�Total�Cost�of�Mobile�Ownership�(‘TCMO’)�
Handset cost VAT�18%�
SCT�25%�
Radio/TV share 6%
Mobile usagecalls/SMS
VAT�18%�
SCT�25%�
Fixed callsVAT�18%�
SCT�15�%
SCT initial subscription charge�TRY 34
Wireless licence fee�
TRY 13.2
Wireless usage feeTRY 13.2
Activation
Annual licence fee
TRY 15.35
Licence obligations (Treasury share and Telecom Authority share)
MNO’s revenues –�TRY 100

�
©�2012�Deloitte�LLP. 7
for�the�average�consumer�in�2011�against�a�global�average�of�18.2%.�
Figure�10:�Tax�as�a�percentage�of�TCMO,�2011�
�
Source:�Deloitte/GSMA�Global�Mobile�Tax�Review�2011�
The�multitude�of�taxes�affecting�different�components�of�the�mobile�service�basket�provides�negative�incentives�and�purchasing�signals�to�customers�and�discriminates�against�mobile�calls�in�favour�of�fixed�calls,�which�potentially�creates�distortions�to�consumer�choice�and�to�competition�in�the�market.�This�taxation�structure�has�a�number�of�economic�and�social�implications�for�consumers:�
� Handset�costs�and�subscription�costs�represent�the�most�significant�barrier�to�the�consumption�of�mobile�services,�particularly�for�the�poorer�sectors�of�the�population.��
� Fixed�taxes�on�subscriptions�and�taxation�on�handsets�(in�its�fixed�component)�are�regressive�in�nature�and�may�contribute�to�reducing�access,�penetration�and�total�network�usage.�Initial�subscription�taxes�are�also�currently�constraining�acquisition�of�data�only�SIM�cards�and�M2M�cards.�
� Specific�taxation�on�usage,�such�as�airtime�taxes,�can�further�represent�a�significant�obstacle�to�usage�of�mobile�services�by�the�poorer�sectors�of�the�population,�who�could�derive�significant�benefits�from�being�connected.�
� Since�handsets�and�smartphones�may�represent�the�only�access�to�wireless�broadband�for�certain�sectors�of�the�population�and�in�rural�areas,�handset�taxes�may�also�lead�to�underconsumption�of�internet�services.�
Finally,�the�imposition�of�mobile�specific�taxes�may�signal�that�the�government�wishes�to�discourage�usage�
in�mobile�services,�as�governments�sometimes�increase�the�consumption�tax�on�goods�for�which�they�wish�to�discourage�consumption,�for�example�tobacco�or�alcohol.��
In�2011,�Turkey�had�one�of�the�highest�TCMO�in�the�region�and�in�Europe�as�a�percentage�of�GDP�per�capita�(7.7%),�leading�to�consumers�paying�proportionately�more�for�mobile�services�than�in�any�European�country.�If�mobile�specific�taxation�was�removed,�the�Turkish�TCMO�would�decrease�by�30%.�This�would�align�the�Turkish�TCMO�as�a�percentage�of�GDP�per�capita�(which�would�decrease�to�5.4%)�to�the�sample�average�(5.1%).�
Figure�11:�TCMO�as�a�percentage�of�GDP�per�capita,�2011�
�
Source:�Deloitte�analysis�
Given�the�high�dispersion�of�income�distribution�in�Turkey,�the�presence�of�fixed�mobile�specific�taxes�is�likely�to�be�disproportionately�felt�by�the�poorer�sectors�of�the�population.��
In�no�country�in�Europe�does�access�to�services�(activation,�SIM�acquisition�and�handset)�attract�a�mobile�specific�tax.�This�can�be�contrasted�to�penetration�in�Turkey,�which�is�amongst�the�lowest�in�Europe�and�in�the�area.�3G�penetration�is�also�lagging�well�below�European�countries.��
0%
5%
10%
15%
20%
25%
30%
35%
40%
45%
50%
Turk
eyG
reec
eC
roat
iaH
unga
ryIta
lyP
olan
dP
ortu
gal
Irela
ndB
elgi
umU
zbek
ista
nU
KA
ustri
aU
krai
neS
love
nia
Bul
garia
Alb
ania
Fran
ceN
ethe
rland
sG
erm
any
Slo
vaki
aR
oman
iaA
zerb
aija
nR
ussi
aG
eorg
iaS
pain
Ser
bia
Mal
taM
onte
negr
oC
ypru
sK
azak
hsta
n
0%
2%
4%
6%
8%
10%
12%
Ukr
aine
Bul
garia
Turk
ey
Gre
ece
Geo
rgia
Fran
ce
Mon
tene
gro
Pol
and
Hun
gary
Mal
ta
Ser
bia
Por
tuga
l
Spa
in
Slo
vaki
a
Bel
gium
Rus
sia
Irela
nd
Slo
veni
a
Kaz
akhs
tan
UK
Cro
atia
Aze
rbai
jan
Italy
Net
herla
nds
Rom
ania
Ger
man
y
Aus
tria
Cyp
rus

�
©�2012�Del
Figure�12:�and�neigh
Source:�Wireles
Figure�13:�neighbour
Source:�Wireles
An�analysithan�Turkethem�has�oconsiderinworkers�arsubstantialTurkey�hasEuropean�
Figure�14:�neighbour
�Source:�Wirele
0%
20%
40%
60%
80%
100%
120%
140%
160%
180%
200%
Mon
tene
gro
Por
tuga
lR
ussi
a
0%
10%
20%
30%
40%
50%
60%
70%
80%
90%
100%
Por
tuga
lA
ustri
aIta
ly
0%
20%
40%
60%
80%
100%
120%
140%
160%
Q1
2000
Q3
2000
Q1
2001
Q3
2001
loitte�LLP.
Mobile�penetrabouring�countr
ss�Intelligence�
3G�penetrationring�countries,�2
ss�Intelligence�
is�of�countries�they�in�2000�suggeoutpaced�Turkeng�that�higher�inre�more�likely�tolly�lower�propos�access�to�mobcountries�or�oth
Penetration�in�ring�countries,�2
ess�Intelligence�
Rus
sia
Alb
ania
Bul
garia
Aus
tria
Italy
Cyp
rus
Ger
man
yG
reec
eP
olan
d
Uni
ted
…S
pain
Gre
ece
Cyp
rus
Irela
ndM
alta
Ger
man
yN
ethe
rland
sS
love
nia
Q3
2001
Q1
2002
Q3
2002
Q1
2003
Q3
2003
Q1
2004
Q3
2004
Q1
2005
Q3
2005
ation�in�a�sampries,�2011�
n�in�a�sample�of2011�
hat�had�a�lowerests�that�penetray�by�2011.��As�s
ncome�and�profeo�own�multiple�ortion�of�the�popile�telephony�co
her�countries�in�
a�sample�of�Eu2000�2011�
Mal
taR
oman
iaK
azak
hsta
nS
pain
Ukr
aine
Bel
gium U
KC
roat
iaN
ethe
rland
s
Pol
and
Fran
ceB
ulga
riaS
lova
kia
Hun
gary
Rom
ania
Turk
eyC
roat
iaB
elgi
um
Q1
2006
Q3
2006
Q1
2007
Q3
2007
Q1
2008
Q3
2008
Q1
2009
Q3
2009
ple�of�European
f�European�and
r�penetration�ation�in�all�of�
such,�and�essional�SIM�cards,�a�
pulation�in�ompared�to�the�region.�
uropean�and�
Net
herla
nds
Irela
ndG
eorg
iaS
lova
kia
Hun
gary
Ser
bia
Slo
veni
aFr
ance
Aze
rbai
jan
Mon
tene
gro
Rus
sia
Geo
rgia
Ser
bia
Ukr
aine
Uzb
ekis
tan
Alb
ania
Kaz
akhs
tan
Aze
rbai
jan
Q1
2010
Q3
2010
Q1
2011
Q3
2011
Turkey
Azerbaijan
Serbia
Croatia
Slovakia
Georgia
Ukraine
Kazakhstan
Romania
Poland
Albania
Bulgaria
Russia
n�
�
d�
�
�
The�likelfixedfavopene
Figu
Sourc
Figu
Sourc
As�swithmakEuro
In�adtaxa
jTu
rkey
Uzb
ekis
tan
n
0%
5%
10%
15%
20%
25%
30%
35%
40%
0%
10%
20%
30%
40%
50%
60%
70%
80%
90%
negative�impacly�to�be�exacerbd�line�penetratioourable�taxationetration�compar
ure�15:�Fixed�tel
e:�World�Bank�data;�D
ure�16:�Penetrat
e:�World�Bank�data�(20
such,�existing�leh�low�levels�of�fike�Turkey�one�oope.�
ddition�to�the�pation,�the�prices�
Net
herla
nds
Fran
ceG
erm
any
UK
Bel
gium
Mal
taS
love
nia
Aus
tria
Net
herla
nds
UK
Ger
man
yS
lova
kia
Bel
gium
Fran
ceA
ustri
aIre
land
ct�of�taxation�onated�by�the�relaon�in�Turkey,�de
n�treatment,�andred�to�European
lephone�lines�p
eloitte�analysis�
ion�of�internet,
010);�Deloitte�analysis�
vels�of�mobile�pixed�line�and�inf�the�least�conne
otential�distortiMNOs�charge�a
Aus
tria
Spa
inIre
land Italy
Gre
ece
Hun
gary
Por
tuga
lC
roat
iaC
ypru
s
Irela
ndS
love
nia
Spa
inH
unga
ryM
alta
Pol
and
Cro
atia
Italy
Cyp
rus
n�mobile�penetraatively�low�levelespite�the�more
d�by�low�internen�countries.�
per�100�people,�2
,�2010�
�
penetration,�comnternet�availabilected�countries�
ions�caused�by�are�impacted�by
Slo
vaki
aB
ulga
riaR
oman
iaP
olan
dR
ussi
aTu
rkey
Ser
bia
Mon
tene
gro
Mon
tene
gro
Por
tuga
lB
ulga
riaA
lban
iaG
reec
eR
ussi
aS
erbi
aR
oman
iaT
k
8
ation�is�l�of��
et�
2010�
�
�
mbined�ity,�in�
y�the�
Ukr
aine
Aze
rbai
jan
Kaz
akhs
tan
Geo
rgia
Alb
ania
Uzb
ekis
tan
Turk
eyA
zerb
aija
nK
azak
hsta
nG
eorg
iaU
krai
neU
zbek
ista
n

�
©�2012�Deloitte�LLP. 9
15.35%�licence�fee�applicable�on�MNOs’�revenues.�This�licence�fee�effectively�acts�as�an�additional�tax�and�its�implementation�raises�a�number�of�concerns�for�MNOs:�
� Unlike�VAT�or�SCT,�which�are�collected�from�consumers�on�behalf�of�the�government,�this�licence�fee�is�levied�on�MNOs�directly.��As�such,�the�license�fee�cannot�be�itemised�in�prices�or�receipts�and�is�therefore�not�transparent�to�consumers.��
� This�license�fee�is�discriminatory�in�its�treatment�of�mobile�telephony�relative�to�other�industries,�and�as�such�is�distortionary.�
� No�country�in�the�EU�applies�a�similar�tax�and�the�MNOs�question�whether�it�is�aligned�with�the�EUs�telecommunications�framework.�Turkey�is�introducing�regulation�consistent�with�the�EU�framework�in�a�number�of�areas,�e.g.�Mobile�Termination�Rates,�and�the�MNOs�contrast�this�with�the�current�taxation�policy.�
A�key�impact�of�the�levels�of�consumer�and�MNO�taxation�is�that�the�MNOs�need�to�provide�substantive�subsidies�to�customers�in�order�to�compete�in�the�market.�Such�subsidies,�particularly�to�incentivise�activation�and�SIM�card�purchases,�reduce�the�entry�barriers�that�consumer�taxation�generates�especially�for�the�poorer�and�younger�sections�of�the�population.���
MNOs’�net�earnings�are�therefore�affected�by�both�the�licence�fee�and�by�tax�related�subsidies.�
Figure�17�MNOs’�earnings�in�Turkey�and�for�a�typical�EU�operator�
�Source:�Deloitte�analysis�based�on�discussions�with�MNOs�
This�has�a�direct�impact�on�the�profitability�of�Turkish�MNOs.��For�example,�the�EBITDA�margin�of�MNOs�in�Turkey�is�significantly�lower�than�EBITDA�margin�for�a�set�of�European�countries�in�which�no�mobile�specific�taxation�exists.�
Figure�18:�EBITDA�margin,�2011�
�
Source:�Wireless�Intelligence�
Such�a�comparatively�low�EBITDA�margin�raises�concerns�about�the�ability�of�MNOs�to�recoup�the�large�fixed�investments�that�they�incurred�in�order�to�set�up�and�upgrade�their�networks,�and�about�future�investment�in�mobile�networks.�International�comparisons�relating�to�capex�investment�by�MNOs�indicate�that�Turkey�lags�behind�European�countries�for�which�similar�data�is�available.��
0%
10%
20%
30%
40%
50%
Italy
Ukr
aine
Por
tuga
l
Bul
garia
Rus
sia
Hun
gary
Bel
gium
Cro
atia
Pol
and
Gre
ece
Ger
man
y
Fran
ce
Rom
ania
Net
herla
nds
Slo
veni
a
Spa
in
Turk
ey UK
Irela
nd
TRY 15.35TRY 5*
TRY 79.65
TRY 100�
Earnings
–
TRY 100
Turkey
Typical EU Countries /
Fixed Operators in Turkey�
*Operators in Turkey partly subsidise the activation taxes on SIM cards. This is a marketestimate based on discussions with operators and may vary depending on operators’ market positions and commercial policies.
Licence fee�Subsidies

�
©�2012�Deloitte�LLP. 10
Figure�19:�Capex�per�capita,�2010,�US$�
�
Source:�Wireless�Intelligence�data�
4. Impacts of taxation reductions
In�countries�where�taxation�is�high,�reducing�taxation�has�the�potential�to�provide�more�positive�effects�than�in�countries�where�taxation�is�lower.��
The�net�impact�of�any�taxation�changes�does,�however,�require�a�dynamic�approach�where�governments�explicitly�account�for�the�indirect�impacts�driven�by�the�increased�economic�activities�that�are�generated�by�improved�mobile�penetration�and�mobile�usage.�A�well�documented�positive�relationship�exists�between�increases�in�mobile�penetration�and�mobile�usage�and�GDP�growth�rates,�due�to�the�beneficial�effects�on�the�economy�and�on�its�productivity�as�discussed�earlier�in�this�study.��
In�order�to�consider�this�question,�a�simulation�exercise�was�conducted�which�sought�to�estimate�the�impact�that�a�reduction�in�mobile�specific�taxes�in�Turkey�would�have�under�a�series�of�reasonable�assumptions�as�to�the�growth�of�the�market.���
This�scenario�analysis�compared�a�base�case�scenario�(whereby�no�tax�changes�occur)�against�a�scenario�where�a�one�off�tax�reduction�was�made�in�2012,�covering�the�period�2012�to�2016.�This�analysis�focused�on�government�revenues�from�taxation�and�a�number�of�key�indicators�such�as�mobile�penetration,�3G�penetration,�usage�and�handset�sales.�The�simulated�impact�of�a�tax�reduction�and�price�reduction�is�evaluated�using�operators’�data�and�a�set�of�consumer�demand�elasticities�in�order�to�establish�how�the�major�market�variables�are�impacted.��
Figure�20:�Direct�and�indirect�effects�on�government�tax�revenues�
�
The�simulation�analysis�considered�a�combined�scenario�in�which�the�government�introduces�three�concurrent�changes�to�its�taxation�policy,�which�could�positively�impact�market�growth�whilst�also�delivering�a�positive�outcome�for�the�government�through�a�market�growth�effect:�
� The�elimination�of�mobile�specific�subscription�charges,�i.e.�the�Wireless�Licence�Fee�(TRY�13.2�in�2011)�and�the�fixed�component�of�the�Special�Communications�Tax�(TRY�34�in�2011)�on�data�only�SIM�cards.�
� A�reduction�of�the�Wireless�Licence�Fee�and�the�fixed�component�of�the�Special�Communications�Tax�on�all�other�SIM�cards.�
� A�reduction�in�the�Special�Communications�Tax�on�calls�and�SMS�from�25%�to�15%,�to�realign�it�with�the�SCT�applying�to�fixed�telecom�services.�
As�the�market�for�data�only�SIM�cards�is�in�its�infancy,�removing�taxation�on�data�only�SIM�cards�is�expected�to�have�a�limited�effect�on�government�tax�receipts�whilst�potentially�leading�to�considerable�increases�in�volumes.�The�initial�subscription�charges�are�particularly�constraining�the�acquisition�of�data�only�SIM�cards�and�M2M�cards,�hampering�the�potential�productivity�benefits�generated�by�these�services.�
Reducing�the�activation�tax�on�all�other�SIM�cards�is�expected�to�lead�to�increases�in�penetration,�which�in�the�long�term�could�align�with�levels�in�other�countries.�While�the�activation�taxes�potentially�act�as�a�barrier�to�entry�by�new�subscribers,�the�SCT�prevents�consumers�from�increasing�their�usage�per�capita.��
02468
101214161820
Net
herla
nds
Irela
nd
Por
tuga
l
Ger
man
y
Fran
ce
Slo
vaki
a
Bel
gium Ita
ly
Bul
garia
Slo
veni
a
Cro
atia
Geo
rgia
Hun
gary
Rom
ania
Turk
ey
Uzb
ekis
tan
Mon
tene
gro
Tax reductions on mobile telephony services would lead to increases in mobile and 3G penetration and to increases in total mobile usage This generates a number of positive impacts on the economy:
• Evidence shows that increases in mobile penetration lead to increases in GDP per capita growth. A 10% increase in penetration leads to a 0.6% increase in GDP per capita growth rates in developed markets�
• In addition, evidence shows that increases in smartphonepenetration , for a given level of mobile penetration, increase GDP per capita growth
• These economy-wide effects generate additional tax revenues for the government
? : In relation to the tax reduced, the government experiences a decrease in tax revenue per unit�
? : In relation to all other taxes, the government benefits from awider taxation base as a consequence of increased subscribers and volumes per subscriber�
? : Increase in corporation tax and treasury share due to higher MNO revenues
Direct impact
Widereconomic
impact

�
©�2012�Deloitte�LLP. 11
As�such,�a�more�lenient�taxation�regime�would�increase�penetration�and�usage,�expand�the�market�and�improve�profitability.��
The�results�of�this�simulation�suggest�that�the�reduction/elimination�of�taxation�on�SIM�cards�would�increase�mobile�penetration�levels�by�almost�5%�each�year�compared�to�the�counterfactual�scenario�in�which�these�taxes�are�retained.�Figure�21�shows�that�mobile�penetration�would�reach�104%�in�2016�as�opposed�to�98%�in�the�base�case�scenario1.�3G�penetration�instead�would�reach�72%�in�2016�as�opposed�to�68%�in�the�base�case.�
Figure�21:�Mobile�penetration�and�3G�penetration,�2012�2016�
�
�
Source:�Deloitte�analysis�
As�expected,�a�significant�contribution�to�this�penetration�improvement�is�due�to�the�growth�in�data�only�SIM�cards�sold�as�a�result�of�the�tax�reduction.�A�comparison�of�the�two�scenarios�is�presented�in�Figure�22.�
������������������������������������������������������������1 Based on forecasts from the Wireless Intelligence.
Figure�22:�Sales�of�data�only�SIM�cards,�2012�2016�
�
Source:�Deloitte�analysis�
The�increased�number�of�subscribers�entering�the�market�would�also�contribute�to�increasing�the�sales�volumes�of�handsets,�tablets,�dongles�and�other�devices�for�the�use�of�data�only�SIM�cards.�While�tablets,�dongles�and�other�M2M�devices�have�not�been�explicitly�considered�in�this�simulation,�the�increases�in�the�sales�of�feature�phones�and�smartphones�are�respectively�on�average�10%�and�7%�higher�under�the�simulated�scenario.�This�is�reported�in�Figure�23.�
Figure�23:�Sales�of�feature�phones�and�sales�of�smartphones,�2012�2016�
�
�
Source:�Deloitte�analysis�
A�further�benefit�of�the�increased�number�of�3G�subscribers�under�the�simulated�scenario�would�be�
85%�87%�89%�91%�93%�95%�97%�99%�
101%
103%
105%
2012� 2013 2014 2015 2016
base tax reduction scenario�
35%�40%�45%�50%�55%�60%�65%�70%�75%�
2012 2013 2014 2015 2016
base tax reduction scenario
0
500,000
1,000,000
1,500,000
2,000,000
2,500,000
2012 2013 2014 2015 2016
base tax reduction scenario�
4,000,000
4,500,000
5,000,000
5,500,000
6,000,000
6,500,000
7,000,000
7,500,000
8,000,000
8,500,000
2012 2013 2014� 2015� 2016
base tax reduction scenario�
4,000,000
6,000,000
8,000,000
10,000,000
12,000,000
14,000,000
16,000,000
18,000,000
20,000,000
22,000,000
2012 2013 2014� 2015 2016
base tax reduction scenario�

�
©�2012�Deloitte�LLP. 12
wider�internet�usage:�the�results�suggest�a�5%�increase�in�total�data�usage�per�annum�over�the�base�case,�indicating�a�substantially�improved�access�to�mobile�internet.�
Figure�24:�Total�data�usage,�2012�2016,�Mb�billions�
�
Source:�Deloitte�analysis�
In�addition�to�the�total�usage�increases�due�to�penetration�growth,�the�reduction�in�the�SCT�is�expected�to�generate�higher�minutes�of�use�and�SMS�per�user,�leading�to�a�further�total�usage�increase.�
Figure�25:�Total�minutes�of�use�(billions),�2012�2016�
�
Source:�Deloitte�analysis�
The�overall�analysis,�whilst�only�indicative,�suggests�that�the�mobile�market�would�grow�as�a�result�of�the�change��in�taxation�policy:�this�would�have�a�beneficial�effect�on�the�economy�and�on�government’s�tax�receipts.�Despite�an�initial�decrease�in�government’s�revenues�(due�to�the�reduction�is�taxation),�the�increased�penetration�and�usage�indicated�by�the�analysis�would�more�than�compensate�the�initial�effect�and�lead�to�an�increase�in�government�revenues�four�years�after�the�introduction�of�the�policy�change.�The�effects�could�further�be�boosted�by�the�additional�investment�and�employment�that�MNOs�could�generate�in�response�to�increases�revenues�and�EBITDA�resulting�from�market�growth,�which�are�not�explicitly�accounted�for�in�this�simulation.��Figure�26�shows�that�government�receipts�from�mobile�specific�and�general�taxation�would�be�higher�in�2015�and�thereafter�under�the�tax�reduction�scenario.�
Figure�26:�Government�tax�revenues,�2012�2016,�TRY�millions�
�
Source:�Deloitte�analysis�
�
�
�
500
700
900
1,100
1,300
1,500
1,700
1,900
2,100
2012 2013 2014� 2015� 2016
base tax reduction scenario
180�185�190�195�200�205�210�215�220�
2012� 2013 2014 2015 2016
base tax reduction scenario�
16,000
17,000
18,000
19,000
20,000
21,000
22,000
23,000
24,000
25,000
2012 2013 2014 2015� 2016
base tax reduction scenario

�
©�2012�Deloitte�LLP. 13
Appendix A The economic impact of mobile telephony in Turkey
Mobile�telephony�in�Turkey�generates�significant�economic�activity�through�effects�on�the�supply�side�of�the�economy,�employment,�increases�in�productivity�and�benefits�gained�by�Turkish�consumers.�This�section�describes�these�impacts�over�the�last�four�years.�
A.1 Approach to estimating the economic impact
The�economic�impact�of�mobile�telephony�in�Turkey�was�estimated�by�accounting�for�the�impact�of�the�wider�mobile�ecosystem�on�the�supply�side�of�the�Turkish�economy.�The�analysis�focussed�on�the� flow� of� funds� across� the� mobile� supply� chain,� by� estimating� the� value� add� created� by� the�MNOs� and� their� major� stakeholders.� An� economic� multiplier� was� used� in� order� to� capture� the�‘knock�on’�impact�to�the�wider�economy.�Impacts�on�direct�and�indirect�employment�from�firms�in�the�value�chain�were�also�estimated.�
In�addition,�other�potential�benefits�are�discussed,�including�the�potential�productivity�increase�that�occurred�through�the�use�of�mobile�telephony�for�business�purposes,�as�well�as�the�intangible�and�social�benefits�potentially�enjoyed�by�consumers�in�Turkey.��
Figure�27:�Structure�of�the�analysis�of�economic�impact�on�GDP�and�employment�
�
Source:�Deloitte�
This�analysis�was�undertaken�using�publicly�available�statistics,�data�provided�directly�by�the�MNOs�(Turkcell�and�Vodafone)�and�interviews�with�Turkcell,�Vodafone�and�Avea�and�with�other�market�participants�including�handset�and�airtime�dealers.�By�combining�supply�side�and�demand�
Mobile Operators
Related Industries ImprovedProductivity Social Benefit
General Economy�
Value chain quantification
Estimation based on research and
interview
Estimation based on willingness to pay
analysis
Supply Side Impact
Direct
Indirect
Multiplier
Analysis�
Estimation of other potential benefits
Demand Side Impact
Intangible Impact

�
©�2012�Deloitte�LLP. 14
side�analyses,�it�is�possible�to�estimate�the�GDP�contribution,�employment�created�and�tax�revenues�generated�in�Turkey�by�the�mobile�industry�over�the�period�2008�to�2011.�Each�component�of�the�value�add�chain�is�analysed�below.�
A.2 Benefits to the supply side of the economy
MNOs�provide�numerous�benefits� to� the�supply�side�of� the�Turkish�economy�through�the�direct�effect� of� their� expenditure,� and� these� benefits� are� indirectly� carried� through� to� the� related�industries�MNOs�operate�with�and,�more�widely,�to�the�Turkish�economy.��
As�shown�in�Figure�28,�in�addition�to�three�MNOs,�the�mobile�communication�market�ecosystem�in�Turkey� is� formed� by� players� such� as� equipment� providers,� typically� international� equipment�producers�with�offices�in�Turkey,�and�providers�of�other�network�services�such�as�installation�and�maintenance;�handset�importers�and�distributors;�airtime�distributors�and�sellers,�which�include�a�host� of� retail� points� throughout� the� country;� and� suppliers� of� other� services� to� MNOs� such� as�advertising,�accounting�and�other�support�services.�
Figure�28:�The�mobile�communications�ecosystem�in�Turkey�
�
�
Source:�Deloitte��
To�calculate�the�value�add�generated�by�the�industry,�firstly�the�value�add�created�by�the�mobile�communications�industry�was�estimated.�This�consists�of�the�value�created�by�MNOs’�expenditure�
Mobile�operators�
Turkcell,�Vodafone,�Avea�
Suppliers�of�support�services���Legal�services���Advertising���Accounting�services�
Other�suppliers�of�capital�items�Computer�equipment�Motor�vehicles�Furniture�and�other�office�equipment�
Network�equipment�suppliers�Suppliers�with�local�offices�in�Turkey�(eg�Motorola,�Huawei,�NSN,�Ericsson)�Local�subcontractors�working�on�installation�and�maintenance�
Fixed�line�operator�Turk�Telecom�
Airtime�and�handset�retailers�Wholesalers�(eg�Brightstar,�Genpa,�KVK,�Telpa,�Mobitel)�Operator�exclusive�retailers�Non�exclusive�retail�points�such�as�supermarkets,�technology�stores�
Handset�importers�and�dealers�A�number�of�international�handset�manufacturers�have�offices�in�Turkey�(eg�HTC,�Nokia,�Huawei,�Blackberry,�Samsung,�LG,�Apple�Importers�include�Brightstar,�Genpa,�KVK,�Telpa,�Mobitel�

�
©�2012�Deloitte�LLP. 15
on�wages,�corporate�and�social�responsibility�(‘CSR’)�programmes,�dividends�paid�by�MNOs�and�taxes�recovered�as�a�result�of�the�MNOs’�operations.��
In� addition,� the� ‘leakages’� from� the� system� have� been� estimated,� i.e.� what� percentage� of� any�amount� spent� by� the� end� users� remains� within� the� national� boundaries� to� be� spent� in� the� next�round.� This� was� used� to� isolate� the� impact� on� the� Turkish� economy� from� the� total� international�impact�of�the�Turkish�mobile�communications�industry.���
In�2011,�it�is�estimated�that�MNOs�in�Turkey�provided�a�direct�contribution�of�TRY�11.3�billion�to�the�country’s�economy.�The�breakdown�by�category�is�provided�in�Table�1�below.�
Table�1:�Domestic�value�add�of�MNOs�(excluding�multiplier�effect),�TRY�millions�
Domestic�value�add� 2008� 2009� 2010� 2011�
Employee�wages�and�benefits� 700� 727� 825� 869�Contractors�wages� 40� 38� 46� 31�Taxes�and�regulatory�fees� 9,080� 10,280� 8,727� 9,267�CSR� 11� 14� 15� 16�Dividends� 564� 954� 747� 1,155�Total� 10,395� 12,013� 10,359� 11,338�
Source:�Deloitte�analysis�based�on�data�provided�by�MNOs,�interviews�and�analysis�of�company�accounts.�Differences�are�due�to�rounding.��
As�discussed�later�in�this�report,�taxation�on�mobile�telephony�consumers�and�business�in�Turkey�is�amongst�the�greatest�worldwide.�As�such,�in�2011,�MNOs�in�Turkey�have�paid�approximately�TRY�9.3�billion�to�the�government�in�taxes�and�regulatory�fees�(6%�more�than�in�2010).�This�constitutes�the�largest�element�of�value�add�generated�by�the�MNOs�in�the�country,�representing�82%�of�the�total.�Taxation�results�are�discussed�in�more�detail�in�Appendix�B.�The�value�add�generated�by�wages�amounted�to�TRY�0.9�billion�in�2011,�while�dividends�paid�across�the�industry�amounted�to�over�TRY�1�billion.�
The�value�add�relationship�between�the�MNOs�and�the�players�in�the�mobile�ecosystem,�such�as�equipment�importers,�producers�and�providers�of�network�support�services,�handset�dealers,�retailers�of�airtime,�handsets�and�other�providers�of�general�support�services,�was�then�examined.�Revenue�flows�from�the�MNOs�to�other�players�in�the�industry�were�then�analysed�and�the�
resulting�quantity�translated�into�further�value�add.2��MNOs�in�Turkey�do�not�directly�import�handsets�and�therefore�consumer�spending�on�handsets�has�been�separately�estimated.��
������������������������������������������������������������2 Details on value add margins and the percentage of revenue translated into value add are contained in Appendix C.1.5.

�
©�2012�Deloitte�LLP. 16
The�estimates�of�value�add�include�the�multiplier�effect�on�the�wider�economy�which�is�assumed�to�
be�40%�of�the�revenues�generated�directly�by�the�MNOs�and�the�related�value�chain.3�The�result�of�
this�calculation�is�shown�in�Figure�29.4�
Figure�29:�Mobile�value�chain�and�value�add�in�Turkey�in�2011,�TRY�millions�
�
Source:�Deloitte�analysis�
Table�2�below�indicates�the�calculation�of�the�value�add�generated�by�the�three�MNOs�and�by�each�of�the�major�actors�in�the�Turkish�telecommunication�industry�as�a�result�of�their�transactions�with�
the�MNOs.5�
������������������������������������������������������������3 The value of multiplier chosen for Turkey is discussed in Appendix C.1.1.4. 4 The figures next to the arrows represent the flow of money from one group to another. A first set of arrow shows how the
money flows in first place from end users to the MNOs and to their major stakeholders. A second set of arrows shows how a part of the revenues collected by the MNOs subsequently flows to their major providers of services. The figures inside the boxes represent the value add generated by each group (in the form of taxes, wages, dividends and CSR). Finally, the two boxes indicate respectively the multiplier effect (the value add generated in the wider economy through subsequent rounds of spending) and the tax revenue collected by the government as a result of the transactions described. The amounts shown inside each square relate solely to domestic flows and domestic value add.
5 The second column of the table reports the revenues that each player receives from final users and from the MNOs. The third column contains only the portion of these revenues that is estimated to remain within Turkey. These domestic revenues are then split (column 4 and 5) into domestic costs (i.e. the general costs of business that are sustained by each player) and domestic value add (i.e. wages, taxes, dividends and CSR programs). Finally, the last column indicates the total domestic value add, which represents the value add produced not only by the MNOs and their stakeholders, but also by the subsequent rounds of money flows in the economy.
MobileNetwork�Operators�
()
Payment for mobile services and connectionsPayment for handsetsFixed to mobile calls
Interconnectionpayments
Tax�Revenues(xxx)
1,118866 5,996� 322
19
17,408�
Network equipment suppliers
(738)�
Fixed line operators
(738)�Suppliers of
support services(4,198)
Other suppliers of capital items
(173)
Airtime and handset retailers
(900)
Handsetimporters and
dealers(2,489)
Fixed line operators
1,125
Economicmultiplier(8,230)
Mobile operators(11,338)�
End users�
2,490
GovernmentTax
Revenues(19,871)
��
�� �

�
©�2012�Deloitte�LLP. 17
Table�2:�Calculation�of�value�add�from�mobile�communications�in�Turkey�in�2011,�TRY�millions�
Domestic�value�add�in�2011� Total�revenue�
Domestic�revenue�
Domestic�cost�
Domestic�value�add�
Domestic�value�add�with�
multiplier�MNOs� 17,408� 17,408� 6,070� 11,338� 15,874�Fixed�telecom�operators� 1,118� 1,118� 380� 738� 1,033�Network�equipment�and�network�services�suppliers�
1,616� 866� 128� 738� 1,033�
Handset�importers�and�dealers�
7,192� 2,510� 20� 2,489� 3,485�
Other�suppliers�of�capital�items�
508� 322� 149� 173� 243�
Suppliers�of�support�services� 6,028� 5,996� 1,799� 4,198� 5,877�
Airtime�wholesalers�and�retailers�
1,125� 1,125� 225� 900� 1,260�
Total� 34,995� 29,345 8,770 20,575� 28,805Source:�Deloitte�analysis.�Differences�are�due�to�rounding.�
Based�on�the�data�provided�by�the�MNOs,�it�was�estimated�that�84%�of�the�revenue�flows�generated�by�end�users�remains�in�Turkey.�Of�this,�a�large�portion�relates�to�network�equipment�suppliers�and�suppliers�of�support�services.��It�was�estimated�that�only�54%�of�MNOs�expenditures�on�network�equipment�suppliers�remains�in�Turkey.�Concerning�expenditures�on�handset�designers�and�dealers,�only�35%�was�estimated�to�be�domestic.�
The�contribution�of�mobile�telephony�to�the�supply�side�of�the�economy�in�Turkey�during�2008�to�2011�is�summarised�in�Figure�30�below.�

�
©�2012�Deloitte�LLP. 18
Figure�30:�Supply�side�value�add�from�mobile�communications�by�component,�TRY�millions�
�
Source:�Deloitte�analysis�
The�direct�impact�refers�to�the�value�add�generated�directly�by�the�MNOs�themselves.�The�indirect�impact�refers�to�the�value�add�generated�by�their�major�stakeholders,�while�the�multiplier�effect�refers�to�the�impact�on�the�wider�economy,�generated�by�further�rounds�of�money�flows.��
The�figure�above�also�includes�the�2009�purchase�of�3G�spectrum.�Licenses�were�granted�in�April�2009�for�twenty�years.�Three�types�of�licenses�were�auctioned:�Turkcell�won�a�Type�A�license�(operating�at�45�MHz),�Vodafone�won�a�type�B�(operating�at�35�MHz)�while�Avea�secured�a�Type�C�(operating�at�30�MHz).�The�overall�payments�amounted�to�TRY�1.6�billion,�which�represented�a�significant�investment.�
A.3 Impact on employment
Mobile�services�in�Turkey�contribute�to�employment�in�several�ways,�including�direct�employment�by�the�MNOs,�the�employment�in�the�related�industries�described�above,�the�support�employment�created�by�outsourced�work�and�taxes�that�the�government�subsequently�spends�on�employment�generating�activities.�It�also�includes�the�induced�employment�resulting�from�the�above�employees�
and�beneficiaries�spending�their�earnings�and�creating�more�employment.6��
While�many�products�related�to�mobile�telephony�(such�as�radio�and�network�equipment,�handsets�and�smartphones)�are�designed�and�produced�abroad,�international�providers�have�established�offices�and�operations�in�Turkey,�recognising�the�importance�of�the�mobile�market.�For�instance,�network�equipment�providers�such�as�Ericsson,�Huawei�and�Motorola,�and�handset�producers�
������������������������������������������������������������6 The first effect is obtained directly from MNOs. The support and induced employment is estimated using a multiplier of
1.4. For MNOs, no multiplier was applied as the majority of induced employment will be captured by the first round flows.
0
5,000
10,000
15,000
20,000
25,000
30,000
2008 2009 2010 2011
Direct Indirect Multiplier

�
©�2012�Deloitte�LLP. 19
such�as�HTC,�Nokia�and�LG�have�local�offices�in�Turkey.�Additional�contributors�to�employment�include�other�handset�importers�and�dealers,�and�wholesalers�and�retailers�of�airtime�and�other�mobile�services.�Only�value�add�and�employment�that�can�be�attributed�to�Turkish�consumption�has�been�included�in�the�estimations.�
It�is�estimated�that�in�2011�the�mobile�communication�industry�employed�nearly�150,000�FTEs�in�Turkey,�as�shown�in�Table�3.�A�further�55,800�FTEs�have�been�generated�in�the�wider�economy�as�a�result�of�the�interactions�with�the�MNOs.�
Table�3:�Contribution�to�employment�from�the�mobile�value�chain�in�2011�
Employment�Impact� Number�of�employees�Number�of�employees�including�multiplier�
MNOs� 9,300� 9,300�
Fixed�telecommunications�operators� 3,830� 5,360�
Network�equipment�suppliers� 19,320� 27,000�
Handset�importers�and�dealers� 270� 380�
Handsets�and�airtime�wholesale�distributors� 4,660� 6,530�
Other�suppliers�of�capital�items� 1,860� 2,610�
Suppliers�of�support�services� 53,200� 74,500�
Airtime�dealers�and�retailers�� 56,350� 78,900�
Total� 148,800 204,600
Source:�Operator�data,�interviews�and�Deloitte�analysis�on�average�wage�rates.7�Differences�are�due�to�rounding.�
While�MNOs�employed�over�9,000�FTEs�in�2011,�the�wider�mobile�ecosystem�on�average�employed�140,000�additional�FTEs.�Of�these,�over�56,000�are�the�airtime�dealers�and�retailers�operating�from�supermarkets�(e.g.�Carrefour),�technology�stores�(e.g.�Media�Markt�and�Saturn)�and�smaller�independent�points�of�sale.�Overall,�in�Turkey,�there�are�an�estimated�17,000�independent�points�of�sale�for�handsets�and�airtime,�each�employing�2�or�3�FTEs�on�average.�In�addition,�handset�and�airtime�products�are�sold�in�banks,�post�offices,�kiosks,�oil�stations�and�online�websites:�FTEs�for�these�categories�that�do�not�primarily�deal�with�mobile�market�products�have�been�very�conservatively�accounted�for.�
Another�substantial�contribution�to�total�employment�is�brought�by�the�suppliers�of�support�services�(e.g.�consulting,�advertising�and�legal�services).�Finally,�almost�20,000�FTEs�were�involved�in�the�provision�of�network�equipment�and�other�network�services:�this�category�includes�all�major�international�equipment�providers�with�local�offices�in�Turkey�(e.g.�Ericsson,�Motorola�and�Huawei)�as�well�as�the�subcontractors�involved�in�the�equipment�installation�and�maintenance.�
������������������������������������������������������������7 These figures represent only employment directly created by revenue flows from the MNOs and do not represent total
employment in the whole industry for each section of the value chain.

�
©�2012�Deloitte�LLP. 20
A.4 Value add from taxation
As�discussed�in�more�detail�in�Appendix�B,�taxation�on�mobile�telephony�in�Turkey�is�amongst�the�highest�worldwide,�affecting�consumers�through�special�communications�and�special�usage�taxes�and�MNOs�through�corporate�and�licence�taxes.��
In�2011,�MNOs�in�Turkey�paid�approximately�TRY�9,270�million�to�the�government�in�taxes�and�regulatory�fees.�The�total�amount�of�corporation�tax,�sales�and�mobile�specific�taxes,�income�tax�paid�by�employees�and�regulatory�fees�paid�by�the�industry�since�2008�is�shown�in�Table�4.�
Table�4:�Tax�and�regulatory�payments�in�Turkey�from�MNOs,�TRY�millions�
Taxes�from�MNOs� 2008� 2009� 2010� 2011�
Corporation�tax� 812� 645� 596� 596�
Income�tax�paid�by�employees� 216� 209� 229� 254�
Sales�and�mobile�specific�taxes� 4,652� 4,292� 4,382� 4,622�
Regulatory�fees�(w/o�3G�licences)� 3,399� 3,534� 3,520� 3,795�
3G�licenses� 0� 1,600� 0� 0�
Total�taxes�and�fees� 9,080� 10,280� 8,727� 9,267�
Source:�Deloitte�analysis�based�on�operator�data.�Differences�are�due�to�rounding.�
Tax�and�regulatory�fees�represented�53%�of�domestic�company�revenues�for�Turkish�MNOs�in�2011.�The�largest�proportion�of�tax�revenue�is�raised�through�licence�and�other�regulatory�fees,�which�account�for�41%�of�tax�paid�in�2011.�Special�Communications�Taxes�and�other�mobile�
specific�taxes�account�for�36%�of�the�total.�The�breakdown�is�illustrated�in�Figure�31.8�
������������������������������������������������������������8 For some MNOs, total VAT payments reflect amounts carried forward in relation to the purchcase of 2G-3G licenses.

�
©�2012�Deloitte�LLP. 21
Figure�31:�Breakdown�of�2011�tax�revenues�from�MNOs�by�source�
�Source:�Deloitte�analysis�based�on�operator�data�
In�addition�to�the�direct�tax�revenue�received�from�MNOs,�other�players�in�the�mobile�industry�value�chain�generated�another�TRY�4,930�million�for�the�government�in�2011.��The�largest�payers�of�tax�in�the�mobile�supply�chain,�aside�from�the�MNOs,�are�the�handset�designers�and�dealers�and�the�suppliers�of�support�services.�The�estimated�tax�revenue�from�each�stage�of�the�value�chain�is�shown�in�Table�5.�
Table�5:�Total�tax�revenues�from�the�mobile�value�chain�in�2011,�TRY�millions�
Tax�Revenue� Tax�revenue� Tax�revenue�with�multiplier�
MNOs� 9,267� 12,973�Fixed�telecommunications�operators� 347� 485�Network�equipment�suppliers� 173� 242�Handset�designers�and�dealers� 2,364� 3,310�Other�suppliers�of�capital�items� 67� 94�Suppliers�of�support�services� 1,751� 2,451�Airtime�commission� 225� 315�Total� 14,194� 19,871�
Source:�Deloitte�analysis�based�on�company�accounts,�MNOs’�data�and�interviews.��Note�this�represents�tax�revenues�directly�created�by�revenue�flows�from�the�MNOs�and�not�total�tax�revenues�from�the�sector�
A.5 Overall benefits to the economy
The�discussion�above�has�illustrated�the�economic�contribution�of�the�mobile�telephony�industry�in�Turkey.�In�summary,�this�study�of�the�economic�impact�of�mobile�telephony�in�Turkey�finds�that�in�2011�the�mobile�communications�industry�has�contributed�TRY�28.8�billion�from�the�supply�side�impact.�This�represented�2.3%�of�GDP,��
6%3%
13%
36%1%
41%�
Corporation tax
Income tax paid by employees
VAT
Special communication taxes and other mobile specific taxes
Other taxes
Treasury share and other regulatory fees

�
©�2012�Deloitte�LLP. 22
Figure�32:�Supply�side�value�add�of�the�mobile�ecosystem�as�a�proportion�of�GDP�
�
Source:�Deloitte�analysis�
A.6 Other potential impacts
In�addition�to�benefits�to�the�supply�of�the�economy,�mobile�telephony�generates�potential�productivity�increases�through�the�use�of�mobile�telephony�for�business�purposes�as�well�as�intangible�and�social�benefits�to�consumers.��
A.6.1 Impact on Turkish productivity
Mobile�operations�in�Turkey�have�been�well�established�for�over�15�years9�and�the�Turkish�market�is�in�this�sense�similar�to�most�markets�in�Europe.�Productivity�improvements�provided�by�mobile�telephony�to�workers�in�the�latest�years�are�related�to�the�provision�of�3G�and�other�high�value�services�such�as�wireless�data�and�are�enhanced�by�the�proliferation�of�smartphones,�tablets,�dongles�and�Machine�To�Machine�(M2M)�operations.��
In�addition�to�the�well�established�benefits�that�mobile�services�provide�to�workers�and�
businesses10,�there�are�numerous�ways�in�which�mobile�services�have�led�to�productivity�increases�in�Turkey.�The�following�additional�recent�positive�impacts�have�been�identified�in�the�country:���
� Improved�efficiency�of�agricultural�production�and�distribution�of�food�supplies.�The�Vodafone�Farmer’s�Club�provides�farmers�with�weather�alerts�and�local�market�price�information.�
������������������������������������������������������������9 Turkcell established in 1994; Telsim was founded in 1994 and became Vodafone in 2007; Turk Telekom was founded in
1995 and merged into Avea in 2004. 10 These are discussed in section C.1.3
0.0%
0.5%
1.0%
1.5%
2.0%
2.5%
3.0%
3.5%
2008 2009 2010 2011
Supply side impact

�
©�2012�Deloitte�LLP. 23
� Improved�efficiency�in�payments:�Avea�has�a�near�field�communication�(‘NFC’)�service�which�enables�users�to�store�their�credit�cards,�ID�cards,�transport�tickets,�etc.�within�an�NFC�enabled�SIM�card,�therefore�reducing�transaction�times.�
� Development�of�M2M�operations:�Turkcell�has�provided�over�750,000�SIM�cards�on�automated�platforms�for�wireless�usage�for�a�number�of�companies�(including�e.g.�health�and�agriculture)�in�the�public�and�private�sector.�
� Contribution�to�regional�economic�development,�e.g.�the�creation�of�Turkcell�Global�Bilgi�Erzurum�Call�Centre�and�Avea�Erzincan�Call�Centre�in�Eastern�Turkey.�
While�these�productivity�impacts�cannot�be�accurately�quantified,��an�economic�value�approach�can�be�employed�to�provide�a�high�level�estimation�of�potential�productivity�benefits.�The�economic�value�concept�set�out�in�Figure�33�indicates�that,�if�mobile�workers�in�Turkey�achieved�a�5%�increase�on�their�productivity�as�a�result�of�using�mobile�phones,��the�potential�productivity�impact�of�mobile�services�on�the�economy�could�be�up�to�TRY�57�billion�in�2011.�
Figure�33:�Economic�impact�in�2011�of�increased�productivity�amongst�high�mobility�workers�
�Source:�Deloitte�analysis�based�on�Deloitte�assumptions,�interviews�and�Turkey�Bureau�of�Statistics.�Differences�are�due�to�rounding.�
A.6.2 Benefits�to�consumers�
Consumer�benefits�of�mobile�telephony�are�widely�recognised�in�social�and�economic�papers.11�Mobile�services�promote�social�cohesion,�contribute�to�extending�communications�(especially�to�users�with�low�education�and�literacy),�stimulate�local�content,�contribute�to�providing�technology�knowledge�to�the�less�educated�and�assist�in�disaster�relief.�In�addition,�wireless�data�and�������������������������������������������������������������11 Typical positive impacts of mobile telephony are reported in Appendix C.1.3 to this paper.
�
=��
TRY 28 billion� �Total productivity increase�
Key:�Input�Calculation�
� �29 million
Total workforce��
�
38% of workers are high mobility�
�TRY 59,500 average
GDP contribution per mobile worker
��
�
��
87% of HM workforce is able to use mobile communications� �
5% average productivity
increase�
�
� � �TRY 650 billion output of workers that would use mobile communications �
��
�
TRY 567 billion total output of workers using mobile communications�
� � ��
���
X�� X�
X�
X�=��
=��

�
©�2012�Deloitte�LLP. 24
broadband�allow�these�benefits�to�be�amplified�and�coupled�with�those�given�by�fixed�telecom�services.��
MNOs�have�identified�a�number�of�CSR�projects�and�services�they�provide�in�Turkey�that�deliver�significant�tangible�and�intangible�benefits�to�consumers�and�to�businesses.�These�include:�
� Vodafone�Turkey�Foundation�collaborated�with�the�Turkish�Red�Crescent�in�order�to�increase�the�number�of�voluntary�blood�donors�and�raise�public�awareness.�50,000�users�subscribed�to�the�service�in�the�first�week�of�its�launch.�An�app�which�enables�users�on�iOS�and�Android�operating�systems�to�track�and�monitor�processes�facilitating�blood�donation�is�expected�to�be�launched.�
� The�‘Women�Movement�in�Technology’�project�was�launched�by�Turkey�Vodafone�Foundation,�aiming�to�develop�the�social�and�economic�integration�of�women�through�trainings�on�entrepreneurship,�technology�literacy�and�soft�skill�trainings.��
� Avea�runs�the�‘My�Homeland�is�Anatolia,�My�Profession�is�Technology’�programme�with�the�aim�of�developing�mobile�applications�in�Anatolia�s�disadvantaged�regions.��
� Through�improvements�to�its�network,�Turkcell�enabled�location�information�for�112�emergency�calls.�This�allows�users�to�send�call�location�information�to�emergency�institutions�for�calls�made�to�the�112�Emergency�Centre�in�Ankara,�Antalya,�and�Isparta.�
In�addition,�in�Turkey,�competition�in�the�industry�resulted�in�a�reduction�of�prices�and�spurred�a�number�of�high�value�services�provided�by�the�MNOs.�Figure�34�below�shows�how�usage�per�user�per�month�has�been�growing�over�time�at�a�steady�rate�over�the�last�four�years.�This�can�be�related�to�the�substantial�decrease�in�prices�over�the�same�period�(over�46%�from�2008�to�2011).�

�
©�2012�Deloitte�LLP. 25
Figure�34:�Price�per�minute�and�minutes�of�use�per�user�per�month�
�
Source:�Wireless�Intelligence�data;�Deloitte�analysis�
While�intangible�consumer�benefits�cannot�be�accurately�quantified,��a�willingness�to�pay�analysis�that�combines�data�on�usage�increases�and�price�decreases�over�the�years�can�be�employed�to�estimate�how�consumer�benefits�have�increased�over�time�in�the�last�four�years..�In�particular,�this�approach,�described�in�more�detail�in�Appendix�C.1.4,��allows�the�estimation�of�the�beneficial�impact�of�price�reductions�and�usage�increases�experienced�in�Turkey�over�the�last�four�years.�This�approach�suggests�that�consumers�enjoyed�up�to�the�equivalent�of�TRY�8.2�billion�in�intangible�
benefits�in�2011.12�
������������������������������������������������������������12�There�are�numerous�reasons�why�these�estimates�could�underestimate�or�overestimate�the�true�value�of�intangible�
benefits.�This�methodology�assumes�that�all�subscribers�joined�the�network�in�2007:�this�allows�estimation�of�only�the�consumer�surplus�enjoyed�by�customers�that�joined�the�network�from�2008�onward,�leading�to�an�underestimation�of�the�true�consumer�surplus.�On�the�other�hand,�the�methodology�does�not�account�for�potential�changes�in�the�willingness�to�pay�of�consumers�over�time.�The�effect�of�this�on�the�overall�calculation�depends�on�whether�the�true�willingness�to�pay�has�increased�or�decreased�over�time.��
0.00
0.02
0.04
0.06
0.08
0.10
0.12
0.14
0.16
0.18
0�
50�
100�
150�
200�
250�
2008 2009 2010 2011
Average call minutes per month (left axis)� Average price per call minute (right axis)

�
©�2012�Deloitte�LLP. 26
Figure�35:�Intangible�benefits�using�willingness�to�pay�concept,�TRY�millions�
�
Source:�Deloitte�analysis�
0
1,000
2,000
3,000
4,000
5,000
6,000
7,000
8,000
9,000
2008 2009 2010 2011

�
©�2012�Deloitte�LLP. 27
Appendix B Taxation on MNOs and consumers in Turkey
This�appendix�provides�a�more�detailed�account�of�the�mobile�specific�taxation�that�Turkish�consumers�and�MNOs�are�subject�to�and�describes�the�impacts�of�this�taxation�on�consumers,�MNOs�and�the�economy.�
B.1 Mobile specific taxation
Despite�the�economic�contribution�estimated�above,�mobile�consumers�and�MNOs�suffer�a�taxation�regime�which�is�specific�to�this�industry�in�Turkey�and�more�severe�than�that�faced�by�consumers�and�MNOs�in�any�European�country.�
Figure�36�summarises�the�different�taxes�that�apply�to�consumers�in�Turkey�in�2011.�These�taxes,�how�they�have�increased�in�2012�and�their�impacts�on�consumers�and�MNOs,�are�described�in�more�detail�below.��
Figure�36:�Mobile�specific�taxation�on�consumers�and�MNOs,�2011�
�Source:�MNOs’�data�
B.2 Mobile specific taxation on consumers
Mobile�consumers�in�Turkey�are�taxed�on�every�component�that�forms�a�typical�bundle�of�mobile�service�consumption,�e.g.�handsets,�subscriptions�and�usage.�This�taxation�which�applies�in�addition�to�the�standard�18%�VAT�rate,�is�summarised�in�Table�6�and�described�in�more�detail�below.�
Handset cost VAT�18%�
SCT25%
Radio/TV share 6%
Mobile usage�calls/SMS
VAT�18%�
SCT25%
Fixed callsVAT�18%
SCT15%
SCT initial subscription charge�TRY 34
Wireless licencefee
TRY 13.2
Wireless usage fee�TRY 13.2
Activation
Annual licence fee
TRY15.35� Licence obligations (Treasury share and
Telecom Authority share)
MNO’s revenues –�TRY 100�

�
©�2012�Deloitte�LLP. 28
Table�6:�Summary�of�taxation�paid�by�consumers�in�2011�
Mobile�specific�taxation�on�consumers�
Handsets� Airtime/SMS/Data� SIM�activation�
VAT�
Special�Consumption�
Tax�
Share�of�Turkish�Radio�TV�
VAT�
Special�Communications�Tax�
�VAT�
Initial�Subscription�Charge�
Wireless�Licence�Fee�
Wireless�Usage�Fee�
18%�25%�on�all�handsets�
6%� 18%�25%�on�calls�and�SMS,�
5%�on�data�18%� TRY�34�� TRY�13.2��
TRY�13.2�paid�each�year�for�an�active�SIM�card�
Source:�MNOs’�data��
B.2.1 Mobile specific taxes on usage
The�Special�Communications�Tax�(‘SCT’)�on�usage�is�a�25%�tax�that�is�paid�directly�by�mobile�users�and�is�applied�on�call�minutes�and�messages�on�top�of�VAT.��A�reduced�rate�(5%�instead�of�25%)�is�
applied�on�data�usage.13�As�noted�by�the�OECD14,�“this�special�tax�was�introduced�in�1999�as�a�contribution�to�help�recovery�from�the�damage�caused�by�the�disastrous�earthquake�of�August�1999.�This�high�percentage�tax�had�been�understood�to�be�temporary�for�one�year�when�introduced”.�However,�it�has�always�remained�in�place,�notwithstanding�the�economy’s�recovery�since�then.�As�such,�for�every�TRY�100�of�net�airtime�and�SMS�usage�purchased�by�customers,�a�tax�of�TRY�43�is�paid�in�addition�to�the�net�price.�
The�SCT�applies�in�a�discriminatory�way�to�mobile�telephony�usage:�the�SCT�applying�to�fixed�telephony�is�set�at�15%.�For�the�same�pre�tax�price,�the�retail�post�tax�price�is�cheaper�than�a�mobile�call.��
B.2.2 Mobile specific taxes on handsets
Handsets�are�subject�to�heavy�taxation�in�Turkey.�A�Special�Consumption�Tax�of�25%�is�levied�on�
the�Cost,�Insurance�and�Freight�(‘c.i.f.’)�price15�for�each�handset�imported�and�is�passed�through�to�consumers�(in�addition�to�VAT)�at�the�moment�of�purchasing�a�new�mobile�device.�This�tax�also�has�a�TRY�100�‘floor’�amount�that�is�applied�when�25%�of�the�import�price�of�a�handset�amounts�to�less�than�TRY�100.�This�particularly�affects�the�price�of�low�end�handsets,�therefore�impacting�low�end�consumers�and�the�poorer�sectors�of�the�population.�
The�Special�Consumption�Tax�was�increased�from�20%�to�25%�in�2011,�while�the�minimum�floor�level�was�increased�from�TRY�50�to�TRY�100�in�September�2011.�
������������������������������������������������������������13 This reduced 5% rate was introduced in 2009. 14 “Regulatory reform in Turkey” (2002). 15 The c.i.f. price is the price of a good delivered at the frontier of the importing country, including any insurance and freight
charges incurred to that point, before the payment of any import duties or other taxes on imports or trade and transport margins within the country.

�
©�2012�Deloitte�LLP. 29
In�addition�to�the�Special�Consumption�Tax,�handsets�price�is�also�subject�to�a�6%�tax�that�benefits�the�Turkish�Radio�Television�Foundation.�This�is�levied�on�handsets�at�the�moment�of�importation.�
B.2.3 Mobile specific taxes on mobile subscriptions
Mobile�subscriptions�are�also�subject�to�mobile�specific�taxation�directly�affecting�consumers:��
� An�Initial�Subscription�Charge�amounting�to�TRY�34�in�2011�applies.�This�is�an�additional�fixed�component�of�the�Special�Communications�Tax�and�consists�of�a�fixed�amount�to�be�paid�once�by�consumers�when�a�new�SIM�card�is�purchased.�It�is�adjusted�every�year�according�to�inflation�and�has�been�set�at�TRY�37�for�2012.�
� A�Wireless�Licence�Fee�(TRY�13.2�in�2011)�is�also�paid�by�consumers�when�a�new�connection�is�purchased.�This�tax�can�be�thought�of�as�a�registration�fee�and�is�paid�regardless�of�whether�the�connection�is�used�for�voice�or�mobile�broadband.�It�is�adjusted�every�year�according�to�inflation�and�has�been�set�at�TRY�14.56�for�2012.�
� An�annual�Wireless�Usage�Fee�(TRY�13.2�in�2011)�applies�as�a�rental�fee�that�users�pay�annually�for�their�active�subscriptions�and�has�been�set�at�TRY�14.56�for�2012.��
B.2.4 Implications for mobile consumers
As�noted�above,�taxation�on�mobile�consumers�in�Turkey�is�complex�and�affects�all�components�of�mobile�consumers’�spend.�In�addition,�as�some�of�the�fixed�taxes�are�linked�to�inflation,�taxation�increases�over�time�while�competition�and�developments�in�the�mobile�market�act�to�reduce�prices�and�improve�service�quality.��
According�to�a�recent�benchmarking�study�conducted�by�Deloitte�for�the�GSMA,�the�mobile�telecommunications�sector�in�Turkey�shows�the�highest�taxation�as�a�proportion�of�mobile�services�cost�among�the�111�global�countries�included�in�the�research.�As�taxation�in�Turkey�affects�all�components�of�the�Total�Cost�of�Mobile�Ownership�(‘TCMO’),�both�tax�as�a�proportion�of�TCMO�and�as�a�percentage�of�the�Total�Cost�of�Mobile�Usage�(‘TCMU’)�are�the�highest�worldwide.�Turkey�ranked�first�for�taxation�globally:�on�average,�tax�as�a�proportion�of�TCMO�was�18.2%�globally�in�2011,�while�in�Turkey�this�amounted�to�48.2%.�Tax�as�a�proportion�of�usage�costs�was�47.6%�in�Turkey�in�2011,�while�the�global�average�was�18%.�In�Turkey,�38%�of�a�handset�costs�was�attributed�to�tax�in�2011,�while�the�global�average�of�taxation�as�a�proportion�of�handset�costs�was�23.3%.�

�
©�2012�Deloitte�LLP. 30
Figure�37:�Tax�as�a�percentage�of�TCMO,�TCMU�and�handset�price,�respectively�
�
Source:�Deloitte/GSMA�Global�Mobile�Tax�Review�2011�
Since�this�study,�taxation�has�further�increased�in�autumn�2011,�further�impacting�handsets�costs�and�activation�costs.��
Such�taxation�has�a�number�of�economic�and�social�implications�for�consumers:��
� The�multitude�of�taxes�affecting�different�components�of�the�mobile�service�basket�provides�negative�incentives�and�purchasing�signals�to�customers�and�discriminates�against�mobile�calls�in�favour�of�fixed�calls,�which�creates�distortions�to�consumer�choice�and�to�competition�in�the�market.�
� By�taxing�the�acquisition�of�SIM�cards,�mobile�subscription�and�handsets,�mobile�specific�taxation�in�Turkey�hits�access�to�mobile�telephony�particularly�hard.�Handset�costs�and�subscription�costs�represent�the�most�significant�barrier�to�the�consumption�of�mobile�services,�particularly�for�the�poorer�sectors�of�the�population.�Operators�have�also�noted�that�these�taxes�are�currently�constraining�acquisition�of�data�only�SIM�cards�and�M2M�cards.�
� Fixed�taxes�on�subscriptions�and�taxation�on�handsets�are�therefore�regressive�in�nature�and�contribute�to�reduce�access,�penetration�and�total�network�usage.��
48.2%30.4%�
27.9%�25.0%24.4%�
22.0%�21.0%�21.0%�21.0%�20.7%�20.0%�20.0%�20.0%�20.0%�20.0%�20.0%�19.6%�19.0%19.0%19.0%19.0%18.9%�18.8%18.7%18.0%�18.0%�18.0%�
17.0%15.0%�
12.0%�0%� 20% 40% 60%�
TurkeyGreeceCroatia�
HungaryItaly�
Poland�Portugal�
IrelandBelgium�
Uzbekistan�UK
Austria�Ukraine�
SloveniaBulgariaAlbaniaFrance�
Netherlands�Germany�SlovakiaRomania�
AzerbaijanRussia
GeorgiaSpain�
Serbia�Malta
MontenegroCyprus
Kazakhstan�
Tax as % TCMO
47.6%31.0%
28.0%25.0%25.0%
22.0%21.0%21.0%21.0%21.0%
20.0%20.0%20.0%20.0%19.6%19.3%19.0%19.0%19.0%19.0%18.9%
18.0%18.0%18.0%18.0%18.0%18.0%
17.0%15.0%
12.0%
0% 20% 40% 60%
TurkeyGreeceCroatia
HungaryItaly
PolandPortugal
IrelandBelgium
UzbekistanUK
AustriaUkraine
SloveniaBulgariaAlbaniaFrance
NetherlandsGermanySlovakiaRomania
AzerbaijanRussia
GeorgiaSpain
SerbiaMalta
MontenegroCyprus
Kazakhstan
Tax as % TCMU
40.0%38.0%
33.0%�30.0%�
25.0%23.0%�23.0%�
22.0%�21.0%�21.0%�21.0%�20.3%�20.0%�20.0%�20.0%�20.0%�20.0%�20.0%�19.6%�19.0%�19.0%�19.0%�19.0%�19.0%�
18.0%�18.0%�18.0%�
17.0%�15.0%�
12.0%
0% 10% 20% 30%� 40%� 50%
UzbekistanTurkey
AzerbaijanGeorgiaHungary
RussiaCroatiaPoland
PortugalIreland
BelgiumItalyUK
AustriaUkraine
SloveniaBulgariaAlbaniaFrance
NetherlandsGreece
GermanySlovakiaRomania
SpainSerbiaMalta
MontenegroCyprus
Kazakhstan
Tax as % handset price

�
©�2012�Deloitte�LLP. 31
� Specific�taxation�on�usage,�such�as�airtime�taxes,�can�further�represent�a�significant�obstacle�to�usage�of�mobile�services�by�the�poorer�sectors�of�the�population,�who�could�derive�significant�benefits�from�being�connected.�
� Since�handsets�and�smartphones�may�represent�the�only�access�to�wireless�broadband�for�certain�sectors�of�the�population�and�in�rural�areas,�handset�taxes�may�also�lead�to�under�consumption�of�internet�services.�
� Finally,�the�imposition�of�mobile�specific�taxes�may�signal�that�the�government�wishes�to�discourage�usage�of�mobile�services,�as�governments�sometimes�increase�the�consumption�tax�on�goods�for�which�they�wish�to�discourage�consumption,�for�example�tobacco�or�alcohol.��
A�key�impact�of�mobile�specific�taxation�is�to�increase�the�total�costs�of�mobile�ownership�for�Turkish�consumers.�As�shown�in�Figure�38,�in�2011�Turkey�had�one�of�the�highest�TCMO�as�a�proportion�of�GDP�per�capita�in�the�region�and�in�Europe�(7.7%),�meaning�that�consumers�pay�proportionately�more�for�mobile�services�in�Turkey�than�in�any�European�countries.�Therefore,�affects�direct�consumer�spending,�with�possible�negative�implications�for�the�economy.�If�mobile�specific�taxation�was�removed,�the�Turkish�TCMO�would�decrease�by�30%.�This�would�align�the�Turkish�TCMO�as�a�percentage�of�GDP�per�capita�(which�would�decrease�to�5.4%)�to�the�sample�average�(5.1%).�
Figure�38:�TCMO�as�a�percentage�of�GDP�per�capita�
�
Source:�Deloitte�analysis�
Given�the�high�dispersion�of�income�distribution�in�Turkey,�as�shown�in�Figure�39�by�the�Gini�
Index�of�inequality,16�the�presence�of�fixed�mobile�specific�taxes�is�likely�to�be�disproportionately�
������������������������������������������������������������16�The Gini index measures the extent to which the distribution of income within an economy deviates from a perfectly equal
distribution. A Gini index of 0 represents perfect equality, while an index of 100 implies perfect inequality.�
0%
2%
4%
6%
8%
10%
Ukr
aine
Bul
garia
Turk
ey
Gre
ece
Geo
rgia
Fran
ce
Mon
ten …
Pol
and
Hun
gary
Mal
ta
Ser
bia
Por
tuga
l
Spa
in
Slo
vaki
a
Bel
gium
Rus
sia
Irela
nd
Slo
veni
a
Kaz
akh …
UK
Cro
atia
Aze
rbai
j …
Italy
Net
herl …
Rom
ania
Ger
man
y
Aus
tria
Cyp
rus

�
©�2012�Deloitte�LLP. 32
felt�by�the�poorer�sectors�of�the�population.�It�is�therefore�more�likely�that�in�Turkey�those�consumers�who�would�benefit�the�most�from�the�beneficial�social�and�productivity�impacts�generated�by�access�to�mobile�telephony�are�those�for�which�mobile�specific�taxation�creates�a�barrier�to�service�consumption.��
Figure�39:�Gini�coefficient�(2010)�
�
Source:�CIA�Factbook;�
The�higher�share�of�tax�as�a�proportion�of�costs�of�mobile�ownership�and�usage�and�the�structure�of�taxation�create�a�significant�barrier�to�entry�in�the�mobile�market.�In�particular,�taxes�on�SIM�activation�and�the�annual�Wireless�Usage�Fee�contribute�to�limiting�consumer�choice�and�competition�in�the�market.��
In�no�country�in�Europe�does�access�to�services�(activation,�SIM�acquisition�and�handset)�attract�a�mobile�specific�tax.�This�can�be�contrasted�with�mobile�penetration�in�Turkey,�which�is�amongst�the�lowest�in�Europe�and�in�the�area,�still�far�from�the�100%�penetration�milestone�achieved�by�most�European�countries�years�ago.�3G�penetration�is�also�lagging�well�below�European�countries�at�38%,�compared�to�an�EU�average�of�56%.��
0
5
10
15
20
25
30
35
40
45
50
Bul
garia
Rus
sia
Geo
rgia
Turk
eyU
zbek
ista
nA
lban
iaP
olan
dU
KC
roat
iaA
zerb
aija
nG
reec
eFr
ance
Italy
Spa
inA
vera
geR
oman
iaN
ethe
rland
sIre
land
Cyp
rus
Slo
veni
aS
erbi
aB
elgi
umU
krai
neG
erm
any
Kaz
akhs
tan
Aus
tria
Mal
taS
lova
kia
Por
tuga
lH
unga
ry

�
©�2012�Deloitte�LLP. 33
Figure�40:�Mobile�penetration�in�a�sample�of�European�and�neighbouring�countries�
�
�Source:�Wireless�Intelligence�
Figure�41:�3G�penetration�in�a�sample�of�European�and�neighbouring�countries�
�
�Source:�Wireless�Intelligence�
An�analysis�of�countries�that�had�a�lower�penetration�than�Turkey�in�2000�suggests�that�penetration�in�all�of�them�has�outpaced�Turkey�by�2011.�As�such,�and�considering�that�higher�income�and�professional�workers�are�more�likely�to�own�multiple�SIM�cards,�a�substantially�lower�proportion�of�population�in�Turkey�has�access�to�mobile�telephony�compared�to�European�countries�and�other�countries�in�the�region.�
0%
20%
40%
60%
80%
100%
120%
140%
160%
180%
200%
Mon
tene
gro
Por
tuga
lR
ussi
aA
lban
iaB
ulga
riaA
ustri
aIta
lyC
ypru
sG
erm
any
Gre
ece
Pol
and
Mal
taR
oman
iaK
azak
hsta
nS
pain
Ukr
aine
Bel
gium U
KC
roat
iaN
ethe
rland
sIre
land
Geo
rgia
Slo
vaki
aH
unga
ryS
erbi
aS
love
nia
Fran
ceA
zerb
aija
nTu
rkey
Uzb
ekis
tan
0%
10%
20%
30%
40%
50%
60%
70%
80%
90%
100%
Por
tuga
lA
ustri
aIta
lyU
nite
d …
Spa
inG
reec
eC
ypru
sIre
land
Mal
taG
erm
any
Net
herla
nds
Slo
veni
aP
olan
dFr
ance
Bul
garia
Slo
vaki
aH
unga
ryR
oman
iaTu
rkey
Cro
atia
Bel
gium
Mon
tene
gro
Rus
sia
Geo
rgia
Ser
bia
Ukr
aine
Uzb
ekis
tan
Alb
ania
Kaz
akhs
tan
Aze
rbai
jan

�
©�2012�Deloitte�LLP. 34
Figure�42:�Penetration�in�a�sample�of�European�and�neighbouring�countries,�2000�2011�
�
�Source:�Wireless�Intelligence�
0%
20%
40%
60%
80%
100%
120%
140%
160%
Q1
2000
Q3
2000
Q1
2001
Q3
2001
Q1
2002
Q3
2002
Q1
2003
Q3
2003
Q1
2004
Q3
2004
Q1
2005
Q3
2005
Q1
2006
Q3
2006
Q1
2007
Q3
2007
Q1
2008
Q3
2008
Q1
2009
Q3
2009
Q1
2010
Q3
2010
Q1
2011
Q3
2011
Turkey
Azerbaijan
Serbia
Croatia
Slovakia
Georgia
Ukraine
Kazakhstan
Romania
Poland
Albania
Bulgaria
Russia

�
©�2012�Del
The�negalow�leveby�low�in
Figure�4
Source:�W
0%
5%
10%
15%
20%
25%
30%
35%
40%
Net
herla
nds
F
loitte�LLP.
ative�impact�el�of�fixed�linnternet�pene
43:�Fixed�tele
World�Bank�data
Fran
ceG
erm
any
UK
Bel
gium
Mal
taS
love
nia
of�taxation�one�penetrationetration�comp
ephone�lines
a;�Deloitte�analy
Aus
tria
Spa
inIre
land Italy
Gre
ece
Hun
gary
on�mobile�pen�in�Turkey,�pared�to�Eur
s�per�100�peo
ysis�
Por
tuga
lC
roat
iaC
ypru
sS
lova
kia
Bul
garia
Rom
ania
enetration�is�despite�the�m
ropean�count
ople�
Pol
and
Rus
sia
Turk
eyS
erbi
aM
onte
negr
oU
krai
ne
likely�to�be�emore�favourtries.�
Aze
rbai
jan
Kaz
akhs
tan
Geo
rgia
Alb
ania
Uzb
ekis
tan
exacerbated�bable�taxation
�
by�the�relativn�treatment,�
35
vely�and�

�
©�2012�Deloitte�LLP. 36
Figure�44:�Penetration�of�internet�
�
Source:�World�Bank�data;�Deloitte�analysis�
As�such,�existing�levels�of�mobile�penetration,�combined�with�low�levels�of�fixed�line�and�internet�availability�make�Turkey�one�of�the�least�connected�countries�in�Europe.�
B.3 Taxation on MNOs
MNOs�in�Turkey�are�subject�to�a�corporate�tax�as�well�as�licence�obligations�and�fees�that�act�as�a�form�of�mobile�specific�taxation�on�MNOs’�revenues,�as�summarised�in�Table�7.�
Table�7:�Summary�of�taxation�paid�by�MNOs�in�2011�
Corporation�tax�Mobile�specific�taxation�on�MNOs�
Telecom�Authority�Share� Treasury�share�tax�
20.00%� 0.35%�of�MNOs’�revenues� 15%�of�MNOs’�revenues�
Source:�Deloitte/GSMA�Global�Mobile�Tax�Review�(2011);�MNOs’�data�
B.3.1 Corporate taxation
Turkish�businesses�face�a�corporate�tax�rate�of�20%�on�profits.�Figure�45�below�shows�how�this�compares�to�a�set�of�European�and�neighbouring�countries.��
0%
10%
20%
30%
40%
50%
60%
70%
80%
90%
Net
herla
nds
UK
Ger
man
yS
lova
kia
Bel
gium
Fran
ceA
ustri
aIre
land
Slo
veni
aS
pain
Hun
gary
Mal
taP
olan
dC
roat
iaIta
lyC
ypru
sM
onte
negr
oP
ortu
gal
Bul
garia
Alb
ania
Gre
ece
Rus
sia
Ser
bia
Rom
ania
Turk
eyA
zerb
aija
nK
azak
hsta
nG
eorg
iaU
krai
neU
zbek
ista
n

�
©�2012�Deloitte�LLP. 37
Figure�45:�Corporate�tax�rates�in�Europe�
�
Source:�Deloitte�Global�Mobile�tax�review�2011��
B.3.2 Mobile specific taxation paid by the MNOs
MNOs�in�Turkey�are�subject�to�a�licence�fee�calculated�as�15%�of�their�turnovers,�paid�to�the�Turkish�Treasury�on�a�monthly�basis.�In�addition,�they�are�subject�to�a�‘Telecommunications�Regulation�Authority�Share’�paid�as�a�contribution�to�the�expenses�of�the�regulatory�authority,�calculated�as�the�0.35%�of�the�MNO’s�net�sales�per�annum.�Fixed�telecom�operators�are�not�subject�to�the�Treasury�Share�fee�as�a�similar�fee�applying�to�them�was�removed�in�2004�prior�to�the�fixed�operator’s�privatisation.�
In�addition�to�these�licence�fees,�MNOs�in�Turkey�are�subject�to�other�fees�including�usage�and�licence�fees�for�the�utilisation�of�spectrum,�numbering�fees�for�access�to�numbering�resources�in�addition�to�fees�required�for�the�installation�of�base�stations.�MNOs�notably�paid�TRY�1.6�billion�for�the�purchase�of�3G�licences�from�the�government.�
B.4 Implications for MNOs
The�level�of�consumer�taxation�discussed�above�influences�MNOs’�pricing�policies,�while�the�discriminatory�tax�treatment�of�mobile�telephony�compared�to�fixed�telephony�further�constrains�MNOs’�ability�to�compete�on�a�level�playing�field�on�prices.��
These�taxation�pressures�mean�that�the�prices�MNOs�charge�face�a�number�of�distortions,�further�exacerbated�by�the�15.35%�licence�fee�applicable�on�MNOs’�revenues.�This�licence�fee�acts�as�an�additional�tax�for�MNOs�and�the�implementation�of�this�tax�raises�a�number�of�concerns�for�MNOs:�
� Unlike�VAT�or�SCT,�which�are�collected�from�consumers�on�behalf�of�the�government,�this�licence�fee�is�levied�on�MNOs�directly.�As�such,�the�licence�fee�cannot�be�itemised�in�prices�or�receipts�and�is�therefore�not�transparent�to�consumers.��
0%
5%
10%
15%
20%
25%
30%
35%
Mal
ta
Bel
gium
Ger
man
y
Fran
ce
Italy
Spa
in UK
Por
tuga
l
Net
herla
nds
Ukr
aine
Aus
tria
Gre
ece
Turk
ey
Slo
veni
a
Rus
sia
Kaz
akhs
tan
Hun
gary
Cro
atia
Aze
rbai
jan
Slo
vaki
a
Pol
and
Rom
ania
Geo
rgia
Irela
nd
Ser
bia
Cyp
rus
Bul
garia
Alb
ania
Uzb
ekis
tan
Mon
tene
gro

�
©�2012�Deloitte�LLP. 38
� This�licence�fee�is�discriminatory�in�its�treatment�of�mobile�telephony�relative�to�other�industries,�including�fixed�telephony,�and�as�such�has�a�distortionary�impact�on�the�market.��
� No�country�in�the�EU�applies�a�similar�tax�and�the�MNOs�question�whether�it�is�aligned�with�the�EU�framework.�Turkey�is�introducing�regulation�consistent�with�the�EU�framework�in�a�number�of�areas,�e.g.�Mobile�Termination�Rates,�and�the�MNOs�contrast�this�with�the�current�taxation�policy.�
A�key�issue�caused�by�the�taxation�structure�in�Turkey�is�the�amount�of�customer�subsidies�MNOs�need�to�fund�in�order�to�compete�in�the�market,�particularly�to�reduce�the�entry�barriers�that�consumer�taxation�generates�especially�for�the�poorer�and�younger�sections�of�the�population.�In�particular,�MNOs�have�noted�the�amount�of�subsidies�required�to�incentivise�activation�and�SIM�card�purchases,�as�these�represent�the�highest�barriers�to�entry�and�may�constrain�the�development�of�effective�competition�in�the�market.�
When�considering�the�amount�of�subsidies�that�MNOs�need�to�support�to�develop�the�market�and�the�licence�fee�that�requires�MNOs�to�pay�15.35%�of�the�revenues,��Figure�46�indicates�how�MNOs’�net�earnings�are�affected�by�the�licence�fee�and�by�tax�related�subsidies,�amounting�to�around�80%�of�total�earnings.�
Figure�46�MNOs’�earnings�in�Turkey�and�for�a�typical�EU�operator�
�Source:�Deloitte�analysis�based�on�discussions�with�MNOs��
TRY 15.35TRY 5*
TRY 79.65TRY 100
Earn
ings
–TR
Y 10
0
Turkey
Typical EU Countries /
Fixed Operators in Turkey
*Operators in Turkey partly subsidise the activation taxes on SIM cards. This is a market estimate based on discussions with operators and may vary depending on operators’ market positions and commercial policies.
Licence fee
Subsidies

�
©�2012�Deloitte�LLP. 39
This�also�has�a�direct�impact�on�the�profitability�of�Turkish�MNOs.�For�example,�the�EBITDA�
margin17�of�MNOs�in�Turkey�is�significantly�lower�than�EBITDA�margin�for�a�set�of�European�countries�in�which�no�mobile�specific�taxation�exists.�
Figure�47:�EBITDA�margin,�2011�
�
Source:�Wireless�Intelligence�
Such�a�comparatively�low�EBITDA�margin�raises�concerns�about�the�ability�of�MNOs�to�recoup�the�large�fixed�investments�that�they�incurred�in�order�to�set�up�and�upgrade�their�networks,�and�about�future�investment�in�mobile�networks.��
International�comparisons�relating�to�capex�investment�by�MNOs�indicate�that�Turkey�lags�behind�European�countries�for�which�similar�data�is�available.�As�shown�in�Figure�48,�in�2010�capex�per�capita�was�lower�than�Turkey�only�in�Uzbekistan�and�Montenegro.���
������������������������������������������������������������17 The EBITDA margin is a measurement of a company's operating profitability. It is equal to earnings before interest,
tax, depreciation and amortization (EBITDA) divided by total revenue.
0%
10%
20%
30%
40%
50%
60%
Italy
Ukr
aine
Por
tuga
l
Bul
garia
Rus
sia
Hun
gary
Bel
gium
Cro
atia
Pol
and
Gre
ece
Ger
man
y
Fran
ce
Rom
ania
Net
herla
nds
Slo
veni
a
Spa
in
Turk
ey UK
Irela
nd

�
©�2012�Deloitte�LLP. 40
Figure�48:�Capex�per�capita,�2010,�US$�
�
Source:�Wireless�Intelligence�
Turkey�has�so�far�attracted�a�significant�amount�of�Foreign�Direct�Investment�(‘FDI’)�in�mobile�operations�and�two�out�of�three�MNOs�are�foreign�owned.�However,�the�existing�levels�of�consumer�and�MNOs�taxation�are�reducing�profitability�and�risk�negatively�impacting�future�prospects�for�investment�at�a�time�when�MNOs�are�looking�to�develop�advanced�network�to�support�wireless�broadband�and�wireless�data�provision.��
Investment�in�mobile�network�is�crucial�for�Turkey’s�development.�As�noted�above,�Turkey�has�one�of�the�lowest�fixed�and�internet�penetrations�in�Europe�and�in�the�region.�Access�to�mobile�devices�such�as�smartphones�and�tablets�that�provide�access�to�wireless�broadband�is�therefore�paramount�to�the�digitalisation�of�the�country.�
B.5 Impact of changes in taxation policy
This�section�shows�the�results�of�a�simulation�exercise�aimed�at�estimating�the�impact�that�a�reduction�in�mobile�specific�taxes�in�Turkey�would�have�on�government�revenues�and�on�a�number�of�key�indicators�such�as�mobile�penetration,�3G�penetration,�usage�per�subscriber,�total�usage�and�handset�sales.�
The�simulation�undertaken�investigates�the�combined�impact�of�the�following�changes�to�the�current�taxation�regime�in�Turkey:�
� Elimination�of�the�initial�subscription�charges,�i.e.�the�Wireless�Licence�Fee�(TRY�13.2�in�2011)�and�the�fixed�component�of�the�Special�Communications�Tax�(TRY�34�in�2011)�on�data�only�SIM�cards�in�2012.�
� A�reduction�of�the�Wireless�Licence�Fee�and�the�fixed�component�of�the�Special�Communications�Tax�on�all�other�SIM�cards�in�2012.�
02468
101214161820
Net
herla
nds
Irela
nd
Por
tuga
l
Ger
man
y
Fran
ce
Slo
vaki
a
Bel
gium Ita
ly
Bul
garia
Slo
veni
a
Cro
atia
Geo
rgia
Hun
gary
Rom
ania
Turk
ey
Uzb
ekis
tan
Mon
tene
gro

�
©�2012�Deloitte�LLP. 41
� Reduction�of�the�Special�Communications�Tax�(SCT)�on�calls�and�SMS�from�25%�to�15%,�to�realign�it�with�the�SCT�applying�to�fixed�telecom�services.�
A�base�case�scenario�was�created�which�projects�market�development�and�tax�revenue�collection�for�the�years�2012�to�2016,�assuming�the�application�of�the�current�taxation�structure.�A�number�of�assumptions�based�on�discussions�with�the�MNOs,�general�market�experience�and�external�market�projections�from�third�parties�were�used�to�simulate�the�evolution�of�the�main�market�variables�
(e.g.�number�of�subscribers,�usage�levels�and�prices)�in�the�base�case�scenario.18�The�effects�of�the�tax�reductions�were�then�measured�relatively�to�this�counterfactual�scenario.�
The�simulation�is�constructed�to�carry�out�a�number�of�distinct�steps�of�analysis�which�are�then�aggregated�to�provide�the�total�impact�of�taxation�on�the�key�market�variables,�including�on�government�revenues,�as�summarised�in�Figure�49.�
Figure�49:�Methodology�of�the�simulation�
�
Source:�Deloitte�
The�starting�point�of�the�model�is�given�by�a�set�of�macroeconomic�inputs�(such�as�Turkish�GDP�and�population)�and�a�number�of�key�variables�related�to�the�Turkish�mobile�market�(mobile�and�3G�penetration,�handset�sales,�usage�per�capita,�handset,�usage�and�subscription�prices).��
A�retail�price�change�is�triggered�when�a�tax�reduction�is�applied.�Following�the�price�changes,�the�model�employs�a�set�of�consumer�demand�elasticities�in�order�to�establish�how�the�major�market�variables�are�impacted.�Finally,�the�overall�effect�on�government�revenues�is�estimated�as�shown�in�Figure�50.�
������������������������������������������������������������18 For details on the construction of the base case scenario, see Appendix C.2.3.
Direct impact
Wider economic
impact
Elasticity of demand
• GDP• Population
• Mobile penetration• 3G penetration• Handset sales• Usage per capita (calls, SMS, data)• Handsets prices• Usage prices (calls, SMS, data)• Subscription prices
• Elimination of the subscription charges on data only SIM cards
• Partial reduction of the initial subscription charges on all other SIM cards
• Reduction of the Special Communications Tax
• Change in SIM price
• Change in usage price
• Mobile penetration
• 3G penetration
• Handset sales
• Usage per capita
• Total usage
Inputs Tax change Price change resulting from the tax change
Other impacted variables
Effect on government
revenues

�
©�2012�Deloitte�LLP. 42
Figure�50:�Direct�and�indirect�effects�on�government�tax�revenues�
�
Source:�Deloitte�
The�direct�impact�on�government�tax�revenues�is�the�outcome�of�two�components:��
� Taxes�collected�by�the�government�on�each�unit�that�is�affected�by�the�tax�reduction�will�be�at�a�lower�per�unit�rate,�therefore�reducing�taxation�per�unit.�
� Volumes�of�handsets�sales�and�total�usage�increase�as�a�result�of�the�tax�reduction.�
When�considering�taxation�reductions�on�mobile�telephony�services,�a�key�factor�to�take�into�account�is�the�beneficial�indirect�impacts�that�such�reductions�would�trigger.�These�indirect�impacts�are�mainly�driven�by�additional�taxes�that�the�government�collects�as�a�result�of�increased�economic�activities�that�are�generated�by�improved�mobile�penetration�and�mobile�usage.�There�is�a�well�documented�positive�relationship�between�increases�in�mobile�penetration�and�mobile�usage�and�GDP�growth�rates,�due�to�the�beneficial�effects�on�the�economy�and�on�its�productivity�as�discussed�earlier�in�this�study.�These�effects�are�simulated�based�on�the�results�of�econometric�
studies19�and�the�government�tax�receipts�resulting�from�this�additional�economic�growth�are�accounted�for�in�the�results.�
������������������������������������������������������������19 Waverman, Leonard, Meloria Meschi, and Melvyn Fuss (2005). “The Impact of Telecoms on Economic Growth in
Developing markets”.
Tax reductions on mobile telephony services would lead to increases in mobile and 3G penetration and to increases in total mobile usage This generates a number of positive impacts onthe economy:�•� Evidence shows that increases in mobile penetration lead to
increases in GDP per capita growth. A 10% increase in penetration leads to a 0.6% increase in GDP per capita growth rates in developed markets
•� In addition, evidence shows that increases in smartphonepenetration , for a given level of mobile penetration, increase GDP per capita growth
•� These economy-�wide effects generate additional tax revenuesfor the government
? : In relation to the tax reduced, the government experiences a decrease in tax revenue per unit
? : In relation to all other taxes, the government benefits from a wider taxation base as a consequence of increased subscribers and volumes per subscriber
? : Increase in corporation tax and treasury share due to higher MNO revenues
Directimpact�
Widereconomic
impact�
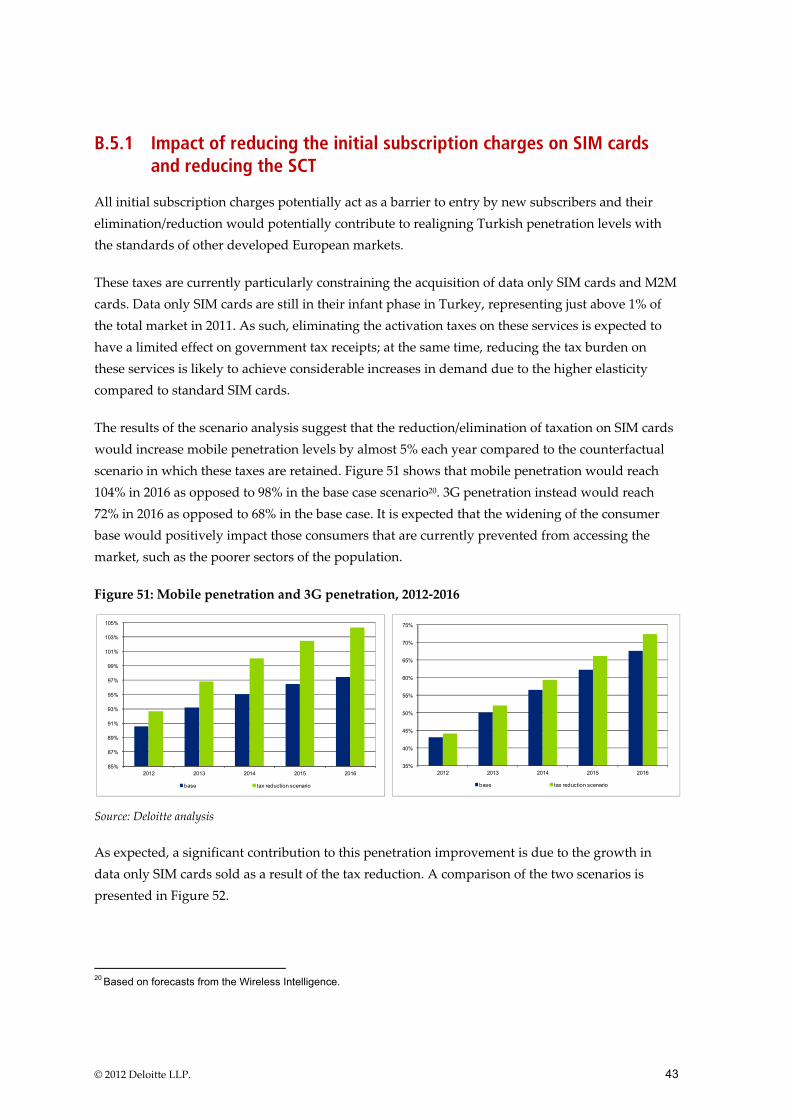
�
©�2012�Deloitte�LLP. 43
B.5.1 Impact of reducing the initial subscription charges on SIM cards and reducing the SCT
All�initial�subscription�charges�potentially�act�as�a�barrier�to�entry�by�new�subscribers�and�their�elimination/reduction�would�potentially�contribute�to�realigning�Turkish�penetration�levels�with�the�standards�of�other�developed�European�markets.��
These�taxes�are�currently�particularly�constraining�the�acquisition�of�data�only�SIM�cards�and�M2M�cards.�Data�only�SIM�cards�are�still�in�their�infant�phase�in�Turkey,�representing�just�above�1%�of�the�total�market�in�2011.�As�such,�eliminating�the�activation�taxes�on�these�services�is�expected�to�have�a�limited�effect�on�government�tax�receipts;�at�the�same�time,�reducing�the�tax�burden�on�these�services�is�likely�to�achieve�considerable�increases�in�demand�due�to�the�higher�elasticity�compared�to�standard�SIM�cards.��
The�results�of�the�scenario�analysis�suggest�that�the�reduction/elimination�of�taxation�on�SIM�cards�would�increase�mobile�penetration�levels�by�almost�5%�each�year�compared�to�the�counterfactual�scenario�in�which�these�taxes�are�retained.�Figure�51�shows�that�mobile�penetration�would�reach�104%�in�2016�as�opposed�to�98%�in�the�base�case�scenario20.�3G�penetration�instead�would�reach�72%�in�2016�as�opposed�to�68%�in�the�base�case.�It�is�expected�that�the�widening�of�the�consumer�base�would�positively�impact�those�consumers�that�are�currently�prevented�from�accessing�the�market,�such�as�the�poorer�sectors�of�the�population.�
Figure�51:�Mobile�penetration�and�3G�penetration,�2012�2016�
�
Source:�Deloitte�analysis�
As�expected,�a�significant�contribution�to�this�penetration�improvement�is�due�to�the�growth�in�data�only�SIM�cards�sold�as�a�result�of�the�tax�reduction.�A�comparison�of�the�two�scenarios�is�presented�in�Figure�52.�
������������������������������������������������������������20 Based on forecasts from the Wireless Intelligence.
35%
40%
45%
50%
55%
60%
65%
70%
75%
2012 2013 2014 2015 2016
base tax reduction scenario
85%
87%
89%
91%
93%
95%
97%
99%
101%
103%
105%
2012 2013 2014 2015 2016
base tax reduction scenario

�
©�2012�Deloitte�LLP. 44
Figure�52:�Sales�of�data�only�SIM�cards,�2012�2016�
�
Source:�Deloitte�analysis�
The�increased�number�of�subscribers�entering�the�market�would�also�contribute�to�expanding�the�sales�volumes�of�handsets,�tablets,�dongles�and�other�devices�for�the�use�of�data�only�SIM�cards.�While�tablets,�dongles�and�other�M2M�devices�have�not�been�explicitly�considered�in�this�simulation,�the�increases�in�the�sales�of�feature�phones�and�smartphones�would�be�respectively�on�average�10%�and�7%�higher�under�the�simulated�scenario.�This�is�reported�in�Figure�53.�
Figure�53:�Sales�of�feature�phones�and�sales�of�smartphones,�2012�2016�
�
Source:�Deloitte�analysis�
A�further�benefit�of�the�increased�number�of�3G�subscribers�under�the�simulated�scenario�would�be�wider�internet�usage.�In�order�to�estimate�the�change�in�total�internet�usage,�a�detailed�account�was�taken�for�the�differences�in�data�usage�per�capita�between�data�only�SIM�cards�–which�are�expected�to�attract�a�higher�level�of�usage�per�capita��and�all�other�SIM�cards.�The�results�suggest�a�5%�increase�in�total�data�usage�per�annum�over�the�base�case,�indicating�a�substantially�improved�access�to�mobile�internet.�
0
500,000
1,000,000
1,500,000
2,000,000
2,500,000
2012 2013 2014 2015 2016
base tax reduction scenario
4,000,000
6,000,000
8,000,000
10,000,000
12,000,000
14,000,000
16,000,000
18,000,000
20,000,000
22,000,000
2012 2013 2014 2015 2016
base tax reduction scenario
4,000,000
4,500,000
5,000,000
5,500,000
6,000,000
6,500,000
7,000,000
7,500,000
8,000,000
8,500,000
2012 2013 2014 2015 2016
base tax reduction scenario

�
©�2012�Deloitte�LLP. 45
Figure�54:�Total�data�usage,�Mb�billions�
�
Source:�Deloitte�analysis�
In�addition�to�the�total�usage�increases�due�to�penetration�growth,�the�reduction�in�the�SCT�is�expected�to�generate�higher�minutes�of�use�and�SMS�per�user,�leading�to�a�further�total�usage�increase.�
Figure�55:�Total�minutes�of�use�(billions)�and�total�SMS�(billions),�2012�2016�
�
Source:�Deloitte�analysis�
The�overall�analysis,�whilst�only�indicative,�suggests�that�the�mobile�market�would�grow�as�a�result�of�the�change��in�taxation�policy:�this�would�have�a�beneficial�effect�on�the�economy�and�on�government’s�tax�receipts.�Despite�an�initial�decrease�in�government’s�revenues�(due�to�the�reduction�is�taxation),�the�increased�penetration�and�usage�indicated�by�the�analysis�would�more�than�compensate�the�initial�effect�and�lead�to�an�increase�in�government�revenues�four�years�after�the�introduction�of�the�policy�change.�The�effects�could�further�be�boosted�by�the�additional�investment�and�employment�that�MNOs�could�generate�in�response�to�increases�revenues�and�EBITDA�resulting�from�market�growth,�which�are�not�explicitly�accounted�for�in�this�simulation.�Figure�56�shows�that�government�receipt�from�mobile�specific�and�general�taxation�would�be�higher�in�2015�and�thereafter�under�the�tax�reduction�scenario.�Higher�mobile�and�3G�penetration�would�contribute�to�an�increase�in�the�GDP�growth�rate.�This�indirect�effect,�combined�with�higher�mobile�service�usage,�is�expected�to�deliver�a�positive�tax�outcome�in�the�medium�term.�
500
700
900
1,100
1,300
1,500
1,700
1,900
2,100
2012 2013 2014 2015 2016
base tax reduction scenario
180
185
190
195
200
205
210
215
220
2012 2013 2014 2015 2016
base tax reduction scenario
130
135
140
145
150
155
160
165
2012 2013 2014 2015 2016
base tax reduction scenario

�
©�2012�Deloitte�LLP. 46
�
Figure�56:�Government�tax�revenues,�2012�2016,�TRY�millions�
�
Source:�Deloitte�analysis�
�
16,000
17,000
18,000
19,000
20,000
21,000
22,000
23,000
24,000
25,000
2012 2013 2014 2015 2016
base tax reduction scenario

�
©�2012�Deloitte�LLP. 47
Appendix C Methodology and assumptions
This�section�outlines�the�approach�taken�in�estimating�the�economic�contributions�of�the�mobile�industry�to�the�Turkish�economy.�
C.1 Estimation of the economic impact of mobile telephony
C.1.1 Static analysis
Static�analysis�refers�to�the�impact�of�mobile�services�for�a�particular�period�of�time�and�does�not�seek�to�estimate�the�longer�term�impacts�on�economic�welfare.��However,�static�analysis�is�extremely�useful�due�to�the�greater�availability�of�disaggregated�data�relative�to�dynamic�analysis�where�a�greater�number�of�assumptions�are�typically�required.���
Publicly�available�data�and�operator�data�were�employed�together�with�interviews�and�assumptions�based�on�economic�literature�to�estimate�the�value�of�the�mobile�communications�to�the�economy�in�terms�of�employment�and�GDP,�both�direct�and�indirect.�The�total�economic�impact�is�defined�as�consisting�of�the�following�elements:21��
� The�direct�impact�from�the�MNOs.�
� The�indirect�impact�from�other�industries�related�to�mobile�services.�
� The�indirect�impact�due�to�the�surplus�enjoyed�by�end�users�in�terms�of�productivity�improvements.�
� The�indirect�impact�due�to�more�qualitative�social�benefits�enjoyed�by�the�population,�referred�to�as�‘intangible�benefits’.�
The�static�analysis�has�been�structured�as�illustrated�by�the�following�figure.��The�different�impacts�are�summed�together�to�give�the�total�economic�impact.22�
������������������������������������������������������������21 The approach adopted is consistent with that adopted across the economic literature, see for example: Mckinsey & Co.
Wireless Unbound. September 2006. The surprising economic value and untapped potential of the mobile phone.22 To obtain the total economic impact, it is necessary to sum together the supply side, demand side and intangible impacts.
Whilst these are intended to capture different impacts of mobile telephony, there is a potential for limited double counting.

�
©�2012�Deloitte�LLP. 48
Figure�57:�Structure�of�the�analysis�of�economic�impact�on�GDP�and�employment�
�Source:�Deloitte�
The�methodology�estimates�the�contribution�of�the�sector�on�the�basis�of�a�wider�definition�than�that�commonly�cited�in�national�accounts.��The�adopted�definition�captures�the�‘economic�footprint’�of�the�mobile�sector.�
Figure�58:�This�methodology�and�national�accounts�
�Source:�Deloitte�
C.1.1.1 Supply�side�impact�
The�contribution�of�the�mobile�industry�to�the�economy�was�quantified,�covering�the�industry�and�its�adjacent�sectors.��This�is�calculated�by�aggregating�the�direct,�indirect�and�economy�wide�(multiplier)�effects�that�have�occurred�in�each�year.���
Mobile Operators�
Related Industries ImprovedProductivity Social Benefit
General Economy
Value chain quantification
Estimation based on research and
interview
Estimation based on willingness to pay
analysis
Supply Side Impact
Direct
Indirect
Multiplier�
Analysis�
Estimation of other potential benefits
Demand Side Impact
Intangible Impact
Social benefits�
Productivity increases
Indirect supply side
National Accounts�

�
©�2012�Deloitte�LLP. 49
Figure�59:�Structure�of�the�supply�side�analysis�
�Source:�Deloitte�
This�gives�a�snapshot�view�but�does�not�take�into�account�the�future�benefits�to�the�economy�resulting�from�growth.��A�customer’s�spending�on�mobile�services�flows�along�the�value�chain�to�the�players�within�the�industry:�MNOs,�suppliers,�distributors�and�others.��Money�flows�between�these�economic�agents�and�the�amounts�retained�are�used�to�pay�for�wages,�taxes,�buy�inputs�and�other�costs.��Finally,�the�government�collects�tax�revenues�from�all�MNOs�within�its�jurisdiction.��In�this�assessment,�the�focus�is�limited�to�the�economy�of�the�country�in�question�and�ignores�international�impacts.���
Each�of�the�main�stakeholders�in�the�industry�has�been�identified.�Flows�of�value�between�stakeholders�are�shown�in�the�diagram�below.���
Figure�60:�Mobile�value�chain�
�
Source:�Deloitte�
Estimates�of�the�flows�are�based�on:�
Direct impact from MNOs�
Indirect impact from related industries
Economic multiplier
Total annual supply side impact
Direct impact from MNOs�
Indirect impact from related industries
Economic multiplier
Total annual supply side impact
Mobile network operators(VA)�
Fixed line operators�
(VA)
Network equipmentsuppliers
(VA)
End Users�
Airtime and SIM sellers
(VA)
Payment for mobile services & connectionsPayment for handsets
Fixed lineoperators�
(VA)
Fixed to mobile calls�
Interconnection payments
Handset importers,dealers & retailers
(VA)
Othersuppliers ofcapital items
(VA)
Suppliers ofsupportservices�
(VA)
Government tax revenue
Multiplier
Manufacturersubsidy

�
©�2012�Deloitte�LLP. 50
� discussions�with�MNOs�
� interviews�with�local�market�experts,�handset�and�airtime�dealers�
� analysis�of�government�taxation�statistics�
� analysis�of�accounts�and�billing�information.�
Following�the�identification�of�the�revenue�flows,�the�proportion�of�these�flows�that�remains�within�the�domestic�economy�was�estimated�and�are�translated�into�a�positive�economic�benefit,�referred�to�in�this�report�as�‘value�add’.�
C.1.1.2 Direct value add from MNOs
Five�categories�of�economic�value�which�are�directly�created�by�the�MNOs�have�been�determined:�
� wages�and�employee�benefits�
� contractor�costs�
� taxes�and�regulatory�fees�
� corporate�social�responsibility�
� dividends.�
For�each�of�these�categories,�the�proportion�of�value�add�which�relates�to�the�domestic�economy�was�identified.��This�analysis�is�based�upon�MNO�management�accounts�interviewing�which�identify�the�final�destination�of�monetary�flows.�
C.1.1.3 Indirect value add
The�revenues�that�flow�directly�from�the�MNOs�to�other�domestic�industry�players�have�been�identified.��The�proportion�of�revenues�that�are�value�add�was�then�estimated,�using�the�five�categories�of�value�add�used�in�the�mobile�network�operator�analysis�above.��These�proportions�for�each�country�are�outlined�in�C.1.5.�
C.1.1.4 The multiplier
The�value�add�created�by�the�mobile�communications�industry�will�have�a�subsequent�positive�impact�on�the�economy.��These�effects�are�generated�by�further�rounds�of�expenditure.��For�example,�the�indirect�domestic�industry�players�will�additionally�incur�operating�expenses�which�are�paid�to�additional�players.��These�players�will�then�create�value�as�they�pay�wages�and�taxes�etc.��The�economic�literature�quantifies�these�effects�by�applying�an�’economic�multiplier’�to�the�

�
©�2012�Deloitte�LLP. 51
initial�rounds�of�value�generated.��The�table�below�shows�the�values�of�multipliers�that�have�been�calculated�in�other�studies.���
Figure�61:�Multiplier�benchmarks�
Title�of�study� Multiplier�
The�contribution�of�mobile�phones�to�the�UK�economy�(2002),�O2�for�ONS� 1.13�
Ovum�studies�on�economic�impact�of�mobile�telephony�in�Bangladesh�and�USA�based�on�review�of�various�other�studies*�
1.6�
Association�Française�des�Opérateurs�Mobiles� 1.7�
Economic�impact�of�spectrum�use�in�the�UK,�Europe�economics,�based�on�ONS� 1.1�
Sicrana,�R.,�and�de�Bonis,�R.�‘The�Multiplier�Effects�of�Telecommunications�Investments�on�Economic�Growth�and�Restructuring’.�
1.5�
Radio�authority�UK�1995.�‘Economic�impact�of�radio’.� 1.4�
Deloitte�for�Telenor�2008.�‘Economic�Impact�of�mobile�telephony�in�Ukraine,�Malaysia,�Thailand,�Ukraine�and�Pakistan’.�
1.2���1.4�
Deloitte�for�Telenor�2008.�‘Economic�Impact�of�mobile�telephony�in�Serbia’� 1.3�
Zain/Ericsson�2009.�‘Economic�impact�of�Mobile�Communications�in�Sudan’� 1.2�
Aloyce�R.�Kaliba�et�al�2004�multiplier�estimates�‘Multipliers�for�Tanzania:�implications�on�developing�poverty�reduction�programs’�(transport�and�communication�multiplier�estimate)��
1.63�
Deloitte/GSMA�2011.�‘Mobile�telephony�and�taxation�in�Croatia’�� 1.3�
Deloitte/GSMA�2011.�‘Mobile�telephony�and�taxation�in�Kenya’�� 1.2�
Deloitte/GSMA�2011.�‘Mobile�telephony�and�taxation�in�Bangladesh’�� 1.4�
Source:�Deloitte�
An�economic�multiplier�of�1.4�was�utilised�to�estimate�the�‘knock�on’�impact�on�the�rest�of�the�economy�of�the�direct�and�indirect�effects�of�mobile�telephony�on�GDP�and�employment.�This�was�assumed�following�a�literature�review,�considering�a�benchmark�used�for�countries�in�the�region�with�similar�characteristics�for�previous�studies,�and�using�the�data�provided�by�MNOs�about�the�proportion�of�expenditure�by�key�players�which�remains�in�Turkey.��
C.1.1.5 Calculating tax revenues
Government�tax�revenues�are�raised�through�taxes�specific�to�mobile�services,�corporation�tax,�income�tax�and�regulatory�fees.��Tax�revenues�are�collected�from�all�components�in�the�value�chain.�

�
©�2012�Deloitte�LLP. 52
Based�on�interviews�with�the�main�parties,�assumptions�were�made�on�the�percentage�of�money�flows�that�are�subject�to�the�national�tax�regime.23�
Information�on�revenues�for�various�taxes�was�collected�as�follows:��
� economy�wide�taxes:�value�added�(sales)�taxes,�corporate�taxes�and�income�tax�paid�by�employees�
� mobile�taxes:�licence,�spectrum�and�other�regulatory�fees,�plus�all�mobile�specific�taxes�peculiar�to�the�Turkish�tax�system.�
Tax�revenues�were�calculated�directly�from�the�MNOs�and�also�from�other�entities�in�the�value�chain.�
C.1.2 Calculating the impact on employment
Mobile�services�contribute�to�employment�via�several�avenues:�
� direct�employment�of�the�industry�and�related�industries�
� support�employment�created�by�outsourced�work�and�taxes�that�the�government�subsequently�spends�on�employment�generating�activities�
� induced�employment�resulting�from�the�above�employees�and�beneficiaries�spending�their�earnings,�and�creating�more�employment.�
The�first�impact�was�partly�estimated�directly�by�collecting�data�from�the�MNOs.�For�the�related�industries,�a�combination�of�two�methods�was�employed:�information�from�interviews�with�the�MNOs�was�given�priority.�Whenever�direct�information�was�missing,�employment�in�related�industries�was�calculated�by�dividing�the�proportion�of�revenue�spent�on�wages�by�the�average�wage�rate�in�the�sector.��Finally,�support�and�induced�employment�was�estimated�using�a�multiplier:�other�studies�have�used�a�ratio�of�1.1�to�1.7�for�induced�employment.��The�use�of�such�multipliers�can�often�be�criticised�for�the�lack�of�consideration�of�the�economic�basis�of�the�industry�and�country�that�are�the�object�of�the�study.��Discussions�with�stakeholders�were�conducted�on�this�issue�and�it�was�chosen�to�apply�a�multiplier�of�1.4�on�all�value�add�including�employment.��
C.1.3 Increases in productivity
Significant�economic�and�social�research�was�undertaken�in�the�last�ten�years�on�the�numerous�ways�in�which�mobile�services�can�improve�productivity,�including�in�more�developed�markets�
������������������������������������������������������������23 Following interviews with the main parties, only a limited degree of leakage from the informal sector has been assumed.

�
©�2012�Deloitte�LLP. 53
such�as�Turkey.�Several�important�effects�have�been�identified�in�the�research�in�the�last�years.�These�are�presented�here�for�general�review�and�include:��
� Improving�information�flows:�mobile�services�allow�workers�in�certain�occupations�to�cut�out�the�middle�man,�e.g.�traders�can�obtain�information�on�prices,�quality,�and�quantities�directly.��This�improves�the�incomes�of�producers,�and�helps�reduce�wastage.�
� Reducing�travel�time�and�costs:�mobile�services�allow�workers�to�trade�and�share�information�without�travelling.�
� Improving�efficiency�of�mobile�workers:�mobile�services�improve�the�efficiency�of�all�workers�in�the�economy.�This�effect�will�particularly�be�felt�by�workers�with�unpredictable�schedules,�for�example�those�involved�in�repair�and�maintenance,�or�collection�and�delivery.��Mobile�phones�will�give�them�greater�accessibility�and�better�knowledge�of�demand.�
� Improving�job�search:�mobile�services�improve�the�chances�of�the�unemployed�finding�employment�by�enabling�people�to�call�for�opportunities�rather�than�relying�on�word�of�mouth.��Further�to�this,�owning�a�mobile�phone�makes�workers�more�employable�as�they�are�contactable�while�absent�from�their�place�of�work.�
� Encouraging� entrepreneurialism:� mobile� phones� have� encouraged� the� growth� of� small�business�and�has�increased�their�efficiency.�
� Data�and�smartphone�proliferation�amplifies�these�effects�and�gives�access�to�applications�and�email.�
No�established�economic�methodology�exists�to�estimate�the�GDP�and�employment�effects�of�such�productivity�improvements�across�the�economy.��As�such,�available�evidence�from�the�literature�in�this�area�was�considered�and�interviews�with�stakeholders�have�been�undertaken�in�order�to�provide�an�indication�of�the�demand�side�impact�of�mobile�communications.���
The�impact�of�the�productivity�improvements�on�the�overall�economy�is�estimated�by�assuming�that�the�productivity�improvement�will�be�experienced�by�high�mobility�employees�within�the�economy.��In�line�with�similar�studies24,�high�mobility�workers�are�defined�as�those�workers�who�undertake�a�moderate�to�high�degree�of�travel�in�the�course�of�their�employment,�e.g.�taxi�drivers,�salesmen�and�transport�workers.��The�proportion�of�high�mobility�workers�was�calculated�by�referring�to�data�from�the�national�bureau�of�statistics�and�international�labour�databases.��The�productivity�gain�of�high�mobility�workers�with�access�to�mobile�phones�was�estimated�by�
������������������������������������������������������������24 Examples include: McKinsey & Co. Wireless Unbound. September 2006. The surprising economic value and untapped
potential of the mobile phone.

�
©�2012�Deloitte�LLP. 54
undertaking�interviews�to�identify�the�impacts�seen�in�each�country�and�by�referring�to�previous�studies.�
The�process�for�calculating�the�impact�of�the�productivity�improvements�on�the�economy�is�set�out�in�the�figure�below.���
Figure�62:�Calculation�of�economic�impact�of�productivity�improvements�
�
Source:�Deloitte��
C.1.4 Intangible benefits
Finally,�the�intangible�impact�of�the�mobile�industry�was�identified.��Information�provided�during�interviews�with�MNOs�in�Turkey�was�utilised;�additional�findings�from�other�economic�impact�reports�were�drawn�upon�and�extended.���
As�with�productivity,�economic�and�social�research�was�undertaken�in�the�last�ten�years�on�the�numerous�ways�in�which�mobile�services�can�promote�intangible�benefits.�These�are�presented�here�for�general�review�and�include:��
� Promoting�social�cohesion:�through�enabling�contact�with�family�members�or�friends�who�have�moved�away,�and�building�trust�through�sharing�of�handsets�(which�has�been�found�to�be�common�in�developing�countries).��In�addition,�a�number�of�studies�found�a�statistically�robust�relationship�between�mobile�ownership�and�willingness�to�help�others�in�the�community.�
� Extension�of�communications:�especially�to�users�with�low�education�and�literacy.�
=
Total productivity increase
Key:InputCalculation
Total workforce% of workers who
would use their mobilefor business purposes
Average GDP contribution permobile worker
% of workforce able touse mobile
communications
Average productivity increase
Output of workers thatwould use mobilecommunications
Total output of workersusing mobile
communications
X X
X
X=
=

�
©�2012�Deloitte�LLP. 55
� Stimulating�local�content:�this�can�be�particularly�useful�for�allowing�users�to�learn�about�local�services�such�as�healthcare�or�education.��
� Assisting�in�disaster�relief:�mobile�services�allow�families�and�friends�to�stay�in�touch�in�the�event�of�a�natural�disaster,�which�can�also�ensure�that�they�obtain�more�rapid�relief.�
Whilst�it�is�difficult�to�assign�a�specific�value�to�these�benefits�in�terms�of�contribution�to�GDP�or�employment,�it�is�clear�that�many�of�these�social�and�educational�benefits�could�make�people�happier,�healthier�and�more�motivated�and�hence�more�employable�and�able�to�contribute�to�GDP.��One�method�for�estimating�a�value�using�actual�data�is�the�willingness�to�pay�concept.25��This�seeks�to�calculate�the�increase�in�consumer�surplus�that�results�from�a�change�in�the�price�of�a�good.�
Figure�63:�Increase�in�consumer�surplus�following�a�reduction�in�price�
�
�
�
��
�
�
�
�
�Source:�Deloitte�
The�willingness�to�pay�concept�was�used�to�calculate�the�value�of�the�intangible�benefits�of�mobile�phones�in�this�study.26��Historical�minutes�of�use�(‘MOU’)�per�user�and�average�price�per�minute�show�how�much�customers�are�willing�to�pay�for�mobile�services.��If�it�is�assumed�that�these�intangible�benefits�of�owning�a�mobile�phone�are�unchanged�over�time,�then�the�value�for�this�form�of�consumer�surplus�can�be�considered�to�be�the�difference�between�price�per�minute�at�the�time�of�subscription,�less�price�per�minute�today�(which�is�likely�to�be�less�due�to�increased�competition�and�other�factors).��Total�consumer�surplus�is�then�the�difference�in�price�per�minute�multiplied�by�the�total�minutes�of�use�at�the�old�price.��
������������������������������������������������������������25 See: Mckinsey & Co. Wireless Unbound. September 2006. The surprising economic value and untapped potential of the
mobile phone.26 There is a potential for double counting between the productivity improvement and the intangible impact.
�
Quantity of mobile subscribers
ARPU�
2010
2011
20112010�
D=(p)D=f(p)

�
©�2012�Deloitte�LLP. 56
There�are�numerous�reasons�why�these�estimates�could�underestimate�or�overestimate�the�true�value�of�intangible�benefits.�This�methodology�assumes�that�all�subscribers�joined�the�network�in�2007:�this�allows�estimating�only�the�consumer�surplus�enjoyed�by�customers�that�joined�the�network�from�2008�onward,�leading�to�an�underestimation�of�the�true�consumer�surplus.�On�the�other�hand,�the�methodology�does�not�account�for�potential�changes�in�the�willingness�to�pay�of�consumers�over�time.�The�effect�of�this�on�the�overall�calculation�depends�on�whether�the�true�willingness�to�pay�has�increased�or�decreased�over�time.�
C.1.5 Data limitations and detailed assumptions
Assumptions�used�in�the�economic�impact�assessment�
Assumption� Value�
Employment�levels�
Direct�employment�by�MNOs�
Data�was�obtained�directly�from�Turkcell�and�Vodafone,�while�estimates�were�used�for�Avea�based�on�publicly�available�information,�including�market�shares.�
Indirect�employment�
Employment� figures� for� most� segments� of� the� value� chain� were� estimated� based� on�discussions�with�MNOs.�However,�employment�figures�for�some�segments�were�estimated�as�revenue� inflow� multiplied� by� wages� as� percentage� of� revenue� divided� by� average� wage.��Wages�as�percentage�of� revenue�was�estimated�based�on�discussions�with�MNOs.� �Average�wage�was�estimated�by�using�assumptions�on�operator�wage�and�average�wage�in�Turkey.���
For�airtime�employment,�interviews�with�MNOs’�staff�identified�the�number�of�points�of�sale�and� distributors� by� type.� Based� on� interviews,� an� appropriate� level� of� employment� was�assumed�for�each�type.�
A�multiplier�of�1.4�was�applied�to�indirect�levels�to�gauge�the�total�employment�effect�in�the�economy.� No� multiplier� was� applied� to� direct� MNO� employment� as� a� large� amount� of�employment�will�already�be�captured�by�the�first�round�flows.�

�
©�2012�Deloitte�LLP. 57
Assumption� Value�
Value�add�margins�for�each�segment�of�the�value�chain�
Value�add�margins�are�the�total�percentage�of�revenue��spent�domestically�on�(i)�sales,�import,�income,�corporate�and�regulatory�taxes;�(ii)�wages;�(iii)�CSR;��and�(iv)�profit.���
Direct�value�add�of�MNOs�
All�data�was�obtained�directly�from�MNOs�
Indirect�value�add��
These�percentages�are�estimated�based�on�interviews�and�a�review�of�accounts�of�companies�in�Turkey.��The�value�add�margins�used�for�the�supply�chain�are�as�follows:�
Margin�on�domestic�revenues %�value�add�margin��
Fixed�telecommunications�operators� 66%�
Network�equipment�suppliers� 85%�
Handset�producers�and�dealers� 99%�
Other�suppliers�of�capital�items� 54%�
Suppliers�of�support�services� 70%�
Airtime,�SIM�and�commission� 80%��
Airtime�commission�
Commissions�data�was�based�on�interviews�with�MNOs.�
Handsets� Handset�prices,�percentage�of�handsets�sold�by�MNOs,�proportion�of�illegal�and�second�hand�sales�were�estimated�based�on�interviews�and�estimates�from�MNOs.���
Productivity�improvement�
An�annual�productivity� improvement�of�5%�for�high�mobility�workers� is�assumed�based�on�interviews�and�a�review�of�similar�studies.�
The� estimate� of� the� percentage� of� high� mobility� workers� in� each� employment� activity� is�provided�below.�
Employment�by�sector� 2008� 2009� 2010� 2011�%�of�high�mobility��
Agriculture�and�Forestry�� 5,016,000� 5,254,000� 5,579,211� 5,949,167� 25%�Mining�and�Quarrying� 115,000� 103,000� 109,375� 116,628� 25%�Manufacturing� 4,235,000� 3,949,000� 4,193,435� 4,471,500� 25%�Electricity�and�Water� 91,000� 78,000� 82,828� 88,320� 25%�Building�and�Construction�� 1,241,000� 1,249,000� 1,326,310� 1,414,258� 25%�Wholesale�and�Retail�Trade,�Restaurants�and�Hotels� 4,573,000� 4,542,000� 4,823,140� 5,142,961� 50%�Transport�and�Communications�� 1,089,000� 1,081,000� 1,147,912� 1,224,029� 75%�Finance,�Insurance,�Real�Estate�and�Business�services� 1,169,000� 1,339,000� 1,412,881� 1,516,166� 75%�Community,�Social�and�Personal�Services�� 3,664,000� 3,682,000� 3,909,908� 4,169,172� 35%�Average�high�mobility� � � � � 38%�
�

�
©�2012�Deloitte�LLP. 58
Assumption� Value�
Employment� information� for� 2008�2011� was� obtained� from� the� national� statistics� office.�Percentages�of�workers�who�are�high�mobility�are�Deloitte�assumptions�based�on�benchmarks�from�previous�studies�and�experience.�Average�high�mobility�is�a�weighted�average.�
The�GDP�contribution�of� these�workers� is�estimated�by�calculating�the� total�GDP�relating�to�high�mobility�sectors�and�dividing�by�the�total�number�of�high�mobility�workers.���
Multiplier� A� multiplier� of� 1.4� was� applied� to� supply� side� direct� and� indirect� value� add� in� order� to�capture�the�full�impact�on�the�Turkish�economy.�
This� multiplier� was� selected� following� a� literature� review� and� interviews.� This� choice� is�discussed�in�more�detail�in�Appendix�C.1.1.4.�
�
C.2 Impacts of the reduction of mobile specific taxes
This�section�describes�the�methodology�and�assumptions�used�to�simulate�the�impact�that�a�reduction�in�mobile�specific�taxation�in�Turkey�might�have�on�government�revenues�and�on�a�number�of�key�indicators�such�as�mobile�penetration,�3G�penetration,�usage�per�subscriber,�total�usage�and�handset�sales.�
The�simulation�undertaken�investigated�the�combined�impact�of�the�following�changes�to�the�current�taxation�regime�in�Turkey:�
� Elimination�of�the�initial�subscription�charges,�i.e.�the�Wireless�Licence�Fee�(TRY�13.2�in�2011)�and�the�fixed�component�of�the�Special�Communications�Tax�(TRY�34�in�2011)�on�data�only�SIM�cards�in�2012.�
� An�85%�reduction�of�the�Wireless�Licence�Fee�and�the�fixed�component�of�the�Special�Communications�Tax�on�all�other�SIM�cards�in�2012.�
� Reduction�of�the�Special�Communications�Tax�(SCT)�on�calls�and�SMS�from�25%�to�15%,�to�realign�it�with�the�SCT�applying�to�fixed�telecom�services.�
A�simulation�model�has�been�developed�in�order�to�provide�an�estimation�of�the�impact�of�each�tax�reduction.�A�base�case�scenario�was�created�which�simulates�market�development�and�tax�revenue�collection�for�years�2012�to�2016,�assuming�the�application�of�the�current�taxation�structure.�A�number�of�assumptions�based�on�discussions�with�MNOs,�general�market�experience�and�external�market�projections�from�third�parties�were�used�as�a�basis�to�simulate�how�the�main�market�variables�(e.g.�number�of�subscribers,�usage�levels�and�prices)�evolve�in�the�base�case�scenario.�The�effects�of�the�tax�reductions�were�then�measured�relative�to�this�base�case�scenario.�

�
©�2012�Deloitte�LLP. 59
The�simulation�model�is�constructed�to�carry�out�a�number�of�distinct�steps�of�analysis�which�are�then�aggregated�to�provide�the�total�impact�of�taxation�on�the�key�market�variables,�including�on�government�revenues,�as�shown�in�Figure�64.�
Figure�64:�Tax�reduction�simulation�methodology�
�
Source:�Deloitte�
The�starting�point�of�the�model�is�given�by�a�set�of�macroeconomic�inputs�(such�as�Turkish�GDP�and�population)�and�a�number�of�key�variables�related�to�the�Turkish�mobile�market�(mobile�and�3G�penetration,�handset�sales,�usage�per�capita,�handset,�usage�and�subscription�prices).��
A�retail�price�change�is�triggered�when�a�tax�reduction�is�applied.�Following�the�price�changes,�the�model�employs�a�set�of�consumer�demand�elasticities�in�order�to�establish�how�the�major�market�variables�are�impacted.�Finally,�the�overall�effect�on�government�revenues�is�estimated�as�outlined�in�section�C.2.2.�
The�following�sections�present�the�details�of�this�approach.�
C.2.1 Introduction of a tax reduction
A�change�in�taxation�policy�is�simulated�starting�from�2012.�This�is�the�element�characterising�the�difference�between�the�base�case�scenario�(a�scenario�where�all�market�variables�behave�as�if�the�tax�is�retained)�and�the�alternative�scenario�(in�which�the�tax�is�reduced/eliminated).�
A�tax�reduction�generates�a�number�of�effects�that�have�been�simulated,�including:�
� Effect�on�retail�prices;�
� Effect�on�products�and�services�volumes;�and�
Direct impact
Wider economic
impact
Elasticity of demand
• GDP• Population
• Mobile penetration• 3G penetration• Handset sales• Usage per capita (calls, SMS, data)• Handsets prices• Usage prices (calls, SMS, data)• Subscription prices
• Elimination of the subscription charges on data only SIM cards
• Partial reduction of the initial subscription charges on all other SIM cards
• Reduction of the Special Communications Tax
• Change in SIM price
• Change in usage price
• Mobile penetration
• 3G penetration
• Handset sales
• Usage per capita
• Total usage
Inputs Tax change Price change resulting from the tax change
Other impacted variables
Effect on government
revenues

�
©�2012�Deloitte�LLP. 60
� Effect�on�government�tax�revenues.�
C.2.1.1 Effect on retail prices
The�tax�reduction�is�reflected�in�the�retail�price�of�the�relative�service�(handsets,�usage�or�SIM�cards).��It�was�assumed�that�a�reduction�in�taxation�would�be�fully�reflected�in�the�prices�faced�by�the�final�customers�(rather�than�resulting�in�an�increase�in�corporate�profit�margins).��Where�markets�are�fully�competitive,�economic�theory�suggests�that�prices�should�be�reflective�of�costs,�including�a�normal�return�on�capital�employed.��Thus,�where�markets�are�deemed�to�be�competitive,�a�fall�in�the�tax�rate�should�result�in�an�equivalent,�or�nearly�equivalent,�fall�in�retail�prices.27�In�Turkey�there�are�three�licensed�MNOs,�and�prices�of�telecom�services�have�been�steadily�falling�over�time.�Interviews�conducted�with�the�MNOs�suggested�that�MNOs�actively�place�a�constraint�on�each�other’s�pricing�decisions.�Therefore,�based�on�these�considerations�and�in�light�of�the�approach�that�has�been�taken�in�similar�studies,28�it�was�assumed�that�100%�of�any�change�in�tax�is�reflected�in�the�consumer�price.�
C.2.1.2 Impact on volumes
Following�the�reduction�in�retail�prices,�a�simulation�is�made�of�how�relevant�service�volumes�(handset�sales,�usage�per�capita,�total�usage�and�number�of�mobile�and�3G�subscribers)�are�impacted.�This�is�done�by�employing�a�different�type�of�consumer�price�elasticity�for�each�type�of�product.�The�following�table�presents�the�elasticity�estimations�reported�in�studies�that�are�most�relevant�for�Turkey.���
������������������������������������������������������������27 The exact proportion of the tax decrease that is reflected in consumer prices depends upon the relationship between
consumer and producer surplus. In a perfectly competitive market, price is equal to cost and 100% of the reduction in tax is assumed to be passed through to the consumer. As competition reduces from this level then the percentage passed through to the consumer is also reduced.�
28�For example, see: Frontier Economics (2006). Impact of mobile taxation in Bangladesh.��

�
©�2012�Deloitte�LLP. 61
Table�8:�Elasticity�measures�
Elasticity�of�usage� Source
0.28���0.45�Haucap,�Heimeshoff�and�Karacuka�(2010).�‘Competition�in�the�Turkish�Mobile�Telecommunications�Market:�Price�Elasticities�and�Network�Substitution’.�
Elasticity�of�subscriptions Source
0.2���0.9�
�
0.43�
Grzybowski�(2004),�cited�in�‘The�Economics�of�Taxing�Mobile�Phone�
Usage�in�Turkey’�(Waverman�200829)�
Rodini�(2002)�,�cited�in�‘The�Economics�of�Taxing�Mobile�Phone�Usage�in�Turkey’�(Waverman�2008)�
Source:�Deloitte�literature�review�
Concerning�the�elasticity�of�usage,�the�most�suitable�measure�appears�to�be�the�one�estimated�by�Haucap,�Heimeshoff�and�Karacuka�in�2010.�For�mobile�usage�in�Turkey,�they�find�a�short�term�elasticity�of�0.28�and�a�long�term�elasticity�of�0.45.�Given�the�medium�term�horizon�in�this�tax�impact�model,�a�choice�was�made�to�use�0.4.�
For�the�elasticity�of�subscriptions,�two�studies�(by�Grzybowski�in�2004�and�by�Rodini�in�2002)�appeared�to�be�most�relevant.�Both�were�cited�in�a�previous�study�on�taxation�in�the�mobile�telecommunications�industry�in�Turkey�(Waverman�2008).�An�average�figure�was�computed�for�the�purposes�of�this�model:�an�elasticity�of�0.5�was�therefore�selected�for�subscriptions.�
Finally,�no�specific�study�on�the�elasticity�of�data�only�SIM�cards�was�available.�Given�the�very�initial�stage�of�development�for�this�product,�the�MNOs�suggested�a�higher�elasticity�compared�to�the�one�used�for�standard�of�subscriptions.�For�this�reason,�an�elasticity�of�0.9�was�assumed�for�data�only�SIM�cards�in�the�model.��
C.2.2 Impact on government tax revenues
The�simulated�tax�reduction�leads�to�a�change�in�government�tax�revenues.�In�order�to�estimate�this�variation�one�needs�to�account�for�the�direct�as�well�as�the�indirect�effects�of�the�tax�reduction,�as�shown�in�Figure�65.�
������������������������������������������������������������29 Waverman (2008), 'The economics of taxing mobile phone usage in Turkey'

�
©�2012�Deloitte�LLP. 62
Figure�65�Impact�of�taxation�reductions�on�government�tax�revenue�
�
Source:�Deloitte�
The�direct�impact�has�two�components:��
� Taxes�collected�by�the�government�on�each�unit�that�is�affected�by�the�tax�reduction�will�be�at�a�lower�per�unit�rate,�therefore�reducing�taxation�per�unit.�
� The�user�and�usage�tax�base�increases�as�a�result�of�the�tax�reduction�proportionally�to�the�market�elasticity,�leading�in�this�model�to�higher�volumes�of�handset�sales,�higher�number�of�subscribers,�higher�usage�per�capita�and�higher�total�usage.�
The�indirect�impact�refers�to�a�number�of�induced�effects�on�wider�economic�growth�resulting�from�tax�reductions,�in�particular�due�to�the�beneficial�effects�that�mobile�telephony�generates�in�a�country,�as�noted�in�the�analysis�of�economic�contribution�of�the�industry�in�this�paper.�These�effects�include�the�benefits�to�economic�growth�associated�with�increases�in�penetration�of�mobile�services.�A�2005�study�by�Leonard�Waverman30�found�that�that�a�10%�increase�in�mobile�penetration�yields�an�increase�of�0.6%�in�the�growth�rate�of�GDP�in�developed�markets.�A�study�from�Deloitte31�found�that�this�figure�equated�to�1.2%�for�developing�markets.��
������������������������������������������������������������30 Waverman, Leonard, Meloria Meschi, and Melvyn Fuss (2005). “The Impact of Telecoms on Economic Growth in
Developing markets”. 31 Deloitte (2006), “Global Mobile Tax Review 2006-2007” on behalf of the GSM Association.
Tax reductions on mobile telephony services would lead to increases in mobile and 3G penetration and to increases in totalmobile usage This generates a number of positive impacts onthe economy:�• Evidence shows that increases in mobile penetration lead to
increases in GDP per capita growth. A 10% increase in penetration leads to a 0.6% increase in GDP per capita growth rates in developed markets
• In addition, evidence shows that increases insmartphonepenetration , for a given level of mobile penetration, increase GDP per capita growth
• These economy-�wide effects generate additional tax revenuesfor the government
? : In relation to the tax reduced, the government experiences a decrease in tax revenue per unit
? : In relation to all other taxes, the government benefits from a wider taxation base as a consequence of increased subscribers and volumes per subscriber
? : Increase in corporation tax and treasury share due to higher MNO revenues
Directimpact
Widereconomic
impact

�
©�2012�Deloitte�LLP. 63
These�wider�effects�on�economic�growth�determine�a�higher�level�of�GDP�in�the�scenario�where�the�taxes�are�reduced�compared�to�the�scenario�in�which�taxes�are�assumed�to�remain�unchanged.�This�higher�level�of�economic�activity�will�then�generate�additional�government�revenues�from�general�taxation.�
C.2.3 Specific model inputs and assumptions
The�following�inputs�and�assumptions�specific�to�Turkey�were�made�to�simulate�the�impact�o�tax�reductions.�
Economic�factors:�
� Historic�Turkish�GDP�data�and�GDP�forecasts�were�extracted�from�the�International�Monetary�Fund’s�World�Economic�Outlook�Database.��
� A�general�measure�of�taxation�as�a�percentage�of�GDP�in�Turkey�was�obtained�from�the�CIA�World�Factbook.���
� Population�data�was�extracted�from�the�World�Bank’s�World�Development�Indicators.�Population�was�forecasted�to�grow�at�an�average�1.3%�a�year,�in�line�with�the�trend�experienced�in�the�last�six�years.�
� All�variable�taxes�in�the�base�case�(counterfactual)�scenario�were�assumed�to�remain�the�same�during�2012�2016.�Fixed�taxes�(Wireless�Licence�Fee,�Wireless�Usage�Fee�and�the�fixed�component�of�the�Special�Communications�Tax)�are�assumed�to�grow�over�time�to�reflect�historic�inflation.�
Market�data�and�prices:�
� Mobile�penetration�and�3G�penetration�were�obtained�from�Wireless�Intelligence.�Wireless�Intelligence�also�provides�forecasts:�mobile�penetration�was�assumed�to�grow�during�years�2012�to�2016�by�2.2�percentage�points�on�average�each�year).�3G�penetration�was�assumed�to�grow�by�6.6�percentage�points�on�average�each�year.�
� Historic�volumes�of�handset�sales�were�obtained�directly�from�estimates�by�MNOs.�Feature�phone�sales�were�assumed�to�decrease�at�an�average�9%�a�year,�while�smartphone�sales�were�assumed�to�grow�in�future�years,�albeit�at�a�decreasing�rate�(33%�a�year�on�average).��
� The�historic�prices�of�feature�phones�and�smartphones�were�provided�by�Turkcell�and�Vodafone.�The�price�of�feature�phones�was�assumed�to�decrease�at�an�average�of�5%�a�year�during�years�2012�to�2016,�while�the�price�of�smartphones�was�assumed�to�decrease�by�4%�a�year�during�the�same�period.�These�assumptions�have�been�made�based�on�discussions�with�market�participants�and�local�market�experts.�

�
©�2012�Deloitte�LLP. 64
� With�regards�to�SIM�card/activation�prices,�it�was�assumed�that�currently�the�price�of�these�items�is�constituted�only�by�tax,�i.e.�is�the�sum�of�the�Wireless�Licence�Fee�and�the�fixed�component�of�the�Special�Communications�Tax.�This�is�consistent�with�discussions�with�MNOs�and�with�the�subsidy�levels�identified�in�Turkey.�
� It�was�assumed�that�not�every�new�subscription�leads�to�an�additional�mobile�phone�sold:�only�40%�of�new�SIM�cards�have�been�associated�with�the�sale�of�a�new�handset.�
� Calls�price�per�minute�and�price�of�SMS�were�assumed�to�remain�stable�at�2011�levels�during�2012�2016.�These�assumptions�are�based�on�discussions�with�MNOs�and�in�consideration�of�market�maturity�and�the�degree�of�price�decreases�witnessed�in�recent�years.��
� Price�per�Mb�of�data�usage�was�assumed�to�decrease�at�a�decreasing�rate�from�2012�to�2016�(11%�on�average).�Data�prices�have�been�decreasing�consistently�in�recent�years�(which�is�typical�for�new�services);�however,�the�expectation�is�that�price�decreases�will�continue�in�future�years,�albeit�at�a�lower�rate.�
� Minutes�of�use�per�subscriber�per�month�were�based�on�the�Wireless�Intelligence.�Given�the�relatively�high�level�of�minutes�of�use�in�Turkey�and�given�that�the�levels�of�penetration�are�progressively�approaching�100%,�it�was�assumed�that�MOU�per�capita�decrease�at�2%�a�year�during�2012�to�2016.�
� SMS�per�user�per�month�were�obtained�from�Turkcell�and�Vodafone�and�aggregated�to�the�market�level�using�market�shares�as�a�weight.�It�was�assumed�that�SMS�per�user�per�month�will�decrease�by�2%�a�year�during�2012�2016.�
� Data�usage�measured�in�terms�of�Mb�per�user�per�month�was�provided�by�Turkcell�and�Vodafone�and�aggregated�to�the�market�level�using�market�shares.�From�discussions�with�the�operators�it�was�established�that�Mb�per�user�per�month�are�higher�for�subscribers�with�data�only�SIM�cards�compared�to�the�average�subscriber.�Mb�per�user�per�month�have�been�assumed�to�grow�at�an�average�10%�a�year�during�2012�2016�for�all�SIM�cards,�consistently�with�market�developments.�
Market�elasticities:32�
� Elasticity�of�mobile�usage�(calls�and�SMS)�was�assumed�to�be�0.4.�
� The�elasticity�of�demand�for�data�only�SIM�cards�was�assumed�to�be�0.9,�while�the�elasticity�for�all�other�subscriptions�was�assumed�to�be�0.5.�
������������������������������������������������������������32 See section C.2.1.2 for a more detailed discussion of the elasticities selected for the simulation.

�
©�2012�Deloitte�LLP. 65
Impact�of�increases�of�mobile�penetration�on�GDP�growth�rates:33�
� Dynamic�growth�coefficient�for�mobile�penetration:�It�was�assumed�that�a�10%�increase�in�mobile�penetration�raises�the�growth�rate�of�GDP�by�0.6%.34�
������������������������������������������������������������33 See section C.2.2 for a more detailed discussion of the impact of mobile penetration on the growth rate of the economy. 34 Waverman, Leonard, Meloria Meschi, and Melvyn Fuss (2005). “The Impact of Telecoms on Economic Growth in
Developing markets”.

�
©�2012�Deloitte�LLP. 66
List of figures and tables Figure�1:�Mobile�and�3G�penetration�levels�in�Turkey,�2011�..................................................................................................................�2�Figure�2:�Mobile�communications�ecosystem�in�Turkey�......................................................................................................................�3�Figure�3:�Supply�side�value�add�of�mobile�communications�in�Turkey,�TRY�millions�......................................................................�3�Figure�4:�Supply�side�value�add�from�mobile�communications�by�component,�TRY�millions�........................................................�4�Figure�5:�Mobile�value�chain�and�value�add�in�Turkey�in�2011,�TRY�millions�....................................................................................�4�Figure�6:�Supply�side�value�add�as�a�proportion�of�GDP�........................................................................................................................�4�Figure�7�Employment�generated�by�the�mobile�communications�ecosystem�in�2011�(FTEs)�...........................................................�4�Figure�8:�Potential�economic�impact�in�2011�of�increased�productivity�amongst�high�mobility�workers�......................................�5�Figure�9:�Mobile�specific�taxation�on�consumers�and�MNOs,�2011�.......................................................................................................�6�Figure�10:�Tax�as�a�percentage�of�TCMO,�2011�.........................................................................................................................................�7�Figure�11:�TCMO�as�a�percentage�of�GDP�per�capita,�2011�....................................................................................................................�7�Figure�12:�Mobile�penetration�in�a�sample�of�European�and�neighbouring�countries,�2011�.............................................................�8�Figure�13:�3G�penetration�in�a�sample�of�European�and�neighbouring�countries,�2011�....................................................................�8�Figure�14:�Penetration�in�a�sample�of�European�and�neighbouring�countries,�2000�2011�.................................................................�8�Figure�15:�Fixed�telecom�services�per�100�people,�2010�...........................................................................................................................�8�Figure�16:�Penetration�of�internet,�2010�......................................................................................................................................................�8�Figure�17�MNOs’�earnings�in�Turkey�and�for�a�typical�EU�operator�....................................................................................................�9�Figure�18:�EBITDA�margin,�2011�.................................................................................................................................................................�9�Figure�19:�Capex�per�capita,�2010,�US$�.....................................................................................................................................................�10�Figure�20:�Direct�and�indirect�effects�on�government�tax�revenues�....................................................................................................�10�Figure�21:�Mobile�penetration�and�3G�penetration,�2012�2016�.............................................................................................................�11�Figure�22:�Sales�of�data�only�SIM�cards,�2012�2016�................................................................................................................................�11�Figure�23:�Sales�of�feature�phones�and�sales�of�smartphones,�2012�2016�...........................................................................................�11�Figure�24:�Total�data�usage,�2012�2016,�Mb�billions�...............................................................................................................................�12�Figure�25:�Total�minutes�of�use�(billions),�2012�2016�.............................................................................................................................�12�Figure�26:�Government�tax�revenues,�2012�2016,�TRY�millions�...........................................................................................................�12�Figure�27:�Structure�of�the�analysis�of�economic�impact�on�GDP�and�employment�........................................................................�13�Figure�28:�The�mobile�communications�ecosystem�in�Turkey�..........................................................................................................�14�Figure�29:�Mobile�value�chain�and�value�add�in�Turkey�in�2011,�TRY�millions�................................................................................�16�Figure�30:�Supply�side�value�add�from�mobile�communications�by�component,�TRY�millions�....................................................�18�Figure�31:�Breakdown�of�2011�tax�revenues�from�MNOs�by�source�...................................................................................................�21�Figure�32:�Supply�side�value�add�of�the�mobile�ecosystem�as�a�proportion�of�GDP�........................................................................�22�Figure�33:�Economic�impact�in�2011�of�increased�productivity�amongst�high�mobility�workers�..................................................�23�Figure�34:�Price�per�minute�and�minutes�of�use�per�user�per�month�..................................................................................................�25�Figure�35:�Intangible�benefits�using�willingness�to�pay�concept,�TRY�millions�................................................................................�26�Figure�36:�Mobile�specific�taxation�on�consumers�and�MNOs,�2011�...................................................................................................�27�Figure�37:�Tax�as�a�percentage�of�TCMO,�TCMU�and�handset�price,�respectively�..........................................................................�30�Figure�38:�TCMO�as�a�percentage�of�GDP�per�capita�............................................................................................................................�31�Figure�39:�Gini�coefficient�(2010)�...............................................................................................................................................................�32�Figure�40:�Mobile�penetration�in�a�sample�of�European�and�neighbouring�countries�.....................................................................�33�Figure�41:�3G�penetration�in�a�sample�of�European�and�neighbouring�countries�............................................................................�33�Figure�42:�Penetration�in�a�sample�of�European�and�neighbouring�countries,�2000�2011�...............................................................�34�Figure�43:�Fixed�telephone�lines�per�100�people�.....................................................................................................................................�35�Figure�44:�Penetration�of�internet�..............................................................................................................................................................�36�Figure�45:�Corporate�tax�rates�in�Europe�.................................................................................................................................................�37�Figure�46�MNOs’�earnings�in�Turkey�and�for�a�typical�EU�operator�..................................................................................................�38�Figure�47:�EBITDA�margin,�2011�...............................................................................................................................................................�39�Figure�48:�Capex�per�capita,�2010,�US$�.....................................................................................................................................................�40�Figure�49:�Methodology�of�the�simulation�..............................................................................................................................................�41�Figure�50:�Direct�and�indirect�effects�on�government�tax�revenues�....................................................................................................�42�Figure�51:�Mobile�penetration�and�3G�penetration,�2012�2016�.............................................................................................................�43�Figure�52:�Sales�of�data�only�SIM�cards,�2012�2016�................................................................................................................................�44�Figure�53:�Sales�of�feature�phones�and�sales�of�smartphones,�2012�2016�...........................................................................................�44�Figure�54:�Total�data�usage,�Mb�billions�..................................................................................................................................................�45�Figure�55:�Total�minutes�of�use�(billions)�and�total�SMS�(billions),�2012�2016�..................................................................................�45�Figure�56:�Government�tax�revenues,�2012�2016,�TRY�millions�...........................................................................................................�46�Figure�57:�Structure�of�the�analysis�of�economic�impact�on�GDP�and�employment�........................................................................�48�

�
©�2012�Deloitte�LLP. 67
Figure�58:�This�methodology�and�national�accounts�...........................................................................................................................�48�Figure�59:�Structure�of�the�supply�side�analysis...................................................................................................................................�49�Figure�60:�Mobile�value�chain�..................................................................................................................................................................�49�Figure�61:�Multiplier�benchmarks�.............................................................................................................................................................�51�Figure�62:�Calculation�of�economic�impact�of�productivity�improvements�...................................................................................�54�Figure�63:�Increase�in�consumer�surplus�following�a�reduction�in�price�............................................................................................�55�Figure�64:�Tax�reduction�simulation�methodology�..............................................................................................................................�59�Figure�65�Impact�of�taxation�reductions�on�government�tax�revenue�..............................................................................................�62��
�Table�1:�Domestic�value�add�of�MNOs�(excluding�multiplier�effect),�TRY�millions�........................................................................�15�Table�2:�Calculation�of�value�add�from�mobile�communications�in�Turkey�in�2011,�TRY�millions�...............................................�17�Table�3:�Contribution�to�employment�from�the�mobile�value�chain�in�2011�.....................................................................................�19�Table�4:�Tax�and�regulatory�payments�in�Turkey�from�MNOs,�TRY�millions�..................................................................................�20�Table�5:�Total�tax�revenues�from�the�mobile�value�chain�in�2011,�TRY�millions�...............................................................................�21�Table�6:�Summary�of�taxation�paid�by�consumers�in�2011�....................................................................................................................�28�Table�7:�Summary�of�taxation�paid�by�MNOs�in�2011�...........................................................................................................................�36�Table�8:�Elasticity�measures�......................................................................................................................................................................�61��
�
�
�
�
�
�
�
�
�
�
�
�
�
�
�
�