
THIS REPORT CONTAINS ASSESSMENTS OF COMMODITY AND … GAIN Publications... · 2015-04-24 · THIS...
18
THIS REPORT CONTAINS ASSESSMENTS OF COMMODITY AND TRADE ISSUES MADE BY USDA STAFF AND NOT NECESSARILY STATEMENTS OF OFFICIAL U.S. GOVERNMENT POLICY Date: GAIN Report Number: Approved By: Prepared By: Report Highlights: While Japan’s soybean production recovered in MY 2014/15, domestic production accounts for only 25 percent of soybeans consumed for food and a mere 8 percent of total soybean utilization. On steady feed demand and relatively stable crushing margins, soybean and soybean meal imports are expected to remain flat in MY 2014/15 and MY 2015/16. Following the resolution of Canadian rail-freight disruptions that suppressed imports in MY 2013/14, rapeseed imports should recover in MY 2014/15 and remain flat in MY 2015/16. Tropical oil imports are expected to flatten out in MY 2014/15 and MY 2015/16, as Japanese end-users approach the limits of their ability to replace temperate oils without altering final products or processes. Yuichi Hayashi, Agricultural Specialist Evan Mangino, Agricultural Attaché Oilseeds and Products Situation and Outlook Oilseeds and Products Annual Japan JA5015 4/21/2015 Required Report - public distribution
Transcript of THIS REPORT CONTAINS ASSESSMENTS OF COMMODITY AND … GAIN Publications... · 2015-04-24 · THIS...
THIS REPORT CONTAINS ASSESSMENTS OF COMMODITY AND TRADE ISSUES MADE BY
USDA STAFF AND NOT NECESSARILY STATEMENTS OF OFFICIAL U.S. GOVERNMENT
POLICY
Date:
GAIN Report Number:
Approved By:
Prepared By:
Report Highlights:
While Japan’s soybean production recovered in MY 2014/15, domestic production accounts for only 25
percent of soybeans consumed for food and a mere 8 percent of total soybean utilization. On steady
feed demand and relatively stable crushing margins, soybean and soybean meal imports are expected to
remain flat in MY 2014/15 and MY 2015/16. Following the resolution of Canadian rail-freight
disruptions that suppressed imports in MY 2013/14, rapeseed imports should recover in MY 2014/15
and remain flat in MY 2015/16. Tropical oil imports are expected to flatten out in
MY 2014/15 and MY 2015/16, as Japanese end-users approach the limits of their ability to replace
temperate oils without altering final products or processes.
Yuichi Hayashi, Agricultural Specialist
Evan Mangino, Agricultural Attaché
Oilseeds and Products Situation and Outlook
Oilseeds and Products Annual
Japan
JA5015
4/21/2015
Required Report - public distribution

Commodities:
Production
On higher planted area and favorable weather in Hokkaido and Tohoku (accounting for
46 percent of planted area) during the grain filling period, Japanese soybean production in
MY 2014/15 climbed 13 percent to 225,600 metric tons (MT).
Table 1. Planted Area, Production and Yield of Soybeans in Japan
MY Planted Area (Hectares) Production (MT)
Yield (MT per hectare)
Yield – U.S.*
(MT per hectare) 2010/11 137,700 222,500 1.62 2.98 2011/12 136,700 218,800 1.60 2.82 2012/13 131,100 235,900 1.80 2.69 2013/14 128,800 198,000 1.55 2.96 2014/15 131,600 225,600 1.71 3.21
Source: MAFF (approximate figures for MY2014/15) and *USDA-National Agricultural Statistics Service, Crop Production 2014
Summary (January, 2015)
Planted area was up two percent in MY 2014/15, as the subsidy payment for diverting rice paddy fields
into soybean production improved prospective returns for soybeans ahead of planting decisions (see the
2013 Oilseeds and Products Annual Report JA3011 for more details on this subsidy policy). In MY
2014/15, 84 percent of soybeans were planted in fields converted from paddy rice production.
However, since Japanese farmers prefer to grow paddy rice in paddy fields, the effectiveness of this
subsidy is likely to wane in MY 2015/16, as the increased subsidies for producing rice for feed and for
flour in MY 2015/16 (see Table 2 below) are expected to draw some MY 2014/15 soybean planted area
back into paddy rice production in MY 2015/16. In tandem with the increased subsidies, JA Zen-Noh
(the marketing arm of the National Federation of Agricultural Cooperative Associations), which bought
34 percent of Japan’s total rice production in MY 2013/14, has set the feed rice target production level
for
MY 2015/16 at 600,000 MT, which is three times the production volume of MY 2014/15.
Oilseed, Sunflowerseed
Oil, Palm Kernel
Oil, Palm
Oil, Rapeseed
Oil, Soybean
Meal, Fish
Meal, Rapeseed
Meal, Soybean
Oilseed, Rapeseed
Oilseed, Soybean

Table 2. GOJ Table Rice Diversion Subsidies
Crop/Subsidy JFY 2013 JFY 2014 - 2015 Wheat, Soybeans, Feed Crop 35,000 35,000 Paddy Rice for WCS 80,000 80,000 Buckwheat, Rape Seed 20,000 0 Rice for Industrial Use 20,000 20,000 Feed Rice, Rice for Flour 80,000 55,000 - 105,000
Unit: Yen/0.1 hectares, WCS: Whole Crop Silage
As the inherently poor drainage of rice paddy soils results in significantly lower yields, national average
yields remained stubbornly low, at little more than half of U.S. yields (see Table 1). For example, in
Mie prefecture, where 98 percent of soybean area is planted in diverted rice paddies, yields were 0.84
MT/hectare in MY 2014/15, compared to yields of 2.56 MT/hectare in Hokkaido, where the paddy
planting rate is only 54 percent. Where soils do provide better drainage than the average rice paddy,
heavy rains and even typhoons often occur during key developmental periods for soybean plants.
Recently published research has shown that Japanese paddy cultivation conditions are associated with a
variety of yield-reducing maladies, including moisture damage, black root rot and low soil nitrogen
levels caused by continuous soybean planting.
Though Japan has approved 14 genetically engineered (GE) soybean varieties for commercial
production, potential yield improvements through GE technology remain unattainable as social and
administrative hurdles preclude the technology’s use (see JA4015, the 2014 Japan Agricultural
Biotechnology Annual Report, for more details). While Japanese public research organizations and
private companies have developed new, higher-yielding soybean varieties, Japanese soy food
producers’ commitment to five traditional, lower-yielding varieties renders demand for these new
varieties virtually non-existent. In addition, limited access to farm capital and traditional cultural
aversions to debt have also prevented many farmers from introducing newer technology and cultural
practices that could enhance yields in the absence of higher-yielding varieties.
Based on the factors described above, Post forecasts soybean planted area to decline approximately one
percent in MY 2015/16 to 130,000 hectares and production to fall to
220,000 MT, based on historical average yields.
Domestic rapeseed production is primarily for ornamental or for hobby purposes. Despite a production
subsidy of 9,640 yen per 60kg, rapeseed production continued at negligible levels in MY 2014/15, with
planted area amounting to just 1,470 hectares. With duty free access for imported rapeseed, the high
cost of domestic rapeseed relative to import prices, and little available land for expansion of rapeseed
planting, Post projects that domestic rapeseed production will continue at an inconsequential scale in
MY 2015/16.
With regard to longer-term production projections, the Ministry of Agriculture, Forestry and Fisheries
(MAFF) released its Basic Plan for Food, Agriculture, and Farm Villages in March 2015. This 10-year

agricultural policy blueprint for the national government was last updated in 2010. Of note in the 2015
Basic Plan, MAFF reduced the national food self-sufficiency ratio target for 2025 from 50 to 45
percent; this was the first time the Government of Japan (GOJ) has reduced the target, which has been
used to justify fiscally unsustainable agricultural subsidies for decades. Accordingly, the 2025 target
production volumes for soybean and rapeseed have been significantly reduced in the 2015 Basic Plan,
with soybeans 47 percent lower and rapeseed down 60 percent. Despite these revisions, the new targets
(320,000 MT of soybeans and
4,000 MT of rapeseed in 2025) still remain highly ambitious, due to the fact that there is little chance of
introducing yield-improving varieties (conventional or genetically engineered), limited available land
for oilseed area expansion, and a concerted effort by the GOJ and JA Zen-noh to expand production of
rice for feed and for flour that should further reduce Japan’s soybean planted area.
Consumption
Crushing
As a result of a shrinking population and the steady exit of aging farmers from production agriculture,
Japanese livestock numbers are expected to continue their gradual decline in
MY 2014/15 and in MY 2015/16. While this will suppress some of the demand for imported oilseeds
through reduced demand for oilseed meals, Japan’s recent pattern of importing well over 1 million MT
of soybean meal demonstrates the considerable domestic demand that Japan is unable to meet through
oilseed imports and domestic crushing. With duty free access for soybean meal, rapeseed meal and fish
meals, high tariff barriers for temperate oils, and an upper limit on total domestic vegetable oil
utilization, Japanese oilseed import volumes will continue to hinge on the profitability of domestic
crushing relative to the price of imported oilseed meals and oils.
Table 3. Japanese Livestock Population (1,000 heads)
CY Dairy Cows Beef
Cattle Swine Layers Broilers
2010 1,484 2,892 9,750* NA NA 2011 1,467 2,763 9,768 175,917 NA 2012 1,449 2,723 9,735 174,949 NA 2013 1,423 2,624 9,685 172,238 131,624 2014 1,395 2,567 9,537 172,349 135,747 Source: MAFF Monthly Statistics of Agriculture (as of February each year)
While rapeseed meal is a critically important feed component, displacing large volumes of soybean
meal in feed rations over the last 30 years on lower prices and expanding volumes, feed millers have
reached the theoretical limit to how much soybean meal they can replace while still maintaining the
necessary minimum nutritional value for the animal. Although the somewhat healthier image of
rapeseed oil continues to sustain retail consumer demand, rapeseed oil already accounts for 80 percent

of oil for household use, and there is not much room for increasing market share. These factors
together may be tantamount to an effective ceiling on Japanese rapeseed imports going forward.
The benefits of recent global oilseed commodity price declines have been largely offset by depreciation
of the Yen against the Dollar, keeping crushers’ profit margins thin. However, as a result of the April
1, 2014 national consumption tax increase from five percent to eight percent, and the continued
monetary expansion by the Bank of Japan, inflationary pressures are rising and consumers are showing
the first signs of inflationary expectations. Price increases in the fiercely competitive Japanese retail
and food service segments began to emerge in CY 2014, and are expected to continue through CY
2015. The ability to raise vegetable oil prices should improve crushers’ profitability in MY2014/15 and
MY 2015/16.
There are 13 large-scale crushing plants in Japan with a combined crushing capacity of approximately
90 percent of annual oil consumption. Although there has been no change in oil crushing capacity,
slack in the crushing industry has grown wider since 2001, when crushers began converting additional
production lines to handle greater volumes of rapeseed. The influx of duty free palm oil from 2005,
brought even more lower-priced (relative to soybean) vegetable oil to the Japanese market, placing
additional strain on soybean crushers’ profitability and leading to the idling of additional crushing
capacity.
Many large crushing plants were built in the late 1960s and the cost of maintaining and/or refurbishing
these older plants continues to rise every year. A major oilseed crusher recently announced planned
construction of a new soybean crushing plant in collaboration with a feed miller and grain storage
company, all of which will relocate around the new site. This new plant is scheduled to begin operation
in 2017, when the company will decommission one of its plants that was built in 1968. While the
crushing capacity of the new plant will be slightly smaller, the facility will require only half the staff
and is estimated to save ¥700 million to ¥1 billion
($5.8 to $8.3 million USD) in annual operating costs. This example illustrates the future direction the
crushing industry will need to travel to continue to profitably service the demands of Japanese
vegetable oil users and feed millers.
Table 4. Japan’s Oil Crushing Capacity
CY
Number of Mills* Crushing Capacity
* (1,000 MT)
Production (1,000 MT)
Operating Ratio*
(percent)
2010 40 8,587 5,388 62.7 2011 40 8,587 5,087 59.2 2012 40 8,587 4,977 58.0 2013 40 8,587 4,977 57.5

2014 40 8,587 5,068 59.0
Source: MAFF (Vegetable oil production report), * Post estimate
Based on steadily, albeit slightly, declining demand from Japanese feed millers, and relatively flat (if
not declining) temperate oil consumption, Post expects Japanese oilseed crush to remain relatively flat
in MY 2014/15 and MY 2015/16. With effective limits on the volume of palm oil that can be used for
processed foods and rapeseed meal that can be used for gradually declining feed production, as well as
the high level of market penetration of rapeseed oil in the retail marketplace, Post expects the 45:55
ratio of soybeans to rapeseed for crushing to hold steady in MY 2014/15 and MY 2015/16.
Food
While the Japanese oilseed market is dominated by the crushing industry, food grade soybeans
represent a significant volume at well over 900,000 MT of consumption. As seen in Table 5, Japan
uses soybeans for oil, food, and feed in a roughly 20:10:1 ratio, with Japan crushing nearly 2 million
MT of soybeans for oil in MY 2013/14. Japanese domestic soybeans are generally never used for oil
production, as Japanese soybean prices are far higher than imported soybeans and often lack desired
crushing characteristics.
In line with the continuing decline of the Japanese population and the increasing diversity of the
Japanese diet, Post expects that soy food consumption in Japan will continue its steady decline, falling
to 929,000 MT in MY 2014/15 and 925,000 in MY 2015/16. (See the 2013 Oilseeds and Products
Annual Report JA3011 for a more detailed explanation of the dynamics of declining soy food
consumption). The contrast of efforts to sustain, if not expand, the consumption of soy foods in Japan
is neatly illustrated by tofu and soy milk.
Tofu production continues to dominate utilization of food grade soybeans in Japan, accounting for
almost half of total consumption. While there are over 8,500 companies and shops producing tofu in
Japan, that number has decreased by 40 percent over the last ten years as the proprietors of ‘mom and
pop’ operations retire without successors. The majority of tofu manufacturers are small, geographically
dispersed businesses. As single-person households in Japan continue to increase, home-meal
replacement and dining out continues to chip away at the level of tofu consumption. Though some tofu
manufacturers have successfully developed and marketed innovative new products, including tofu with
various flavors and individual-serving sized packages, the industry has not been able to overcome the
factors listed above.
As the only soy food product to consistently show year-on-year growth over the last ten years, soymilk
represents the counterpoint to the tofu industry’s progressive decline. Despite representing only about
five percent of total food grade soybean consumption, utilization of soybeans for soymilk set yet
another record high in CY 2014. Soy milk manufacturers have developed new products to match
changing Japanese consumption patterns, offering tasty, health-conscious beverages. The concentration

of soymilk production among five manufacturers has helped the industry work cooperatively to pursue
new consumers through national educational and promotional campaigns.
In October 2014, the Japan Soymilk Association held the first soymilk recipe contest for students,
receiving over 900 recipes from 43 schools across Japan (a very robust response for a Japanese recipe
contest). By using childhood nutritional education as a vehicle to promote the product, soymilk
manufacturers have succeeded in elevating the profile and recognition of their product and generating
positive, incremental growth, in spite of the continued decline of the overall population.
Fig.1 Volume of soybean used for food
Source: MAFF
Trade
Japan’s total soybean imports were up two percent in MY 2013/14 to approximately
2.9 million MT, because of a slight recovery of demand for soybean for crushing on improved meal
profitability and relatively stable demand for soybean oil. Although overall domestic livestock
numbers have been trending downward in recent years and total feed production in
CY 2014 was down two percent from CY 2013, total utilization of soybean meal for mixed and
compound feed remained unchanged in CY 2014 as inclusion rates rose slightly to meet the needs of

growing poultry flocks (both broilers and layers), which account for about 55 percent of soybean meal
consumption.
Imported soybean meal prices are projected to remain relatively high through MY 2014/15 on tighter
global exportable supplies and the relatively weak Yen, providing additional demand for domestically
crushed soybean meal. As global soybean prices have descended from recent heights and soybean meal
demand remains steady, soybean crushing profitability has improved, narrowing the profit margin
advantage of rapeseed crushing. Post expects total imports of soybeans to remain at 2.9 million MT in
MY 2014/15 and MY 2015/16 in response to the trends discussed above.
The United States continued to dominate total Japanese soybean imports in MY 2013/14, expanding its
market share by nearly 5 percentage points to 66 percent. Despite consistent low prices, Brazil’s
underdeveloped transport infrastructure and long shipping times continue to undercut the attractiveness
of Brazilian soybeans in the Japanese market. While increasing familiarity with Brazilian soybeans
may lead Japanese crushers to further diversify their supply sources in the future, at this time, Post
projects imports of U.S. soybeans to remain stable at
1.85 million MT in MY 2014/15 and MY 2015/16.
Over the last ten years, Canadian non-GE, food grade soybeans have steadily displaced Chinese
supplies and eroded U.S. market share (just 43 percent in CY 2013, down nearly 10 percentage points
from CY 2008). With little projected improvement in Japanese production in the near future, Japanese
demand for imported food grade soybeans should remain flat, if not slightly lower, in MY 2014/15 and
MY 2015/16.
Table 5. Demand and supply of soybeans in Japan (1,000 MT)
CY Demand
MY Supply
Total Oil Food Feed Japan Import
Total**
U.S. Brazil Canada China
2010 3,562 2,473 976 113 2009/10 230 3,401 2,492 495 495 46
2011 3,123 2,067 950 106 2010/11 223 2,917 2,032 496 346 40
2012 2,987 1,935 946 106 2011/12 219 2,759 1,718 624 372 42
2013 2,951 1,911 963 104 2012/13 236 2,830 1,746 635 385 42
2014 3,013* 1,992 929
* 104* 2013/14 194 2,894 1,896 576 369 38
Source: MAFF; * estimate; ** includes residual suppliers.
All imported rapeseed (99.99 percent of total annual new supply) is used for crushing. Canada
continued to dominate the Japanese rapeseed market in MY 2013/14, with a 93 percent market share in
spite of significant shipment disruptions as expanded Canadian petroleum production monopolized
available rail freight (see GAIN CA14073 for more information on the Canadian rail transportation
issue). With Canadian freight issues largely resolved, Post expects total rapeseed imports to recover to
MY 2012/13 levels in MY 2014/15 and MY 2015/16. Australia remains a residual supplier due to
higher unit costs. Based on the market dynamics explained above, Post estimates that rapeseed imports

will not continue to expand beyond MY 2014/15, but rather should remain at 2.45 million MT in MY
2015/16.
Table 6. Demand and supply of rapeseeds in Japan (1,000 MT)
Demand Supply MY Canada Australia Import total Domestic Total
2009/10 2,277 2,068 207 2,275 2 2,277 2010/11 2,342 2,266 54 2,321 2 2,323 2011/12 2,367 2,273 76 2,350 2 2,352 2012/13 2,438 2,338 157 2,495 2 2,497 2013/14 2,400 2,211 167 2,378 2 2,380
Source: Global Trade Atlas (GTA), MAFF
Table 7. MY Average CIF Import Price Comparison of Soybeans, Rapeseeds and Soybean Meal (Dollars per MT)
2009/10 2010/11 2011/12 2012/13 2013/14 % change 2015 Feb. Soybeans (World) 523 617 636 698 672 -3.6 555
U.S. 502 606 604 681 646 -5.1 528 Brazil 463 516 611 635 621 -2.3 667
Canada 699 781 779 833 844 1.3 764 China 866 969 1056 1,114 1002 -1.2 1040
Rapeseed (World) 476 642 681 713 559 -21.7 502 Canada 469 636 674 713 556 -22.0 507
Australia 492 724 738 695 589 -15.2 494 Soybean Meal
(World) 456 479 481 611 607 -0.5 538
Source: GTA, HS 1201, HS 1205, HS 2304
Stocks
The Government of Japan (GOJ) does not maintain reserve stocks of oilseeds. All stocks in Japan are
privately held, the majority by oil crushers and silo companies, which traditionally keep 30 to 40 days
of production on hand.
Meals
The soybean crushing process produces 190 kg of soybean oil and 760 kg of soybean meal from one
MT of soybeans. According to a GOJ estimate, 89 percent of soybean meal was used for feed in CY
2014, with the rest being used for soy sauce, miso, soy protein foods, and as an improving agent for
processed foods.
Although Japan’s compound and mixed feed production decreased by two percent in CY 2014, demand
of soybean meal for feed remained unchanged in MY 2014 at 2.85 million MT because of a modest
recovery of soybean meal inclusion. In CY 2014, Japan’s feed manufacturers reached the limits of their
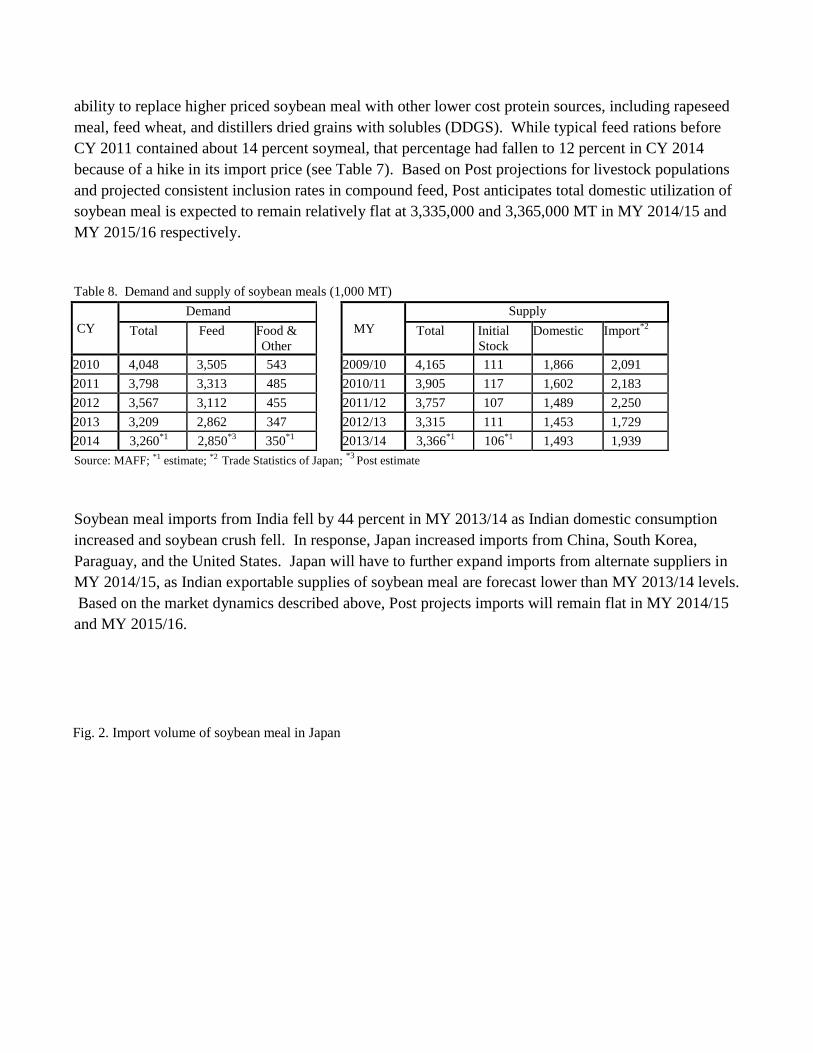
ability to replace higher priced soybean meal with other lower cost protein sources, including rapeseed
meal, feed wheat, and distillers dried grains with solubles (DDGS). While typical feed rations before
CY 2011 contained about 14 percent soymeal, that percentage had fallen to 12 percent in CY 2014
because of a hike in its import price (see Table 7). Based on Post projections for livestock populations
and projected consistent inclusion rates in compound feed, Post anticipates total domestic utilization of
soybean meal is expected to remain relatively flat at 3,335,000 and 3,365,000 MT in MY 2014/15 and
MY 2015/16 respectively.
Table 8. Demand and supply of soybean meals (1,000 MT)
CY Demand
MY Supply
Total Feed Food &
Other Total Initial
Stock Domestic Import
*2
2010 4,048 3,505 543 2009/10 4,165 111 1,866 2,091
2011 3,798 3,313 485 2010/11 3,905 117 1,602 2,183
2012 3,567 3,112 455 2011/12 3,757 107 1,489 2,250
2013 3,209 2,862 347 2012/13 3,315 111 1,453 1,729
2014 3,260*1 2,850
*3 350*1 2013/14 3,366
*1 106*1 1,493 1,939
Source: MAFF; *1 estimate; *2 Trade Statistics of Japan; *3
Post estimate
Soybean meal imports from India fell by 44 percent in MY 2013/14 as Indian domestic consumption
increased and soybean crush fell. In response, Japan increased imports from China, South Korea,
Paraguay, and the United States. Japan will have to further expand imports from alternate suppliers in
MY 2014/15, as Indian exportable supplies of soybean meal are forecast lower than MY 2013/14 levels.
Based on the market dynamics described above, Post projects imports will remain flat in MY 2014/15
and MY 2015/16.
Fig. 2. Import volume of soybean meal in Japan

Source: Trade Statistics of Japan
Rapeseed meal and fish meal are used in feed and fertilizer production in Japan. Rapeseed crushing
produces 410 kg of rapeseed oil and 570 kg of rapeseed meal for every MT of rapeseed. Post expects
rapeseed meal production will remain stable in MY 2014/15 at 1.36 million MT, due to scant prospects
for expanding feed production or for increasing rapeseed meal inclusion rates. Post expects this trend
to continue in MY 2015/16.
Table 9. Demand and supply of rapeseed meals (1,000 MT)
CY Demand Supply
Total Feed Fertilizer and other Total Initial Stocks Domestic Import
MY 2010 1,300 1,032 268 1,361 55 1,267 58 2011 1,298 1,022 274 1,323 61 1,234 25 2012 1,390 1,139 246 1,447 85 1,326 14 2013 1,402 1,197 205 1,467 57 1,342 75 2014 1,392
* 1,182* 210
* 1,460* 65
* 1,361 76
Source: MAFF; * estimate
Fish meal is primarily used as an ingredient in feed for aquaculture and livestock, while a small amount
is utilized for fertilizer. Ninety percent of fish meal produced in Japan is derived from “fish residue”

(essentially the unsaleable portions of fish prepared for direct consumption); the remaining ten percent
is produced from whole raw fish. Domestic fish residue volumes have been decreasing as the fishery
processing industry has continued to move offshore from Japan. Fish meal consumption and imports
are projected to be relatively flat in MY 2014/15 and
MY 2015/16.
There is no tariff on soybean meal, rapeseed meal, or fishmeal.
Oils
According to MAFF, the total supply of vegetable oil in CY 2014 was roughly 2.47 million MT,
including 1.67 million MT from domestic production and 0.71 million MT from imports. Japanese
demand for vegetable oil has increased dramatically since the 1960s, as the Japanese diet has steadily
shifted more towards a Western-style diet. While the composition of Japanese vegetable oil utilization
has changed significantly over the last ten years, vegetable oil demand and utilization patterns appear to
have finally reached a stable equilibrium.
Table 10. Demand and Supply of Vegetable Oil (1,000 MT)
CY 2010 2011 2012 2013 2014*1
Demand
Domestic demand 2,330 2,311 2,319 2,326 2,340
Export*2
11 8 11 11 11
Total 2,341 2,319 2,330 2,337 2,351
Supply
Initial stock 119 109 128 124 121
Domestic production
Soybean oil 468 401 377 380 392*3
Rapeseed oil 993 1,027 1,064 1,044 1,074*3
Other oil 196 207 199 198 199*3
Total 1,656 1,635 1,640 1,622 1,665
Import*2
675 703 686 712 705
Total 2,450 2,447 2,454 2,458 2,491
Year-end stock 109 128 124 121 140
Source: MAFF; *1 MAFF estimate; *2 Temperate products include oil from soybean, rapeseed, mustard, rice, cotton seed, safflower,
sesame, corn, peanut and sunflower; *3 Actual
While soybeans have historically dominated the Japanese oil crushing market, rapeseed oil production
has outpaced soybean oil since 1988. However, since rapeseeds produce more than twice as much oil
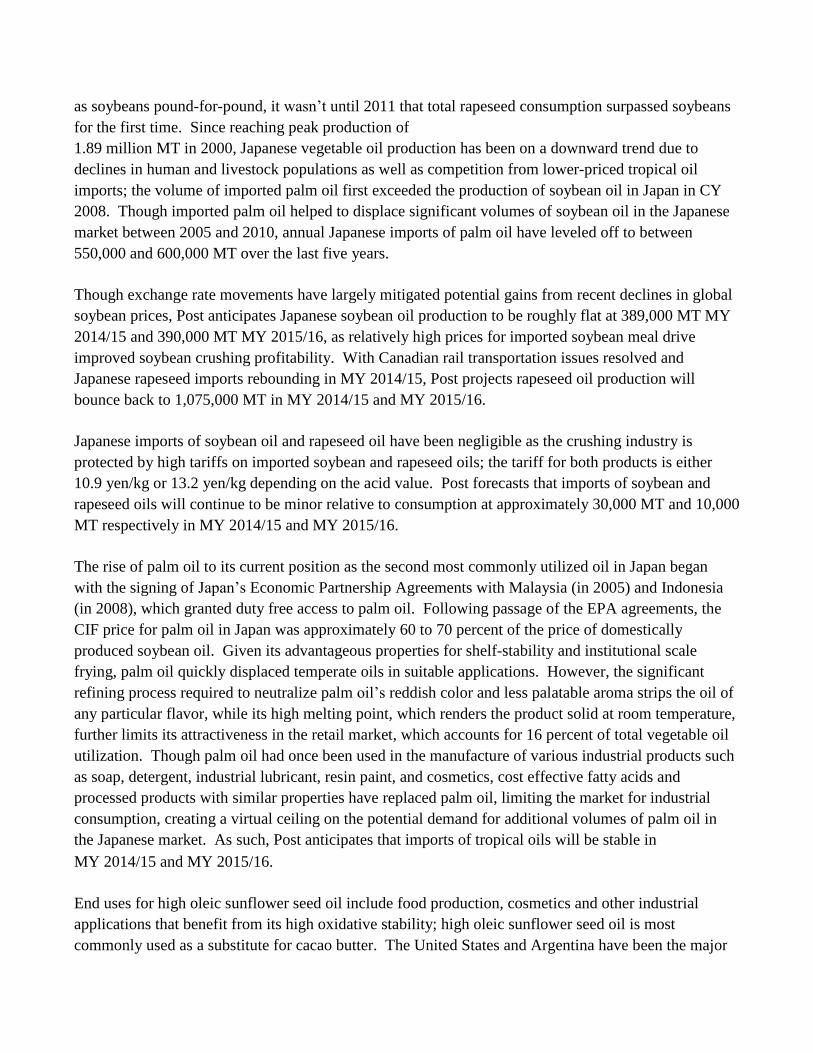
as soybeans pound-for-pound, it wasn’t until 2011 that total rapeseed consumption surpassed soybeans
for the first time. Since reaching peak production of
1.89 million MT in 2000, Japanese vegetable oil production has been on a downward trend due to
declines in human and livestock populations as well as competition from lower-priced tropical oil
imports; the volume of imported palm oil first exceeded the production of soybean oil in Japan in CY
2008. Though imported palm oil helped to displace significant volumes of soybean oil in the Japanese
market between 2005 and 2010, annual Japanese imports of palm oil have leveled off to between
550,000 and 600,000 MT over the last five years.
Though exchange rate movements have largely mitigated potential gains from recent declines in global
soybean prices, Post anticipates Japanese soybean oil production to be roughly flat at 389,000 MT MY
2014/15 and 390,000 MT MY 2015/16, as relatively high prices for imported soybean meal drive
improved soybean crushing profitability. With Canadian rail transportation issues resolved and
Japanese rapeseed imports rebounding in MY 2014/15, Post projects rapeseed oil production will
bounce back to 1,075,000 MT in MY 2014/15 and MY 2015/16.
Japanese imports of soybean oil and rapeseed oil have been negligible as the crushing industry is
protected by high tariffs on imported soybean and rapeseed oils; the tariff for both products is either
10.9 yen/kg or 13.2 yen/kg depending on the acid value. Post forecasts that imports of soybean and
rapeseed oils will continue to be minor relative to consumption at approximately 30,000 MT and 10,000
MT respectively in MY 2014/15 and MY 2015/16.
The rise of palm oil to its current position as the second most commonly utilized oil in Japan began
with the signing of Japan’s Economic Partnership Agreements with Malaysia (in 2005) and Indonesia
(in 2008), which granted duty free access to palm oil. Following passage of the EPA agreements, the
CIF price for palm oil in Japan was approximately 60 to 70 percent of the price of domestically
produced soybean oil. Given its advantageous properties for shelf-stability and institutional scale
frying, palm oil quickly displaced temperate oils in suitable applications. However, the significant
refining process required to neutralize palm oil’s reddish color and less palatable aroma strips the oil of
any particular flavor, while its high melting point, which renders the product solid at room temperature,
further limits its attractiveness in the retail market, which accounts for 16 percent of total vegetable oil
utilization. Though palm oil had once been used in the manufacture of various industrial products such
as soap, detergent, industrial lubricant, resin paint, and cosmetics, cost effective fatty acids and
processed products with similar properties have replaced palm oil, limiting the market for industrial
consumption, creating a virtual ceiling on the potential demand for additional volumes of palm oil in
the Japanese market. As such, Post anticipates that imports of tropical oils will be stable in
MY 2014/15 and MY 2015/16.
End uses for high oleic sunflower seed oil include food production, cosmetics and other industrial
applications that benefit from its high oxidative stability; high oleic sunflower seed oil is most
commonly used as a substitute for cacao butter. The United States and Argentina have been the major

suppliers of sunflower seed oil to Japan over the last ten years. The total imports from these two
countries account for 72 percent of Japan’s imports in MY 2013/2014. Based on recent trends, Post
anticipates Japan will import around 30,000 MT in MY 2014/15 and
MY 2015/16.
Table 11. Japan's tariff on major oilseeds and oils (as of January 2015)
HS Code Commodity Duty 1201.10,.90 Soybeans Free 1205.10,.90 Rapeseed Free 1507.10-100 Soybean oil, crude, of an acid value exceeding 0.6 10.9 yen/kg 1507.10-200 Soybean oil, crude, other 13.2 yen/kg 1507.90-000 Soybean oil, other 13.2 yen/kg 1508.10-100 Peanut oil, crude, of an acid value exceeding 0.6 8.5 yen/kg 1509 & 1510 Olive oil Free 1511.10-000 Palm oil, crude, EPA preferential rate for Malaysia and Indonesia Free 1511.90-010 Palm stearin, EPA preferential rate for Malaysia and Indonesia Free 1511.90-090 Palm oil, other, EPA preferential rate for Malaysia and Indonesia Free 1512.11-110 Sunflower-seed oil, crude, of an acid value exceeding 0.6 8.5 yen/kg 1512.11-210 Safflower oil, crude, of an acid value exceeding 0.6 8.5 yen/kg 1512.11-120 Sunflower-seed oil, crude, other 10.4 yen/kg 1512.11-220 Safflower-seed oil, crude, other 10.4 yen/kg 1512.19-010 Sunflower-seed oil and its fractions 10.4 yen/kg 1514.11-100 Low erucic acid rapeseed oil, crude, of an acid value exceeding 0.6 10.9 yen/kg 1514.11-200 Low erucic acid rapeseed oil, crude, other 13.2 yen/kg 1514.19-000 Low erucic acid rapeseed oil, other 13.2 yen/kg 1514.91-100 Rapeseed oil, other, crude, of an acid value exceeding 0.6 10.9 yen/kg 1514.91-200 Rapeseed oil, other, crude, other 13.2 yen/kg 2301.20 Fish meal Free 2304.00 Soybean meal Free 2306.41,.49 Rapeseed meal Free
Source: Japan Tariff Association

Production, Supply and Demand Data Statistics:
Oilseed, Soybean 2013/2014 2014/2015 2015/2016 Market Begin Year Oct 2013 Oct 2014 Oct 2016
Japan USDA Official New post USDA Official New post USDA Official New post Area Planted 130 129 130 132 0 130 Area Harvested 127 129 125 132 0 130 Beginning Stocks 184 184 231 228 0 260 Production 198 200 205 226 0 220 MY Imports 2,894 2,894 2,900 2,850 0 2,850 MY Imp. from U.S. 1,896 1,896 1,900 1,850 0 1,850 MY Imp. from EU 0 0 0 0 0 0 Total Supply 3,276 3,278 3,336 3,304 0 3,330 MY Exports 0 0 0 0 0 0 MY Exp. to EU 0 0 0 0 0 0 Crush 1,940 1,969 1,970 1,970 0 1,970 Food Use Dom. Cons. 975 936 980 929 0 925 Feed Waste Dom. Cons. 130 145 135 145 0 152 Total Dom. Cons. 3,045 3,050 3,085 3,044 0 3,047 Ending Stocks 231 228 251 260 0 283 Total Distribution 3,276 3,278 3,336 3,304 0 3,330
1000 HA, 1000 MT
Oilseed, Rapeseed 2013/2014 2014/2015 2015/2016
Market Begin Year Oct 2013 Oct 2014 May 2016 Japan USDA Official New post USDA Official New post USDA Official New post
Area Planted 0 2 0 2 0 2 Area Harvested 2 2 2 2 0 2 Beginning Stocks 109 109 114 84 0 81 Production 2 2 2 2 0 2 MY Imports 2,378 2,378 2,450 2,450 0 2,450 MY Imp. from U.S. 0 0 0 0 0 0 MY Imp. from EU 0 0 0 0 0 0 Total Supply 2,489 2,489 2,566 2,536 0 2,533 MY Exports 0 0 0 0 0 0 MY Exp. to EU 0 0 0 0 0 0 Crush 2,370 2,400 2,450 2,450 0 2,450 Food Use Dom. Cons. 0 0 0 0 0 0 Feed Waste Dom. Cons. 5 5 6 5 0 5 Total Dom. Cons. 2,375 2,405 2,456 2,455 0 2,455 Ending Stocks 114 84 110 81 0 78 Total Distribution 2,489 2,489 2,566 2,536 0 2,533
1000 HA, 1000 MT

Meal, Soybean 2013/2014 2014/2015 2015/2016
Market Begin Year Oct 2013 Oct 2014 Oct 2016 Japan USDA Official New post USDA Official New post USDA Official New post
Crush 1,940 1,969 1,970 1,970 0 1,970 Extr. Rate, 999.9999 1 1 1 1 0 1 Beginning Stocks 71 71 91 203 0 308 Production 1,465 1,493 1,491 1,490 0 1,490 MY Imports 1,976 1,939 2,000 1,950 0 1,950 MY Imp. from U.S. 230 228 250 250 0 250 MY Imp. from EU 0 1 0 0 0 0 Total Supply 3,512 3,503 3,582 3,643 0 3,748 MY Exports 0 0 0 0 0 0 MY Exp. to EU 0 0 0 0 0 0 Industrial Dom. Cons. 345 259 350 260 0 260 Food Use Dom. Cons. 130 125 130 125 0 125 Feed Waste Dom. Cons. 2,946 2,916 3,020 2,950 0 2,980 Total Dom. Cons. 3,421 3,300 3,500 3,335 0 3,365 Ending Stocks 91 203 82 308 0 383 Total Distribution 3,512 3,503 3,582 3,643 0 3,748
1000 MT, PERCENT
Meal, Rapeseed 2013/2014 2014/2015 2015/2016 Market Begin Year Oct 2013 Oct 2014 Oct 2015
Japan USDA Official New post USDA Official New post USDA Official New post Crush 2,370 2,400 2,450 2,450 0 2,450 Extr. Rate, 999.9999 1 1 1 1 0 1 Beginning Stocks 0 0 0 20 0 38 Production 1,330 1,353 1,370 1,360 0 1,360 MY Imports 76 76 100 75 0 75 MY Imp. from U.S. 0 0 0 0 0 0 MY Imp. from EU 0 0 0 0 0 0 Total Supply 1,406 1,429 1,470 1,455 0 1,473 MY Exports 2 3 2 2 0 2 MY Exp. to EU 0 0 0 0 0 0 Industrial Dom. Cons. 310 249 310 250 0 250 Food Use Dom. Cons. 0 0 0 0 0 0 Feed Waste Dom. Cons. 1,094 1,157 1,158 1,165 0 1,165 Total Dom. Cons. 1,404 1,406 1,468 1,415 0 1,415 Ending Stocks 0 20 0 38 0 56 Total Distribution 1,406 1,429 1,470 1,455 0 1,473
1000 MT, PERCENT

Meal, Fish 2013/2014 2014/2015 2015/2016
Market Begin Year Jan 2014 Jan 2014 Jan 2015 Japan USDA Official New post USDA Official New post USDA Official New post
Catch For Reduction 860 860 860 860 0 860 Extr. Rate, 999.9999 0 Beginning Stocks 9 9 16 43 0 58 Production 175 187 175 185 0 185 MY Imports 254 254 240 240 0 240 MY Imp. from U.S. 16 160 5 10 0 10 MY Imp. from EU 1 3 0 0 0 0 Total Supply 438 450 431 468 0 483 MY Exports 2 3 5 5 0 5 MY Exp. to EU 0 0 0 0 0 0 Industrial Dom. Cons. 50 50 50 50 0 50 Food Use Dom. Cons. 0 0 0 0 0 0 Feed Waste Dom. Cons. 370 354 360 355 0 355 Total Dom. Cons. 420 404 410 405 0 405 Ending Stocks 16 43 16 58 0 73 Total Distribution 438 450 431 468 0 483
1000 MT, PERCENT
Oil, Soybean 2013/2014 2014/2015 2015/2016
Market Begin Year Oct 2013 Oct 2014 Oct 2016 Japan USDA Official New post USDA Official New post USDA Official New post
Crush 1,940 1,969 1,970 1,970 0 1,970 Extr. Rate, 999.9999 0 Beginning Stocks 24 24 21 35 0 44 Production 375 389 381 389 0 390 MY Imports 16 16 15 30 0 30 MY Imp. from U.S. 2 3 1 5 0 5 MY Imp. from EU 0 0 0 0 0 0 Total Supply 415 429 417 454 0 464 MY Exports 0 0 0 0 0 0 MY Exp. to EU 0 0 0 0 0 0 Industrial Dom. Cons. 35 35 35 35 0 35 Food Use Dom. Cons. 359 359 363 375 0 375 Feed Waste Dom. Cons. 0 0 0 0 0 0 - 0 0 0 0 0 0 Total Dom. Cons. 394 394 398 410 0 410 Ending Stocks 21 35 19 44 0 54 Total Distribution 415 429 417 454 0 464
1000 MT, PERCENT

Oil, Rapeseed 2013/2014 2014/2015 2015/2016
Market Begin Year Oct 2013 Oct 2014 Oct 2015 Japan USDA Official New post USDA Official New post USDA Official New post
Crush 2,370 2,400 2,450 2,450 0 2,450 Extr. Rate, 999.9999 0 Beginning Stocks 118 118 116 160 0 204 Production 1,010 1,054 1,012 1,075 0 1,075 MY Imports 10 10 10 10 0 10 MY Imp. from U.S. 0 0 0 0 0 0 MY Imp. from EU 0 0 0 0 0 0 Total Supply 1,138 1,182 1,138 1,245 0 1,289 MY Exports 2 2 1 1 0 1 MY Exp. to EU 0 0 0 0 0 0 Industrial Dom. Cons. 60 60 60 60 0 60 Food Use Dom. Cons. 960 960 965 980 0 1,000 Feed Waste Dom. Cons. 0 0 0 0 0 0 Total Dom. Cons. 1,020 1,020 1,025 1,040 0 1,060 Ending Stocks 116 160 112 204 0 228 Total Distribution 1,138 1,182 1,138 1,245 0 1,289
1000 MT, PERCENT
Oil, Sunflowerseed 2013/2014 2014/2015 2015/2016
Market Begin Year Oct 2013 Oct 2014 Oct 2015 Japan USDA Official New post USDA Official New post USDA Official New post
Crush 0 0 0 0 0 0 Extr. Rate, 999.9999 0 0 0 0 0 0 Beginning Stocks 5 5 5 5 0 5 Production 0 0 0 0 0 0 MY Imports 28 28 30 30 0 30 MY Imp. from U.S. 15 10 15 15 0 15 MY Imp. from EU 0 5 0 5 0 5 Total Supply 33 33 35 35 0 35 MY Exports 0 0 0 0 0 0 MY Exp. to EU 0 0 0 0 0 0 Industrial Dom. Cons. 0 0 0 0 0 0 Food Use Dom. Cons. 28 28 30 30 0 30 Feed Waste Dom. Cons. 0 0 0 0 0 0 Total Dom. Cons. 28 28 30 30 0 30 Ending Stocks 5 5 5 5 0 5 Total Distribution 33 33 35 35 0 35
1000 MT, PERCENT
Author Defined: CY: Calendar Year JFY: Japanese Fiscal Year (April – March next year)
MY: Market Year for oilseeds, meal made from oilseeds, oil: October – September next year
MY for fish meal: January – December
Conversion Ratio: Oil : Meal (weight basis)
- Soybean: 0.1975 : 0.7563
- Rapeseed: 0.4388 : 0.5551


