
This example demonstrates use of the SAS FCS (Fully ... FCS Imputation Example.pdf · This example...
22
This example demonstrates use of the SAS FCS (Fully Conditional Specification) imputation method in PROC MI. This method is experimental in SAS v9.3 and as such, is not fully supported and may change prior to becoming production. This method is equivalent to the sequential regression and chained equations methods of IVEware and Stata. The data used is a subset of cases and variables from the NHANES 2005-2006 data. You can download the data set by clicking on the data set link on the ASDA website. The example replicates the Chapter 11 example of the ASDA textbook. July 15, 2013 ******************************************************************************************; * Example of use of the experimental FCS method of PROC MI * July 15 2013 * Berglund * Data used is for Chapter 11 of ASDA ; ******************************************************************************************; libname d 'f:\brahms\summerclasses\complexanalysis_2013' ; options ls=130 ps=62 nodate nonumber ; data c11 ; set d.impute_subset_nhanes ; * set to those 18 and older for this imputation and also have positive weight for wtmec2yr ; if age18p=1 and wtmec2yr > 0 ; * create combined strata and cluster variable for use in imputation model ; strata_cluster=sdmvstra*10+sdmvpsu ; run ; ods rtf file='f:\brahms\summerclasses\complexanalysis_2013\SAS FCS example.rtf' ; title ; proc means n nmiss mean min max ; run ; proc mi nimpute=0 ; run ; * impute missing data using FCS method with appropriate regression or function ; proc mi data=c11 out=fcs_imp_c11 seed=2013 min= . . . . . . 14 0 . 4 max= . . . . . . 60 5 . 124 ; class riagendr ridreth1 marcat strata_cluster ; fcs regression(bmxbmi bpxdi1_1 indfmpir) discrim(marcat) ; var riagendr ridreth1 wtmec2yr agec agecsq strata_cluster bmxbmi indfmpir marcat bpxdi1_1 ; run ; * check imputed variables ; proc means data=fcs_imp_c11 ; class _imputation_ ; var bmxbmi bpxdi1_1 indfmpir ; run ; proc freq data=fcs_imp_c11 ; tables _imputation_*(marcat ) ; run ; * analyze 5 imputed data sets using PROC SURVEYREG ; proc surveyreg data=fcs_imp_c11 ; strata sdmvstra ; cluster sdmvpsu ; weight wtmec2yr ; by _imputation_ ; class marcat riagendr ridreth1 ; model bpxdi1_1=marcat riagendr ridreth1 agec agecsq bmxbmi indfmpir / solution ; ods output parameterestimates=fcs_reg_out ; run ; proc print data=fcs_reg_out ; run ; data fcs_reg_out_1 ; set fcs_reg_out ; parameter=compress(parameter) ; run ; * use fcs_reg_out_1 with compressed parameter values in PROC MIANALYZE ; proc mianalyze parms(classvar=full)=fcs_reg_out_1 edf=16 ; modeleffects intercept marcat1 marcat2 riagendr1 ridreth11 ridreth12 ridreth13 ridreth14 agec agecsq bmxbmi indfmpir ; run ; ods rtf close ;
Transcript of This example demonstrates use of the SAS FCS (Fully ... FCS Imputation Example.pdf · This example...

This example demonstrates use of the SAS FCS (Fully Conditional Specification) imputation method in PROC MI. This method
is experimental in SAS v9.3 and as such, is not fully supported and may change prior to becoming production. This method
is equivalent to the sequential regression and chained equations methods of IVEware and Stata. The data used is a subset
of cases and variables from the NHANES 2005-2006 data. You can download the data set by clicking on the data set link on
the ASDA website. The example replicates the Chapter 11 example of the ASDA textbook.
July 15, 2013
******************************************************************************************;
* Example of use of the experimental FCS method of PROC MI
* July 15 2013
* Berglund
* Data used is for Chapter 11 of ASDA ;
******************************************************************************************;
libname d 'f:\brahms\summerclasses\complexanalysis_2013' ;
options ls=130 ps=62 nodate nonumber ;
data c11 ;
set d.impute_subset_nhanes ;
* set to those 18 and older for this imputation and also have positive weight for wtmec2yr ;
if age18p=1 and wtmec2yr > 0 ;
* create combined strata and cluster variable for use in imputation model ;
strata_cluster=sdmvstra*10+sdmvpsu ;
run ;
ods rtf file='f:\brahms\summerclasses\complexanalysis_2013\SAS FCS example.rtf' ;
title ;
proc means n nmiss mean min max ;
run ;
proc mi nimpute=0 ;
run ;
* impute missing data using FCS method with appropriate regression or function ;
proc mi data=c11 out=fcs_imp_c11
seed=2013
min= . . . . . . 14 0 . 4
max= . . . . . . 60 5 . 124
;
class riagendr ridreth1 marcat strata_cluster ;
fcs regression(bmxbmi bpxdi1_1 indfmpir) discrim(marcat) ;
var riagendr ridreth1 wtmec2yr agec agecsq strata_cluster bmxbmi indfmpir marcat bpxdi1_1 ;
run ;
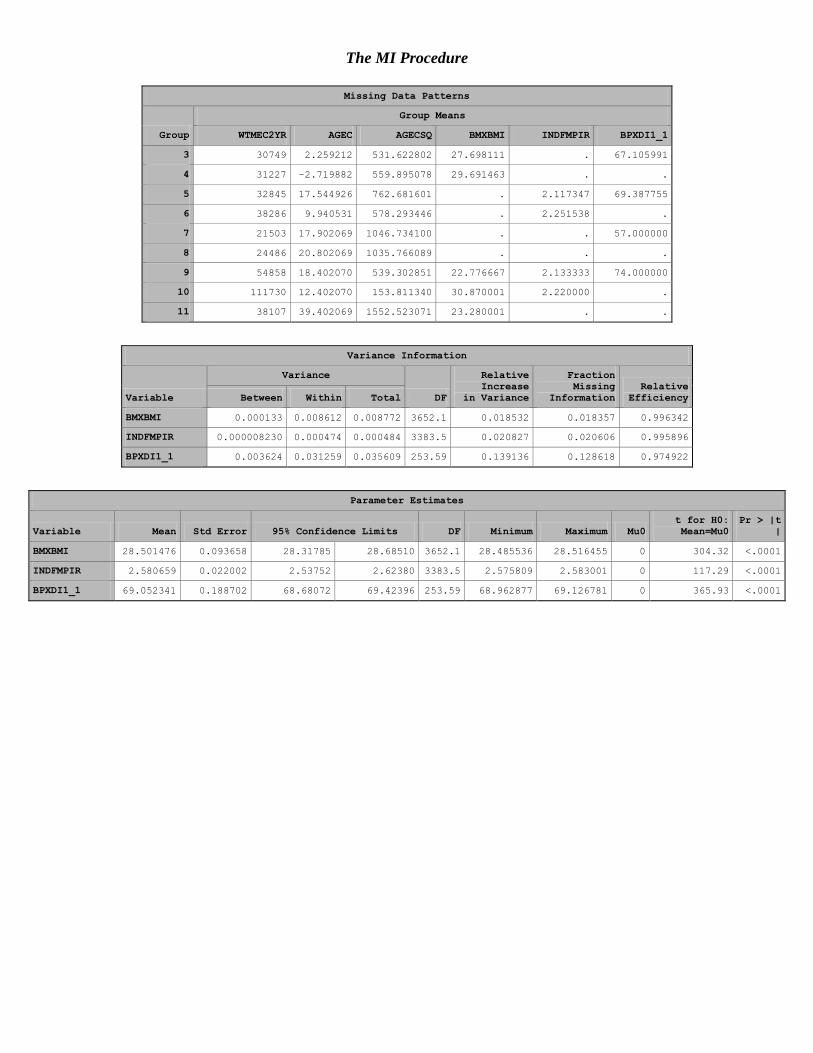
* check imputed variables ;
proc means data=fcs_imp_c11 ;
class _imputation_ ;
var bmxbmi bpxdi1_1 indfmpir ;
run ;
proc freq data=fcs_imp_c11 ;
tables _imputation_*(marcat ) ;
run ;
* analyze 5 imputed data sets using PROC SURVEYREG ;
proc surveyreg data=fcs_imp_c11 ;
strata sdmvstra ; cluster sdmvpsu ; weight wtmec2yr ;
by _imputation_ ;
class marcat riagendr ridreth1 ;
model bpxdi1_1=marcat riagendr ridreth1 agec agecsq bmxbmi indfmpir / solution ;
ods output parameterestimates=fcs_reg_out ;
run ;
proc print data=fcs_reg_out ;
run ;
data fcs_reg_out_1 ;
set fcs_reg_out ;
parameter=compress(parameter) ;
run ;
* use fcs_reg_out_1 with compressed parameter values in PROC MIANALYZE ;
proc mianalyze parms(classvar=full)=fcs_reg_out_1 edf=16 ;
modeleffects intercept marcat1 marcat2 riagendr1 ridreth11 ridreth12 ridreth13 ridreth14 agec agecsq bmxbmi indfmpir ;
run ;
ods rtf close ;

The Means Procedure
Variable Label N
N
Miss Mean Minimum Maximum
SEQN
RIAGENDR
RIDRETH1
INDFMPIR
WTMEC2YR
SDMVPSU
SDMVSTRA
MARCAT
BPXDI1_1
AGE18P
AGEC
AGECSQ
BMXBMI
strata_clust
er
respondent sequence number
gender - adjudicated
1=mex 2=oth hisp 3=white 4=black 5=other
family pir
full sample 2 year mec exam weight
masked variance pseudo-psu
masked variance pseudo-stratum
1=married 2=prev married 3=never married
body mass index (kg/m**2)
5334
5334
5334
5066
5334
5334
5334
5329
4581
5334
5334
5334
5237
5334
0
0
0
268
0
0
0
5
753
0
0
0
97
0
36358.80
1.5198725
2.8710161
2.5923431
40813.74
1.5050619
50.5466817
1.6595984
68.9945427
1.0000000
-0.5079417
406.0373060
28.5119572
506.9718785
31130.00
1.0000000
1.0000000
0
1363.17
1.0000000
44.0000000
1.0000000
4.0000000
1.0000000
-27.5979309
0.1616603
13.3599997
441.0000000
41473.00
2.0000000
5.0000000
5.0000000
156152.18
2.0000000
58.0000000
3.0000000
124.0000000
1.0000000
39.4020691
1552.52
130.2100067
582.0000000

The MI Procedure
Model Information
Data Set WORK.C11
Method MCMC
Multiple Imputation Chain Single Chain
Initial Estimates for MCMC EM Posterior Mode
Start Starting Value
Prior Jeffreys
Number of Imputations 0
Number of Burn-in Iterations 200
Number of Iterations 100
Seed for random number generator 708032001
Missing Data Patterns
Group SEQN RIAGENDR RIDRETH1 INDFMPIR WTMEC2YR SDMVPSU SDMVSTRA MARCAT
1 X X X X X X X X
2 X X X X X X X X
3 X X X X X X X X
4 X X X X X X X X
5 X X X X X X X .
6 X X X X X X X .
7 X X X . X X X X
8 X X X . X X X X
9 X X X . X X X X
10 X X X . X X X X
11 X X X . X X X .
Missing Data Patterns
Group BPXDI1_1 AGEC AGECSQ BMXBMI strata_cluster Freq Percent
Group Means
SEQN RIAGENDR RIDRETH1
1 X X X X X 4308 80.76 36350 1.517874 2.873027
2 X X X . X 49 0.92 36511 1.489796 2.918367
3 . X X X X 666 12.49 36351 1.533033 2.990991
4 . X X . X 39 0.73 36644 1.512821 3.179487
5 X X X X X 3 0.06 35644 1.666667 3.000000
6 . X X X X 1 0.02 40762 1.000000 3.000000
7 X X X X X 217 4.07 36516 1.506912 2.447005
8 X X X . X 4 0.07 39099 1.250000 2.500000
9 . X X X X 41 0.77 35850 1.634146 2.536585
10 . X X . X 5 0.09 36233 1.600000 3.600000
11 . X X X X 1 0.02 34036 2.000000 3.000000
Missing Data Patterns
Group
Group Means
INDFMPIR WTMEC2YR SDMVPSU SDMVSTRA MARCAT BPXDI1_1 AGEC AGECSQ
1 2.622560 42126 1.528319 50.376509 1.636955 69.092851 -0.978618 385.373120
2 2.117347 32845 1.510204 50.673469 1.693878 69.387755 17.544926 762.681601

The MI Procedure
Missing Data Patterns
Group
Group Means
INDFMPIR WTMEC2YR SDMVPSU SDMVSTRA MARCAT BPXDI1_1 AGEC AGECSQ
3 2.454414 37000 1.348348 51.219219 1.753754 . -0.603937 442.466803
4 2.251538 38286 1.487179 49.666667 1.589744 . 9.940531 578.293446
5 2.133333 54858 1.666667 48.000000 . 74.000000 18.402070 539.302851
6 2.220000 111730 1.000000 57.000000 . . 12.402070 153.811340
7 . 30749 1.543779 51.686636 1.764977 67.105991 2.259212 531.622802
8 . 21503 1.500000 47.250000 2.000000 57.000000 17.902069 1046.734100
9 . 31227 1.439024 52.853659 1.878049 . -2.719882 559.895078
10 . 24486 1.200000 48.400000 2.200000 . 20.802069 1035.766089
11 . 38107 2.000000 47.000000 . . 39.402069 1552.523071
Missing Data Patterns
Group
Group Means
BMXBMI strata_cluster
1 28.423888 505.293408
2 . 508.244898
3 29.304339 513.540541
4 . 498.153846
5 22.776667 481.666667
6 30.870001 571.000000
7 27.698111 518.410138
8 . 474.000000
9 29.691463 529.975610
10 . 485.200000
11 23.280001 472.000000

The MI Procedure
Model Information
Data Set WORK.C11
Method FCS
Number of Imputations 5
Number of Burn-in Iterations 10
Seed for random number generator 2013
FCS Model Specification
Method Imputed Variables
Regression WTMEC2YR AGEC AGECSQ BMXBMI INDFMPIR BPXDI1_1
Discriminant Function RIAGENDR RIDRETH1 strata_cluster MARCAT
Missing Data Patterns
Group RIAGENDR RIDRETH1 WTMEC2YR AGEC AGECSQ strata_cluster MARCAT BMXBMI
1 X X X X X X X X
2 X X X X X X X X
3 X X X X X X X X
4 X X X X X X X X
5 X X X X X X X .
6 X X X X X X X .
7 X X X X X X X .
8 X X X X X X X .
9 X X X X X X . X
10 X X X X X X . X
11 X X X X X X . X
Missing Data Patterns
Group INDFMPIR BPXDI1_1 Freq Percent
1 X X 4308 80.76
2 X . 666 12.49
3 . X 217 4.07
4 . . 41 0.77
5 X X 49 0.92
6 X . 39 0.73
7 . X 4 0.07
8 . . 5 0.09
9 X X 3 0.06
10 X . 1 0.02
11 . . 1 0.02
Missing Data Patterns
Group
Group Means
WTMEC2YR AGEC AGECSQ BMXBMI INDFMPIR BPXDI1_1
1 42126 -0.978618 385.373120 28.423888 2.622560 69.092851
2 37000 -0.603937 442.466803 29.304339 2.454414 .
The MI Procedure
Missing Data Patterns
Group
Group Means
WTMEC2YR AGEC AGECSQ BMXBMI INDFMPIR BPXDI1_1
3 30749 2.259212 531.622802 27.698111 . 67.105991
4 31227 -2.719882 559.895078 29.691463 . .
5 32845 17.544926 762.681601 . 2.117347 69.387755
6 38286 9.940531 578.293446 . 2.251538 .
7 21503 17.902069 1046.734100 . . 57.000000
8 24486 20.802069 1035.766089 . . .
9 54858 18.402070 539.302851 22.776667 2.133333 74.000000
10 111730 12.402070 153.811340 30.870001 2.220000 .
11 38107 39.402069 1552.523071 23.280001 . .
Variance Information
Variable
Variance
DF
Relative
Increase
in Variance
Fraction
Missing
Information
Relative
Efficiency Between Within Total
BMXBMI 0.000133 0.008612 0.008772 3652.1 0.018532 0.018357 0.996342
INDFMPIR 0.000008230 0.000474 0.000484 3383.5 0.020827 0.020606 0.995896
BPXDI1_1 0.003624 0.031259 0.035609 253.59 0.139136 0.128618 0.974922
Parameter Estimates
Variable Mean Std Error 95% Confidence Limits DF Minimum Maximum Mu0
t for H0:
Mean=Mu0
Pr > |t
|
BMXBMI 28.501476 0.093658 28.31785 28.68510 3652.1 28.485536 28.516455 0 304.32 <.0001
INDFMPIR 2.580659 0.022002 2.53752 2.62380 3383.5 2.575809 2.583001 0 117.29 <.0001
BPXDI1_1 69.052341 0.188702 68.68072 69.42396 253.59 68.962877 69.126781 0 365.93 <.0001

The MEANS Procedure
Imputation
Number N Obs Variable Label N Mean Std Dev Minimum Maximum
1 5334 BMXBMI
BPXDI1_1
INDFMPIR
body mass index (kg/m**2)
family pir
5334
5334
5334
28.4855364
68.9628773
2.5811610
6.7695059
12.8448401
1.5899941
13.3599997
4.0000000
0
130.2100067
124.0000000
5.0000000
2 5334 BMXBMI
BPXDI1_1
INDFMPIR
body mass index (kg/m**2)
family pir
5334
5334
5334
28.4996719
69.0803907
2.5825689
6.7737226
12.9352557
1.5892538
13.3599997
4.0000000
0
130.2100067
124.0000000
5.0000000
3 5334 BMXBMI
BPXDI1_1
INDFMPIR
body mass index (kg/m**2)
family pir
5334
5334
5334
28.4980382
69.0394673
2.5807545
6.7796662
12.9293061
1.5910268
13.3599997
4.0000000
0
130.2100067
124.0000000
5.0000000
4 5334 BMXBMI
BPXDI1_1
INDFMPIR
body mass index (kg/m**2)
family pir
5334
5334
5334
28.5076781
69.1267813
2.5830015
6.7921296
12.9660188
1.5908836
13.3599997
4.0000000
0
130.2100067
124.0000000
5.0000000
5 5334 BMXBMI
BPXDI1_1
INDFMPIR
body mass index (kg/m**2)
family pir
5334
5334
5334
28.5164555
69.0521899
2.5758088
6.7734906
12.8875637
1.5907886
13.3599997
4.0000000
0
130.2100067
124.0000000
5.0000000
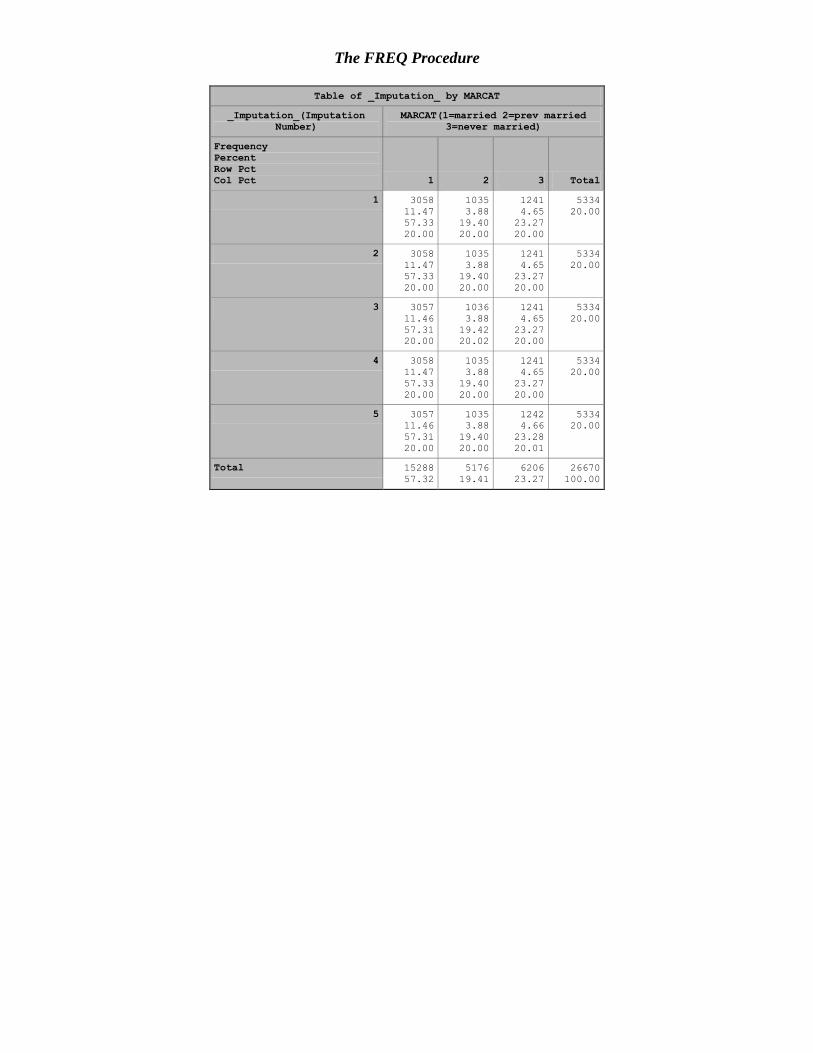
The FREQ Procedure
Table of _Imputation_ by MARCAT
_Imputation_(Imputation
Number)
MARCAT(1=married 2=prev married
3=never married)
Frequency
Percent
Row Pct
Col Pct 1 2 3 Total
1 3058
11.47
57.33
20.00
1035
3.88
19.40
20.00
1241
4.65
23.27
20.00
5334
20.00
2 3058
11.47
57.33
20.00
1035
3.88
19.40
20.00
1241
4.65
23.27
20.00
5334
20.00
3 3057
11.46
57.31
20.00
1036
3.88
19.42
20.02
1241
4.65
23.27
20.00
5334
20.00
4 3058
11.47
57.33
20.00
1035
3.88
19.40
20.00
1241
4.65
23.27
20.00
5334
20.00
5 3057
11.46
57.31
20.00
1035
3.88
19.40
20.00
1242
4.66
23.28
20.01
5334
20.00
Total 15288
57.32
5176
19.41
6206
23.27
26670
100.00

The SURVEYREG Procedure
Regression Analysis for Dependent Variable BPXDI1_1
Imputation Number=1
Data Summary
Number of Observations 5334
Sum of Weights 217700471
Weighted Mean of BPXDI1_1 70.53294
Weighted Sum of BPXDI1_1 1.53551E10
Design Summary
Number of Strata 15
Number of Clusters 30
Fit Statistics
R-square 0.1405
Root MSE 11.4940
Denominator DF 15
Class Level Information
Class Variable Label Levels Values
MARCAT 1=married 2=prev married 3=never married 3 1 2 3
RIAGENDR gender - adjudicated 2 1 2
RIDRETH1 1=mex 2=oth hisp 3=white 4=black 5=other 5 1 2 3 4 5
Tests of Model Effects
Effect Num DF F Value Pr > F
Model 11 262.30 <.0001
Intercept 1 3175.50 <.0001
MARCAT 2 4.42 0.0309
RIAGENDR 1 90.02 <.0001
RIDRETH1 4 3.74 0.0264
AGEC 1 76.98 <.0001
AGECSQ 1 286.40 <.0001
BMXBMI 1 42.65 <.0001
INDFMPIR 1 1.28 0.2755
Note: The denominator degrees of freedom for the F tests is
15.

The SURVEYREG Procedure
Regression Analysis for Dependent Variable BPXDI1_1
Imputation Number=1
Estimated Regression Coefficients
Parameter Estimate
Standard
Error t Value
Pr > |t
|
Intercept 67.0702851 1.49951868 44.73 <.0001
MARCAT 1 0.2522855 0.68287451 0.37 0.7170
MARCAT 2 1.6730076 0.83005894 2.02 0.0621
MARCAT 3 0.0000000 0.00000000 . .
RIAGENDR 1 2.9998082 0.31616607 9.49 <.0001
RIAGENDR 2 0.0000000 0.00000000 . .
RIDRETH1 1 -1.6800212 0.89312861 -1.88 0.0795
RIDRETH1 2 0.5216989 1.52682604 0.34 0.7373
RIDRETH1 3 0.3682412 0.96356299 0.38 0.7077
RIDRETH1 4 1.0884216 0.91298897 1.19 0.2517
RIDRETH1 5 0.0000000 0.00000000 . .
AGEC 0.1177890 0.01342504 8.77 <.0001
AGECSQ -0.0115680 0.00068355 -16.92 <.0001
BMXBMI 0.1866135 0.02857335 6.53 <.0001
INDFMPIR -0.1547323 0.13670372 -1.13 0.2755
Note: The denominator degrees of freedom for the t tests is 15.
Matrix X'WX is singular and a generalized inverse was used to solve the normal equations. Estimates are not
unique.

The SURVEYREG Procedure
Regression Analysis for Dependent Variable BPXDI1_1
Imputation Number=2
Data Summary
Number of Observations 5334
Sum of Weights 217700471
Weighted Mean of BPXDI1_1 70.68743
Weighted Sum of BPXDI1_1 1.53887E10
Design Summary
Number of Strata 15
Number of Clusters 30
Fit Statistics
R-square 0.1479
Root MSE 11.4952
Denominator DF 15
Class Level Information
Class Variable Label Levels Values
MARCAT 1=married 2=prev married 3=never married 3 1 2 3
RIAGENDR gender - adjudicated 2 1 2
RIDRETH1 1=mex 2=oth hisp 3=white 4=black 5=other 5 1 2 3 4 5
Tests of Model Effects
Effect Num DF F Value Pr > F
Model 11 383.66 <.0001
Intercept 1 2281.29 <.0001
MARCAT 2 1.54 0.2463
RIAGENDR 1 69.67 <.0001
RIDRETH1 4 4.73 0.0114
AGEC 1 75.01 <.0001
AGECSQ 1 313.92 <.0001
BMXBMI 1 31.15 <.0001
INDFMPIR 1 1.04 0.3245
Note: The denominator degrees of freedom for the F tests is
15.

The SURVEYREG Procedure
Regression Analysis for Dependent Variable BPXDI1_1
Imputation Number=2
Estimated Regression Coefficients
Parameter Estimate
Standard
Error t Value
Pr > |t
|
Intercept 68.1342118 1.66213534 40.99 <.0001
MARCAT 1 0.3108735 0.60707612 0.51 0.6160
MARCAT 2 1.3135833 0.86033199 1.53 0.1476
MARCAT 3 0.0000000 0.00000000 . .
RIAGENDR 1 2.6897616 0.32225651 8.35 <.0001
RIAGENDR 2 0.0000000 0.00000000 . .
RIDRETH1 1 -2.7445784 0.82470760 -3.33 0.0046
RIDRETH1 2 -1.5084345 1.17073871 -1.29 0.2171
RIDRETH1 3 -0.8684088 0.95451076 -0.91 0.3773
RIDRETH1 4 0.3544943 0.82426815 0.43 0.6733
RIDRETH1 5 0.0000000 0.00000000 . .
AGEC 0.1200999 0.01386669 8.66 <.0001
AGECSQ -0.0120150 0.00067814 -17.72 <.0001
BMXBMI 0.2016632 0.03613057 5.58 <.0001
INDFMPIR -0.1212641 0.11904511 -1.02 0.3245
Note: The denominator degrees of freedom for the t tests is 15.
Matrix X'WX is singular and a generalized inverse was used to solve the normal equations. Estimates are not
unique.

The SURVEYREG Procedure
Regression Analysis for Dependent Variable BPXDI1_1
Imputation Number=3
Data Summary
Number of Observations 5334
Sum of Weights 217700471
Weighted Mean of BPXDI1_1 70.70768
Weighted Sum of BPXDI1_1 1.53931E10
Design Summary
Number of Strata 15
Number of Clusters 30
Fit Statistics
R-square 0.1439
Root MSE 11.4906
Denominator DF 15
Class Level Information
Class Variable Label Levels Values
MARCAT 1=married 2=prev married 3=never married 3 1 2 3
RIAGENDR gender - adjudicated 2 1 2
RIDRETH1 1=mex 2=oth hisp 3=white 4=black 5=other 5 1 2 3 4 5
Tests of Model Effects
Effect Num DF F Value Pr > F
Model 11 518.08 <.0001
Intercept 1 2661.13 <.0001
MARCAT 2 3.56 0.0542
RIAGENDR 1 76.46 <.0001
RIDRETH1 4 5.19 0.0079
AGEC 1 93.12 <.0001
AGECSQ 1 331.66 <.0001
BMXBMI 1 44.75 <.0001
INDFMPIR 1 2.13 0.1653
Note: The denominator degrees of freedom for the F tests is
15.

The SURVEYREG Procedure
Regression Analysis for Dependent Variable BPXDI1_1
Imputation Number=3
Estimated Regression Coefficients
Parameter Estimate
Standard
Error t Value
Pr > |t
|
Intercept 67.0981706 1.65589529 40.52 <.0001
MARCAT 1 0.4217369 0.58182439 0.72 0.4797
MARCAT 2 1.7908206 0.76337193 2.35 0.0331
MARCAT 3 0.0000000 0.00000000 . .
RIAGENDR 1 2.8532415 0.32630560 8.74 <.0001
RIAGENDR 2 0.0000000 0.00000000 . .
RIDRETH1 1 -2.0374045 0.71448659 -2.85 0.0121
RIDRETH1 2 -0.8434731 1.38725761 -0.61 0.5523
RIDRETH1 3 0.3837031 0.94306274 0.41 0.6899
RIDRETH1 4 1.4255478 0.64563753 2.21 0.0432
RIDRETH1 5 0.0000000 0.00000000 . .
AGEC 0.1126007 0.01166867 9.65 <.0001
AGECSQ -0.0117181 0.00064345 -18.21 <.0001
BMXBMI 0.1961471 0.02932021 6.69 <.0001
INDFMPIR -0.1917476 0.13147593 -1.46 0.1653
Note: The denominator degrees of freedom for the t tests is 15.
Matrix X'WX is singular and a generalized inverse was used to solve the normal equations. Estimates are not
unique.

The SURVEYREG Procedure
Regression Analysis for Dependent Variable BPXDI1_1
Imputation Number=4
Data Summary
Number of Observations 5334
Sum of Weights 217700471
Weighted Mean of BPXDI1_1 70.79639
Weighted Sum of BPXDI1_1 1.54124E10
Design Summary
Number of Strata 15
Number of Clusters 30
Fit Statistics
R-square 0.1474
Root MSE 11.5262
Denominator DF 15
Class Level Information
Class Variable Label Levels Values
MARCAT 1=married 2=prev married 3=never married 3 1 2 3
RIAGENDR gender - adjudicated 2 1 2
RIDRETH1 1=mex 2=oth hisp 3=white 4=black 5=other 5 1 2 3 4 5
Tests of Model Effects
Effect Num DF F Value Pr > F
Model 11 201.69 <.0001
Intercept 1 2497.19 <.0001
MARCAT 2 2.82 0.0915
RIAGENDR 1 50.90 <.0001
RIDRETH1 4 3.79 0.0254
AGEC 1 61.42 <.0001
AGECSQ 1 281.56 <.0001
BMXBMI 1 32.19 <.0001
INDFMPIR 1 1.69 0.2134
Note: The denominator degrees of freedom for the F tests is
15.
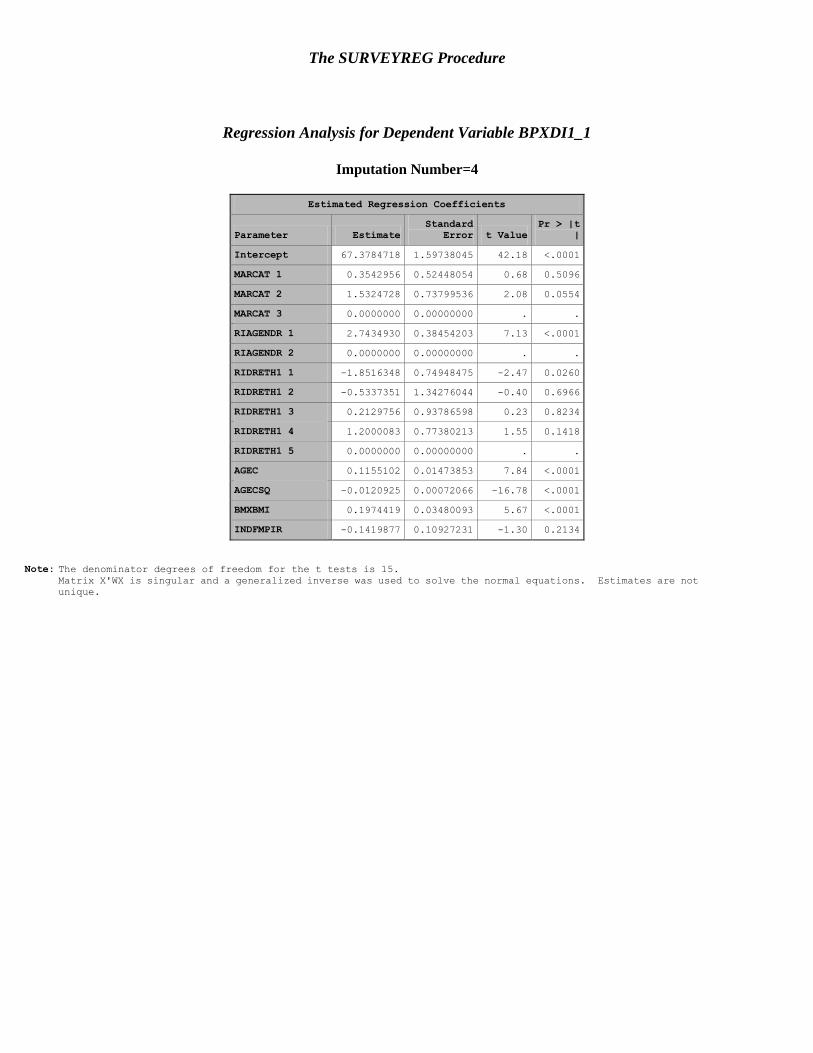
The SURVEYREG Procedure
Regression Analysis for Dependent Variable BPXDI1_1
Imputation Number=4
Estimated Regression Coefficients
Parameter Estimate
Standard
Error t Value
Pr > |t
|
Intercept 67.3784718 1.59738045 42.18 <.0001
MARCAT 1 0.3542956 0.52448054 0.68 0.5096
MARCAT 2 1.5324728 0.73799536 2.08 0.0554
MARCAT 3 0.0000000 0.00000000 . .
RIAGENDR 1 2.7434930 0.38454203 7.13 <.0001
RIAGENDR 2 0.0000000 0.00000000 . .
RIDRETH1 1 -1.8516348 0.74948475 -2.47 0.0260
RIDRETH1 2 -0.5337351 1.34276044 -0.40 0.6966
RIDRETH1 3 0.2129756 0.93786598 0.23 0.8234
RIDRETH1 4 1.2000083 0.77380213 1.55 0.1418
RIDRETH1 5 0.0000000 0.00000000 . .
AGEC 0.1155102 0.01473853 7.84 <.0001
AGECSQ -0.0120925 0.00072066 -16.78 <.0001
BMXBMI 0.1974419 0.03480093 5.67 <.0001
INDFMPIR -0.1419877 0.10927231 -1.30 0.2134
Note: The denominator degrees of freedom for the t tests is 15.
Matrix X'WX is singular and a generalized inverse was used to solve the normal equations. Estimates are not
unique.

The SURVEYREG Procedure
Regression Analysis for Dependent Variable BPXDI1_1
Imputation Number=5
Data Summary
Number of Observations 5334
Sum of Weights 217700471
Weighted Mean of BPXDI1_1 70.64981
Weighted Sum of BPXDI1_1 1.53805E10
Design Summary
Number of Strata 15
Number of Clusters 30
Fit Statistics
R-square 0.1442
Root MSE 11.4369
Denominator DF 15
Class Level Information
Class Variable Label Levels Values
MARCAT 1=married 2=prev married 3=never married 3 1 2 3
RIAGENDR gender - adjudicated 2 1 2
RIDRETH1 1=mex 2=oth hisp 3=white 4=black 5=other 5 1 2 3 4 5
Tests of Model Effects
Effect Num DF F Value Pr > F
Model 11 204.70 <.0001
Intercept 1 2320.54 <.0001
MARCAT 2 3.17 0.0710
RIAGENDR 1 72.37 <.0001
RIDRETH1 4 3.33 0.0384
AGEC 1 84.44 <.0001
AGECSQ 1 315.53 <.0001
BMXBMI 1 24.25 0.0002
INDFMPIR 1 0.02 0.8765
Note: The denominator degrees of freedom for the F tests is
15.

The SURVEYREG Procedure
Regression Analysis for Dependent Variable BPXDI1_1
Imputation Number=5
Estimated Regression Coefficients
Parameter Estimate
Standard
Error t Value
Pr > |t
|
Intercept 67.3277824 1.64788786 40.86 <.0001
MARCAT 1 0.2086344 0.61640150 0.34 0.7397
MARCAT 2 1.5618670 0.86927732 1.80 0.0925
MARCAT 3 0.0000000 0.00000000 . .
RIAGENDR 1 2.6672451 0.31354187 8.51 <.0001
RIAGENDR 2 0.0000000 0.00000000 . .
RIDRETH1 1 -1.3146555 0.73964672 -1.78 0.0958
RIDRETH1 2 0.1243126 1.28368906 0.10 0.9241
RIDRETH1 3 0.4226289 0.81428399 0.52 0.6113
RIDRETH1 4 1.6407827 0.74427952 2.20 0.0435
RIDRETH1 5 0.0000000 0.00000000 . .
AGEC 0.1148625 0.01249975 9.19 <.0001
AGECSQ -0.0119607 0.00067334 -17.76 <.0001
BMXBMI 0.1745127 0.03543502 4.92 0.0002
INDFMPIR -0.0201990 0.12778850 -0.16 0.8765
Note: The denominator degrees of freedom for the t tests is 15.
Matrix X'WX is singular and a generalized inverse was used to solve the normal equations. Estimates are not
unique.

Obs _Imputation_ Parameter Estimate StdErr DenDF tValue Probt
1 1 Intercept 67.0702851 1.49951868 15 44.73 <.0001
2 1 MARCAT 1 0.2522855 0.68287451 15 0.37 0.7170
3 1 MARCAT 2 1.6730076 0.83005894 15 2.02 0.0621
4 1 MARCAT 3 0.0000000 0.00000000 15 . .
5 1 RIAGENDR 1 2.9998082 0.31616607 15 9.49 <.0001
6 1 RIAGENDR 2 0.0000000 0.00000000 15 . .
7 1 RIDRETH1 1 -1.6800212 0.89312861 15 -1.88 0.0795
8 1 RIDRETH1 2 0.5216989 1.52682604 15 0.34 0.7373
9 1 RIDRETH1 3 0.3682412 0.96356299 15 0.38 0.7077
10 1 RIDRETH1 4 1.0884216 0.91298897 15 1.19 0.2517
11 1 RIDRETH1 5 0.0000000 0.00000000 15 . .
12 1 AGEC 0.1177890 0.01342504 15 8.77 <.0001
13 1 AGECSQ -0.0115680 0.00068355 15 -16.92 <.0001
14 1 BMXBMI 0.1866135 0.02857335 15 6.53 <.0001
15 1 INDFMPIR -0.1547323 0.13670372 15 -1.13 0.2755
16 2 Intercept 68.1342118 1.66213534 15 40.99 <.0001
17 2 MARCAT 1 0.3108735 0.60707612 15 0.51 0.6160
18 2 MARCAT 2 1.3135833 0.86033199 15 1.53 0.1476
19 2 MARCAT 3 0.0000000 0.00000000 15 . .
20 2 RIAGENDR 1 2.6897616 0.32225651 15 8.35 <.0001
21 2 RIAGENDR 2 0.0000000 0.00000000 15 . .
22 2 RIDRETH1 1 -2.7445784 0.82470760 15 -3.33 0.0046
23 2 RIDRETH1 2 -1.5084345 1.17073871 15 -1.29 0.2171
24 2 RIDRETH1 3 -0.8684088 0.95451076 15 -0.91 0.3773
25 2 RIDRETH1 4 0.3544943 0.82426815 15 0.43 0.6733
26 2 RIDRETH1 5 0.0000000 0.00000000 15 . .
27 2 AGEC 0.1200999 0.01386669 15 8.66 <.0001
28 2 AGECSQ -0.0120150 0.00067814 15 -17.72 <.0001
29 2 BMXBMI 0.2016632 0.03613057 15 5.58 <.0001
30 2 INDFMPIR -0.1212641 0.11904511 15 -1.02 0.3245
31 3 Intercept 67.0981706 1.65589529 15 40.52 <.0001
32 3 MARCAT 1 0.4217369 0.58182439 15 0.72 0.4797
33 3 MARCAT 2 1.7908206 0.76337193 15 2.35 0.0331
34 3 MARCAT 3 0.0000000 0.00000000 15 . .
35 3 RIAGENDR 1 2.8532415 0.32630560 15 8.74 <.0001
36 3 RIAGENDR 2 0.0000000 0.00000000 15 . .
37 3 RIDRETH1 1 -2.0374045 0.71448659 15 -2.85 0.0121
38 3 RIDRETH1 2 -0.8434731 1.38725761 15 -0.61 0.5523
39 3 RIDRETH1 3 0.3837031 0.94306274 15 0.41 0.6899
40 3 RIDRETH1 4 1.4255478 0.64563753 15 2.21 0.0432
41 3 RIDRETH1 5 0.0000000 0.00000000 15 . .
42 3 AGEC 0.1126007 0.01166867 15 9.65 <.0001
43 3 AGECSQ -0.0117181 0.00064345 15 -18.21 <.0001
44 3 BMXBMI 0.1961471 0.02932021 15 6.69 <.0001
45 3 INDFMPIR -0.1917476 0.13147593 15 -1.46 0.1653
46 4 Intercept 67.3784718 1.59738045 15 42.18 <.0001
47 4 MARCAT 1 0.3542956 0.52448054 15 0.68 0.5096

Obs _Imputation_ Parameter Estimate StdErr DenDF tValue Probt
48 4 MARCAT 2 1.5324728 0.73799536 15 2.08 0.0554
49 4 MARCAT 3 0.0000000 0.00000000 15 . .
50 4 RIAGENDR 1 2.7434930 0.38454203 15 7.13 <.0001
51 4 RIAGENDR 2 0.0000000 0.00000000 15 . .
52 4 RIDRETH1 1 -1.8516348 0.74948475 15 -2.47 0.0260
53 4 RIDRETH1 2 -0.5337351 1.34276044 15 -0.40 0.6966
54 4 RIDRETH1 3 0.2129756 0.93786598 15 0.23 0.8234
55 4 RIDRETH1 4 1.2000083 0.77380213 15 1.55 0.1418
56 4 RIDRETH1 5 0.0000000 0.00000000 15 . .
57 4 AGEC 0.1155102 0.01473853 15 7.84 <.0001
58 4 AGECSQ -0.0120925 0.00072066 15 -16.78 <.0001
59 4 BMXBMI 0.1974419 0.03480093 15 5.67 <.0001
60 4 INDFMPIR -0.1419877 0.10927231 15 -1.30 0.2134
61 5 Intercept 67.3277824 1.64788786 15 40.86 <.0001
62 5 MARCAT 1 0.2086344 0.61640150 15 0.34 0.7397
63 5 MARCAT 2 1.5618670 0.86927732 15 1.80 0.0925
64 5 MARCAT 3 0.0000000 0.00000000 15 . .
65 5 RIAGENDR 1 2.6672451 0.31354187 15 8.51 <.0001
66 5 RIAGENDR 2 0.0000000 0.00000000 15 . .
67 5 RIDRETH1 1 -1.3146555 0.73964672 15 -1.78 0.0958
68 5 RIDRETH1 2 0.1243126 1.28368906 15 0.10 0.9241
69 5 RIDRETH1 3 0.4226289 0.81428399 15 0.52 0.6113
70 5 RIDRETH1 4 1.6407827 0.74427952 15 2.20 0.0435
71 5 RIDRETH1 5 0.0000000 0.00000000 15 . .
72 5 AGEC 0.1148625 0.01249975 15 9.19 <.0001
73 5 AGECSQ -0.0119607 0.00067334 15 -17.76 <.0001
74 5 BMXBMI 0.1745127 0.03543502 15 4.92 0.0002
75 5 INDFMPIR -0.0201990 0.12778850 15 -0.16 0.8765

The MIANALYZE Procedure
Model Information
PARMS Data Set WORK.FCS_REG_OUT_1
Number of Imputations 5
Variance Information
Parameter
Variance
DF
Relative
Increase
in Variance
Fraction
Missing
Information
Relative
Efficiency Between Within Total
intercept 0.186136 2.604080 2.827442 12.919 0.085774 0.081859 0.983892
marcat1 0.007013 0.365682 0.374098 13.969 0.023014 0.022744 0.995472
marcat2 0.031625 0.662437 0.700388 13.407 0.057289 0.055570 0.989008
riagendr1 0.018824 0.111293 0.133882 10.971 0.202966 0.180306 0.965194
ridreth11 0.280565 0.619423 0.956101 7.2036 0.543534 0.388886 0.927836
ridreth12 0.639032 1.815435 2.582273 8.2369 0.422399 0.326039 0.938784
ridreth13 0.301759 0.854313 1.216423 8.2227 0.423862 0.326864 0.938639
ridreth14 0.238896 0.616507 0.903183 7.8418 0.464999 0.349375 0.934689
agec 0.000008238 0.000176 0.000186 13.428 0.056028 0.054386 0.989240
agecsq 4.8249212E-8 0.000000463 0.000000521 12.242 0.125112 0.116644 0.977203
bmxbmi 0.000118 0.001090 0.001231 12.158 0.130056 0.120891 0.976393
indfmpir 0.004155 0.015683 0.020669 9.3801 0.317924 0.262385 0.950140
Parameter Estimates
Parameter Estimate Std Error 95% Confidence Limits DF Minimum Maximum
intercept 67.401784 1.681500 63.76681 71.03676 12.919 67.070285 68.134212
marcat1 0.309565 0.611635 -1.00254 1.62167 13.969 0.208634 0.421737
marcat2 1.574350 0.836892 -0.22808 3.37678 13.407 1.313583 1.790821
riagendr1 2.790710 0.365899 1.98511 3.59631 10.971 2.667245 2.999808
ridreth11 -1.925659 0.977804 -4.22462 0.37330 7.2036 -2.744578 -1.314655
ridreth12 -0.447926 1.606945 -4.13508 3.23923 8.2369 -1.508435 0.521699
ridreth13 0.103828 1.102916 -2.42756 2.63522 8.2227 -0.868409 0.422629
ridreth14 1.141851 0.950359 -1.05740 3.34110 7.8418 0.354494 1.640783
agec 0.116172 0.013650 0.08678 0.14557 13.428 0.112601 0.120100
agecsq -0.011871 0.000722 -0.01344 -0.01030 12.242 -0.012092 -0.011568
bmxbmi 0.191276 0.035091 0.11493 0.26762 12.158 0.174513 0.201663
indfmpir -0.125986 0.143768 -0.44921 0.19724 9.3801 -0.191748 -0.020199
Parameter Estimates
Parameter Theta0
t for H0:
Parameter=Theta0
Pr > |t
|
intercept 0 40.08 <.0001
marcat1 0 0.51 0.6207
marcat2 0 1.88 0.0818
riagendr1 0 7.63 <.0001
ridreth11 0 -1.97 0.0884
ridreth12 0 -0.28 0.7873
ridreth13 0 0.09 0.9273
ridreth14 0 1.20 0.2646
agec 0 8.51 <.0001

The MIANALYZE Procedure
Parameter Estimates
Parameter Theta0
t for H0:
Parameter=Theta0
Pr > |t
|
agecsq 0 -16.45 <.0001
bmxbmi 0 5.45 0.0001
indfmpir 0 -0.88 0.4027


![[MI] Multiple Imputation - Stata](https://static.fdocuments.net/doc/165x107/62039c6dda24ad121e4b6a82/mi-multiple-imputation-stata.jpg)


