This building researc survey is an analysis of
21
PD 035 210 AUTHOP ,Tmtp Dot.yr no PIP DATF MOTE AVATLAPIE ggOM vnPs DRT(77, IFSCPTPTOgS /-DENTIFIFPS DOCUMENT PESUME EF 003 671 Lanadon, v. J.; Scholes, W. P. The Traffic Noise Index: A Method of Controlling Noise Nuisance. B0S-Cg-38-69 Aor AA 20P.; A version of this paper was Published in the Architects' Journal, 1968, Vol. 147, April 17th Publications Officer, Building ° esearch Station, gucknalls Lane, Garston, Watford, Herts, England (single copies free) gDPS Price Mg -$0.25 'C-$1.10 *Acoustical gnvironm?.nt, Acoustic Insulation, *Acoustics, Audition (Physiology), *Building Design, Controlled gnvironmint, Environmental Criteria, Environmental Tnflumces, Motor Vehicles, Planning, Public Facilities, research and Development Centers, goad Construction, :ite Development, Traffic Circulation, Traffi. Control, Traffic Patterns, *vehicular Traffic Building gesearch Station ABSTRACT This building researc survey is an analysis of the social nuisance caused by urban motor ways and their noise. The Traffic Noise Index is used to indicate traffic noises and their effects on architectural designs and planning, while suggesting the need for more and better window insulation and acoustical barriers. Overall concern is for--(1) finding unacceptable noise levels, (2) liscovering how traffic noise is propagated, and (3) determining effective traffic noise control for buildings. Graphs and charts are used to distinguish the relationship between noise levels and distances. (TG)
Transcript of This building researc survey is an analysis of

PD 035 210
AUTHOP,Tmtp
Dot.yr no
PIP DATFMOTE
AVATLAPIE ggOM
vnPs DRT(77,IFSCPTPTOgS
/-DENTIFIFPS
DOCUMENT PESUME
EF 003 671
Lanadon, v. J.; Scholes, W. P.The Traffic Noise Index: A Method of ControllingNoise Nuisance.B0S-Cg-38-69Aor AA20P.; A version of this paper was Published in theArchitects' Journal, 1968, Vol. 147, April 17thPublications Officer, Building ° esearch Station,gucknalls Lane, Garston, Watford, Herts, England(single copies free)
gDPS Price Mg -$0.25 'C-$1.10*Acoustical gnvironm?.nt, Acoustic Insulation,*Acoustics, Audition (Physiology), *Building Design,Controlled gnvironmint, Environmental Criteria,Environmental Tnflumces, Motor Vehicles, Planning,Public Facilities, research and Development Centers,goad Construction, :ite Development, TrafficCirculation, Traffi. Control, Traffic Patterns,*vehicular TrafficBuilding gesearch Station
ABSTRACTThis building researc survey is an analysis of the
social nuisance caused by urban motor ways and their noise. TheTraffic Noise Index is used to indicate traffic noises and theireffects on architectural designs and planning, while suggesting theneed for more and better window insulation and acoustical barriers.Overall concern is for--(1) finding unacceptable noise levels, (2)liscovering how traffic noise is propagated, and (3) determiningeffective traffic noise control for buildings. Graphs and charts areused to distinguish the relationship between noise levels anddistances. (TG)

SfB Ac3
UDC 711.73
The traffic noise index:a method ofcontrolling noise nuisance
APRIL 1968
OO
LL
F J Langdon and W E Scholes
BUILDING RESEARCH STATION
y w' -±"

Current papers
BRS Current Papers are circulated toselected audience groups appropriate toeach subject. Full details of all recentCurrent Papers and other BRS Publica-tions are published quarterly in BRSNEWS. Requests for BRS NEWS or forplacing on the Current Paper mailing listshould be addressed to:
The Publications Officer,Building Research Station,Bucknalls Lane,Garston, Watford, Herts.
Extra copies of this paper are available;a charge may be made for supplies inquantity.
Building Research CURRENT PAPERS areCrown Copyright
-PERMISSION TO REPRODUCE THIS
COPYRIGHTED MATERIAL HAS BEEN GRANTED
BY rgo(IDio,L1Dc_\f(----}-AGcc..0 PoloLtc..,fio4A.
TO ERIC AND ORGANIZATIONS OPERATING C-44-i-c("1UNDER AGREEMFNTS WITH THE II S OFFIIF OF
EDUCATION FURTHER REPRODUCTION OUTSIDE
THE ER:r SYSTEM PEOUIPES PERMISSION OF
THE COPYRIGHT OWNER
THE TRAFFIC NOISE INDEX: A METHOD OF CONTROLLING NOISE NUISANCE
F. J. Langdon, BA, D Phil, and W. E. Scholes, BSc
A version of this paper is published in the Architects' Journal, 1968, Vol. 147,April 17th.
Recent work by the Building Research Station, now in course of publication, hasresulted in a method for assessing social nuisance caused by road traffic noise. Themethod employs a unit termed the Traffic Noise Index which is derived from theweighted combination of two characteristics of the noise. These are the levelsexceeded for 10% and 90% of the time, both averaged over a 24-hour period. Thus asingle value of TNI takes into account a number of factors governing social nuisance,such as the noise produced by the general traffic stream, that coming from individualvehicles and the distance of the reception point from the road.
In the present paper a control criterion, based on the Traffic Noise Index, is putforward and some of the considerations involved in fixing an acceptable level arediscussed. The use of the Index and some of its implications in planning are considered,such as the siting of buildings, the use of increased window insulation, the effects ofacoustic barriers and the rate of traffic flow.
Further research is needed to enable the Traffic Noise Index to be exploited fully inpractice. This work would yield more accurate predictions of traffic noise, of theeffects of barriers and of improvements to window insulation, in a form compatiblewith use of the Traffic Noise Index.
CURRENT PAPER 38/68
BUILDING RESEARCH STATIONMinistry of Public Building and Works

THE TRAFFIC NOISE INDEX : A METHOD OF CONTROLLING NOISE NUISANCE
by 17.J. Langdon, B.A., D. Phil., and W.E. Scholes, B. Sc.
INTRODUCTION
In recent years considerable attention has been given to the problem of noisenuisance caused by road traffic. The Wilson Committee attempted to balance thegeneral desire for a reduction of noise against the practical needs of road transport,and in their report (1) suggested criteria to control the level of traffic noise insidebuildings. These recommendations were of a tentative character and were not basedon field surveys or similar studies.
The first requirement for effective control of traffic noise nuisance is a criterionbased on systematic studies designed to establish the levels of noise at which peopleare likely to find living conditions unacceptable. In the second place, to apply sucha criterion in practice requires a general understanding of how traffic noise is pro-pagated, and of how it is affected by control devices, such as window insulation andacoustic barriers. The Building Research Station is now engaged on a programmeof research to provide information on both of these topics, and has recently publishedthe results of a study which attempts to measure social nuisance and relate it to thelevel of traffic noise (2).
This article is concerned to develop these conclusions, to discuss criteria capable oflimiting nuisance, and to consider some of the design consequences of such controls.It will be understood that as the physical studies of traffic noise propagation have notyet been completed, a number of assumptions have had to be made about the effectsof distance, and in consequence some of the conclusions are subject to qualification.
THE BRS SURVEY
It is known that large fluctuations in traffic flow and the effects of congestion on con-ventional urban roads tend to complicate the measurement of traffic noise, and thaturban motorways offer the best conditions for study (3). As there are insufficientnumbers of sites in this country located on urban motorways, it was decided to basethe enquiry on ordinary main roads in urban areas. It is worth pointing out that theloss of accuracy resulting from more disordered traffic flow may be counterbalancedby the gain in general applicability of the conclusions.
Fourteen sites in the Greater London area were chosen to represent a wide range ofmain road traffic volumes and noise levels. So far as was possible, only roadswhich were free from congestion, straight, level and without intersections, wereselected. The roads were flanked for a sufficient length with rather uniform semi-detached two storey housing, sited parallel to the roadway at distances ranging from7 to 46 metres from the kerbsides.
It will be useful to begin by outlining how the physical values were arrived at. Thenoise levels were measured in dB(A). That is the microphone signals were elec-trically weighted to give a frequency response similar to that of the human ear at lowlevels of intensity. It has been found that in the case of traffic noise, the use of the'A'weighting at all intensity levels results in high correlations with loudness calcu-lated from weighted summations of the noise spectrum (4).
The level of noise fluctuates with traffic flow, both over the 24 hours and duringshorter periods. Even during a short period of a minute or two, it is not possible todescribe the noise level by a single number but only by representative values derivedfrom statistical analysis. Figure 1 shows a typical trace of traffic noise over aperiod of 100 sec. A statistical analysis may be made to yield the levels exceeded in

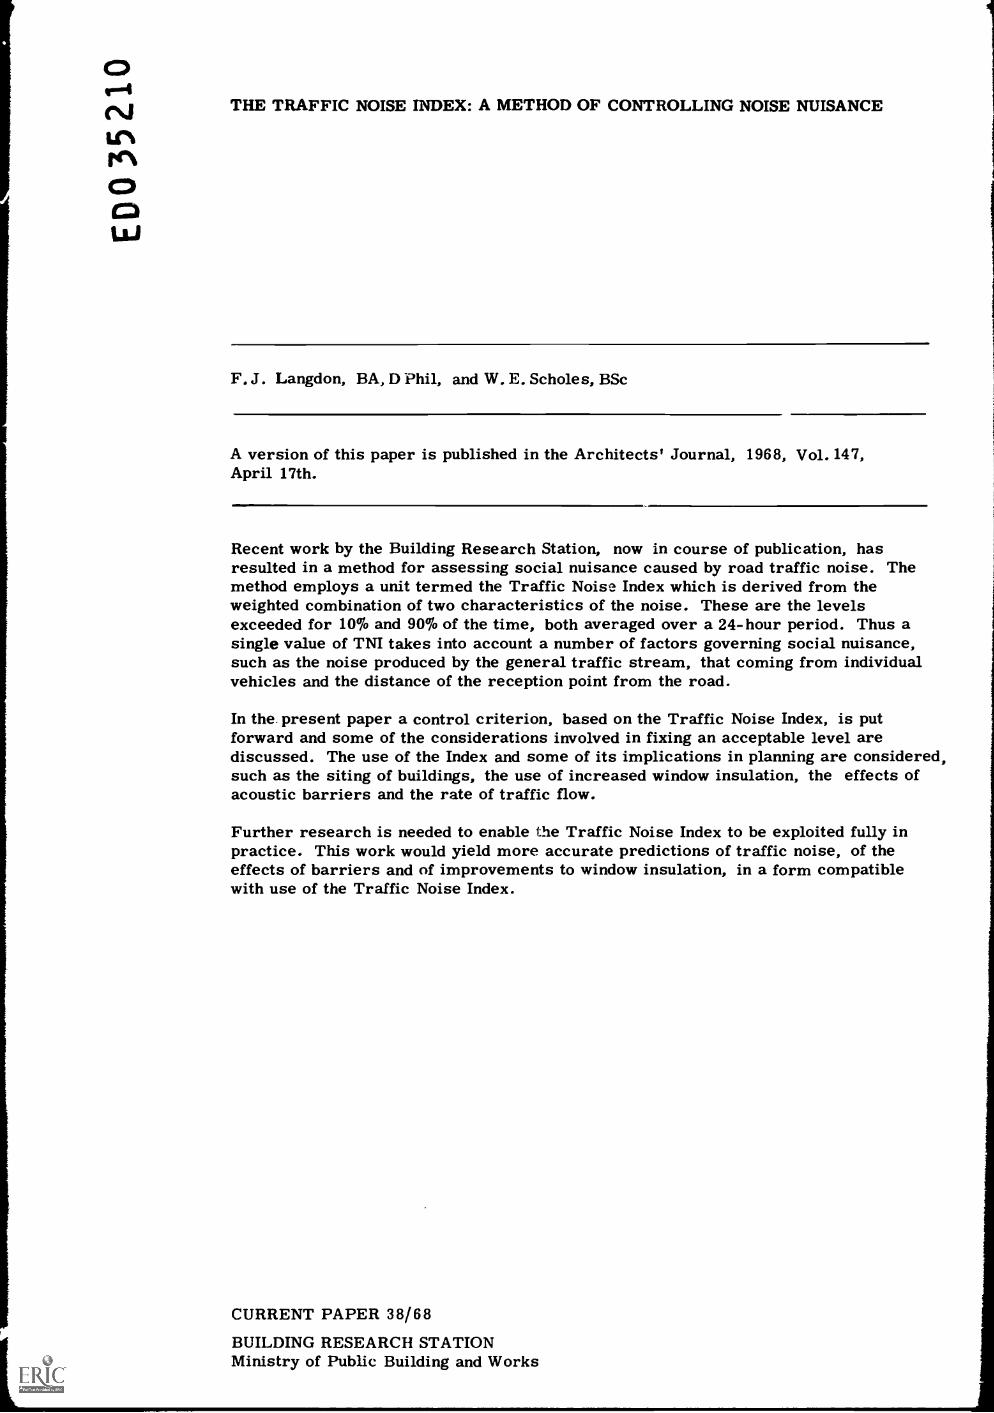
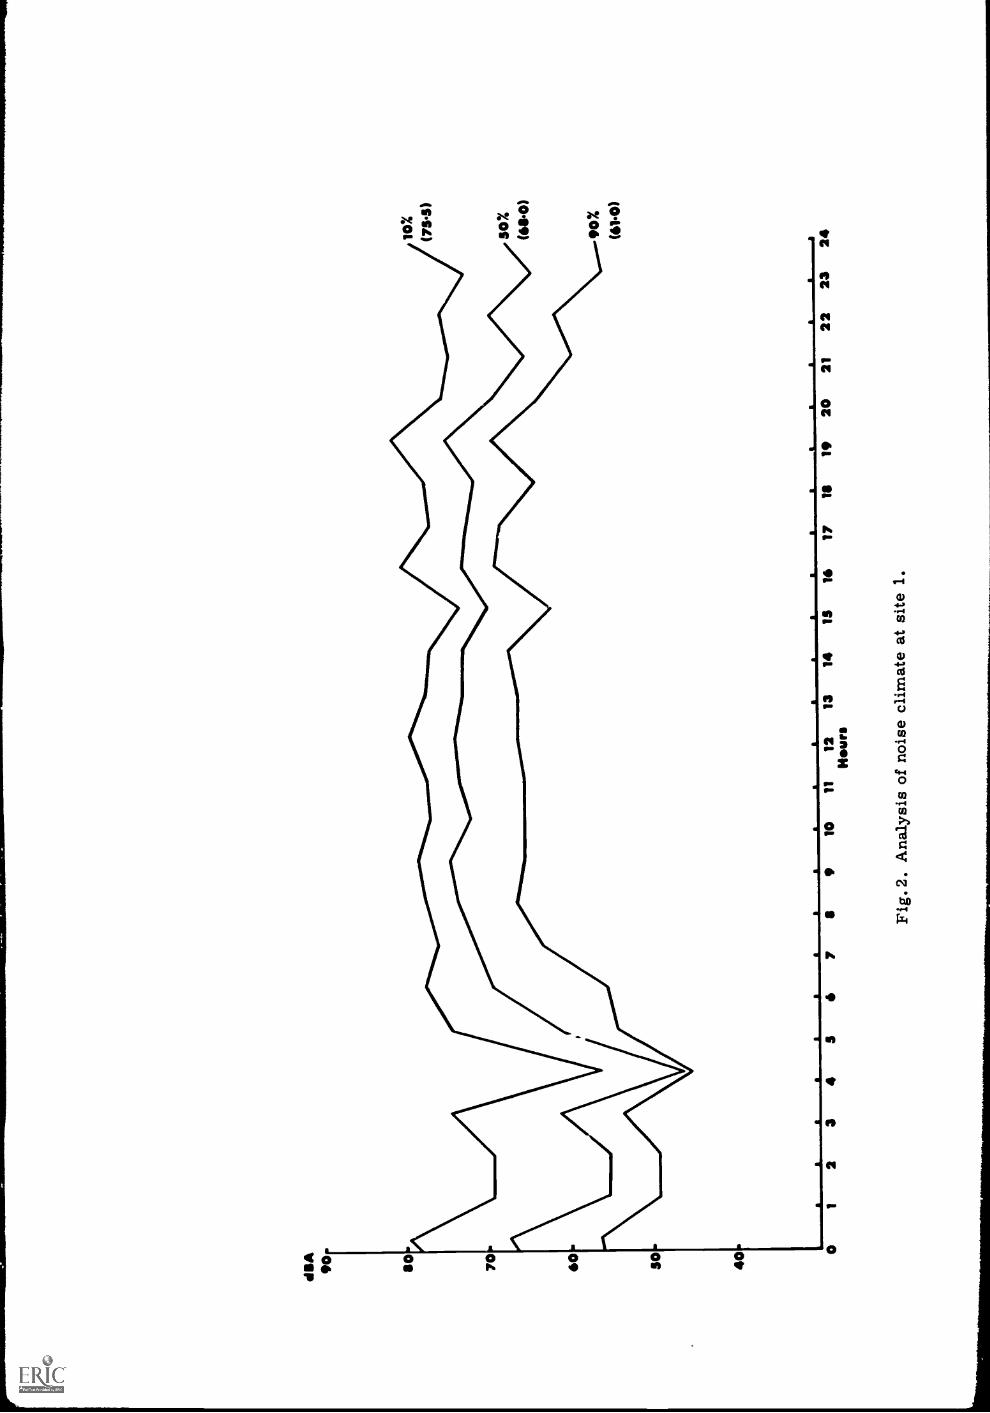
dB(A) for any designated proportion of the time, such as 10, 50 or 90%, as shown inthe figure. The extreme peaks in the trace indicate the passage of particular noisyvehicles during the period measured. They are therefore unique, and taken alone,not a useful quantity. The 10% level may be taken as representative of the averagemaxima, the 50% level indicates the mean value, while the 90% level represents theaverage background. The successive values for these three levels plotted over 24hours, as illustrated in Fig. 2, show the diurnal variations of traffic noise at atypical site.
The propagation of traffic noise is a complex phenomenon which will be discussedlater. For the present it is sufficient to say that errors can arise by makingmeasurements close to the roadway, and extrapolating the results to some receptionpoint. In the BRS survey such errors were avoided by locating the microphone onemetre from the building fa Cade at first floor level. At each site, samples of week-day traffic noise were recorded over a 24-hour period by means of an automaticmechanism installed in one of the houses and linked to the external microphone.
A problem encountered by all studies of noise nuisance, and reported by a number ofinvestigators (5, 6, 7, 8) is the occurrence of wide variations in subjective response.Individual differences in noise tolerance, together with variations in family livingpatterns, make it difficult to achieve high correlations between social and physicaldata. It is particularly necessary to do so where the aim is not merely to show thatnoise levels are related to social nuisance in some way, but to produce criteria of
practical value for prediction. Since it was essential that the sample should beadequate for this type of analysis, 1400 residents were interviewed by means of an
extensively tested questionnaire. This was designed to measure both general dis-satisfaction with traffic noise, and specific nuisances and difficulties occasioned byit. Other questions dealt with topics such as traffic nuisances other than noise, theway in which the dwelling was used, length of residence, and so on.
These results are given at length in the full report of the survey (2). Here thefindings are discussed in more general terms. The most important result of thestudy was to show that no single measure of traffic noise is very closely related tosocial nuisance. Thus the best correlation obtained, which was between the 10%noiselevel and general dissatisfaction, was only 0.6, which merely demonstrates a trendand is quite inadequate for predicting dissatisfaction at any particular noise level.Neither the 90% level nor the mean value yielded significant correlations. An alter-native method of measuring traffic noise has been developed by continentalworkers (9), termed the Q or 'equivalent' noise level. However, correlationsobtained using this method, while higher than those produced using the 10% level,
were still inadequate for practical purposes.
THE TRAFFIC NOISE INDEX
It seemed possible that a higher correlation might be obtained from some combination
of the average 10% and 90% levels, since this would take into account the background
levels against which the maximum levels were heard. A multiple correlation ofvarious combinations of the 10% and 90% levels with the dissatisfaction scale yielded
the highly significant relationship illustrated in Fig.3. The basic combination oflevels which yields this correlation is the 10% level, minus 0.75 of the 90% level.
To make such a combination easier to use in practical noise control, it has beenmodified to the form:
4 x (10% level - 90% level) + 90% level - 30
and this expression has been termed the Traffic Noise Index (abbreviated TNI).
At first sight the TNT as expressed above may appear more complex than the basiccombination of levels. However, it has been found that in the form given it is easierboth to apply, and to understand the noise characteristics involved. Thus the TNIincludes the range of the noise climate, over the 24 hours, together with a smallercontribution from the 90% level representing the average background and which is an
absolute value. The basic combination is multiplied by four in order to eliminate the
need for fractional quantities, and 30 units of TNI are subtracted merely to yield a
convenient numerical scale.
The Traffic Noise Index was derived from data represen',^Arre of traffic noise levelsat the facades of buildings varying in distance from the source, is weighted to take
account of variations in traffic flow, awl correlates highly with general dissatisfaction.
2

Predictions made with its aid are therefore independent of short term variations,such as the level Gf noise at a particular time of day or night. Moreover, TNIvalues may be very simply adjusted to allow for the effects of attenuation withdistance.
CONTROL CRITERIA
As traffic noise measured by TNI correlates very highly (0.88) with the experienceof those exposed to it, the relationship can be plotted as a graph. Figure 3 enablesthe level of dissatisfaction to be predicted for any level of noise indicated on theTM scale. Although the relationship is very close it is not perfect so that there mustremain an area of uncertainty about the exact position of the line plotted on the graphand this is allowed for by indicating limits of confidence shown by the dashed lines.
The solid line shows the best possible prediction from the data taken as a whole.The purpose of a control criterion however, is to enable this prediction to be appliedto a particular case. If the solid line itself were used for this purpose there wouldbe an equal likelihood of conditions being worse than predicted as of their beingbetter. This is avoided by basing the criterion on the lower dashed line, whichautomatically ensures that there is only one chance in forty that dissatisfactionwould be greater than predicted. In deciding at what level of noise a controlcriterion should be set it is therefore advisable always to use the lower 95% confi-dence limit as the guiding line.
Putting forward a noise control criterion means deciding the permissible level ofdissatisfaction, and it is essential to realise that doing so represents a consciousvalue judgement. It would be disingenuous to present results in such a manner as toconvey the impression that the standard put forward was in some unexplained way adirect consequence of the scientific data, though such a procedure is not uncommonin the literature of environmental standards.
There are two main considerations which would appear to govern the choice of acriterion for controlling traffic noise. First, that the social nuisance it causes oughtnot to exceed a level acceptable to a certain proportion of the population. Second,that the measures which may have to be taken to achieve this should be neitherunreasonable nor unduly expensive. Such a criterion is therefore a compromisebetween what is desired and what can be afforded, and this is a question which hasto be settled by public and administrative bodies. However, to show how the TrafficNoise Index may be applied, and to illustrate some of its consequences, the resultsof the survey may be interpreted so as to yield a tentative criterion.
With the foregoing considerations in mind, the noise level of 74 TM has beenindicated in Fig. 3 as representing a reasonable standard of amenity in present dayurban conditions. It may be predicted that at this level there is only one chance inforty that the average person living in the vicinity of main road traffic is likely tobe dissatisfied. On the second consideration, the suggested criterion is satisfied attwo of the sites, whereas any more stringent requirement would fail them all, whilepractical remedial measures are capable of improving conditions at the noisiest siteto meet the criterion.
The suggested criterion is based on the relationship between noise level and generaldissatisfaction, which may be regarded as the sum total of a large number ofparticular discomforts and annoyances. These include such things as difficulty ingetting to sleep and the likelihood of being awakened from it, being compelled to keepwindows closed, or not being able to entertain visitors or listen to the radio incomfort. All these particular complaints are very closely linked with general dis-satisfaction and this is illustrated graphically in Fig. 4. Two sets of conditionshave been plotted, one of living conditions during waking hours, the other during thehours of rest. Each of the specific annoyances has been plotted against the level ofgeneral dissatisfaction. It will be seen that as noise conditions deteriorate almostall residents have to close their windows at some time because of noise. Similarly,an increasing proportion claim to be wakened front sleep. Other activities areaffected, though as may be seen, to a lesser degree. The important point whichthese additional observations illustrate is that at the level of general dissatisfactionsuggested as the basis for the control criterion, less than half of the residents claimto be suffering from any of the particular annoyances reported. Although thesespecific complaints are closely related to general dissatisfaction, not all of themare as closely related to noise level. This is because some of them are affected

only at particular times of day, while the great differences between ways of usingthe home and in family composition tend to obscure any general trend. This is bestrepresented by the scale of general dissatisfaction, and for this reason it is advis-able to use this scale as the basis for any proposed control criterion, rather thanthe degree of interference with a particular activity.
THE PRACTICAL APPLICATION OF THE TRAFFIC NOISE INDEX
A full exposition of how to apply a noise control criterion of this kind would requireprecise knowledge of the way traffic noise is propagated, the effects of buildingfa cades, noise barriers, and so on. At present, much of this is known only in very
5general terms, and further study of these topics is still in progress. Nevertheless,by basing certain fairly simple considerations on the limited data at presc..it avail-able, it is possible to prescribe a number of useful procedures.
1. Effect of distanceThe 10% level attenuates with distance at a greater rate than the 90% level, since thenoise which it represents emanates from particular moving sources close to thereception point, decaying with distance according to the inverse square law. On theother hand, the 90% level is assumed to represent the noise coming from numeroussources distributed along the length of the road and attenuates inversely with distance.Although this is a somewhat over-simplified account of a complex phenomenon, it ispossible to state as a simple working rule, that over moderate distances the 10%level falls by 6 dBA, and the 90% level by 3 dBA each time the distance from thesource is doubled. This is illustrated by Fig. 5 which gives the results of measure-ments made at the side of a motorway up to a distance of 150 metres. These findingsare in agreement with results obtained by Lamure and Auzou (3).
On the basis of these rates of decay the Traffic Noise Index may be applied to theplanning and allocation of land, and also to indicate the need for remedial measuresin existing environments. For this purpose a chart has been constructed whichpredicts values of TNI at various distances from the source, and this is shown inFig. 6.
To use this chart it is necessary to know the noise levels at a point near the source.It will be seen from Fig. 5 that at extremely short distances the 10% and 90% levelsdo not decay at the rates stated above. The traffic noise should therefore bemeasured from a point not less than about 7 metres, and preferably further, fromthe edge of the roadway in order to ensure that reliable values are obtained.
TNI values are best computed from a representative sample of measurementsyielding the 10% and 90% levels over 24 hours. Alternatively, it may be possible toutilise the method recently described by Johnson and Saunders (9) for the predictionof 50%\ levels, and from these to estimate the 10% and 90% levels.
The values obtained in the BRS survey were slightly increased by the circumstanceof the microphone being located one metre from the building face. Values obtainedin the free field therefore need to be corrected to allow for the presence of a building.It is estimated that for this purpose an addition of 3 TNI units to free field measure-ments would suffice. The prediction will then apply to the actual distance at whichit is desired to site a building, despite the fact that the source measurements arebeing made in the free field.
The distance may be read directly from the chart by finding the intercept of the TNIvalue and the distance from source of the measuring point. From this point a lineconstructed parallel with the nearest decay contour will intersect the control criterionlevel at TNI 74. A perpendicular dropped from this point gives the minimum dis-tance from the roadway at which a building may be sited while ensuring acceptableconditions for the occupants.
An imaginary example may be helpful. Assuming the noise were measured 10metres from the roadway, and the value of TNI obtained to be 94, 3 units are addedto allow for the effect of the building fa Cade. Lines from the two axes at 10 metresand 97 TNI are produced to meet, and from this point the contour is followed to reachTM value 74. A perpendicular from this point gives the minimum distance as 32
metres.
4

It is perhaps worth drawing attention to an apparent peculiarity of the TNI scale.Comparing two sites where the 10% noise levels are similar, the site with the lower90% level will be found to yield a higher value of TNI. This seeming paradox isresolved as soon as it is realised that with a lower background noise level morenuisance is occasioned by traffic in the immediate vicinity. The Traffic Noise Index
takes account of these circumstances and this is one reason why it relates closely tothe experience of residents exposed to traffic noise.
2. Effects of extra insulation
While it is useful to be able to calculate such distances for planning purposes, it doesnot follow that it is always possible or most desirable to safeguard standards of
amenity by sacrificing land. In a particular case it may be worthwhile consideringthe alternative of extra sound insulation. From recent work by Scholes and
Parkin (10), it would be reasonable to conclude that approximately 15 dB of extrainsulation may be obtained from acoustic double glazing fitted to conventional two -
storey housing, where the source is close to the ground.
Reference to the definition of TNI above will show that a reduction of 15 units of TNI
may be achieved by reducing both 10% and 90% levels by 15 dB. From the chart itwill also be seen that a difference of 15 units of TNI is equivalent to a halving of the
stance from the source, so that conversion from single to double glazing allows
the halving of this distance while still preserving the same environmental standardswithin the dwelling.
It is therefore possible to consider trading distance for sound insulation by comparing
the value of land not otherwise available with the cost of double-glazed windows,
together with the necessary noise attenuating ventilators. Moreover, it is probablethat attention to the internal layout of the building would e'. -ble the number of roomsrequiring such treatment to be minimised by locating the aximum number of roomsrequiring quiet on the side away from the noise source.
The reduction in noiE e level resulting from double-glazing has been given in unitsof TNI, making possible a cost comparison with distance as a means of noise control.While the Traffic Noise Index is a measure of external noise level, it is equallyapplicable to internal conditions modified by acoustic treatment, since the effect ofsuch treatment is to reduce the internal level to what it would have been with a lowerexternal level.
The report of the Wilson Committee proposed environmental standards for trafficnoise control based on the 10% noise level, giving suggested criteria in the form of
internal values. The internal noise level produced by road traffic will be influencedby whether windows are open or closed. In the publication referred to, Scholes andParkin state that typical insulation values against broad band noise for ordinarywindows are 14 or 25 dBA, according to whether they are open or closed. As it isdifficult to know exactly how occupants actually use their windows, an internallymeasured unit of traffic noise, or a control criterion defined in such terms, wouldappear a variable quantity of dubious significance. This was in fact a major con-sideration prompting the choice of an external value in the BRS survey, and also one
reason why comparisons with Wilson Committee Standards are difficult to make.
None of the housing covered by the BRS study was specially treated, and the degreeof dissatisfaction expressed by the occupants is that which arises in the context oftheir customary practice of opening windows as circumstances indicate. The prob-lem of relating external to internal noise levels may therefore be ignored, whetherin the case of planning new development or improving conditions in existing property,for the point at which such action needs to be taken is determined solely by theexternal noise level.
With normal glazing and natural ventilation, the internal noise climate will vary with
the opening and closing of windows. The installation of sealed double-glazingremoves this source of variation.
It might be argued that, to apply acoustic treatment where the suggested noisecriterion is marginally exceeded world result in internal standards superior to those
in untreated dwellings where the external conditions satisfied the criterion level.However, this apparent anomaly is an eventuality to which all general criteria arenecessarily subject, since it is hardly ever possible to provide just enough and nomore improvement for each individual case.

In practice it is possible to consider graded levels of treatment. For example,simple fixed glazing with a powered fan having a small cross-sectional area willprovide better insulation than an open window. In all cases, the principle remainsthe same; namely, the action taken should be that required to bring the internalnoise level to what it would have been in a dwelling with single glazing had thesuggested criterion not been exceeded externally.
3. Effects of barriersAn entirely different approach to the problem is the employment of acoustic barriers.At present it is difficult to make precise statements about this topic, for the effectsof barriers, being determined by large numbers of factors, are not easy to predictin other than very general terms. Part of the study of traffic noise propagationbeing carried on at BRS is devoted to quantifying these factors so that the perform-ance of barriers may he evaluated. Such factors include the source to barrierdistance, the effect of source width, the receiver to barrier distance, the relativeheights of source, barrier and reception point, the nature of the terrain and thedesign of the barrier.
From work already carried out, and from results reported elsewhere (11, 12), it hasbeen suggested that a barrier 4 to 5 metres high, located close to the traffic stream,can reduce the noise level within the sound shadow thus created by 10 dBA or more.However, since this article is concerned with the application and consequences ofthe Traffic Noise Index rather than with comprehensive discussion of traffic noisecontrol, at present somewhat premature, it is sufficient to draw attention to one ofthe consequences of this index in relation to acoustic barriers.
It is known that the effectiveness of a barrier is greatest when both source andreceiver distances are small, and that it declines as either of these is increased.Consider the case in which noise emanating from a single moving vehicle reachesa fixed point at the side of a road along which a barrier has been constructed.During the approach of the vehicle, the distances between the source and the barrier,and the barrier and the receiver are greater than when the vehicle is at the pointclosest to the receiver. As the vehicle continues on its course, these distances willagain increase. It may therefore be expected that a barrier will give a greaternoise reduction for nearby traffic than for traffic which is approaching or receding.
It has already been pointed out that the 10% levels are chiefly the result of localconcentrations of vehicles close to the reception point, while the 90% levels arecaused by traffic distributed along the length of the road. In consequence, barriersmay be expected to reduce the 10% level more than the 90% level, in their shadowregion. If it were assumed that a barrier reduced the 10% level by, for example,10 dBA and the 90% level by 5 dBA, the definition of the Traffic Noise Index indicatesthat the reduction would be 25 TNI units. While it is not yet possible to give actualvalues for the relative disparity in attenuation of the average 10% and 90% levelsover 24 hours, it would seem that a barrier is likely to reduce social nuisance moreeffectively than window insulation giving an equal amount of attenuation as measuredby the 10% noise level. For the effect of the Traffic Noise Index, which is moreclosely related to social nuisance, is to weight the calculation in favour of thebarrier. In addition to this apparent, though not yet proven advantage, barriershave also the effect of improving the external as well as the internal environment.
4. TNI and traffic volume
Whatever means of noise control are adopted in any particular case, it is necessaryto begin with some known value of TNI with which the required value may becompared. The way in which these values may be obtained has already been des-cribed, but there remains the case where this is not possible. An example wouldbe where no road at present exists, or a route development is planned and it isnecessary to consider the use of neighbouring land or judge the need for noisecontrol measures.
It would be very convenient to be able to predict an expected TNI value on the basisof road capacity or anticipated traffic volume, even if only very approximately atthis stage of planning. A number of investigators have produced curves relatingtraffic volume to noise level. Stephenson and Vulkan (13) have published data forurban roads using the 50% noise level, while Meister (14) and Lamure and Auzou (3)have produced curves based on motorways for levels ranging from 1% to 99%.While the sum total of this work is to demonstrate that for traffic with a normal
6

proportion of heavy vehicles the relationship is close enough for predictive purposes,none of it is relevant to the present discussion, since it is all based on relativelyshort periods of vehicle - counting and noise-recording at particular times of day.As against this, the Traffic Noise Index is a measure of the noise climate over the24 hours, and derives its predictive power from relating this to the human responseto the general traff, noise sitnation. To predict social nuisance by means ofmeasured or anticipated traffic volume through the agency of the Traffic Noise Indextherefore requires a representative count of vehicle flow, related to noise measure-ments over the 24 hours.
The only data of this kind which exists at present is that gathered in the course ofthe BRS survey, and as it is drawn from a small number of sites the correlationsderived from it will not be very high. Nevertheless, from the sites used in themain survey a correlation of 0.76 is obtained between traffic volume and TNI, whichis statistically significant, and adequate for a rough prediction to be made. Theresults of this procedure are given in Fig. 7 which shows expected levels of noisefor traffic flows over 24 hours, grouped into five bands ranging from 1000-4000 to32 000-45 000 vehicles per day.
The range of prediction within each band of traffic volumes is that of the 95% limitof confidence; that is to say, there is only one chance in twenty that for each band, thenoise levels would fall outside the limits of the range. While the estimates whichcan be derived from this data are somewhat crude they are not altogether useless.Nevertheless, they are given here as an indication that such estimates are possiblerather than for practical use. If the Traffic Noise Index is to be applied as aplanning tool in this way, the continued collection of vehicle flow and noise level datais necessary. Given sufficient information of this kind there is every reason tobelieve that a high degree of predictive accuracy is attainable.
In conclusion it needs to be once more emphasized that what has been discussed isonly the partial outrome of a research effort on a much broader froi:t. From whathas been said, and particularly from what has been left unsaid, it may be deducedthat much remains to be done in order t provide the planner with effective tools ofnoise control. Despite this, it may be claimed that the Traffic Noise Index repre-sents an advance towards the solution of a widespread and difficult problem.
AC KNOW LEDGE ME NT
This study was financially assisted in part by the Ministry of Transport.

REFERENCES
1. Anon. Final Report of the Committee on the problem of noise, Cmd 2056,HMSO, 1963.
2. Griffiths, I. D. , and F. J. Langdon. Subjective response to road traffic noise.J. Sound Vib. (in press 1968): BRS Current Papers, CP 37/68.
3. Auzou, S. , and C. Lamure. Le bruit aux abords des autoroutes. Cahiers duCentre Scientifique et Technique du Batiment No. 78, Feb. 1966.
4. Parkin, P. H. On the accuracy of simple weighting networks for loudnessestimates of urban noises. J. Sound Vib. 2 (1), 86-88, 1964.
5. McKennell, A. C. Aircraft noise annoyance around London (Heathrow) Airport.Government Social Survey S5337, 1963.
6. McKennell, A. C. , and E. A. Hunt. Noise annoyance in Central LondolA.Government Social Survey SS332, 1966.
7. Keighley, E. C. The determination of acceptability criteria for office noise.J. Sound and Vib. Vol. 4 (1), 73-87, 1966.
8. Langdon, F. J. A study of annoyance by noise in automatic data processingoffices. J. Build Sci. Vol. 1 (1), 68-78, 1965.
9. Johnson, D. R. and E.G. Saunders. The evaluation of noise from freelyflowing traffic. Aero Report AC 29. National Physical Laboratory, August,1967.
10. Scholes, W. E. , and P. H. Parkin. The insulation of houses against noise fromaircraft in flight. Applied Acoustics, Vol. 1 (1), 37-46, 1968.
11. Rucker, A., and K. Gluck.(a) The propagation and suppression cf road traffic noise in built up areas.
Strassenbau und Strassenverkehrstechnik, Heft 32, (Eng. trans.) BRSLibrary Communication No. 1314.
(b) Structural design features for reduction of traffic noise. (German)Strassenbau und Strassenverkehrstechnik, Heft 47, 1966.
12. Aunap, G. Bauliche M8glichkeiten zur Verminderung des Verkehrslgrms anStrassen. Bau-maschine und Technik, Heft 2, 1-8 Feb., 1965.
13. Stephenson, R. J. , and G. H. Vulkan. Urban planning against noise. OfficialArch. and Planning. May, 1967.
14. Meister, F. J. Die LgrmdUmmung im Strassenverkehr. VDI-Zeitschrift, 106(23), 1165-73, 1964. BRS Library Communication No. 1248.
8

06O
SSi
00opm
eses011
OP
0001
tIII11/4 11111%
Ifva
1N
M 111011%
Mat a
1111,./Mif.
IMM
O
.........................ara.lan was........./...m
Mum
(IS
A90 S
O 70 0 40
10%
(75.
5)
so%
(641
.0)
90%
4141
12
34
54
7S
910
1112
1314
1514
171$
1920
2122
2324
Hou
rs
Fig.
2. A
naly
sis
of n
oise
clim
ate
at s
ite 1
.

102 9$ 94 90
T. N
.1.
$6 2 7$ 74 70 66 62 Si
50%
Ile
cri
teri
on
7ea
7' X
7'
-,'/
./e
es W
et s
urve
y si
tes
xs m
ein
surv
ey s
ites
corr
elat
ion
( x
site
s on
ly)
r11
18
P4 C
M
Dis
salis
fact
ion
scor
e:1.
02.
03,
044
306-
0a.
aa
perc
entil
es:
010
2340
5060
75
Fig.
3. R
elat
ions
hip
betw
een
TN
I an
ddi
ssat
isfa
ctio
n w
ith tr
affi
c no
ise.
a

X.O.100
90
SO -
70
60
50
40 -
30 -
20
0 at some time
x when rseolving visitors
4)----- when listening to the midis
when having MOWS
.-7 0,0 V
O V # *7 /.i . ./ o6 .X .e '
#/A
e
/ 0 ..°
0 , 2'10 C.'" I0-
la
%age100
90
SO
70-
60
SO
40,-
30
20-
10 -
0
III11.0 10 20 30 40 30 0 70 SO 0 100
dissatisfaction percentiles
Sometimes woken by a(:).-- maims from the road
Shop with windows openin summer onlyx
#
0
x
A a l_ A 1.
O 10 20 30 40 SO 60 70 SO 90 100dissatisfaction porcentiles
Fig.4. Measures of disturbance by noise - percentages of informants(top) having to close windows at various times, and(bottom) woken by noise from the road and sleeping with windows open.

90e
SO
dSA
70 60 SO 40
(Mea
sure
d T
raffi
c F
low
220
0 v.
p.h)
se.,
...
90%
......
90.- a
...a.
ara,
.....
- 41
.am
mo
ara,
.....
...,
..11. ...
...
..a.
..a.
.....
..e.
....,
.16.
,...
...
N.
S.
.. S....
.S.
....
S...a
.S.
S.S.
....
ara,
S..0
....
...a
....
.....
....
,...
....
..ar
a,...
...
alia
.10,
......
....
...
Or
fie..a
.I
.....
_ -. ..
.....
..i
linvo
ree)
1020
40S
O16
0m
etre
s
Fig.
5. A
ttenu
atio
n of
noi
se w
ith d
ista
nce.

T.N
J.
50%
ile o
fdi
ssat
isfa
ctio
n
deca
y w
ith (
dist
ance
11,.
710
2030
4060
Dis
tanc
e fr
om r
ead
(met
res)
SO
100
Fig.
6. M
inim
um a
ccep
tabl
e di
stan
ce f
rom
roa
d at
any
noi
se le
vel.
200


Current papers- recent issues
CP 1/68CP 2/68CP 3/68
CP 4/68
CP 5/68
CP 6/68CP 7/68
CP 8/68
CP 9/68
CP10/68
CP11/68
CP12/68
CP13/68
CP14/68
CP15/68
CP16/68
CP17/68
CP18/68
CP19/63
CP20/68
CP21/68
CP22/68
CP23/68
CP24/68
BRS and the industryAppraisal of building requires knowledge and thought. Flora W. BLACK
Analysis of sulphate-bearing soils in which concrete is to be Rlaced.S. R. BOWDEN
Window design criteria to avoid overheating by excessive solar heatgains. A. G. LOUDON
Producing building components by spray techniques. E. KEMPSTERand R. WANDER
Timber content of two-storey houses. J. E. ATKINSON and C. R. HONEY
Trial of plastics pipes for hot water services. J. R. CROWDER andA. RIXON
Dimensional variations: frame structures for schools. T. R. HARDWICKand R. M. MILNER
The CEEB recommendations and the structural use of lightweight concrete.A. SHORT
Pumpability of mortars. E. KEMPSTER
A survey of crushed stone sands for concrete. D. C. TEYCHENNE
Dies for extruding perforated bricks. B. BUTTERWORTH, L. W. BALDWINand S. G. COLEY
An apparatus for forming uniform beds of sand for model foundationtests. B. P. WALKER and T. WHITAKER
Developments in production of concrete panels. K. J. SEYMOUR-WALKER
A simple glass-fibre drawing apparatus. R. C. DE VEKEY andA. J. MAJUMDAR
Vertically cast L-shaped panels. K. J, SEYMOUR-WALKER
High temperature studies on individual constituents of high - aluminacements. A. J. MAJUMDARTheoC form of calcium sulphate. W. H. GUTT and M. A. SMITH
The mineralogy of set high-alumina cement. H. G. MIDGLEY
Shear connectors in steel-concrete composite beams for bridges.R. J. MAINSTONE and J. B. MENZIES
Shear connectors in steel-concrete composite beams for bridgesand the new C. P. 117 Part 2. R. J. MAINSTONE
Infill panels of no-fines concrete. L. G. SIMMS
Pedestrians and vehicles on housing estates: a user study.A. MILLER and J. A. COOK
Effect of source height on sound propagation. W. E. SCHOLES andP. H. PARKIN

Current papers recent issues
CP25/68 Building occupations and training. J. Pa NELSON, R. E. JEANESand E. W. F. WARRINGTON
CP26/68 Apparatus for testing tensile strengths of corroded glass fibres.R. S. GILLETT and A. J. MAJUMDAR
CP27/68 Studies of the sub- system CaO -CaO. Si02- CaSO4. W. H. GUTT andM. A. SMITH
CP28/68 House-building productivity in U. S. A. Roberta SHIPPAM
CP29/68 Foundations for storage tanks on reclaimed land at Teesmouth.A. D. M. PENMAN and G. H. WATSON
CP30/68 Strength measurements on stiff fissured Barton clay from Fawley(Hampshire). A. MARgT _ANTI and M. F. BUTLER
CP31/68 Metrology and the module. J. E. EDEN
CP32/68 The output of bricklayers. W. S. FORBES and J. F. MAYER
CP33/68 The use of small specimens for measuring autoclave expansion ofcements. S. S. REHSI and A. J. MAJUMDAR
CP34/68 British and Continental standards compared for domestic fittings andequipment. B. F. HOWELL
CP35/68 Insulation against aircrsft noise. W. E. SCHOLES and P. H. PARKIN
CP36/68 Battery- cast cladding panels. C. N. CRAIG
CP37/68 Subjective response to road traffic noise. I. D. GRIFFITHS andF. J. LANGDON
CP38/68 The traffic noise index: a method of controlling noise nuisance.F. J. LANGDON and W. E. SCHOLES
CP38/68