Third Quarter Report 2015 · 2 Third Quarter Report 2015 Odfjell SE - Consolidated Highlights...
21
Transcript of Third Quarter Report 2015 · 2 Third Quarter Report 2015 Odfjell SE - Consolidated Highlights...


2
Third Quarter Report 2015 Odfjell SE - Consolidated
Highlights
Continued improved operational performance, net result of USD 7 mill.
Chemical Tankers EBITDA was USD 46 mill compared with USD 42 mill in second quarter. EBITDA includes negative effects from bunker derivatives of USD 17 mill.
Odfjell chemical freight index (ODFIX) up 1% compared with previous quarter.
Cost-cutting and efficiency programme is on schedule.
Stable and slightly improved results from Odfjell Terminals.
Harald Fotland appointed new Head of Odfjell Tankers.
Key financial figures
Proportionate method1
(USD mill, unaudited) 2Q15 3Q15 3Q14 YTD15 YTD14 FY14
Total revenue 279. 276. 292.. 815. 885. 1 160. Chemical Tankers 247. 244. 263.. 720. 795. 1 042. Tank Terminals 28. 28. 23.. 82. 70. 94. Gas Carriers 5. 4. 7.. 13. 20. 25. EBITDA 53. 57. 31.. 145. 63. 96. Chemical Tankers 42. 46. 26.. 114. 67. 97. Tank Terminals 10. 10. 4.. 28. (6) (4) Gas Carriers 1. 1. 1.. 3. 2. 3. EBIT 12. 26. 5.. 43. (25) (20) Chemical Tankers 10. 24. 3.. 37. (2) 3. Tank Terminals 2. 2. (5) 4. (29) (31) Gas Carriers 1. 0. 7.. 2. 7. 8. Net finance (5) (18) (16) (60) (45) (71) Net result (loss) 7. 7. (9) (18) (57) (75) Chemical Tankers 7. 8. (5) (14) (34) (48) Tank Terminals (0) (1) (9) (5) (27) (33) Gas Carriers 1. 0. 5.. 1. 4. 6.
¹ While the equity method provides a fair presentation of the Group’s financial position in joint ventures, the Group's internal financial segment reporting is based on the proportionate method. A large part of the Group's activity is joint ventures; hence, the proportionate method provides more detailed information and thus, a more representative picture of the Group's operations.

3
Business segments
Chemical Tankers
Earnings in the third quarter have developed in line with second quarter. The CPP market remained firm during most of the quarter and continued to attract swing tonnage, which contributed to tighter supply/demand balance for chemical carriers. Port congestion continues to be a challenge. There has not been any significant disruption to the operation of our vessels during the period. On average, fuel prices were USD 313.20 per tonne in third quarter, down from USD 385.50 per tonne the previous quarter. The OPEX for the average fleet during third quarter has continued to decrease, and has so far in 2015 been reduced by 18% compared with average OPEX in 2014. The CPP market appears to be softening, which in addition to lower earnings for our CPP activities may entice some of the swing tonnage to move over to easy chemicals and thus, tightening the competition in this segment. Earnings in fourth quarter are therefore expected to be lower than in the two previous quarters.
Indices 30.06.15 30.09.15 30.09.14 31.12.14
Odfix (1990 =100)1 140 141 122 137
Opex (2002 = 100)² 127 125 156 152
¹ The Odfix index is a weighted time-charter earnings index for a selection of vessels.
² The Opex index includes owned and bareboat chartered vessels.
Fleet changes
In November we sold for recycling Bow Victor, a 33,000 dwt stainless steel chemical tanker built in 1986. Odfjell has no chemical tankers on order. Fleet additions (last 12 months) DWT Built Tanks Transaction
May 2015 Horin Trader 19,856 2015 Stainless Medium-term TC
April 2015 Marex Noa 12,478 2015 Stainless Long-term TC
March 2015 Gion Trader 19,883 2015 Stainless Medium-term TC
January 2015 Bow Triumph 49,600 2015 Coated Owned
October 2014 Bow Trident 49,600 2014 Coated Owned
Short-term: Up to one year Medium-term: 1-3 years Long-term: 4-10 years
Chemical Tankers (USD mill) 2Q15 3Q15 3Q14 YTD15 YTD14 FY14
Revenues 247 244 263 720 795 1,042 Gross Result 64 65 51 177 141 190 EBITDA 42 46 26 114 67 97 EBIT 10 24 3 37 (2) 3 Bunker price per tonne (USD) before hedging 436 445 565 452 563 567

4
Fleet disposals, owned, (last 12 months) DWT Built Tanks Transaction
November 2015 Bow Victor 33,000 1986 Stainless Sale
August 2015 Bow Bracaria 5,846 1997 Stainless Sale
July 2015 Bow Brasilia 5,800 1997 Stainless Sale
July 2015 Bow Balearia 5,846 1998 Stainless Sale
Gas Carriers
In the third quarter, activity in all main gas carrier markets slowed down more than expected, which negatively affected the result for Odfjell Gas AS by more idle time for the pool vessels. Improvements are expected for the fourth quarter, in line with the results for 1st half of the year. Gas Carriers (USD mill, Odfjell share) 2Q15 3Q15 3Q14 YTD15 YTD14 FY14
Revenues 5 4 7 13 20. 25 Gross Result 1 1 1 3 4. 5 EBITDA 1 1 1 3 2. 3 EBIT 1 0 7 2 7. 8
Fleet changes
Odfjell Gas has eight LPG/Ethylene vessels on order. The construction of 4 x 17,000 cbm and 4 x 22,000 cbm is significantly delayed and we are in discussions with the yard.
Tank Terminals
Odfjell’s shareholding in the tank terminals business delivered an EBITDA of USD 9.9 mill in the third quarter, up from USD 9.6 mill in the previous quarter. Performance was driven in part by revenues at our PID distillation unit in Rotterdam and continued high demand for spot and mid-term storage due to contango in the oil market. Additional available capacity at our terminals in Houston and Charleston contributed to a slight increase in the EBITDA of our North American terminals. Odfjell Terminals (Rotterdam)’s PID business and the reorganization strategy implemented last year have improved the results further, and the EDITDA was improved further to negative USD 0.76 mill compared with negative USD 1.6 mill in the previous quarter. Furthermore, the cash flow at all terminals improved due to the cost saving plans implemented last year. The occupancy rate for commercially available space of the Tank Terminal Group as a whole stands at 94%, up from 92% last quarter, also with a slight increase in the available capacity in the period. Our terminal in Tianjin, located in a new industrial development area, was not directly affected by the explosion in the Tianjin old harbour in July this year. However, the event will most likely delay the process of obtaining the necessary operational permits for our new terminal.

5
Odfjell Terminal (Rotterdam)’s commercially available occupancy as per end of third quarter was 95.5%, up from 93% by end of last quarter. Additional commercial tank capacity has become available ahead of schedule. In the third quarter additional capacity has been added, with a total of 939,000 cbm being commercially available by end of September compared with 860,000 cbm as of end previous quarter. With the current market activity, we expect to have added further capacity by year end. The terminal delivered a slightly positive EBITDA in September, with all four distillation columns operational since the end of the second quarter. The largest distillation column will however go offline in the fourth quarter to increase the capacity of the unit. This will negatively affect OTR results in fourth quarter. Tank Terminals (USD mill, Odfjell share) 2Q15 3Q15 3Q14 YTD15 YTD14 FY14
Revenues 28 28 23. 82 70. 94.
Gross result 15 15 9. 42 13. 20.
EBITDA 10 10 4. 28 (6) (4).
EBIT 2 2 (5) 4 (29) (31)
EBITDA by geographical segment 2Q15 3Q15 3Q14 YTD15 YTD14 FY14
Europe (1) (0) (6) (4) (34) (41).
North America 5. 5. 3. 15. 10. 14..
Asia 4. 3. 4. 11. 11. 14..
Middle East 2. 2. 2. 6. 7. 9..
Total 10. 10. 4. 28. (6) (4).
Finance
In the third quarter we completed all scheduled vessel refinancing for 2015. In all, this refinancing secured USD 72 mill in new liquidity. Our bond maturing in December 2015 will be redeemed by drawing on our cash balance. We have initiated additional cash generating measures to further increase our financial flexibility. In our 50% owned gas carrier joint venture, Odfjell SE are committed to contribute up to USD 50 mill in equity for the building of eight LPG/Ethylene vessels in the 2015 – 2017 period. Due to the uncertainties related to the deliveries, we have chosen not to enter into any long term financing for these vessels yet. Besides regular docking expenditures, Odfjell has no further capital expenditure commitments for chemical tankers beyond equipment upgrade to increase the energy efficiency on our vessels; USD 17 mill in total over the period 2015 – 2017. In December 2014 we entered into a total return swap (TRS) for 5,891,166 Class A shares and 2,322,482 Class B shares. In October the TRS was extended to 5 January 2016 at an agreed strike price of NOK 24.79 and NOK 23.75 respectively. To lock in the benefit of lower bunker prices in 2016, we have entered into bunker hedging contracts for 2016 for 7% of our exposure at an average price of USD 255 per tonne. Lower bunker prices and weaker NOK continues to significantly impact the market value of our existing bunker hedging positions and derivatives related to our bonds issued in NOK.

6
The unrealised market value of derivatives accounted for as hedging is booked in the equity section of the balance sheet. Per end September 2015 this amounted to negative USD 23.0 mill, compared with negative USD 28.6 mill by end June. The change in unrealized market value of derivatives not accounted for as hedging is booked in the profit and loss statement under “Other financial items”. In the third quarter this amounted to a loss of USD 3.8 mill, compared with a gain of USD 11.3 mill in the second quarter. A material portion of this will, however, have no cash effect and will be reversed over time. Restructuring of a financial lease gave USD 4.2 mill in interest income in third quarter. Key figures (USD mill.) 30.06.15 30.09.15 30.09.14 31.12.14
Cash and available-for-sale investments 108 177 123 105
Interest bearing debt 1,152 1,223 1,198 1,165
Net interest bearing debt 1,044 1,046 1,075 1,060
Available drawing facilities 0 0 0 0
Total equity 636 647 681 638
Equity ratio 32.5% 31.7% 33.4% 31.4%
Shareholder information
By end of September, Odfjell A and B shares were trading at NOK 28.30 and NOK 26.40 respectively, against NOK 22.60 and NOK 22.10 respectively at the close of the previous quarter. In the same period the Oslo Stock Exchange Benchmark Index decreased by 8% and the Transportation Index gained 9%. As of 30 September 2015, Odfjell SE had a market capitalisation of around NOK 2,416 mill, which was equivalent to around USD 284 mill.
Reducing cost and improving efficiency
The cost-cutting and efficiency programme is progressing as planned. End 3Q run-rate is 72%, which is on target. All cost reduction initiatives are on schedule. The retrofitting of the first Kvaerner vessel with new propulsion has exceeded our expectations, with fuel savings of 20%. As a result, the vessel has received A+ rating by Rightship.
Prospects
The global growth remains modest at 3% - 3.5%. China has cut its benchmark rate for the sixth time this year in an effort to inflate an economy growing below its 7% target, and the China Communist party is working on their 13th five-year plan to map out and balance growth and social targets. The European Central Bank is expected to increase its monetary stimulus to counter a slow pace of recovery. The Fed is balancing the positive factors in the US economy versus the negative effect of a stronger dollar, e.g. lower exports. The continued fall in bunker prices is reducing our voyage expenses, although bunker hedging contracts for 2015 entered into in 2014 are to a certain extent offsetting this positive effect. The last of these contracts will mature in December 2015.

7
We expect fourth quarter 2015 to be weaker than the third quarter for our chemical tankers on a slightly softer market. With regard to our terminals, we expect the fourth quarter to be in line with third quarter.
Bergen, 11 November 2015 THE BOARD OF DIRECTORS OF ODFJELL SE

8
ODFJELL GROUP (figures based on equity method)
CONSOLIDATED INCOME STATEMENT
1Q15
2Q15
3Q15
3Q14 YTD 2015
YTD 2014
FY2014
(USD mill) Gross revenue 227. 244. 241. 267. 713. 807. 1 053. Voyage expenses (103) (102) (103) (123) (307) (380) (496) Time-charter expenses (39) (44) (41) (47) (124) (150) (191) Operating expenses (38) (36) (34) (44) (108) (136) (175) Gross result 48. 63. 63. 51. 174. 142. 191. Share of net result from associates and joint ventures (4) 1. (1) (8) (4) (27) (32) General and administrative expenses (21) (22) (18) (24) (62) (75) (93) Operating result before depreciation, amortisation and capital gain (loss) on non-current assets (EBITDA)
22.
42.
45.
19.
109.
41.
66.
Depreciation (22) (22) (22) (24) (66) (70) (90) Impairment -.. (10) -. -. (10) -. (4) Capital gain (loss) on non-current assets -.. -. -. 7. -. 7. 7. Operating result (EBIT) 0.. 10. 23. 1. 33. (22) (22) Interest income 1. 0. 1. 1. 2. 3. 3. Interest expenses (11) (12) (8) (10) (32) (30) (42) Other financial items (20) 9. (7) 0. (18) (4) (14) Net financial items (31) (2) (15) (9) (48) (32) (53) Result before taxes (31) 8. 8. (8) (15) (54) (75) Taxes (1) (1) (1) (1) (3) (3) 0. Net result (32) 7. 7. (9) (18) (57) (75) CONSOLIDATED STATEMENT OF COMPREHENSIVE INCOME
Net other comprehensive income to be reclassified to profit or loss in subsequent periods:
Cash-flow hedges changes in fair value 29. (25) (13) (6). (9) (6) (78) Cash-flow hedges transferred to profit and loss statement (16) 45. 19. (2). 48. (3) 15. Net unrealised gain/(loss) on available-for-sale-investments (0) (0) -. -..
-. -.
1.
Share of comprehensive income on investments accounted for using equity method
(14)
4.
(2)
(7).
(13)
(13)
(12)
Net other comprehensive income not being reclassified to profit or loss in subsequent periods:
Net actuarial gain/(loss) on defined benefit plans -. (0) (0) -... (1) -. 3. Other comprehensive income (1) 24. 3. (15). 26. (22) (71) Total comprehensive income (33) 31. 10. (24). 8. (78) (146) Net result allocated to: Owner of parent (32) 7 7 (9) (18) (57) (75) Total comprehensive income allocated to: Owner of parent (33) 31 10 (24) 8. (78) (146) Earnings per share (USD) – basic/diluted (0.37) 0.08 0.08 (0.10) (0.21) (0.66) (0.95)

9
CONSOLIDATED STATEMENT OF FINANCIAL POSITION 1Q15 2Q15 3Q15 3Q14 FY2014 (USD mill) Ships 1 294 1 254 1 299 1 256 1 269 Newbuilding contracts - - - 29 15 Other non-current assets 50 47 46 53 55 Investments in associates and joint ventures 376 380 377 397 393 Loan to associates and joint ventures 10 4 4 9 10 Non-current receivables 17 16 11 19 19 Total non-current assets 1 745 1 701 1 737 1 762 1 761
Current receivables 105 102 92 132 130 Bunkers and other inventories 14 14 9 23 23 Derivative financial instruments - - 3 - 5 Available-for-sale investments 10 10 10 10 10 Loan to associates and joint ventures 3 17 21 - 1 Cash and cash equivalents 102 98 167 113 95 Total current assets 234 241 302 278 265 Assets held for sale - 16 - - 7 Total assets 1 980 1 958 2 040 2 040 2 032
Paid in equity 202 202 202 199 202 Other equity 403 434 445 482 436 Total equity 604 636 647 681 638 Non-current liabilities 8 8 9 24 10 Derivatives financial instruments 39 35 40 14 32 Non-current interest bearing debt 879 876 1 042 1 064 837 Total non-current liabilities 926 919 1 091 1 102 880 Current portion of interest bearing debt 296 276 181 134 326 Derivative financial instruments 83 56 52 21 87 Loan from associates and joint ventures 1 - - - - Current liabilities 68 71 69 101 101 Total current liabilities 449 403 302 256 514 Liabilities held for sale - - - - - Total equity and liabilities 1 980 1 958 2 040 2 040 2 032

10
CONSOLIDATED STATEMENT OF CHANGES IN EQUITY
Paid in equity
Exchange rate
differences Cash-flow hedge
reserves
Available for
sale reserve
Pension remeasure-
ment
OCI
associates and joint ventures
Retained equity
Total other
equity Total equity (USD mill) Equity as at 1.1.2014 199
(3) 1.
0.
13.
16. 531. 560. 759.
Comprehensive income -. -. (9) 0. -. (13) (57) (78) (78) Equity as at 30.09.2014 199 (3) (8) 1. 13. 3. 474. 482. 681. Equity as per 1.1.2015 202. (3) (62) 1. 16. 4. 479. 436. 638. Comprehensive income -. (1) 39. -. 0. (13) (18) 8. 8. Other adjustments -. -. -. -. -. -. 2. 2. 2. Equity as at 30.09.2015 202. (4) (23) 1. 16. (8) 463 445. 647.
11
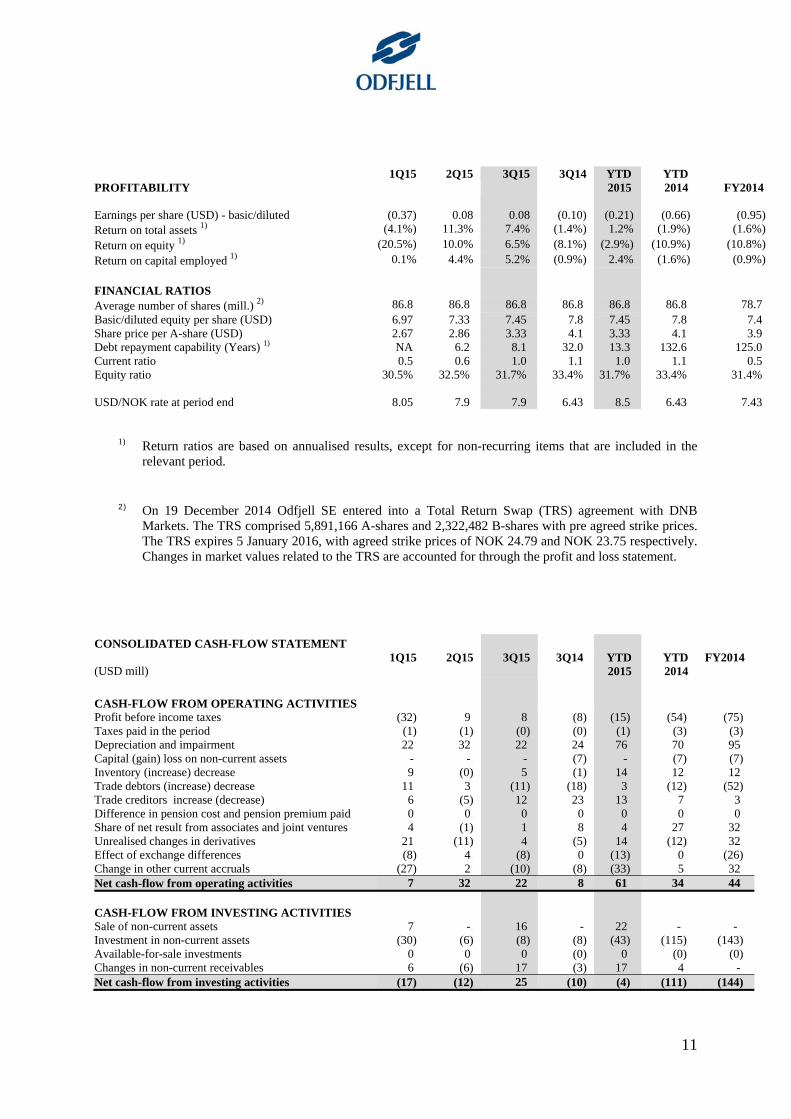
1) Return ratios are based on annualised results, except for non-recurring items that are included in the
relevant period.
2) On 19 December 2014 Odfjell SE entered into a Total Return Swap (TRS) agreement with DNB Markets. The TRS comprised 5,891,166 A-shares and 2,322,482 B-shares with pre agreed strike prices. The TRS expires 5 January 2016, with agreed strike prices of NOK 24.79 and NOK 23.75 respectively. Changes in market values related to the TRS are accounted for through the profit and loss statement.
CONSOLIDATED CASH-FLOW STATEMENT
(USD mill) 1Q15 2Q15 3Q15 3Q14 YTD
2015 YTD 2014
FY2014
CASH-FLOW FROM OPERATING ACTIVITIES
Profit before income taxes (32) 9. 8. (8) (15) (54) (75) Taxes paid in the period (1) (1) (0) (0) (1) (3) (3) Depreciation and impairment 22. 32. 22. 24. 76. 70. 95. Capital (gain) loss on non-current assets -. -. -. (7) -. (7) (7) Inventory (increase) decrease 9. (0) 5. (1) 14. 12. 12. Trade debtors (increase) decrease 11. 3. (11) (18) 3. (12) (52) Trade creditors increase (decrease) 6. (5) 12. 23. 13. 7. 3. Difference in pension cost and pension premium paid 0. 0. 0. 0. 0. 0. 0. Share of net result from associates and joint ventures 4. (1) 1. 8. 4. 27. 32. Unrealised changes in derivatives 21. (11) 4. (5) 14. (12) 32. Effect of exchange differences (8) 4. (8) 0. (13) 0. (26) Change in other current accruals (27) 2. (10) (8) (33) 5. 32. Net cash-flow from operating activities 7. 32. 22. 8. 61. 34. 44. CASH-FLOW FROM INVESTING ACTIVITIES Sale of non-current assets 7. -. 16. -. 22. -.. -.. Investment in non-current assets (30) (6) (8) (8) (43) (115) (143) Available-for-sale investments 0. 0. 0. (0) 0. (0) (0) Changes in non-current receivables 6. (6) 17. (3) 17. 4. -. Net cash-flow from investing activities (17) (12) 25. (10) (4) (111) (144)
PROFITABILITY 1Q15 2Q15 3Q15 3Q14 YTD
2015 YTD 2014 FY2014
Earnings per share (USD) - basic/diluted (0.37) 0.08 0.08 (0.10) (0.21) (0.66) (0.95) Return on total assets 1) (4.1%) 11.3% 7.4% (1.4%) 1.2% (1.9%) (1.6%)
Return on equity 1) (20.5%) 10.0% 6.5% (8.1%) (2.9%) (10.9%) (10.8%)
Return on capital employed 1) 0.1% 4.4% 5.2% (0.9%) 2.4% (1.6%) (0.9%) FINANCIAL RATIOS
Average number of shares (mill.) 2) 86.8 86.8 86.8 86.8 86.8 86.8 78.7 Basic/diluted equity per share (USD) 6.97 7.33 7.45 7.8 7.45 7.8 7.4 Share price per A-share (USD) 2.67 2.86 3.33 4.1 3.33 4.1 3.9 Debt repayment capability (Years) 1) NA 6.2 8.1 32.0 13.3 132.6 125.0 Current ratio 0.5 0.6 1.0 1.1 1.0 1.1 0.5 Equity ratio 30.5% 32.5% 31.7% 33.4% 31.7% 33.4% 31.4% USD/NOK rate at period end 8.05 7.9 7.9 6.43 8.5 6.43 7.43

12
1Q15 2Q15 3Q15 3Q14 YTD
2015 YTD 2014
FY2014
CASH-FLOW FROM FINANCING ACTIVITIES
New interest bearing debt 83. 18. 194. 27. 295. 197. 215. Repayment of interest bearing debt (63) (43) (169) (30) (275) (90) (128) Sale/Purchase of treasury shares -.. -. -. -. -. -.. 26. Net cash-flow from financing activities 20. (26) 25. (3) 19.. 107 113.. Effect on cash balances from currency exchange rate fluctuations
(3)
1.
(3)
(0)
(5)
(0)
(2)
Net change in cash and cash equivalents 7. (4) 69. (6) 72 29 12. Opening cash and cash equivalents 95. 102. 98. 120 95. 84 84. Closing cash and cash equivalents 102. 98. 167. 113 167. 113 95. Notes to the consolidated financial statements Note 1 – Accounting principles Odfjell SE is ultimate parent company of the Odfjell Group. Odfjell SE is a public listed company traded on the Oslo Stock Exchange. The company’s address is Conrad Mohrsv. 29, Bergen, Norway. Basis of preparation and changes to the Group’s accounting policies The interim consolidated financial statements ended 30 September 2015 for Odfjell Group have been prepared in accordance with International Accounting Standard IAS 34 “Interim Financial Reporting”. The interim financial statements do not include all the information and disclosures required in the annual financial statements, and should be read in conjunction with the Group’s annual financial statements as at 31 December 2014. The interim financial statements are unaudited. New standards, interpretations and amendments adopted by the Group The accounting principles used in the preparation of these financial statements are consistent with those used in the annual financial statements for the year ended 31 December 2014. A number of new standards and amendments to standard and interpretations are not yet effective, and have not yet been applied in preparing consolidated financial statements. None of these is expected to have significant impact of the Group, the most important standards are: IFRS 9 Financial Instruments IFRS 9 will eventually replace IAS 39 Financial Instruments: Recognition and Measurement. In order to expedite the replacement of IAS 39, the IASB divided the project into phases: classification and measurement, hedge accounting and impairment. New principles for impairment were published in July 2014 and the standard is now completed. The parts of IAS 39 that have not been amended as part of this project have been transferred into IFRS 9. IFRS 15 Revenue from Contracts with Customers The IASB and the FASB have issued their joint revenue recognition standard, IFRS 15. The standard replaces existing IFRS and US GAAP revenue requirements. The core principle of IFRS 15 is that revenue is recognised to depict the transfer of promised goods or services to customers in an amount that reflects the consideration to which the entity expects to be entitled in exchange for those goods or services. The standard applies to all revenue contracts and provides a model for the recognition and measurement of sales of some non-financial assets (e.g., disposals of property, plant and equipment).

13
Note 2 – Segment information Management has determined the operating segments based on the information regularly review by senior management. In accordance with the internal financial reporting, investments in joint venture are reported by applying the proportionate consolidation method. The Group has three reportable segments: Chemical Tankers: The Chemical Tankers segment involves a ‘round the world’ transportation of chemicals with ships. The composition of the ships enables the Group to offer both global and regional transportation. Tank terminals: The tank terminal segment offers storage and distillation of various chemical and petroleum products. The segment is operated through the joint venture Odfjell Terminals BV. Gas Carriers: The Group re-entered into the LPG market in 2012 by acquiring two LPG/Ethylene carriers, and Odfjell Gas has today eight vessels on order for delivery between 2016 and 2017. The segment is operated through the joint venture Odfjell Gas AS.

14
USD mill 1Q15 2Q15 3Q15 3Q14 YTD15 YTD14 FY2014 1Q15 2Q15 3Q15 3Q14 YTD15 YTD14 FY2014 1Q15 2Q15 3Q15 3Q14 YTD15 YTD14 FY2014 1Q15 2Q15 3Q15 3Q14 YTD15 YTD14 FY2014 1Q15 2Q15 3Q15 3Q14 YTD15 YTD14 FY2014
Gross revenue 229 247 244 263 720 795 1 042 27 28 28 23 82 70 94 4 5 4 7 13 20 25 ( 0) ( 0) ( 0) ( 1) ( 1) ( 1) ( 1) 260 279 276 292 815 885 1 160Voyage expenses ( 104) ( 102) ( 104) ( 122) ( 310) ( 376) ( 493) - - - - - - - ( 2) ( 2) ( 2) ( 2) ( 5) ( 7) ( 8) - - - - - - - ( 106) ( 104) ( 106) ( 124) ( 315) ( 383) ( 501)TC expenses ( 38) ( 44) ( 41) ( 45) ( 124) ( 144) ( 185) - - - - - - - ( 1) ( 1) ( 1) ( 2) ( 3) ( 6) ( 7) - - - - - - - ( 40) ( 45) ( 42) ( 47) ( 127) ( 150) ( 192)Operating expenses ( 39) ( 36) ( 34) ( 44) ( 110) ( 134) ( 175) ( 14) ( 14) ( 13) ( 14) ( 40) ( 57) ( 74) ( 1) ( 1) ( 1) ( 1) ( 2) ( 4) ( 4) - - - - - - - ( 53) ( 50) ( 48) ( 60) ( 152) ( 195) ( 253)General and adminstrative expenses ( 22) ( 23) ( 19) ( 25) ( 63) ( 74) ( 93) ( 4) ( 5) ( 5) ( 5) ( 14) ( 19) ( 24) ( 0) ( 0) ( 0) ( 0) ( 0) ( 2) ( 2) 0 0 0 1 1 1 1 ( 26) ( 27) ( 23) ( 29) ( 76) ( 94) ( 118)Operating result before depreciation (EBITDA) 26 42 46 26 114 67 97 9 10 10 4 28 ( 6) ( 4) 1 1 1 1 3 2 3 - - - - - - - 35 53 57 31 145 63 96Depreciation ( 22) ( 23) ( 22) ( 24) ( 67) ( 69) ( 90) ( 8) ( 8) ( 8) ( 8) ( 24) ( 24) ( 32) ( 0) ( 0) ( 0) ( 1) ( 1) ( 2) ( 2) - - - - - - - ( 30) ( 31) ( 30) ( 32) ( 91) ( 95) ( 124)Impairment - ( 10) ( 0) - ( 10) - ( 4) - - - - - - 5 - - - - - - - - - - - - - - - ( 10) ( 0) - ( 10) - 0Capital gain/loss on fixed assets - - - 0 - 0 - - - 0 ( 1) ( 0) 0 - - - - 7 - 7 7 - - - - - - - - - 0 6 ( 0) 7 7Operating result (EBIT) 4 10 24 3 37 ( 2) 3 1 2 2 ( 5) 4 ( 29) ( 31) 1 1 0 7 2 7 8 - - - - - - - 5 12 26 5 43 ( 25) ( 20)Net finance ( 31) ( 2) ( 15) ( 7) ( 48) ( 29) ( 52) ( 6) ( 2) ( 3) ( 7) ( 11) ( 13) ( 17) ( 0) ( 0) ( 0) ( 2) ( 1) ( 3) ( 2) - - - ( 0) - ( 0) - ( 37) ( 5) ( 18) ( 16) ( 60) ( 45) ( 71)Taxes ( 1) ( 1) ( 1) ( 1) ( 3) ( 3) 0 1 0 ( 0) 3 1 15 15 - - - - - - - - - - - ( 0) ( 0) ( 1) 2 ( 2) 12 16Net result ( 28) 7 8 ( 5) ( 14) ( 34) ( 48) ( 4) ( 0) ( 1) ( 9) ( 5) ( 27) ( 33) 0 1 0 5 1 4 6 - - - ( 0) - ( 0) - ( 32) 7 7 ( 9) ( 18) ( 57) ( 75)
-Non current assets 1 381 1 346 1 378 1 380 1 378 1 380 1 367 581 589 583 588 583 588 599 62 64 67 53 67 53 59 ( 4) ( 8) 7 - 7 - ( 3) 2 020 1 991 2 036 2 021 2 036 2 021 2 022Current assets 240 235 308 280 308 280 287 44 42 50 66 50 66 51 9 7 4 16 4 16 10 ( 2) ( 2) ( 17) - ( 17) - - 291 281 345 362 345 362 348Assets held for sale - 16 - - - - - - - - - - - - - - - - - - - - - - - - - - 16 - - - - -Total 1 621 1 596 1 686 1 660 1 686 1 660 1 654 625 630 632 654 632 654 650 71 71 71 69 71 69 69 ( 6) ( 10) ( 9) - ( 9) - ( 3) 2 311 2 288 2 380 2 383 2 380 2 383 2 370
Equity 238 265 278 294 278 294 256 313 317 314 333 314 333 331 54 55 55 54 55 54 54 - - - - - - - 604 636 647 681 647 681 638Non current liabilities 931 924 1 094 1 105 1 094 1 105 886 259 259 250 256 250 256 262 12 12 11 13 11 13 13 ( 3) ( 7) - - - - ( 3) 1 199 1 188 1 355 1 375 1 355 1 375 1 158Current liabilities 453 407 314 261 314 261 512 53 55 69 64 69 64 57 4 5 5 2 5 2 2 ( 3) ( 3) ( 10) - ( 10) - - 507 464 378 327 378 327 574Total 1 621 1 596 1 686 1 660 1 686 1 660 1 654 625 630 632 654 632 654 650 71 71 71 69 71 69 69 ( 6) ( 10) ( 10) - ( 10) - ( 3) 2 311 2 288 2 380 2 383 2 380 2 383 2 370
Reconsiliation of revenue:Total segment revenue 229 247 244 263 720 795 1 042 27 28 28 23 82 70 94 4 5 4 7 13 20 25 ( 0) ( 0) ( 0) ( 1) ( 1) ( 1) ( 1) 260 279 276 292 815 885 1 160Segment revenue from associates and joint ventures - Tank Terminals** - - - - - - - ( 27) ( 28) ( 28) ( 23) ( 82) ( 70) ( 94) - - - - - - - - - - - - - - ( 27) ( 28) ( 28) ( 23) ( 82) ( 70) ( 94)Segment revenue from associates and joint ventures - Chemical Tankers** ( 2) ( 2) ( 2) ( 2) ( 6) ( 7) ( 9) - - - - - - - - - - - - - - - - - - - ( 2) - ( 2) ( 2) ( 2) ( 2) ( 6) ( 8) ( 9)Segment revenue from associates and joint ventures - Gas Carriers** - - - - - - - - - - - - - - ( 4) ( 5) ( 4) - ( 13) - ( 4) - - - - - - - ( 4) ( 5) ( 4) - ( 13) - ( 4)Consolidated revenue in income statement 227 245 242 260 714 788 1 034 - - - - - - - - - - 7 - 20 20 ( 0) ( 0) ( 0) ( 1) ( 1) ( 3) ( 1) 227 244 241 267 713 807 1 053
Reconsiliation of result:Total segment EBIT 4 10 24 3 37 ( 2) 3 1 2 2 ( 5) 4 ( 29) ( 31) 1 1 0 7 2 7 8 - - - - - - - 5 12 26 5 43 ( 25) ( 20)Segment EBIT from associates and joint ventures - Tank Terminals** - - - - - ( 1) - ( 1) ( 2) ( 2) 5 ( 4) 29 31 - - - - - - - - - - - - - - ( 1) ( 2) ( 2) 5 ( 4) 28 31Segment EBIT from associates and joint ventures - Chemical Tankers** ( 1) 0 - ( 1) - - - - - - - - - - - - - - - - - - - - - - 0 - ( 1) 0 - ( 1) - 0 -Segment EBIT from associates and joint ventures - Gas Carriers** - - - - - - - - - - - - - - ( 1) ( 1) ( 0) - ( 2) - - - - - - - - - ( 1) ( 1) ( 0) - ( 2) - -Share of net result from associates and joint ventures*** 1 ( 0) 0 0 0 - ( 4) ( 0) ( 1) ( 9) ( 5) ( 27) ( 33) 0 1 0 - 1 - - - - - - - ( 0) - ( 3) 0 ( 1) ( 8) ( 4) ( 27) ( 33)Consolidated EBIT in income statement 4 10 24 2 37 ( 3) 3 ( 4) ( 0) ( 1) ( 9) ( 5) ( 27) ( 33) 0 1 0 7 1 7 8 - - - - - - - 0 10 23 1 33 ( 22) ( 22)
Reconsiliation of assets and liabilities** - - - - - - -Total segment asset 1 621 1 596 1 686 1 660 1 686 1 660 1 654 625 630 632 654 632 654 650 71 71 71 69 71 69 69 ( 6) ( 10) ( 9) - ( 9) - ( 3) 2 311 2 288 2 380 2 383 2 380 2 383 2 370Segment asset from Tank Terminals, Chemical Tankers and Gas Carriers** ( 13) ( 14) ( 14) ( 17) ( 14) ( 17) ( 16) ( 625) ( 630) ( 632) ( 654) ( 632) ( 654) ( 651) ( 70) ( 71) ( 72) ( 69) ( 72) ( 69) ( 69) 1 5 - - - ( 14) 3 ( 707) ( 710) ( 718) ( 740) ( 718) ( 740) ( 732)Investment in joint ventures*** 9 9 9 10 9 10 9 313 317 314 333 314 333 331 54 55 55 54 55 54 54 - - - - - 9 - 376 380 377 397 377 397 393Total consolidated assets in statement of financial position 1 617 1 591 1 681 1 653 1 681 1 653 1 647 313 317 314 333 314 333 331 55 55 54 54 54 54 54 ( 5) ( 5) ( 9) - ( 9) ( 5) - 1 980 1 958 2 040 2 040 2 040 2 040 2 032
Total segment liabilities 1 384 1 331 1 408 1 366 1 408 1 366 1 398 312 314 319 321 319 321 319 17 16 16 15 16 15 15 ( 6) ( 10) ( 10) - ( 10) - ( 3) 1 707 1 652 1 733 1 702 1 733 1 702 1 730Segment liability from Tank Terminals, Chemical Tankers and Gas Carriers** ( 4) ( 5) ( 5) ( 7) ( 5) ( 7) ( 6) ( 312) ( 314) ( 319) ( 321) ( 319) ( 321) ( 319) ( 17) ( 16) ( 16) ( 15) ( 16) ( 15) ( 15) 1 5 - - - ( 5) 3 ( 332) ( 330) ( 340) ( 343) ( 340) ( 343) ( 338)Total consolidated liabilities in statement of financial position 1 379 1 326 1 403 1 359 1 403 1 359 1 392 - - - - - - - - - - - - - - ( 5) ( 5) ( 10) - ( 10) ( 5) - 1 375 1 321 1 393 1 359 1 393 1 359 1 392
* This segment also include "corporate".** Investments in joint ventures are presented according to the proportionate consolidation method in the segment reporting.*** Investments in joint ventures are presented according to the equity method in the consolidated income statement and balance sheet.
Chemical Tankers *) Tank Terminals Gas Garriers Eliminations Total

15
Note 3 - Net interest bearing liabilities
(USD mill)
3Q15.
3Q14 FY2014 Loans from financial institutions – floating interest rate 523. 474. 364. Financial leases 301. 260. 249. Bonds 223. 336. 230. Current portion interest bearing debt 181. 134. 326. Transaction costs (5) (6) (6) Subtotal interest bearing debt 1 223. 1 198. 1 163. Held for sale -. -. -. Total interest bearing debt 1 223. 1 198. 1 163. Cash and cash equivalent (167) (113) (95) Available for sale investments (10) (10) (10) Held for sale ---. -. -. Net interest bearing liabilities 1 046. 1 075. 1 060.
(USD mill)
3Q15
3Q14 FY2014 New interest bearing debt 252. 27. 215. Disposal of interest bearing debt -. (15) (15) Payment of interest bearing debt (169) (30) (128)
Restructuring of operational lease on Bow Sky to a financial lease resulted in an increase in interest bearing debt of USD 45.5 million. Note 4 – Transactions with related parties In the normal course of the conduct of its business, the Group enters into a number of transactions with related parties. Odfjell considers these arrangements to be on reasonable market terms. Note 5 – Non-current assets
(USD mill) 3Q15 3Q14 FY2014 Net carrying amount beginning 1 335. 1 369 1 370. Investments in non-current assets 101. 115 143. Sale of non-current assets (16) (77) (77) Depreciation and impairment (76) (70) (95) Assets held for sale -. -. (7) Net carrying amount end 1 345 1 338 1 335. Note 6 – Fair value and financial instruments The Group classifies fair value measurements using a fair value hierarchy that reflects the significance of the inputs used in making the measurement. The measurement used by Odfjell is either level 1 or 2, where level 1 is quoted prices (unadjusted) in active markets for identical assets or liabilities that the entity an access at the measurement date, and level 2 are inputs other than quoted prices that are observable for the asset or liability, either directly or indirectly. For some non-derivative financial assets and liabilities we consider carrying amount to be the best estimate of fair value due to short maturity date and valid terms, i.e. current receivables and payables. During 2015 there have been no transfers between levels of the fair value hierarchy. The Group accounts for transfers between levels of the fair value hierarchy from the date of the event or change in circumstances that caused the transfer.

16
Assets and liabilities which are measured at fair value in the Consolidated Balance Sheet and their level of the fair value hierarchy were as follows: (USD mill)
3Q15 Level 1
3Q15 Level 2
3Q14 Level 1
3Q14 Level 2
Recurring fair value measurement Financial assets at fair value: Derivatives instruments – non hedging - 3 - - Derivatives instruments - hedging - - - - Financial liabilities at fair value: Derivatives instruments – non hedging - 23 - 26 Derivatives instruments - hedging - 69 - 9 Available-for-sale-investments 10 - 10 - Note 7 – Investments in associates and joint ventures The share of result and balance sheet items from investments in associates and joint ventures are recognised based on equity method in the interim financial statements. The figures below show our share of revenue and expenses, total assets, total liabilities and equity: YTD 2015 YTD 2014
(USD mill) Chemical
TankersTank
TerminalsGas
Carriers1) TotalChemical
Tankers Tank
Terminals Gas
carriers 1) Total Gross revenue 6. 82. 13 101. 7. 70. - 77.EBITDA 1. 28. 3 32. (1) (6) - (7)EBIT 0. 4. 2 6. (1) (29) - (30)Net result (0) (5) 1 (4) (0) (27) - (27) Non-current assets 9 583 67 659 9 588 53 650Current assets 4 50 4 58 8 65 16 89Total assets 14 632 72 718 17 653 69 739 Total equity closing balance 9 314 55 378 10 333 54 397 Non-current liabilities 4 250 11 265 3 256 13 272Current liabilities 1 69 5 75 4 64 2 70Total liabilities 5 319 17 341 7 320 15 343
1) Up to 30 September 2014, Odfjell consolidated Odfjell Gas AS 100%. Upon loss of control at 30
September 2014, Odfjell recognised its retained investment (50%) in Odfjell Gas AS at its fair value. The gain on re-measurement of about USD 6 mill is recognised in the income statement. From 30 September 2014, the remaining investment in Odfjell Gas AS was recognised according to the equity method.
Note 8 – Other financial items
(USD mill)
1Q15
2Q15
3Q15
3Q14
YTD 2015
YTD 2014 FY2014
Changes in fair value in derivatives (21) 11. (4) (5) (14) (12) (32) Currency gains (losses) 2. 0. (1) 6. 1. 14. 31. Other (1) (2) (2) (0) (5) (6) (13) Total other financial items (20) 9. (7) 0. (18) (4) (14)

17
Note 9 – Figures presented based on Proportionate method With the effect from 1 January 2014 Odfjell changed from Proportionate method to equity method. Below figures are presented based on Proportionate method for comparison purposes.
CONSOLIDATED INCOME STATEMENT
YTD15
YTD14 (USD mill) Gross revenue 815. 885. Voyage expenses (315) (383) Time-charter expenses (127) (150) Operating expenses (152) (195) Gross result 221. 157. . Share of net result from associates and joint ventures -. 0. General and administrative expenses (76) (94) Operating result before depreciation, amortisation and capital gain (loss) on non-current assets (EBITDA)
145.
63.
Depreciation (91) (94) Impairment (10) -. Capital gain (loss) on non-current assets -. 7. Operating result (EBIT) 43. (24) Interest income 2. 2. Interest expenses (39) (37) Other financial items (22) (10) Net financial items (60) (45) Result before taxes (16) (69) Taxes (2) 12. Net result (18) (57)

18
CONSOLIDATED STATEMENT OF FINANCIAL POSITION 3Q15 3Q14 Intangible assets 55 43 Ships 1 336 1 295 Newbuilding contracts 39 50 Tank terminals 492 498 Other non-current assets 81 83 Investments in associates and joint ventures - 21 Non-current receivables 33 26 Total non-current assets 2 035 2 016 Current receivables 121 161 Bunkers and other inventories 10 24 Derivative financial instruments 3 - Available-for-sale investments 10 10 Cash and cash equivalents 200 172 Assets held for sale - - Total current assets 344 367 Total assets 2 380 2 383 Paid in equity 202 199 Other equity 445 482 Total equity 647 681 Non-current liabilities 36 51 Derivatives financial instruments 43 17 Non-current interest bearing debt 1 276 1 306 Total non-current liabilities 1 355 1 375 Current portion of interest bearing debt 208 155 Derivative financial instruments 52 21 Current liabilities 117 151 Liabilities held for sale - - Total current liabilities 378 327 Total equity and liabilities 2 380 2 383

FLEET & TERMINAL OVERVIEW as per 11 November 2015
CHEMICAL TANKERS YEAR STAINLESS NUMBEROWNED: SHIP BUILT DWT CBM STEEL, CBM OF TANKS
Bow Triumph 2014 49 622 53 188 - 22 Bow Trident 2014 49 622 53 188 - 22 Bow Pioneer 2013 75 000 86 000 - 30 Bow Nangang 2013 9 156 10 523 10 523 14 Bow Dalian 2012 9 156 10 523 10 523 14 Bow Fuling 2012 9 156 10 523 10 523 14 Bow Lind 2011 46 047 48 698 - 29 Bow Elm 2011 46 098 48 698 - 29 Flumar Brasil 2010 51 188 55 452 - 14 Bow Harmony 2008 33 619 38 052 38 052 16 Bow Saga¹ 2007 49 559 52 126 52 126 40 Bow Sirius¹ 2006 49 539 52 155 52 155 40 Bow Sea 2006 49 592 52 107 52 107 40 Bow Engineer 2006 30 086 36 274 36 274 28 Flumar Maceio 2006 19 975 21 713 21 713 22 Bow Summer 2005 49 592 52 128 52 128 40 Bow Spring 2004 49 429 52 127 52 127 40 Bow Star 2004 49 487 52 127 52 127 40 Bow Santos 2004 19 997 21 846 21 846 22 Bow Sun 2003 42 459 52 127 52 127 40 Bow Firda 2003 37 427 40 645 40 645 47 Bow Chain 2002 37 518 40 621 40 621 47 Bow Andes 2000 16 020 17 120 17 120 22 Bow Condor 2000 16 121 17 622 17 622 30 Bow Fortune 1999 37 395 40 619 40 619 47 Bow Master 1999 6 046 7 018 7 018 14 Bow Sailor 1999 6 008 7 011 7 011 14 Bow Cecil¹ 1998 37 369 40 515 33 236 47 Bow Flora 1998 37 369 40 515 33 236 47 Bow Oceanic 1997 17 460 19 616 19 616 24 Bow Cardinal¹ 1997 37 446 41 487 34 208 52 Bow Faith 1997 37 479 41 487 34 208 52 Bow Aratu 1997 13 843 15 834 15 834 29 Bow Querida 1996 10 106 11 181 11 181 18 Bow Cedar 1996 37 455 41 488 41 488 52 Bow Atlantic 1995 17 460 19 588 19 588 24 Bow Fagus 1995 37 375 41 608 34 329 52 Bow Clipper 1995 37 221 41 596 34 328 52 Bow Flower 1994 37 221 41 492 34 213 52 Number of ships owned 39 1 302 718 1 426 636 1 030 470 1 278
TIME CHARTERED/POOL:Horin Trader 2015 19 856 22 129 22 129 18 Marex Noa 2015 12 478 14 067 14 067 16 Gion Trader 2015 19 833 22 130 22 130 18 Bow Tribute4 2014 49 622 53 188 - 22 Bow Trajectory4 2014 49 622 53 188 - 22 Chemroad Hope 2011 33 552 37 161 37 161 18 RT Star 2011 26 199 27 912 27 912 18 SG Pegasus 2011 13 086 14 523 14 523 16 Southern Koala 2010 21 290 20 008 20 008 20 Bow Tone 2009 33 625 37 974 37 974 16 Bow Hector 2009 33 694 37 384 37 384 16 Southern Ibis 2009 19 905 22 158 22 158 20 Southern Jaguar 2009 19 997 22 157 22 157 20 Bow Sagami 2008 33 641 38 000 38 000 16 Bow Kiso 2008 33 641 37 974 37 974 16 Bow Heron 2008 33 707 37 365 37 365 16 Celsius Mayfair 2007 19 999 21 714 21 714 20 Bow Fuji 2006 19 805 22 140 22 140 22 Celsius Manhattan 2006 19 807 22 143 22 143 22 Moyra 2005 19 806 22 838 22 838 18 Bow Sky1 2005 49 479 52 126 52 126 40 Bow Architect 2005 30 058 36 290 36 290 28 Celsius Monaco 2005 19 999 21 851 21 851 22 Celsius Mumbai 2005 19 993 22 186 22 186 22 Celsius Miami 2005 19 991 22 192 22 192 22 Chembulk Sydney 2005 14 271 16 571 16 571 20 Golden Top 2004 12 705 13 388 13 388 22 Chembulk Wellington 2004 14 312 15 591 15 591 20 Bow Asia² 2004 9 901 11 088 11 088 20 Bow Singapore² 2004 9 888 11 089 11 089 20 SG Friendship 2003 19 773 21 651 21 651 26 Bow Jubail² 1996 37 499 41 488 34 209 52 Bow Mekka² 1995 37 272 41 606 34 257 52 Bow Riyad² 1995 37 221 41 492 34 213 52 Kristin Knutsen 1998 19 152 19 409 19 409 34 Number of ships on TC/Pool: 35 884 679 974 173 845 890 822 Number of ships: 74 2 187 397 2 400 809 1 876 360 2 100
¹ Vessel beneficially owned through financial lease.² Vessel on bare-boat charter.³ Vessel on variable time-charter/pool.4 Vessel on bare-boat charter booked as financial lease.
YEAR NUMBERLPG/ETHYLENE CARRIERS SHIP BUILT DWT CBM TYPE OF TANKSOWNED: Bow Gallant³ 2 008 10 282 8 922 LPG/Ethylene 2
Bow Guardian³ 2 008 10 282 8 922 LPG/Ethylene 2
TIME CHARTERED: Berlian Ekuator 2 004 26 776 35 000 LPG/Ammonia 3 Number of ships: 3 47 340 52 844 7

ON ORDERLPG/ETHYLENE CARRIERS: YARD DELIVERY CBM OWNER COMMENT
Nantong Sinopacific Offshore & Engineering Co., Ltd 2016 17 000 Odfjell Gas 50/50 JV" 2016 17 000 Odfjell Gas "" 2016 17 000 Odfjell Gas "" 2016 17 000 Odfjell Gas "" 2016 22 000 Odfjell Gas "" 2016 22 000 Odfjell Gas "" 2017 22 000 Odfjell Gas "" 2017 22 000 Odfjell Gas "
Number of newbuildings: 8 156 000
STAINLESSTANK TERMINALS LOCATION CBM STEEL, CBM TANKS
Odfjell Terminals (Rotterdam) BV Rotterdam, NL 51% 1 636 100 32 550 281 Odfjell Terminals (Houston) Inc Houston, USA 51% 379 629 112 833 119 Odfjell Terminals (Charleston) LLC Charleston, USA 51% 79 206 - 9 Odfjell Terminals (Jiangyin) Co Ltd Jiangyin, China 28.05 % 99 800 30 000 22 Odfjell Terminals (Dalian) Ltd Dalian, China 25.5 % 119 750 18 350 51 Odfjell Terminals (Korea) Co Ltd Onsan, Korea 25.5 % 313 710 15 860 85 Oiltanking Odfjell Terminal Singapore Ltd Singapore 25.5 % 377 051 13 520 82 Oiltanking Odfjell Terminal & Co. LLC Sohar, Oman 15.17 % 1 294 780 - 66 Noord Natie Terminals Antwerp, Belgium 12.75% 350 000 50 800 241 Exir Chemical Terminals PJSCO BIK, Iran 35 % 22 000 1 000 18 Total terminals 10 terminals 4 672 026 274 913 974
STAINLESSPROJECTS AND EXPANSIONS LOCATION CBM STEEL, CBM COMPLETION
Odfjell Nangang Terminals (Tianjin) Co.,Ltd Tianjin, China 24.99% 137 800 7 000 Q2 2016Odfjell Terminals Quanzhou (Fujian) Quanzhou, China 25.5% 184 000 - TBDTotal expansion terminals 321 800 7 000
STAINLESSTANK TERMINALS PARTLY OWNED BY RELATED PARTIES*) LOCATION CBM STEEL, CBM TANKS
Depositos Quimicos Mineros S.A. Callao, Peru 52 980 1 600 43 Granel Quimica Ltda Santos I, Brazil 97 720 19 880 99 Granel Quimica Ltda Rio Grande, Brazil 61 150 2 900 32 Granel Quimica Ltda Sao Luis I, Brazil 75 710 - 35 Granel Quimica Ltda Ladario, Brazil 8 060 - 6 Granel Quimica Ltda Triunfo, Brazil 12 430 - 3 Granel Quimica Ltda Teresina, Brazil 7 640 - 6 Granel Quimica Ltda Palmas, Brazil 11 000 8 Odfjell Terminals Tagsa S.A. Buenos Aires, Argentina 38 826 530 56 Odfjell Terminals Tagsa S.A. Campana, Argentina 68 580 10 190 102 Terquim S.A. San Antonio, Chile 32 840 - 25 Terquim S.A. Mejillones, Chile 16 840 - 7 IMTT-Quebec Quebec, Canada 293 130 5 500 53 Total tank terminals partly owned by related parties 13 terminals 776 906 40 600 475
PROJECTS AND EXPANSIONS TANK TERMINALS PARTLY OWNED BY RELATED PARTIES*) LOCATION CBM COMPLETION
Depositos Quimicos Mineros S.A. Callao II, Peru 17 850 - ready Q4 2015Granel Quimica Ltda Santos II, Brazil 52 000 - ready Q4 2016Granel Quimica Ltda Sao Luis II, Brazil 52 750 - ready 2015Granel Quimica Ltda Palmas, Brazil 6 000 - ready 2015Total expansion tank terminals partly owned by related parties 128 600 -
Grand total (incl. related tank terminals partly owned by related parties 23 existing terminals 5 448 932 315 513
*) Tank terminals and projects partly owned by Odfjell family.**) Odfjell SE's indirect ownership share
OWNER SHIP**)
OWNER SHIP**)