THIRD QUARTER BRIEF REPORT OF FINANCIAL … · THIRD QUARTER BRIEF REPORT OF FINANCIAL RESULTS 〔...
13
THIRD QUARTER BRIEF REPORT OF FINANCIAL RESULTS 〔under Japanese GAAP〕(Consolidated) (Year ending March 31, 2018) February 7, 2018 Registered Company Name: MINEBEA MITSUMI Inc. Common Stock Listings: Tokyo and Nagoya Code No: 6479 URL: http://www.minebeamitsumi.com/ Representative: Yoshihisa Kainuma Representative Director, CEO & COO Contact: Satoshi Yoneda Executive Officer, General Manager of Accounting Department Quarterly report filing date: February 14, 2018 Phone: (03) 6758-6711 Expected date of payment for dividends: ― Preparation of supplementary explanation material for quarterly financial results : Yes Holding of presentation meeting for quarterly financial results : Yes(For Analyst) (Amounts less than one million yen have been omitted.) 1. Business performance (April 1, 2017 through December 31, 2017) (1) Consolidated Results of Operations (Year-to-date) (%: Changes from corresponding period of previous fiscal year) Net sales (millions of yen) % Change Operating income (millions of yen) % Change Ordinary income (millions of yen) % Change Nine months ended Dec 31, 2017 654,927 48.0 64,389 85.5 64,515 85.5 Nine months ended Dec 31, 2016 442,508 (6.7) 34,715 (19.1) 34,772 (9.6) Income attributable to owners of the parent (millions of yen) % Change Net income per share (yen) Diluted net income per share (yen) Nine months ended Dec 31, 2017 51,555 106.9 122.40 119.52 Nine months ended Dec 31, 2016 24,912 (15.8) 66.46 65.47 (Notes) Comprehensive income: Nine months ended December 31, 2017: 69,025 million yen 169.6 % Nine months ended December 31, 2016: 25,601 million yen 49.1 % (2) Consolidated Financial Position Total assets (millions of yen) Net assets (millions of yen) Equity ratio (%) Net assets per share (yen) As of December 31, 2017 741,050 381,943 50.5 892.18 As of March 31, 2017 643,312 326,218 50.0 759.15 (Reference) Shareholders’ equity: As of December 31, 2017: 374,030 million yen As of March 31, 2017: 321,364 million yen 2. Dividends Annual dividends End of first quarter (yen) End of second quarter (yen) End of third quarter (yen) Year-end (yen) For the year (yen) Year ended March 31, 2017 ― 7.00 ― 7.00 14.00 Year ending March 31, 2018 ― 13.00 ― Year ending March 31, 2018 (Forecast) 13.00 26.00 (Notes) Changes from the latest dividend forecast: None - 1 -
Transcript of THIRD QUARTER BRIEF REPORT OF FINANCIAL … · THIRD QUARTER BRIEF REPORT OF FINANCIAL RESULTS 〔...

THIRD QUARTER BRIEF REPORT OF FINANCIAL RESULTS 〔under Japanese GAAP〕(Consolidated)
(Year ending March 31, 2018) February 7, 2018
Registered Company Name: MINEBEA MITSUMI Inc. Common Stock Listings: Tokyo and Nagoya Code No: 6479 URL: http://www.minebeamitsumi.com/ Representative: Yoshihisa Kainuma Representative Director, CEO & COO Contact: Satoshi Yoneda Executive Officer, General Manager of Accounting Department Quarterly report filing date: February 14, 2018 Phone: (03) 6758-6711 Expected date of payment for dividends: ― Preparation of supplementary explanation material for quarterly financial results : Yes Holding of presentation meeting for quarterly financial results : Yes( For Analyst)
(Amounts less than one million yen have been omitted.) 1. Business performance (April 1, 2017 through December 31, 2017)(1) Consolidated Results of Operations (Year-to-date) (%: Changes from corresponding period of previous fiscal year)
Net sales (millions of yen)
% Change
Operating income (millions of yen)
% Change
Ordinary income (millions of yen)
% Change
Nine months ended Dec 31, 2017 654,927 48.0 64,389 85.5 64,515 85.5 Nine months ended Dec 31, 2016 442,508 (6.7) 34,715 (19.1) 34,772 (9.6)
Income attributable to owners of the parent
(millions of yen)
% Change
Net income per share (yen)
Diluted net income per share (yen)
Nine months ended Dec 31, 2017 51,555 106.9 122.40 119.52 Nine months ended Dec 31, 2016 24,912 (15.8) 66.46 65.47
(Notes) Comprehensive income: Nine months ended December 31, 2017: 69,025 million yen 169.6 % Nine months ended December 31, 2016: 25,601 million yen 49.1 %
(2) Consolidated Financial PositionTotal assets
(millions of yen) Net assets
(millions of yen) Equity ratio
(%) Net assets per share
(yen) As of December 31, 2017 741,050 381,943 50.5 892.18 As of March 31, 2017 643,312 326,218 50.0 759.15
(Reference) Shareholders’ equity: As of December 31, 2017: 374,030 million yen As of March 31, 2017: 321,364 million yen
2. DividendsAnnual dividends
End of first quarter
(yen)
End of second quarter
(yen)
End of third quarter
(yen)
Year-end (yen)
For the year (yen)
Year ended March 31, 2017 ― 7.00 ― 7.00 14.00 Year ending March 31, 2018 ― 13.00 ― Year ending March 31, 2018
(Forecast) 13.00 26.00
(Notes) Changes from the latest dividend forecast: None
- 1 -
mg3m287
ロゴ

3. Prospect for consolidated forecast for the fiscal year (April 1, 2017 through March 31, 2018)(%: Changes from corresponding period of previous fiscal year)
Net sales (millions of yen)
% Change
Operating income (millions of yen)
% Change
Ordinary income (millions of yen)
% Change
Year ending March 31, 2018 850,000 33.0 80,000 63.2 79,500 64.3
Income attributable to ownersof the parent
(millions of yen) %
Change Net income per share
(yen)
Year ending March 31, 2018 62,000 50.7 147.37 (Notes) Changes from the latest consolidated results forecast: Yes
* Notes(1) Changes in significant subsidiaries during the quarter (Changes in certain subsidiaries resulting in change in the scope of
consolidation): None
(2) Application of accounting peculiar to preparation of quarterly consolidated financial statements: None
(3) Changes in accounting policy, changes in accounting estimates, and restatements1. Changes in accounting policy associated with revision of accounting standards, etc: None2. Change in accounting policy other than 1: None3. Changes in accounting estimates: None4. Restatements: None
(4) Number of shares outstanding (Common stock)1. Number of shares outstanding at end of period (Including treasury stock)
As of December 31, 2017: 427,080,606 shares As of March 31, 2017: 427,080,606 shares
2. Number of treasury shares at end of periodAs of December 31, 2017: 7,850,182 shares As of March 31, 2017: 3,758,595 shares
3. Average number of shares (Quarterly cumulative period)Nine months ended December 31, 2017: 421,215,907 sharesNine months ended December 31, 2016: 374,856,097 shares
* Quarterly Brief Report of Financial Results is not subject to the quarterly review.
* Explanation for appropriate use of financial forecasts and other special remarks(Caution Concerning Forward-Looking Statements)
The aforementioned forecasts are based on the information available as of the date when this information is disclosed as well as on the assumptions as of the disclosing date of this information related to unpredictable parameters that will most likely affect our future business performance. As such, this is not intended for the Company to give assurance that the said forecast number would be achieved. In other words, our actual performances are likely to differ greatly from these estimates depending on a variety of factors that will take shape from now on. As for the assumptions used for these forecasts and other related items, please refer to (“1. Qualitative information related to the financial results for this quarter,” “(3) Explanation of Consolidated Forecast and Other Forecasts”) on page 5 of the documents attached hereunder.
(Investor Briefing Materials for Analysts) Investor briefing materials will be made available via our corporate website (http://www.minebeamitsumi.com/) on
Wednesday, February 7, 2018.
- 2 -

Index
1. Qualitative information related to the financial results for the quarter ............................................. 4 (1) Explanation of Operating Results ................................................................................................. 4 (2) Explanation of Financial Position.................................................................................................. 5 (3) Explanation of Consolidated Forecast and Other Forecasts .......................................................... 5
2. Quarterly Consolidated Financial Statements and Major Notes ........................................................ 6(1) Quarterly Consolidated Balance Sheets ........................................................................................ 6 (2) Quarterly Consolidated Statements of Income and Quarterly Consolidated Statements of
Comprehensive Income .............................................................................................................. 8 (Quarterly Consolidated Statements of Income)
(Nine months ended December 31, 2017) ..................................................................................... 8(Quarterly Consolidated Statements of Comprehensive Income)
(Nine months ended December 31, 2017) ..................................................................................... 9 (3) Quarterly Consolidated Statements of Cash Flows ....................................................................... 10 (4) Notes on Quarterly Consolidated Financial Statements................................................................ 12
(Notes on Going Concern Assumptions) ....................................................................................... 12(Notes on Significant Changes in Shareholder’s Equity).............................................................. 12(Additional Information) .............................................................................................................. 12
(Segment Information etc.) .......................................................................................................... 12
3. Supplementary information ............................................................................................................... 14 Supplementary Financial Data for the Third Quarter of Fiscal Year ending March 31, 2018 ........ 14
- 3 -

1. Qualitative information related to the financial results for this quarter(1) Explanation of Operating Results
The Japanese economy continued on a gradual upward trajectory during the first nine months of the fiscal year (April 1,2017 to December 31, 2017) as the growth in compensation of employees along with other factors boosted consumer spending and corporate earnings picked up. The U.S. economy saw steady consumer spending and corporate production due to improvements in the job market and both domestic and foreign demand. The European economy saw steady consumer spending up driven by an increase in compensation of employees, and corporate production, exports and capital expenditures also increased, backed by a strong global economy. In Asia, there were signs of uncertainty moving forward such as curbing of investment in infrastructure and real estate development due to rising interest rates, and strengthening of measures to prevent environmental pollution in the Chinese economy.
Working against this backdrop, Our Group has been concentrating on cutting costs, creating high-value-added products, developing new technologies, and enhancing its marketing approach to boost profitability further.
As a result, net sales rose 212,419 million yen (48.0%) year on year to total 654,927 million yen, marking the highest level on record for the first nine months of the fiscal year. Operating income rose 29,674 million yen (85.5%) year on year to total 64,389 million yen, ordinary income was up 29,743 million yen (85.5%) year on year at 64,515 million yen, and income attributable to owners of the parent increased 26,643 million yen (106.9%) year on year to reach 51,555 million yen, with all of these at record levels for the first nine months of the fiscal year.
Performance by segment was as follows: Products in our Machined components segment include our mainstay product, ball bearings, mechanical
components, such as rod-end bearings used primarily in aircraft and hard disk drive (HDD) pivot assemblies, etc. as well as fasteners for automobiles and aircraft. Sales of ball bearings to external customers hit a record high in November as needs for energy-efficient models equipped with safety devices expanded and demand for fan motors rose in the automobile market. Due to the effect of the HDD market shrinking, pivot assembly sales were down, yet revenues remained at the same level year on year due to currency fluctuations as well as other factors. Furthermore, although there was a decline in production of large models in the civil aircraft market, rod-end bearing sales increased due to impact of the foreign exchange market among other factors.
This resulted in net sales for the first nine months of 129,101 million yen, an increase of 14,111 million yen (12.3%) year on year. Operating income increased by 3,228 million yen (11.1%) year on year to 32,263 million yen.
The core products of our Electronic devices and components segment include electronic devices (LED backlights for LCDs, sensing devices (measuring components), etc.), HDD spindle motors, stepping motors, DC motors, air movers (fan motors), precision motors, and special devices. Demand for our LED backlights for LCDs that offer a technological advantage in thin smartphones continued to soar. Sales of stepping motors and other motors grew mainly in the automobile and office automation markets.
This resulted in net sales for the first nine months of 349,764 million yen, an increase of 22,757 million yen (7.0%) year on year. Operating income increased by 7,442 million yen (45.7%) year on year to 23,734 million yen.
The main products in the MITSUMI business segment are semiconductor devices, optical devices, mechanical components, high frequency components and power supply components. Camera actuators, game console mechanism components, switches, products for smartphones such as protection IC, antennas, communication modules and connectors all performed well.
In the end, net sales for the first nine-month period came to 175,551 million yen and operating income totaled 20,135 million yen.
Machines produced in-house are the main products in our Other business segment. Net sales for the first nine months were around the same level year on year to total 510 million yen, while operating losses increased 42 million yen year on year to total 145 million yen.
In addition to the figures noted above, 11,597 million yen in corporate expenses, etc. not belonging to any particular segment is indicated as adjustments. The total amount of adjustments was 10,508 million yen during the same period last year.
- 4 -

(2) Explanation of Financial PositionOur Group sees “strengthening our financial position” as a top priority and is taking various steps, such as efficient
asset management, controlling capital investments, and reducing interest-bearing debt.Total assets at the end of the current third quarter amounted to 741,050 million yen, up 97,738 million yen compared
to the end of the previous fiscal year. The main reasons for this uptick include increases in notes and accountsreceivable, an increase in inventories, as well as an increase in tangible fixed assets. Total liabilities amounted to359,106 million yen, representing an increase of 42,013 million yen over what it was at the end of the previous fiscalyear. This jump was primarily due to an increase in notes and accounts payable. Net assets amounted to 381,943million yen, resulting in an equity ratio of 50.5%, up 0.5 percentage points from what it was at the end of the previousfiscal year.
(Cash flow)The balance of cash and cash equivalents at the end of the third quarter was 83,810 million yen, up 4,978 million yen
from what it was at the end of the previous fiscal year. Furthermore, this was up 43,825 million yen compared to theend of the same period of the previous fiscal year because there was an increase of 32,472 million yen arising from theconsolidation of MITSUMI ELECTRIC CO., LTD. and its subsidiaries.
Cash flows from various business activities for the first three quarters and other relevant factors are as follows: Net cash provided by operating activities amounted to 60,605 million yen (an inflow of 53,423 million yen in the same
period of the previous year). This is mainly due to increases and decreases in income before income taxes, depreciation and amortization, notes and accounts payable, notes and accounts receivable and inventories. Net cash used for investing activities amounted to 42,175 million yen (an outflow of 39,626 million yen in the same period of the previous year). This is mainly due to the purchase of tangible fixed assets and the purchase of investments in subsidiaries resulting in change in scope of consolidation, etc. Net cash used for financing activities amounted to 16,562 million yen (an outflow of 1,575 million yen in the same period of the previous year). This was mainly due to the purchase of treasury stock and cash dividends paid, etc.
(3) Explanation of Consolidated Forecast and Other ForecastsIt's difficult to get a clear picture of where the global economy is headed for the remainder of this fiscal year. It is too
early to tell how it will be affected by policies of the U.S. and other countries, geopolitical risks, and fluctuatingexchange rates.
After reviewing our consolidated full-year forecast in light of this backdrop and making our best estimate of the totalimpact current market conditions as well as our performance during the first nine-month period will have on ouroperations, we have decided to revise the forecast as shown below.
Net sales 850,000 million yen (133.0%) Operating income 80,000 million yen (163.2%) Ordinary income 79,500 million yen (164.3%) Income attributable to owners of the parent 62,000 million yen (150.7%)
(%): Year-on-year change
Sharing profits with our shareholders is job one at MinebeaMitsumi. That's why our basic dividend policy gives priority to enhancing equity efficiency and improving returns to our shareholders. Dividends, while reflecting performance, are determined in light of the overall business environment and with an eye to maintaining a stable and continuous distribution of profits.
Working in line with our basic policy, we paid the interim dividend of 13 yen per share in December, up 6 yen over what it was last fiscal year. While we plan to increase the year-end dividend by 6 yen over what it was last fiscal year and make it 13 yen per share, we will finalize the amount in light of our performance for this fiscal year with the aim of achieving a consolidated-basis dividend payout ratio of around 20%.
- 5 -
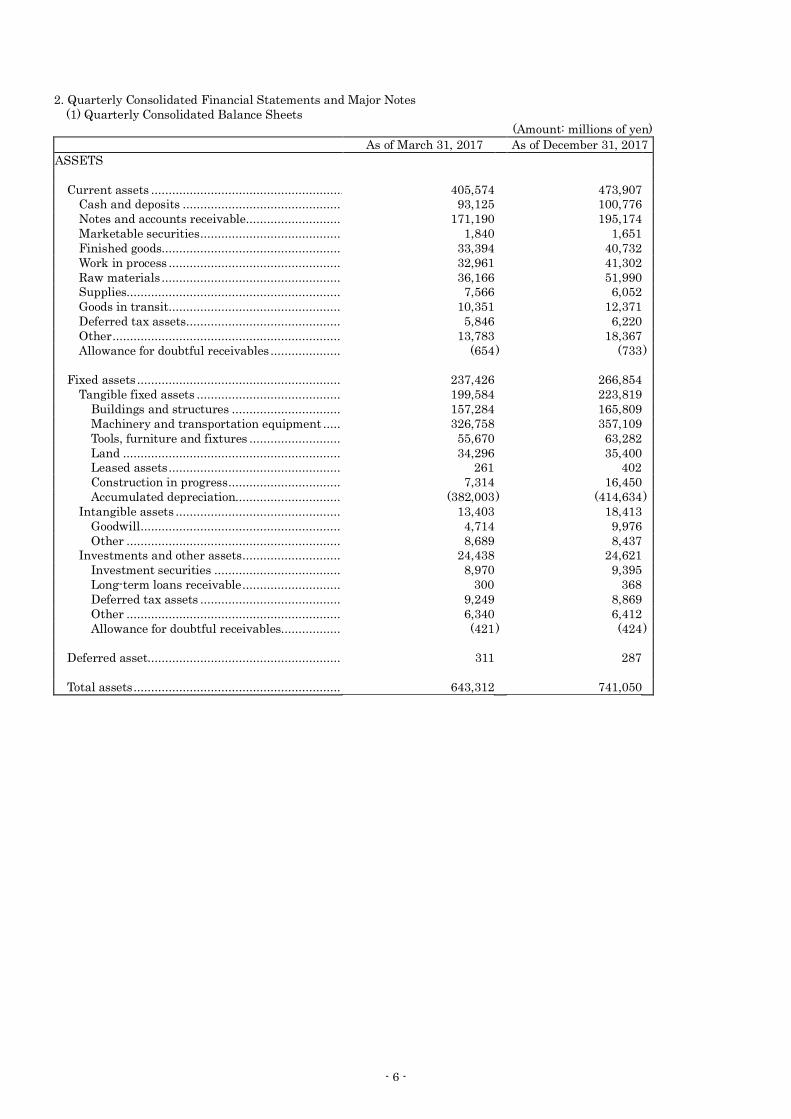
2. Quarterly Consolidated Financial Statements and Major Notes(1) Quarterly Consolidated Balance Sheets
(Amount: millions of yen) As of March 31, 2017 As of December 31, 2017
ASSETS
Current assets ....................................................... 405,574 473,907 Cash and deposits ............................................. 93,125 100,776 Notes and accounts receivable ........................... 171,190 195,174 Marketable securities ........................................ 1,840 1,651 Finished goods................................................... 33,394 40,732 Work in process ................................................. 32,961 41,302 Raw materials ................................................... 36,166 51,990 Supplies............................................................. 7,566 6,052 Goods in transit ................................................. 10,351 12,371 Deferred tax assets ............................................ 5,846 6,220 Other ................................................................. 13,783 18,367 Allowance for doubtful receivables .................... (654 ) (733 )
Fixed assets .......................................................... 237,426 266,854 Tangible fixed assets ......................................... 199,584 223,819
Buildings and structures ............................... 157,284 165,809 Machinery and transportation equipment ..... 326,758 357,109 Tools, furniture and fixtures .......................... 55,670 63,282 Land .............................................................. 34,296 35,400 Leased assets ................................................. 261 402 Construction in progress ................................ 7,314 16,450 Accumulated depreciation.............................. (382,003 ) (414,634 )
Intangible assets ............................................... 13,403 18,413 Goodwill ......................................................... 4,714 9,976 Other ............................................................. 8,689 8,437
Investments and other assets ............................ 24,438 24,621 Investment securities .................................... 8,970 9,395 Long-term loans receivable ............................ 300 368 Deferred tax assets ........................................ 9,249 8,869 Other ............................................................. 6,340 6,412 Allowance for doubtful receivables................. (421 ) (424 )
Deferred asset....................................................... 311 287
Total assets ........................................................... 643,312 741,050
- 6 -
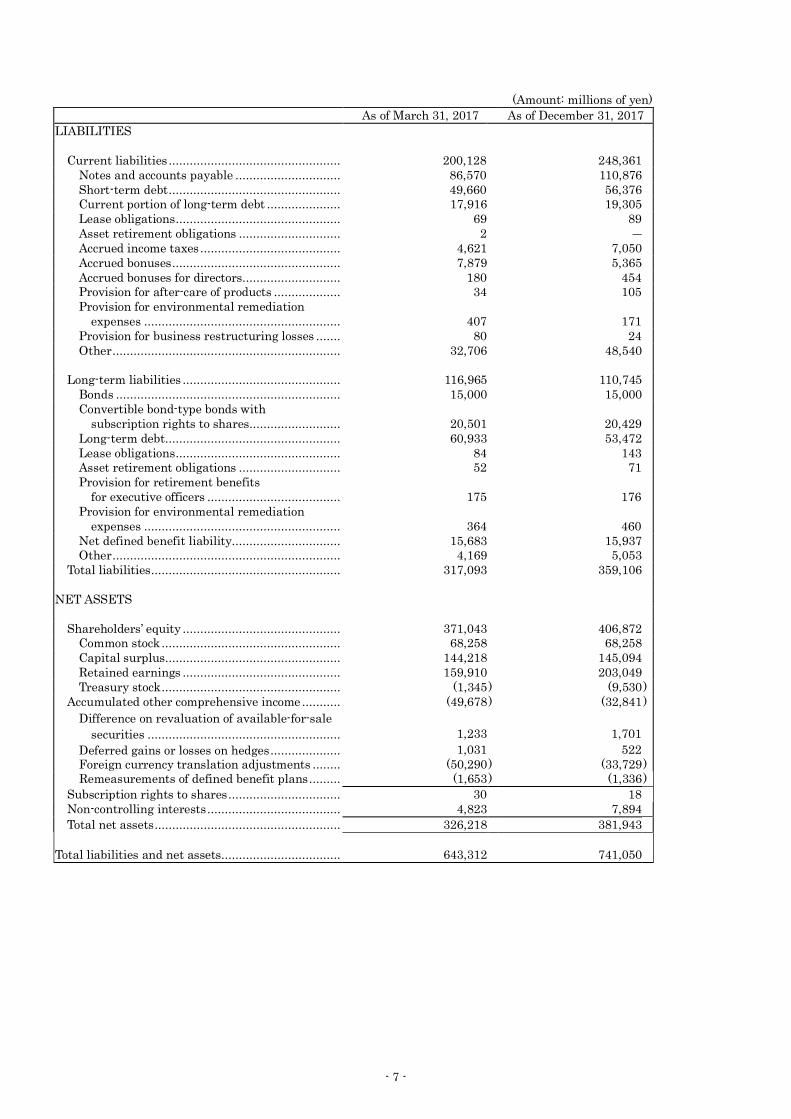
(Amount: millions of yen) As of March 31, 2017 As of December 31, 2017
LIABILITIES
Current liabilities ................................................. 200,128 248,361 Notes and accounts payable .............................. 86,570 110,876 Short-term debt ................................................. 49,660 56,376 Current portion of long-term debt ..................... 17,916 19,305 Lease obligations ............................................... 69 89 Asset retirement obligations ............................. 2 ― Accrued income taxes ........................................ 4,621 7,050 Accrued bonuses ................................................ 7,879 5,365 Accrued bonuses for directors ............................ 180 454 Provision for after-care of products ................... 34 105 Provision for environmental remediation
expenses ........................................................ 407 171 Provision for business restructuring losses ....... 80 24 Other ................................................................. 32,706 48,540
Long-term liabilities ............................................. 116,965 110,745 Bonds ................................................................ 15,000 15,000 Convertible bond-type bonds with
subscription rights to shares .......................... 20,501 20,429 Long-term debt .................................................. 60,933 53,472 Lease obligations ............................................... 84 143 Asset retirement obligations ............................. 52 71 Provision for retirement benefits
for executive officers ...................................... 175 176 Provision for environmental remediation
expenses ........................................................ 364 460 Net defined benefit liability............................... 15,683 15,937 Other ................................................................. 4,169 5,053
Total liabilities ...................................................... 317,093 359,106
NET ASSETS
Shareholders’ equity ............................................. 371,043 406,872 Common stock ................................................... 68,258 68,258 Capital surplus .................................................. 144,218 145,094 Retained earnings ............................................. 159,910 203,049 Treasury stock ................................................... (1,345 ) (9,530 )
Accumulated other comprehensive income ........... (49,678 ) (32,841 ) Difference on revaluation of available-for-sale
securities ....................................................... 1,233 1,701 Deferred gains or losses on hedges .................... 1,031 522 Foreign currency translation adjustments ........ (50,290 ) (33,729 )
Remeasurements of defined benefit plans ......... (1,653 ) (1,336 ) Subscription rights to shares ................................ 30 18 Non-controlling interests ...................................... 4,823 7,894 Total net assets ..................................................... 326,218 381,943
Total liabilities and net assets .................................. 643,312 741,050
- 7 -
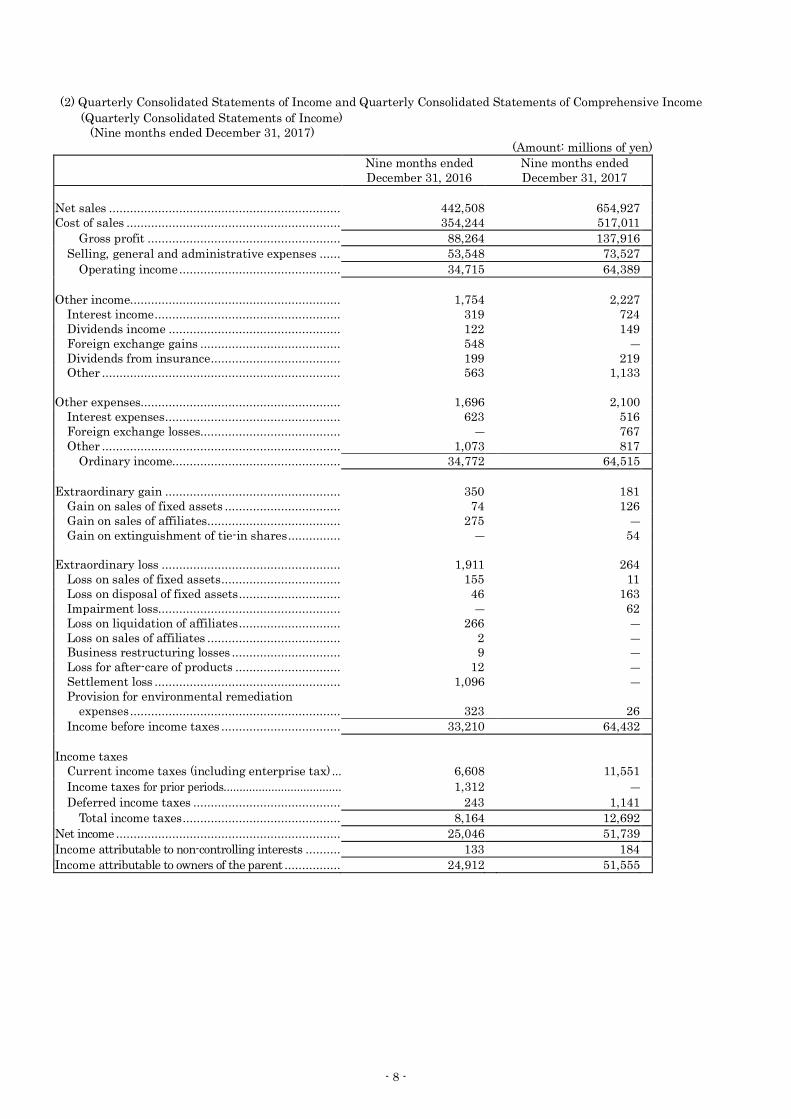
(2) Quarterly Consolidated Statements of Income and Quarterly Consolidated Statements of Comprehensive Income(Quarterly Consolidated Statements of Income)
(Nine months ended December 31, 2017) (Amount: millions of yen)
Nine months ended December 31, 2016
Nine months ended December 31, 2017
Net sales .................................................................. 442,508 654,927 Cost of sales ............................................................. 354,244 517,011
Gross profit ....................................................... 88,264 137,916 Selling, general and administrative expenses ...... 53,548 73,527
Operating income .............................................. 34,715 64,389
Other income............................................................ 1,754 2,227 Interest income ..................................................... 319 724 Dividends income ................................................. 122 149 Foreign exchange gains ........................................ 548 ― Dividends from insurance ..................................... 199 219 Other .................................................................... 563 1,133
Other expenses......................................................... 1,696 2,100 Interest expenses .................................................. 623 516 Foreign exchange losses........................................ ― 767 Other .................................................................... 1,073 817
Ordinary income................................................ 34,772 64,515
Extraordinary gain .................................................. 350 181 Gain on sales of fixed assets ................................. 74 126 Gain on sales of affiliates ...................................... 275 ― Gain on extinguishment of tie-in shares ............... ― 54
Extraordinary loss ................................................... 1,911 264 Loss on sales of fixed assets .................................. 155 11 Loss on disposal of fixed assets ............................. 46 163 Impairment loss.................................................... ― 62 Loss on liquidation of affiliates ............................. 266 ― Loss on sales of affiliates ...................................... 2 ― Business restructuring losses ............................... 9 ― Loss for after-care of products .............................. 12 ― Settlement loss ..................................................... 1,096 ― Provision for environmental remediation
expenses ............................................................ 323 26 Income before income taxes .................................. 33,210 64,432
Income taxes Current income taxes (including enterprise tax) ... 6,608 11,551 Income taxes for prior periods..................................... 1,312 ― Deferred income taxes .......................................... 243 1,141
Total income taxes ............................................. 8,164 12,692 Net income ................................................................ 25,046 51,739 Income attributable to non-controlling interests .......... 133 184 Income attributable to owners of the parent ................ 24,912 51,555
- 8 -

(Quarterly Consolidated Statements of Comprehensive Income) (Nine months ended December 31, 2017)
(Amount: millions of yen) Nine months ended December 31, 2016
Nine months ended December 31, 2017
Net income ................................................................ 25,046 51,739
Other comprehensive income: Difference on revaluation of available-for-sale
securities ....................................................... 835 468 Deferred gains or losses on hedges .................... (61 ) (509 ) Foreign currency translation adjustments ........ (840 ) 17,010
Remeasurements of defined benefit plans ......... 793 317 Share of other comprehensive income of
associates accounted for using the equity method ........................................................... (172 ) ―
Total other comprehensive income ........................ 554 17,286
Comprehensive income ............................................ 25,601 69,025
Comprehensive income attributable to: Owners of the parent ......................................... 26,353 68,391
Non-controlling interests................................... (752 ) 633
- 9 -
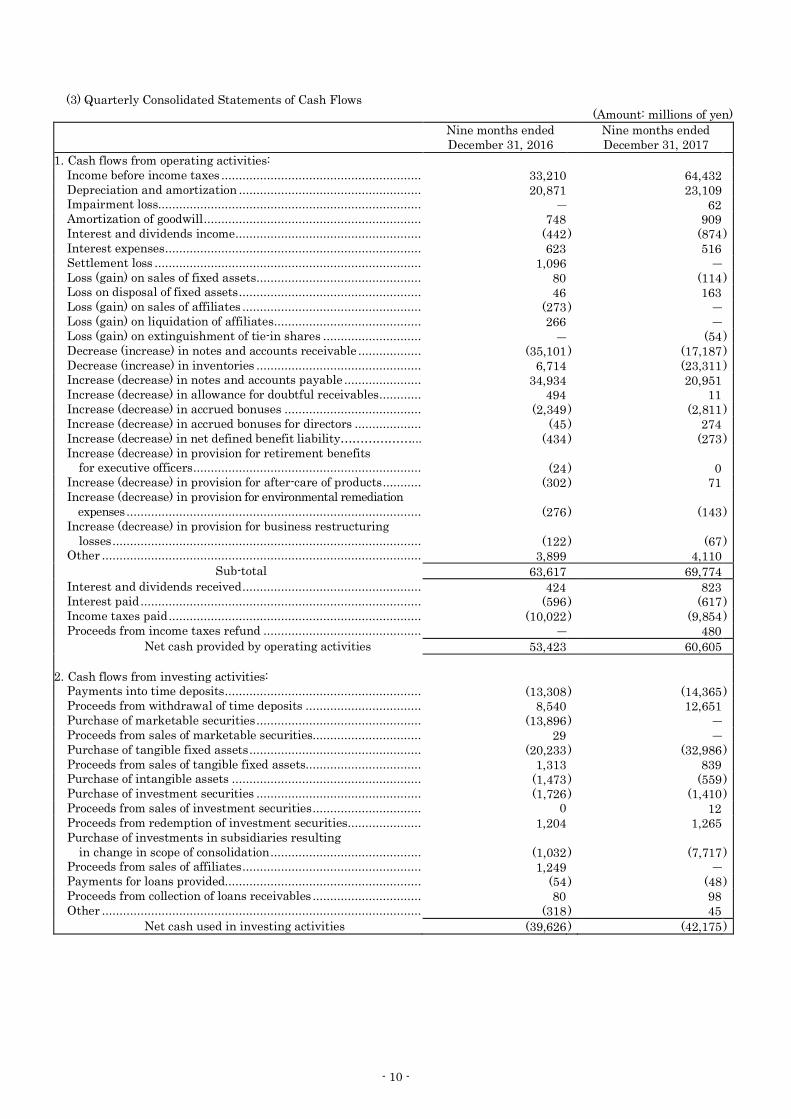
(3) Quarterly Consolidated Statements of Cash Flows(Amount: millions of yen)
Nine months ended December 31, 2016
Nine months ended December 31, 2017
1. Cash flows from operating activities:Income before income taxes ......................................................... 33,210 64,432 Depreciation and amortization .................................................... 20,871 23,109 Impairment loss........................................................................... ― 62 Amortization of goodwill .............................................................. 748 909 Interest and dividends income ..................................................... (442 ) (874 ) Interest expenses ......................................................................... 623 516 Settlement loss ............................................................................ 1,096 ― Loss (gain) on sales of fixed assets ............................................... 80 (114 ) Loss on disposal of fixed assets .................................................... 46 163 Loss (gain) on sales of affiliates ................................................... (273 ) ― Loss (gain) on liquidation of affiliates .......................................... 266 ― Loss (gain) on extinguishment of tie-in shares ............................ ― (54 ) Decrease (increase) in notes and accounts receivable .................. (35,101 ) (17,187 ) Decrease (increase) in inventories ............................................... 6,714 (23,311 ) Increase (decrease) in notes and accounts payable ...................... 34,934 20,951 Increase (decrease) in allowance for doubtful receivables ............ 494 11 Increase (decrease) in accrued bonuses ....................................... (2,349 ) (2,811 ) Increase (decrease) in accrued bonuses for directors ................... (45 ) 274 Increase (decrease) in net defined benefit liability………………... (434 ) (273 ) Increase (decrease) in provision for retirement benefits
for executive officers ................................................................. (24 ) 0 Increase (decrease) in provision for after-care of products ........... (302 ) 71 Increase (decrease) in provision for environmental remediation
expenses .................................................................................... (276 ) (143 ) Increase (decrease) in provision for business restructuring
losses ........................................................................................ (122 ) (67 ) Other ........................................................................................... 3,899 4,110
Sub-total 63,617 69,774 Interest and dividends received ................................................... 424 823 Interest paid ................................................................................ (596 ) (617 ) Income taxes paid ........................................................................ (10,022 ) (9,854 ) Proceeds from income taxes refund ............................................. ― 480
Net cash provided by operating activities 53,423 60,605
2. Cash flows from investing activities:Payments into time deposits ........................................................ (13,308 ) (14,365 ) Proceeds from withdrawal of time deposits ................................. 8,540 12,651 Purchase of marketable securities ............................................... (13,896 ) ― Proceeds from sales of marketable securities............................... 29 ― Purchase of tangible fixed assets ................................................. (20,233 ) (32,986 ) Proceeds from sales of tangible fixed assets................................. 1,313 839 Purchase of intangible assets ...................................................... (1,473 ) (559 ) Purchase of investment securities ............................................... (1,726 ) (1,410 ) Proceeds from sales of investment securities ............................... 0 12 Proceeds from redemption of investment securities ..................... 1,204 1,265 Purchase of investments in subsidiaries resulting
in change in scope of consolidation ........................................... (1,032 ) (7,717 ) Proceeds from sales of affiliates ................................................... 1,249 ― Payments for loans provided........................................................ (54 ) (48 ) Proceeds from collection of loans receivables ............................... 80 98 Other ........................................................................................... (318 ) 45
Net cash used in investing activities (39,626 ) (42,175 )
- 10 -

(Amount: millions of yen) Nine months ended December 31, 2016
Nine months ended December 31, 2017
3. Cash flows from financing activities:Net increase (decrease) in short-term debt .................................. (18,759 ) 5,647 Proceeds from long-term debt ...................................................... 35,598 ― Repayment of long-term debt ...................................................... (2,665 ) (6,360 ) Payment for redemption of bonds ................................................ (10,000 ) ― Purchase of treasury stock........................................................... (0 ) (8,372 ) Proceeds from disposal of treasury stock ..................................... 744 1,051 Cash dividends paid .................................................................... (6,368 ) (8,410 ) Dividends paid to non-controlling interests ................................. (62 ) (23 ) Repayment of lease obligations.................................................... (60 ) (90 ) Other ........................................................................................... 0 (2 )
Net cash used in financing activities (1,575 ) (16,562 ) 4. Effect of exchange rate changes on cash and cash equivalents (1,377 ) 2,831 5. Net increase (decrease) in cash and cash equivalents 10,843 4,698 6. Cash and cash equivalents at beginning of period 29,141 78,832 7. Increase in cash and cash equivalents from newly consolidated
subsidiaries ― 186 8. Increase in cash and cash equivalents resulting from merger
with unconsolidated subsidiaries ― 92 9. Cash and cash equivalents at end of period 39,985 83,810
- 11 -

(4) Notes on Quarterly Consolidated Financial Statements(Notes on Going Concern Assumptions)
Not applicable.
(Notes on Significant Changes in Shareholders’ Equity) On September 22, 2017, the Company completed the acquisition of its own shares in accordance with resolution of the
Board of Directors meeting held on February 13, 2017. 8,351 million yen increase resulting from this share buyback is reflected in the quarterly consolidated financial statements. A decrease of 179 million yen as a result of the disposal of our own shares via the Employee Stock Holding Exclusive Trust Account, etc. are accounted for in the 9,530 million yen total amount of our own shares as of the end of the third quarter consolidated financial period.
(Additional Information) (Adoption of consolidated tax accounting system)
The Company and some of its domestic consolidated subsidiaries have adopted the consolidated taxation system, with MINEBEA MITSUMI Inc. as the consolidated taxable parent company, starting from the first quarter of the current fiscal year ending March 31, 2018.
(Segment Information etc.) Ⅰ Nine months ended December 31, 2016
1. Information related to sales and income (loss) by reportable segments(Amount: millions of yen)
Reportable segments
Other *1
Total Adjustment *2
Quarterly Consolidated Statements of
Income amount *3
Machined components
Electronic devices and components
MITSUMI business Total
Total sales(1) Sales to
customers(2) Sales to other
segment
114,990
2,783
327,007
2,731
―
―
441,997
5,515
510
687
442,508
6,203
―
(6,203)
442,508
―
Total 117,774 329,739 ― 447,513 1,198 448,711 (6,203) 442,508 Segment income (loss) 29,035 16,292 ― 45,327 (103) 45,224 (10,508) 34,715
(Notes) *1. The classification of “Other” refers to business units not included in the reportable segments. Their products are mainly machines made in-house.
*2. Adjustments to segment income (loss) are amortization of goodwill -748 million yen, and corporateexpenses such as general and administrative expenses in addition to research and development expenses that do not belong to the reportable segments -9,760 million yen.
*3. Segment income (loss) is reconciled to operating income in the quarterly consolidated statements ofincome.
2. Information related to impairment loss of fixed assets or goodwill, etc. by reportable segmentsNot applicable.
- 12 -

Ⅱ Nine months ended December 31, 2017 1. Information related to sales and income (loss) by reportable segments
(Amount: millions of yen)
Reportable segments
Other *1
Total Adjustment *2
Quarterly Consolidated Statements of
Income amount *3
Machined components
Electronic devices and components
MITSUMI business Total
Total sales(1) Sales to
customers(2) Sales to other
segment
129,101
5,592
349,764
4,358
175,551
887
654,417
10,838
510
2,223
654,927
13,062
―
(13,062)
654,927
―
Total 134,694 354,123 176,438 665,256 2,734 667,990 (13,062) 654,927 Segment income (loss) 32,263 23,734 20,135 76,132 (145) 75,986 (11,597) 64,389
(Notes) *1. The classification of “Other” refers to business units not included in the reportable segments. Their products are mainly machines made in-house.
*2. Adjustments to segment income (loss) are amortization of goodwill -909 million yen, and corporateexpenses such as general and administrative expenses in addition to research and development expenses that do not belong to the reportable segments -10,688 million yen.
*3. Segment income (loss) is reconciled to operating income in the quarterly consolidated statements ofincome.
2. Information related to impairment loss of fixed assets or goodwill, etc. by reportable segments(Significant impairment loss of fixed assets)
(Amount: millions of yen)Reportable segments
Other All companies Total Machined components
Electronic devices and components
MITSUMI business Total
Impairment loss - 62 - 62 - - 62
(Significant change in the amount of goodwill) Not applicable.
(Significant gain on negative goodwill) Not applicable.
- 13 -