Third quarter and first nine months 2012 › ... › total-20121031-sem3-pr.pdf · 10/31/2012 ·...
37
1 Paris, October 31, 2012 Third quarter and first nine months 2012 3Q12 Change vs 3Q11 9M12 Change vs 9M11 Adjusted net income 1 - in billion euros (B€) 3.3 +20% 9.3 +7% - in billion dollars (B$) 4.2 +6% 11.9 -3% - in euros per share 1.48 +19% 4.10 +6% - in dollars per share 1.85 +5% 5.25 -3% Net income 2 of 3.1 B€ in 3Q12 and 8.3 B€ 3 Gearing ratio of 20.8% at September 30, 2012 in the first nine months of 2012 Hydrocarbon production of 2,272 kboe/d in 3Q12 Interim dividend for 3Q12 of 0.59 €/share payable in March 2013 4 Commenting on the results, Chairman and CEO Christophe de Margerie said: «Total reported adjusted net income of 3.3 billion euros for the third quarter 2012, an increase of 20% compared to the third quarter 2011, reflecting good performance across all segments. In Upstream, the Group reaffirms its confidence in its outlook for profitable growth thanks to the ramp-up of recent start-ups and the progress of major projects in development. Notably, Total launched the development of the Tempa Rossa field in Italy this quarter. In exploration, the Group is entering a period rich with high-potential wells, notably in the Gulf of Mexico, Iraq, Ivory Coast, Kenya and Gabon, and is increasing its acreage in promising plays. The quarter was also marked by a sharp increase in refining margins. The results of Refining & Chemicals increased by 54%, despite a turnaround at the Normandy refinery which is part of the modernization of one of the Group’s major integrated platforms and key to its strategy for the segment. In line with the announced asset sale program, Total continued to optimize its portfolio during the quarter and, in particular, sold Upstream assets in the UK and Nigeria. The total proceeds for asset sales since the beginning of the year reached about 5 billion dollars, including the sale of the Group’s remaining shares of Sanofi. These good results and the Group’s discipline reinforced its strong financial position this quarter. In a responsible and sustainable manner, Total is improving its competitiveness across all operational segments and remains focused on creating value through the Group’s new dynamic for growth.» 1 Adjusted results defined on page 2 - dollar amounts represent euro amounts converted at the average €-$ exchange rate for the period: 1.2502 $/€ for 3Q12, 1.4127 $/€ for 3Q11, 1.2814 $/€ for 2Q12, 1.2808 $/€ for the first nine months of 2012, and 1.4065 $/€ for the first nine months of 2011. 2 Net income, Group share. 3 includes positive impact of after-tax inventory effect of 524 M€ in the third quarter 2012. Details of adjustments on pages 4 and 17. 4 The ex-dividend date for the interim dividend will be March 18, 2013 and the payment date will be March 21, 2013. Communiqué de Presse News Release 2, place Jean Millier La Défense 6 92 400 Courbevoie France Tel. : (33) 1 47 44 58 53 Fax : (33) 1 47 44 58 24 Martin DEFFONTAINES Matthieu GOT Karine KACZKA Robert PERKINS Magali PAILHE Robert HAMMOND (U.S.) Tel. : (1) 713-483-5070 Fax : (1) 713-483-5629 TOTAL S.A. Capital 5 912 835 657,50 euros 542 051 180 R.C.S. Nanterre www.total.com
Transcript of Third quarter and first nine months 2012 › ... › total-20121031-sem3-pr.pdf · 10/31/2012 ·...
1
TOTAL 2, place de la Coupole La Défense 6 92 400 Courbevoie France Tel. : 33 (1) 47 44 58 53 Fax : 33 (1) 47 44 58 24 Jérôme SCHMITT Philippe HERGAUX Sandrine SABOUREAU Laurent KETTENMEYER Robert HAMMOND (U.S.) Tel. : (1) 201 626 3500 Fax : (1) 201 626 4004 TOTAL S.A Capital 5 981 907 382 euros 542 051 180 R.C.S. Nanterre www.total.com
Paris, October 31, 2012
Third quarter and first nine months 2012
3Q12 Change vs 3Q11
9M12 Change vs 9M11
Adjusted net income1 - in billion euros (B€) 3.3 +20% 9.3 +7%
- in billion dollars (B$) 4.2 +6% 11.9 -3% - in euros per share 1.48 +19% 4.10 +6%
- in dollars per share 1.85 +5% 5.25 -3%
Net income2 of 3.1 B€ in 3Q12 and 8.3 B€3
Gearing ratio of 20.8% at September 30, 2012 in the first nine months of 2012
Hydrocarbon production of 2,272 kboe/d in 3Q12 Interim dividend for 3Q12 of 0.59 €/share payable in March 20134
Commenting on the results, Chairman and CEO Christophe de Margerie said:
«Total reported adjusted net income of 3.3 billion euros for the third quarter 2012, an increase of 20% compared to the third quarter 2011, reflecting good performance across all segments. In Upstream, the Group reaffirms its confidence in its outlook for profitable growth thanks to the ramp-up of recent start-ups and the progress of major projects in development. Notably, Total launched the development of the Tempa Rossa field in Italy this quarter. In exploration, the Group is entering a period rich with high-potential wells, notably in the Gulf of Mexico, Iraq, Ivory Coast, Kenya and Gabon, and is increasing its acreage in promising plays. The quarter was also marked by a sharp increase in refining margins. The results of Refining & Chemicals increased by 54%, despite a turnaround at the Normandy refinery which is part of the modernization of one of the Group’s major integrated platforms and key to its strategy for the segment. In line with the announced asset sale program, Total continued to optimize its portfolio during the quarter and, in particular, sold Upstream assets in the UK and Nigeria. The total proceeds for asset sales since the beginning of the year reached about 5 billion dollars, including the sale of the Group’s remaining shares of Sanofi. These good results and the Group’s discipline reinforced its strong financial position this quarter. In a responsible and sustainable manner, Total is improving its competitiveness across all operational segments and remains focused on creating value through the Group’s new dynamic for growth.»
1 Adjusted results defined on page 2 - dollar amounts represent euro amounts converted at the average €-$ exchange rate for the period: 1.2502 $/€ for 3Q12, 1.4127 $/€ for 3Q11, 1.2814 $/€ for 2Q12, 1.2808 $/€ for the first nine months of 2012, and 1.4065 $/€ for the first nine months of 2011. 2 Net income, Group share. 3 includes positive impact of after-tax inventory effect of 524 M€ in the third quarter 2012. Details of adjustments on pages 4 and 17. 4 The ex-dividend date for the interim dividend will be March 18, 2013 and the payment date will be March 21, 2013.
Com
mun
iqué
de
Pres
se
New
s Rel
ease
2, place Jean Millier La Défense 6 92 400 Courbevoie France Tel. : (33) 1 47 44 58 53 Fax : (33) 1 47 44 58 24 Martin DEFFONTAINES Matthieu GOT Karine KACZKA Robert PERKINS Magali PAILHE Robert HAMMOND (U.S.) Tel. : (1) 713-483-5070 Fax : (1) 713-483-5629 TOTAL S.A. Capital 5 912 835 657,50 euros 542 051 180 R.C.S. Nanterre www.total.com

2
TOTAL 2, place de la Coupole La Défense 6 92 400 Courbevoie France Tel. : 33 (1) 47 44 58 53 Fax : 33 (1) 47 44 58 24 Jérôme SCHMITT Philippe HERGAUX Sandrine SABOUREAU Laurent KETTENMEYER Robert HAMMOND (U.S.) Tel. : (1) 201 626 3500 Fax : (1) 201 626 4004 TOTAL S.A Capital 5 981 907 382 euros 542 051 180 R.C.S. Nanterre www.total.com
Key figures5
3Q12 2Q12 3Q11 3Q12
vs 3Q11
in millions of euros except earnings per share and number of shares 9M12 9M11
9M12 vs
9M11
49,890 49,135 46,163 +8% Sales 150,193 137,201 +9%
6,540 5,793 5,881 +11% Adjusted operating income from business segments 19,112 18,146 +5%
3,698 3,124 2,950 +25% Adjusted net operating income from business segments 10,079 9,214 +9%
2,891 2,560 2,388 +21% Upstream 8,507 7,750 +10%
564 383 367 +54% Refining & Chemicals 1,008 813 +24%
243 181 195 +25% Supply & Marketing 564 651 -13%
3,348 2,858 2,801 +20% Adjusted net income 9,280 8,699 +7%
1.48 1.26 1.24 +19% Adjusted fully-diluted earnings per share (euros) 4.10 3.86 +6%
2,268 2,264 2,261 - Fully-diluted weighted-average shares (millions) 2,265 2,255 -
3,066 1,585 3,314 -7% Net income (Group share) 8,313 9,986 -17%
5,416 4,964 3,921 +38% Investments6 16,320 17,174 -5%
1,635 980 5,082 -68% Divestments 4,305 7,083 -39%
3,781 3,984 (1,161) n/a Net investments 12,015 10,091 +19%
5,163 6,167 5,964 -13% Cash flow from operations 16,597 16,742 -1%
6,058 4,768 4,575 +32% Adjusted cash flow from operations 15,921 14,195 +12%
3Q12 2Q12 3Q11 3Q12
vs 3Q11
in millions of dollars79M12
except earnings per share and number of shares 9M11 9M12
vs 9M11
62,375 62,962 65,214 -4% Sales 192,370 192,973 -
8,177 7,423 8,308 -2% Adjusted operating income from business segments 24,479 25,522 -4%
4,623 4,003 4,167 +11% Adjusted net operating income from business segments 12,909 12,959 -
3,614 3,280 3,374 +7% Upstream 10,896 10,900 -
705 491 518 +36% Refining & Chemicals 1,291 1,143 +13%
304 232 275 +10% Supply & Marketing 722 916 -21%
4,186 3,662 3,957 +6% Adjusted net income 11,886 12,235 -3%
1.85 1.62 1.75 +5% Adjusted fully-diluted earnings per share (dollars) 5.25 5.43 -3%
2,268 2,264 2,261 - Fully-diluted weighted-average shares (millions) 2,265 2,255 -
3,833 2,031 4,682 -18% Net income (Group share) 10,647 14,045 -24%
6,771 6,361 5,539 +22% Investments6 20,903 24,155 -13%
2,044 1,256 7,179 -72% Divestments 5,514 9,962 -45%
4,727 5,105 (1,640) n/a Net investments 15,389 14,193 +8%
6,455 7,902 8,425 -23% Cash flow from operations 21,257 23,548 -10%
7,574 6,110 6,463 +17% Adjusted cash flow from operations 20,392 19,965 +2%
5 Adjusted results are defined as income using replacement cost, adjusted for special items, excluding the impact of changes for fair value. Adjusted cash flow from operations is defined as cash flow from operations before changes in working capital at replacement cost; adjustment items are on page 17 and the inventory valuation effect is explained on page 14. 6 including acquisitions 7 Dollar amounts represent euro amounts converted at the average €-$ exchange rate for the period.

3
TOTAL 2, place de la Coupole La Défense 6 92 400 Courbevoie France Tel. : 33 (1) 47 44 58 53 Fax : 33 (1) 47 44 58 24 Jérôme SCHMITT Philippe HERGAUX Sandrine SABOUREAU Laurent KETTENMEYER Robert HAMMOND (U.S.) Tel. : (1) 201 626 3500 Fax : (1) 201 626 4004 TOTAL S.A Capital 5 981 907 382 euros 542 051 180 R.C.S. Nanterre www.total.com
Highlights since the beginning of the third quarter 2012
• Start-up of the Atla field in the Norwegian North Sea
• Increased stake from 24% to 30% in the Ichthys LNG project in Australia
• Exchange of assets in the Norwegian North Sea to increase Total’s interest in the Oseberg field and the Dagny field to 14.7% and 39.54%, respectively
• Sold an indirect interest of 9.99% in Block 14 in Angola
• Sold the Group’s remaining shares of Sanofi (1.3%)
• Continued the optimization of the Refining & Chemicals portfolio with sale of a 40% interest in Géostock
• Launched new development phase of the Yucal Placer gas field in Venezuela and the development of Tempa Rossa in Italy
• Issued notice of commerciality for the Absheron gas discovery in Azerbaijan
• New gas and condensate discovery on the King Lear prospect in the Norwegian North Sea
• Acquired exploration licenses in Iraq, Bulgaria, Mozambique, Papua New Guinea, Philippines, Myanmar and Indonesia
• Total became operator of the Xerelete block in the prolific pre-salt area of Brazil
• Signed an agreement with Kogas for the purchase of 0.7 million metric tons per year of LNG from the Sabine Pass terminal for a duration of 20 years
Results for the third quarter 2012
> Operating income from business segments
In the third quarter 2012, the Brent price averaged 109.5 $/b, a decrease of 3% compared to the third quarter 2011 and an increase of 1% compared to the second quarter 2012. The European refining margin indicator (ERMI) averaged 51 $/t for the third quarter 2012, compared to 13.4 $/t during the third quarter 2011. The favorable evolution of this indicator, having increased 34% compared to the second quarter 2012, is mainly due to higher levels of maintenance in European refineries and an increase in demand from the United States. In contrast, the environment for petrochemicals deteriorated in Europe compared to the second quarter 2012. The euro-dollar exchange rate averaged 1.25 $/€ in the third quarter 2012, 1.41 $/€ in the third quarter 2011 and 1.28 $/€ in the second quarter 2012. Expressed in euros, the Brent price averaged 87.6 €/b, an increase of 9% compared to the third quarter 2011. In this environment, the adjusted operating income8
from business segments was 6,540 M€, an increase of 11% compared to the third quarter 2011. Expressed in dollars, there was a decrease of 2%.
The effective tax rate9
for the business segments was 53.6% in the third quarter 2012 compared to 59.0% in the third quarter 2011, essentially due to a decrease in the effective tax rate for the Upstream and the increased contribution of downstream activities to the Group results.
Adjusted net operating income from the business segments was 3,698 M€ compared to 2,950 M€ in the third quarter 2011, an increase of 25%. Expressed in dollars, adjusted net operating income from the business segments was 4.6 billion dollars (B$), an increase of 11% compared to the third quarter 2011. This 8 Special items affecting operating income from the business segments had a negative impact of 1,362 M€ in the third quarter 2012 and a negative impact of 326 M€ in the third quarter 2011. 9 Defined as: (tax on adjusted net operating income) / (adjusted net operating income – income from equity affiliates, dividends received from investments and impairments of acquisition goodwill + tax on adjusted net operating income).

4
TOTAL 2, place de la Coupole La Défense 6 92 400 Courbevoie France Tel. : 33 (1) 47 44 58 53 Fax : 33 (1) 47 44 58 24 Jérôme SCHMITT Philippe HERGAUX Sandrine SABOUREAU Laurent KETTENMEYER Robert HAMMOND (U.S.) Tel. : (1) 201 626 3500 Fax : (1) 201 626 4004 TOTAL S.A Capital 5 981 907 382 euros 542 051 180 R.C.S. Nanterre www.total.com
increase essentially resulted from the good performance of Upstream and a strong improvement in the Refining & Chemicals results, which were supported by favorable margins.
> Net income (Group share)
Adjusted net income was 3,348 M€ in the third quarter 2012 compared to 2,801 M€ in the third quarter 2011, an increase of 20%. Expressed in dollars, adjusted net income increased by 6%. Adjusted net income excludes the after-tax inventory effect, the effect of changes in fair value10
, and special items:
• The after-tax inventory effect had a positive impact on net income of 524 M€ in the third quarter 2012 and a negative impact of 87 M€ in the third quarter 2011.
• Changes in fair value had a negative impact on net income of 6 M€ in the third quarter 2012 compared with a negative impact of 10 M€ in the third quarter 2011.
• Special items had a negative impact on net income of 800 M€ in the third quarter 2012, comprised essentially of an impairment to the value of assets in the Barnett in the US and a one-off tax of 4% on crude and refined product inventories, which were partially offset by gains on the sale of Sanofi shares. In the third quarter 2011, special items had a positive impact of 610 M€.
Net income (Group share) was 3,066 M€ compared to 3,314 M€ in the third quarter 2011. The effective tax rate for the Group was 55.3% in the third quarter 2012. The company-paid 3% tax on dividends is accounted for starting in the third quarter, resulting in an increased charge of 80 M€ relating to dividends declared in the first and second quarters of 2012. Adjusted fully-diluted earnings per share, based on 2,268 million fully-diluted weighted-average shares, increased by 19% to €1.48 compared to €1.24 in the third quarter 2011. Expressed in dollars, adjusted fully-diluted earnings per share increased by 5% to $1.85.
> Investments – Divestments11
Investments, excluding acquisitions and including changes in non-current loans, were 4.9 B€ (6.1 B$) in the third quarter 2012 compared to 3.3 B€ (4.7 B$) in the third quarter 2011.
Acquisitions were 294 M€ in the third quarter 2012, comprised essentially of the acquisition of exploration licenses in Iraq, specialty chemicals in Brazil, and a carry agreement in the Utica shale gas and condensates project in the US. Asset sales in the third quarter 2012 were 1,416 M€, including mainly the sale of Sanofi shares and Upstream assets in the UK and Nigeria. Net investments12
were 3.8 B€ (4.7 B$) in the third quarter 2012 compared to -1.2 B€ (-1.6 B$) in the third quarter 2011.
10 Adjustment items explained on page 14. 11 Detail shown on page 18. 12 Net investments = investments including acquisitions and changes in non-current loans – asset sales.

5
TOTAL 2, place de la Coupole La Défense 6 92 400 Courbevoie France Tel. : 33 (1) 47 44 58 53 Fax : 33 (1) 47 44 58 24 Jérôme SCHMITT Philippe HERGAUX Sandrine SABOUREAU Laurent KETTENMEYER Robert HAMMOND (U.S.) Tel. : (1) 201 626 3500 Fax : (1) 201 626 4004 TOTAL S.A Capital 5 981 907 382 euros 542 051 180 R.C.S. Nanterre www.total.com
> Cash flow
Cash flow from operations was 5,163 M€ in the third quarter 2012 compared to 5,964 M€ in the third quarter 2011, essentially resulting from a change in working capital requirements. Adjusted cash flow from operations13
was 6,058 M€, an increase of 32% compared to the third quarter 2011. Expressed in dollars, adjusted cash flow from operations was 7.6 B$, an increase of 17%.
The Group’s net cash flow14
was 1,382 M€ compared to 7,125 M€ in the third quarter 2011. Expressed in dollars, the Group’s net cash flow was 1.7 B$ in the third quarter 2012 compared to 10.1 B$ in the third quarter 2011. This difference is mainly due to a very high level of divestments in third quarter 2011 and significant changes in working capital requirements.
13 Cash flow from operations at replacement cost before changes in working capital. 14 Net cash flow = cash flow from operations - net investments.

6
TOTAL 2, place de la Coupole La Défense 6 92 400 Courbevoie France Tel. : 33 (1) 47 44 58 53 Fax : 33 (1) 47 44 58 24 Jérôme SCHMITT Philippe HERGAUX Sandrine SABOUREAU Laurent KETTENMEYER Robert HAMMOND (U.S.) Tel. : (1) 201 626 3500 Fax : (1) 201 626 4004 TOTAL S.A Capital 5 981 907 382 euros 542 051 180 R.C.S. Nanterre www.total.com
Results for the first nine months 2012
> Operating income
Compared to the first nine months of 2011, the average Brent was stable at 112.2 $/b. The European refining margin indicator (ERMI) averaged 36.7 $/t compared to 18.1 $/t in the first nine months of 2011. The euro-dollar exchange rate averaged 1.28 $/€ compared to 1.41 $/€ in the first nine months of 2011. Expressed in euros, the Brent price averaged 87.6 €/b, an increase of 10% compared to the first nine months of 2011. In this environment, the adjusted operating income from the business segments was 19,112 M€, an increase of 5% compared to the first nine months of 201115
.
The effective tax rate for the business segments was 56.4% in the first nine months of 2012 compared to 57.5% in the first nine months of 2011. Adjusted net operating income from the business segments was 10,079 M€ compared to 9,214 M€ in the first nine months of 2011, an increase of 9%. Expressed in dollars, adjusted net operating income from the business segments was stable. The improved results of Refining & Chemicals were offset by a lower contribution from Supply & Marketing, which was impacted by the sale of certain Marketing assets and the decreased results of New Energies.
> Net income (Group share)
Adjusted net income was 9,280 M€ in the first nine months of 2012, an increase of 7% compared to 8,699 M€ in the first nine months of 2011. Expressed in dollars, adjusted net income decreased by 3%. Adjusted net income excludes the after-tax inventory effect, special items and the effect of changes in fair value16
:
• The after-tax inventory effect had a positive impact on net income of 155 M€ in the first nine months of 2012 and a positive impact of 785 M€ in the first nine months of 2011.
• Changes in fair value had a negative impact on net income of 17 M€ in the first nine months 2012 and a positive impact of 12 M€ in the first nine months 2011.
• Special items had a negative impact on net income of 1,105 M€ in the first nine months of 2012 and a positive impact on net income of 490 M€ in the first nine months of 2011.
Net income (Group share) was 8,313 M€ compared to 9,986 M€ in the first nine months of 2011. On September 30, 2012, there were 2,270 million fully-diluted shares compared to 2,263 million on September 30, 2011. Adjusted fully-diluted earnings per share, based on 2,265 million fully-diluted weighted-average shares, was €4.10, an increase of 6% compared to the first nine months of 2011. Expressed in dollars, adjusted fully-diluted earnings per share was $5.25 compared to $5.43 in the first nine months of 2011, a decrease of 3%.
> Investments – Divestments17
Investments, excluding acquisitions and including changes in non-current loans, were 13.2 B€ (16.9 B$) in the first nine months of 2012 compared to 9.6 B€ (13.5 B$) in the first nine months of 2011.
15 Special items affecting operating income from the business segments had a negative impact of 1,428 M€ in the first nine months of 2012 and a negative impact of 389 M€ in the first nine months of 2011. 16 Adjustment items explained on page 14. 17 Detail shown on page 18.
7
TOTAL 2, place de la Coupole La Défense 6 92 400 Courbevoie France Tel. : 33 (1) 47 44 58 53 Fax : 33 (1) 47 44 58 24 Jérôme SCHMITT Philippe HERGAUX Sandrine SABOUREAU Laurent KETTENMEYER Robert HAMMOND (U.S.) Tel. : (1) 201 626 3500 Fax : (1) 201 626 4004 TOTAL S.A Capital 5 981 907 382 euros 542 051 180 R.C.S. Nanterre www.total.com
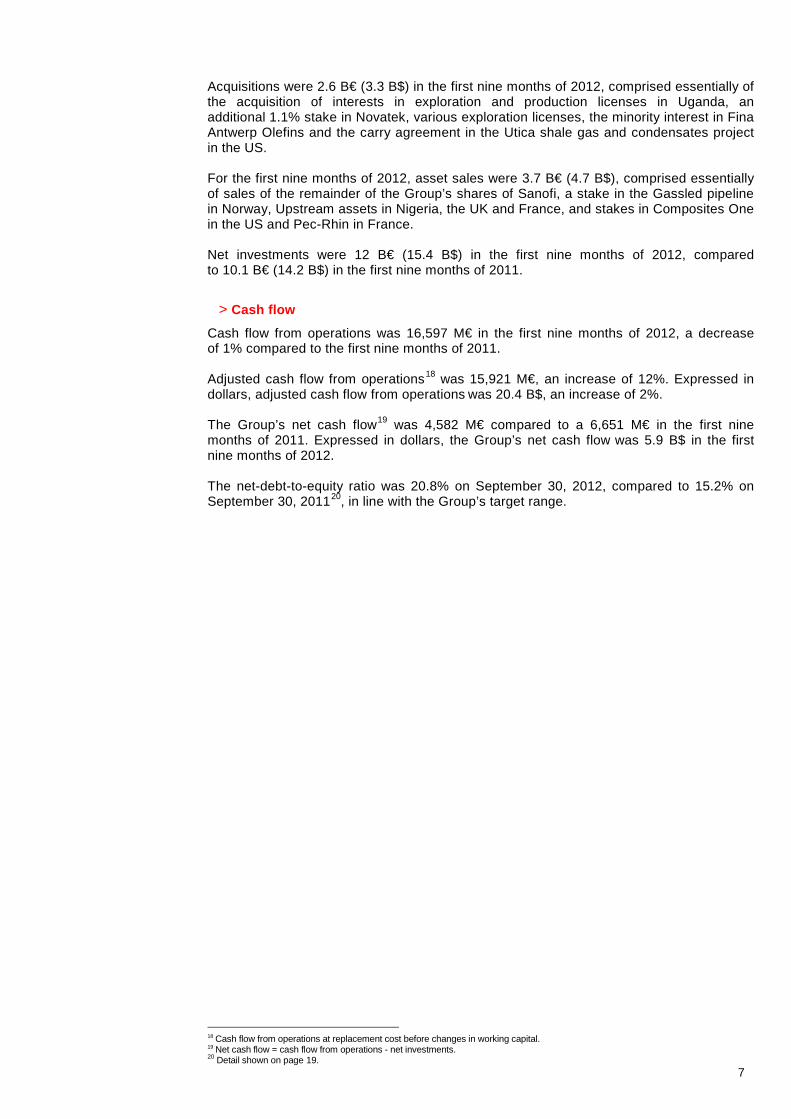
Acquisitions were 2.6 B€ (3.3 B$) in the first nine months of 2012, comprised essentially of the acquisition of interests in exploration and production licenses in Uganda, an additional 1.1% stake in Novatek, various exploration licenses, the minority interest in Fina Antwerp Olefins and the carry agreement in the Utica shale gas and condensates project in the US. For the first nine months of 2012, asset sales were 3.7 B€ (4.7 B$), comprised essentially of sales of the remainder of the Group’s shares of Sanofi, a stake in the Gassled pipeline in Norway, Upstream assets in Nigeria, the UK and France, and stakes in Composites One in the US and Pec-Rhin in France. Net investments were 12 B€ (15.4 B$) in the first nine months of 2012, compared to 10.1 B€ (14.2 B$) in the first nine months of 2011.
> Cash flow
Cash flow from operations was 16,597 M€ in the first nine months of 2012, a decrease of 1% compared to the first nine months of 2011. Adjusted cash flow from operations18
was 15,921 M€, an increase of 12%. Expressed in dollars, adjusted cash flow from operations was 20.4 B$, an increase of 2%.
The Group’s net cash flow19
was 4,582 M€ compared to a 6,651 M€ in the first nine months of 2011. Expressed in dollars, the Group’s net cash flow was 5.9 B$ in the first nine months of 2012.
The net-debt-to-equity ratio was 20.8% on September 30, 2012, compared to 15.2% on September 30, 201120
18 Cash flow from operations at replacement cost before changes in working capital.
, in line with the Group’s target range.
19 Net cash flow = cash flow from operations - net investments. 20 Detail shown on page 19.

8
TOTAL 2, place de la Coupole La Défense 6 92 400 Courbevoie France Tel. : 33 (1) 47 44 58 53 Fax : 33 (1) 47 44 58 24 Jérôme SCHMITT Philippe HERGAUX Sandrine SABOUREAU Laurent KETTENMEYER Robert HAMMOND (U.S.) Tel. : (1) 201 626 3500 Fax : (1) 201 626 4004 TOTAL S.A Capital 5 981 907 382 euros 542 051 180 R.C.S. Nanterre www.total.com
Analysis of business segment results
Upstream
> Environment – liquids and gas price realizations*
3Q12 2Q12 3Q11 3Q12
vs 3Q11
9M12 9M11 9M12
vs 9M11
109.5 108.3 113.4 -3% Brent ($/b) 112.2 111.9 -
107.6 101.6 106.8 +1% Average liquids price ($/b) 108.1 105.3 +3%
6.00 7.10 6.56 -9% Average gas price ($/Mbtu) 6.68 6.44 +4%
75.8 76.0 75.3 +1% Average hydrocarbons price ($/boe) 77.4 74.5 +4%
* consolidated subsidiaries, excluding fixed margins. Effective first quarter 2012, over/under-lifting valued at market prices.
> Production
3Q12 2Q12 3Q11 3Q12
vs 3Q11
Hydrocarbon production 9M12 9M11 9M12
vs 9M11
2,272 2,261 2,319 -2% Combined production (kboe/d) 2,302 2,333 -1%
1,225 1,218 1,176 +4% Liquids (kb/d) 1,224 1,222 -
5,680 5,722 6,228 -9% Gas (Mcf/d) 5,875 6,063 -3%
Hydrocarbon production was 2,272 thousand barrels of oil equivalent per day (kboe/d) in the third quarter 2012, a decrease of 2% compared to the third quarter 2011, essentially as a result of: • +5.5% for start-ups and growth from new projects, • -4.5% for normal decline and scheduled maintenance, • -3% for incidents in the UK North Sea and Nigeria, and • changes in the portfolio and price effect21
had little impact on the quarter.
In the first nine months of 2012, hydrocarbon production was 2,302 kboe/d, a decrease of 1.3% compared to the first nine months of 2011, essentially as a result of: • +4.5% for start-ups and growth from new projects, • +2% for changes in the portfolio, comprised essentially of an increased share of
Novatek production and the impact of the sale of CEPSA and assets in the UK, • -4% for normal decline and scheduled maintenance, • -2.5% for incidents in the UK North Sea and Nigeria, • -1.5% for disruptions related to security conditions in Yemen and the production shut-
down in Syria, net of the positive effect of the return of production in Libya, and • price effect21 had little impact.
21 impact of changing hydrocarbon prices on entitlement volumes
9
TOTAL 2, place de la Coupole La Défense 6 92 400 Courbevoie France Tel. : 33 (1) 47 44 58 53 Fax : 33 (1) 47 44 58 24 Jérôme SCHMITT Philippe HERGAUX Sandrine SABOUREAU Laurent KETTENMEYER Robert HAMMOND (U.S.) Tel. : (1) 201 626 3500 Fax : (1) 201 626 4004 TOTAL S.A Capital 5 981 907 382 euros 542 051 180 R.C.S. Nanterre www.total.com
> Results
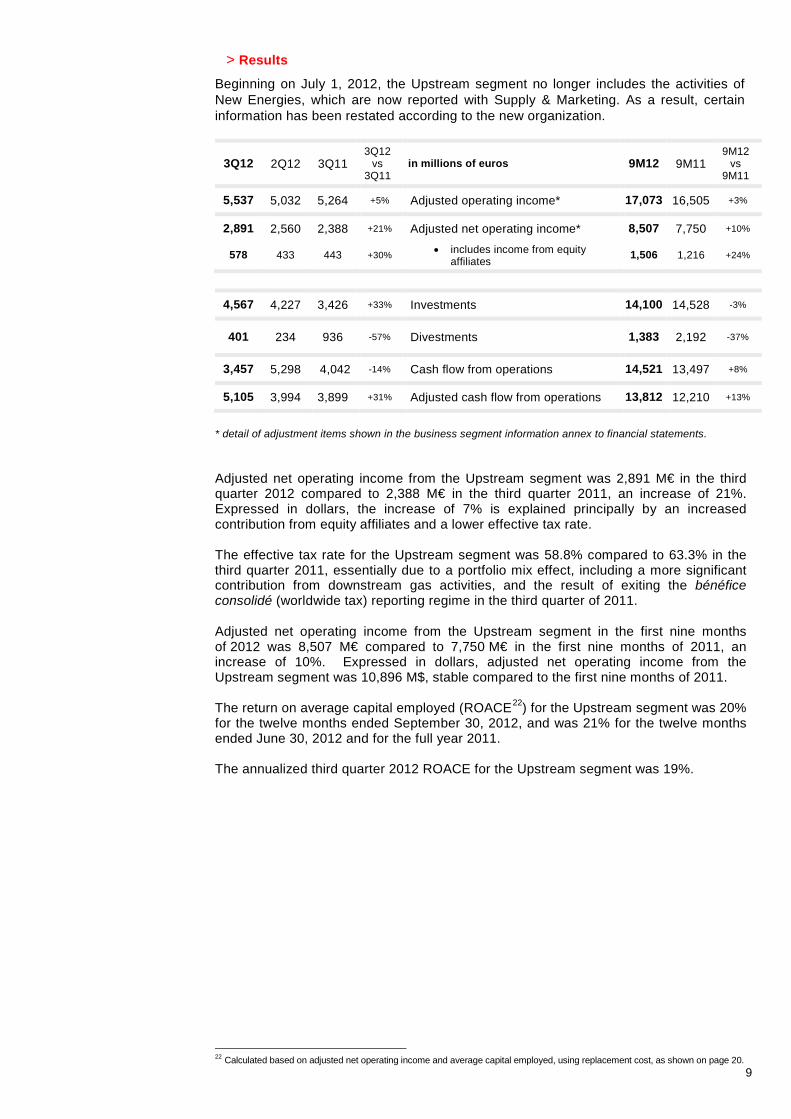
Beginning on July 1, 2012, the Upstream segment no longer includes the activities of New Energies, which are now reported with Supply & Marketing. As a result, certain information has been restated according to the new organization.
3Q12 2Q12 3Q11 3Q12
vs 3Q11
in millions of euros 9M12 9M11 9M12
vs 9M11
5,537 5,032 5,264 +5% Adjusted operating income* 17,073 16,505 +3%
2,891 2,560 2,388 +21% Adjusted net operating income* 8,507 7,750 +10%
578 433 443 +30% • includes income from equity affiliates 1,506 1,216 +24%
4,567 4,227 3,426 +33% Investments 14,100 14,528 -3%
401 234 936 -57% Divestments 1,383 2,192 -37%
3,457 5,298 4,042 -14% Cash flow from operations 14,521 13,497 +8%
5,105 3,994 3,899 +31% Adjusted cash flow from operations 13,812 12,210 +13%
* detail of adjustment items shown in the business segment information annex to financial statements. Adjusted net operating income from the Upstream segment was 2,891 M€ in the third quarter 2012 compared to 2,388 M€ in the third quarter 2011, an increase of 21%. Expressed in dollars, the increase of 7% is explained principally by an increased contribution from equity affiliates and a lower effective tax rate. The effective tax rate for the Upstream segment was 58.8% compared to 63.3% in the third quarter 2011, essentially due to a portfolio mix effect, including a more significant contribution from downstream gas activities, and the result of exiting the bénéfice consolidé (worldwide tax) reporting regime in the third quarter of 2011. Adjusted net operating income from the Upstream segment in the first nine months of 2012 was 8,507 M€ compared to 7,750 M€ in the first nine months of 2011, an increase of 10%. Expressed in dollars, adjusted net operating income from the Upstream segment was 10,896 M$, stable compared to the first nine months of 2011. The return on average capital employed (ROACE22
) for the Upstream segment was 20% for the twelve months ended September 30, 2012, and was 21% for the twelve months ended June 30, 2012 and for the full year 2011.
The annualized third quarter 2012 ROACE for the Upstream segment was 19%.
22 Calculated based on adjusted net operating income and average capital employed, using replacement cost, as shown on page 20.
10
TOTAL 2, place de la Coupole La Défense 6 92 400 Courbevoie France Tel. : 33 (1) 47 44 58 53 Fax : 33 (1) 47 44 58 24 Jérôme SCHMITT Philippe HERGAUX Sandrine SABOUREAU Laurent KETTENMEYER Robert HAMMOND (U.S.) Tel. : (1) 201 626 3500 Fax : (1) 201 626 4004 TOTAL S.A Capital 5 981 907 382 euros 542 051 180 R.C.S. Nanterre www.total.com
Refining & Chemicals
> Refinery throughput and utilization rates*
3Q12 2Q12 3Q11 3Q12
vs 3Q11
9M12 9M11 9M12
vs 9M11
1,790 1,878 1,922 -7% Total refinery throughput (kb/d) 1,833 1,930 -5%
653 752 752 -13% France 699 731 -4%
864 876 904 -4% Rest of Europe 873 941 -7%
273 250 266 +3% Rest of world 261 258 +1%
Utilization rates**
82% 86% 77% Based on crude only 83% 77%
86% 90% 81% Based on crude and other feedstock 88% 82%
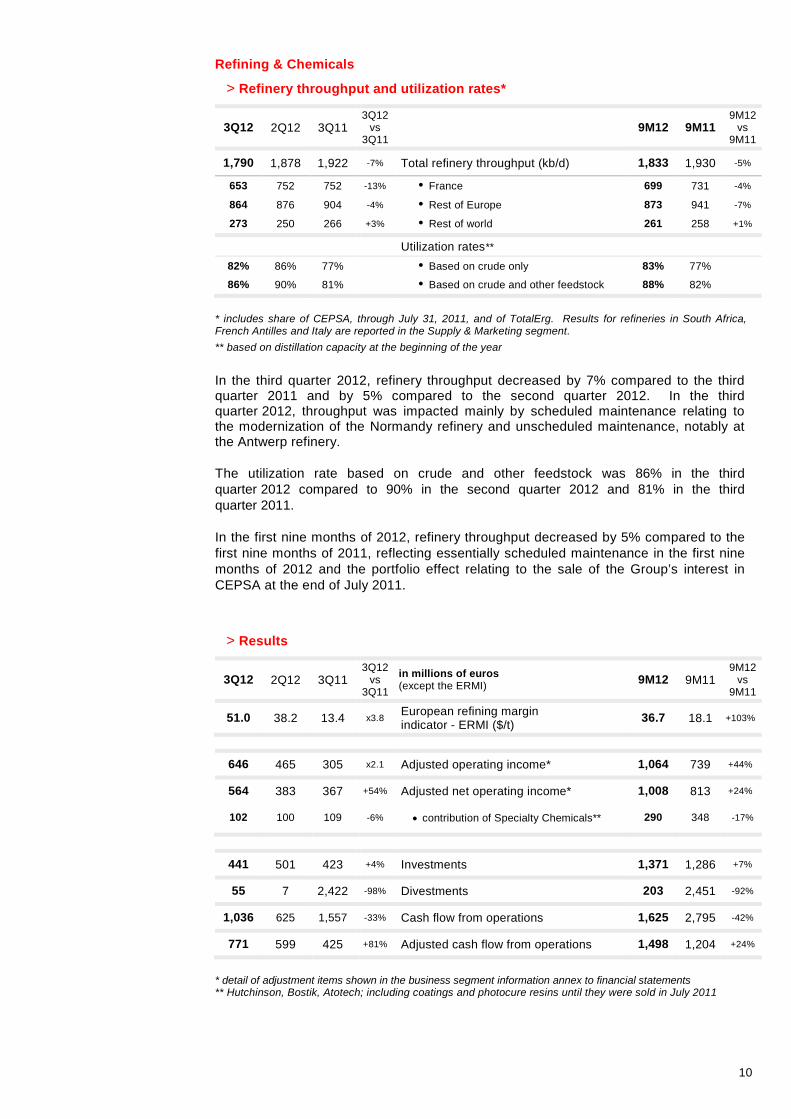
* includes share of CEPSA, through July 31, 2011, and of TotalErg. Results for refineries in South Africa, French Antilles and Italy are reported in the Supply & Marketing segment. ** based on distillation capacity at the beginning of the year In the third quarter 2012, refinery throughput decreased by 7% compared to the third quarter 2011 and by 5% compared to the second quarter 2012. In the third quarter 2012, throughput was impacted mainly by scheduled maintenance relating to the modernization of the Normandy refinery and unscheduled maintenance, notably at the Antwerp refinery. The utilization rate based on crude and other feedstock was 86% in the third quarter 2012 compared to 90% in the second quarter 2012 and 81% in the third quarter 2011. In the first nine months of 2012, refinery throughput decreased by 5% compared to the first nine months of 2011, reflecting essentially scheduled maintenance in the first nine months of 2012 and the portfolio effect relating to the sale of the Group’s interest in CEPSA at the end of July 2011.
> Results
3Q12 2Q12 3Q11 3Q12
vs 3Q11
in millions of euros (except the ERMI) 9M12 9M11
9M12 vs
9M11
51.0 38.2 13.4 x3.8 European refining margin indicator - ERMI ($/t) 36.7 18.1 +103%
646 465 305 x2.1 Adjusted operating income* 1,064 739 +44%
564 383 367 +54% Adjusted net operating income* 1,008 813 +24%
102 100 109 -6% • contribution of Specialty Chemicals** 290 348 -17%
441 501 423 +4% Investments 1,371 1,286 +7%
55 7 2,422 -98% Divestments 203 2,451 -92%
1,036 625 1,557 -33% Cash flow from operations 1,625 2,795 -42%
771 599 425 +81% Adjusted cash flow from operations 1,498 1,204 +24%
* detail of adjustment items shown in the business segment information annex to financial statements ** Hutchinson, Bostik, Atotech; including coatings and photocure resins until they were sold in July 2011
11
TOTAL 2, place de la Coupole La Défense 6 92 400 Courbevoie France Tel. : 33 (1) 47 44 58 53 Fax : 33 (1) 47 44 58 24 Jérôme SCHMITT Philippe HERGAUX Sandrine SABOUREAU Laurent KETTENMEYER Robert HAMMOND (U.S.) Tel. : (1) 201 626 3500 Fax : (1) 201 626 4004 TOTAL S.A Capital 5 981 907 382 euros 542 051 180 R.C.S. Nanterre www.total.com
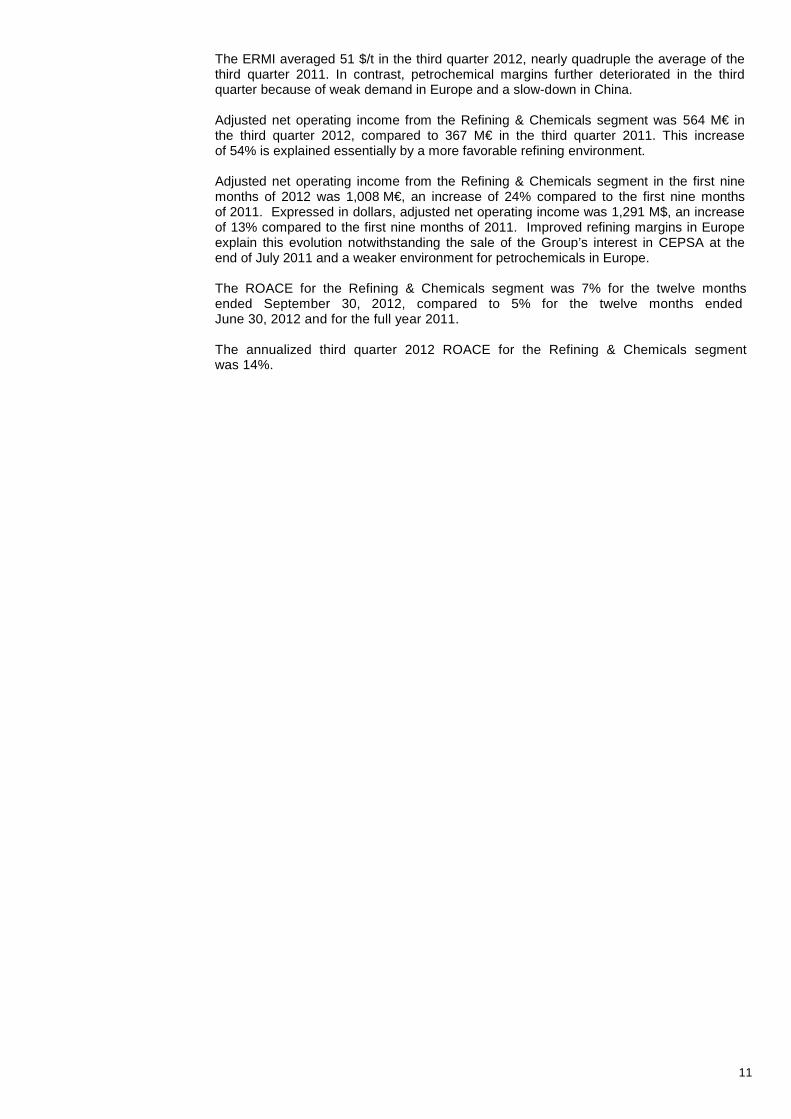
The ERMI averaged 51 $/t in the third quarter 2012, nearly quadruple the average of the third quarter 2011. In contrast, petrochemical margins further deteriorated in the third quarter because of weak demand in Europe and a slow-down in China. Adjusted net operating income from the Refining & Chemicals segment was 564 M€ in the third quarter 2012, compared to 367 M€ in the third quarter 2011. This increase of 54% is explained essentially by a more favorable refining environment. Adjusted net operating income from the Refining & Chemicals segment in the first nine months of 2012 was 1,008 M€, an increase of 24% compared to the first nine months of 2011. Expressed in dollars, adjusted net operating income was 1,291 M$, an increase of 13% compared to the first nine months of 2011. Improved refining margins in Europe explain this evolution notwithstanding the sale of the Group’s interest in CEPSA at the end of July 2011 and a weaker environment for petrochemicals in Europe. The ROACE for the Refining & Chemicals segment was 7% for the twelve months ended September 30, 2012, compared to 5% for the twelve months ended June 30, 2012 and for the full year 2011. The annualized third quarter 2012 ROACE for the Refining & Chemicals segment was 14%.
12
TOTAL 2, place de la Coupole La Défense 6 92 400 Courbevoie France Tel. : 33 (1) 47 44 58 53 Fax : 33 (1) 47 44 58 24 Jérôme SCHMITT Philippe HERGAUX Sandrine SABOUREAU Laurent KETTENMEYER Robert HAMMOND (U.S.) Tel. : (1) 201 626 3500 Fax : (1) 201 626 4004 TOTAL S.A Capital 5 981 907 382 euros 542 051 180 R.C.S. Nanterre www.total.com
Supply & Marketing (including New Energies)
> Refined product sales
3Q12 2Q12 3Q11 3Q12
vs 3Q11
Sales in kb/d*
9M12 9M11 9M12
vs 9M11
1,143 1,166 1,477 -23% Europe 1,173 1,516 -23%
563 524 540 +4% Rest of world 539 529 +2%
1,706 1,690 2,017 -15% Total Supply & Marketing sales 1,712 2,045 -16%
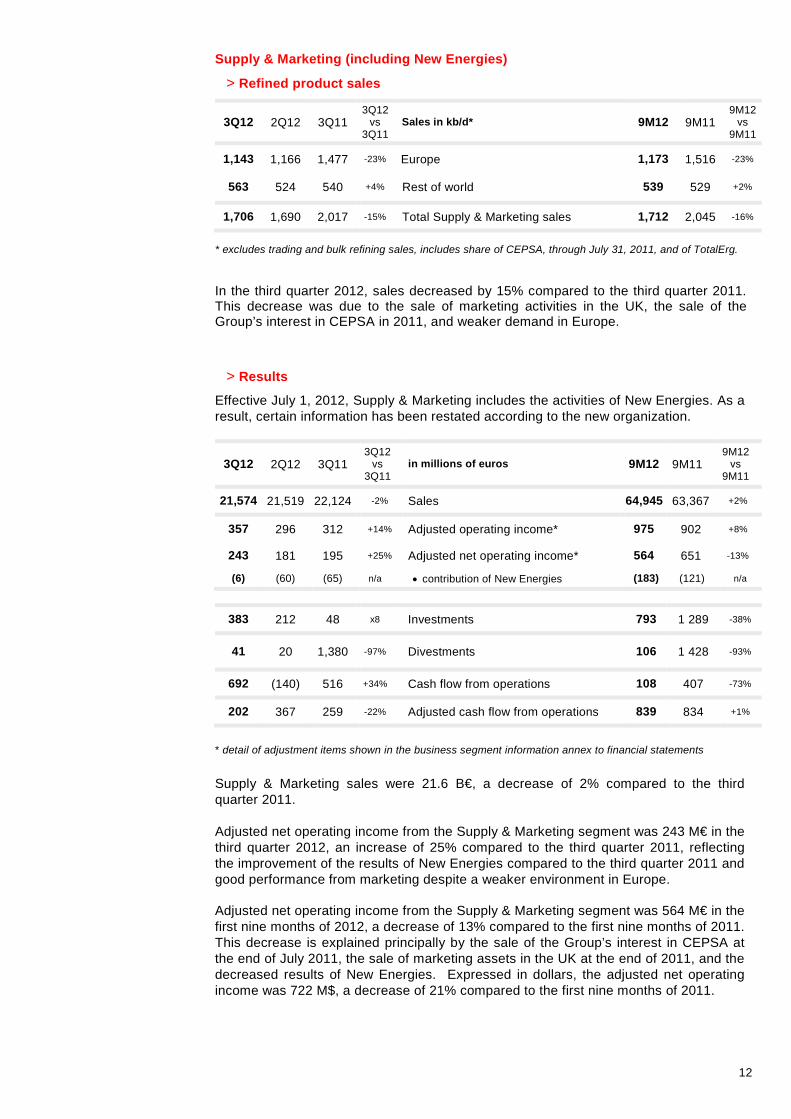
* excludes trading and bulk refining sales, includes share of CEPSA, through July 31, 2011, and of TotalErg. In the third quarter 2012, sales decreased by 15% compared to the third quarter 2011. This decrease was due to the sale of marketing activities in the UK, the sale of the Group’s interest in CEPSA in 2011, and weaker demand in Europe.
> Results
Effective July 1, 2012, Supply & Marketing includes the activities of New Energies. As a result, certain information has been restated according to the new organization.
3Q12 2Q12 3Q11 3Q12
vs 3Q11
in millions of euros 9M12 9M11 9M12
vs 9M11
21,574 21,519 22,124 -2% Sales 64,945 63,367 +2%
357 296 312 +14% Adjusted operating income* 975 902 +8%
243 181 195 +25% Adjusted net operating income* 564 651 -13%
(6) (60) (65) n/a • contribution of New Energies (183) (121) n/a
383 212 48 x8 Investments 793 1 289 -38%
41 20 1,380 -97% Divestments 106 1 428 -93%
692 (140) 516 +34% Cash flow from operations 108 407 -73%
202 367 259 -22% Adjusted cash flow from operations 839 834 +1%
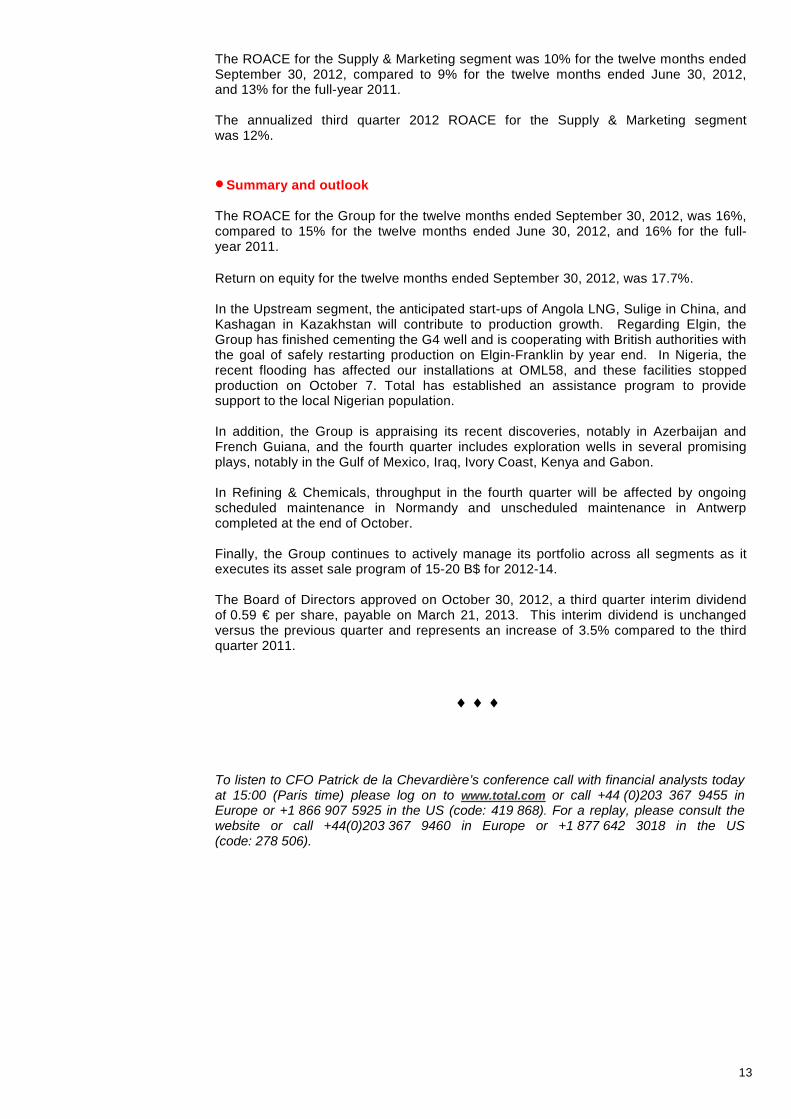
* detail of adjustment items shown in the business segment information annex to financial statements Supply & Marketing sales were 21.6 B€, a decrease of 2% compared to the third quarter 2011. Adjusted net operating income from the Supply & Marketing segment was 243 M€ in the third quarter 2012, an increase of 25% compared to the third quarter 2011, reflecting the improvement of the results of New Energies compared to the third quarter 2011 and good performance from marketing despite a weaker environment in Europe. Adjusted net operating income from the Supply & Marketing segment was 564 M€ in the first nine months of 2012, a decrease of 13% compared to the first nine months of 2011. This decrease is explained principally by the sale of the Group’s interest in CEPSA at the end of July 2011, the sale of marketing assets in the UK at the end of 2011, and the decreased results of New Energies. Expressed in dollars, the adjusted net operating income was 722 M$, a decrease of 21% compared to the first nine months of 2011.
13
TOTAL 2, place de la Coupole La Défense 6 92 400 Courbevoie France Tel. : 33 (1) 47 44 58 53 Fax : 33 (1) 47 44 58 24 Jérôme SCHMITT Philippe HERGAUX Sandrine SABOUREAU Laurent KETTENMEYER Robert HAMMOND (U.S.) Tel. : (1) 201 626 3500 Fax : (1) 201 626 4004 TOTAL S.A Capital 5 981 907 382 euros 542 051 180 R.C.S. Nanterre www.total.com
The ROACE for the Supply & Marketing segment was 10% for the twelve months ended September 30, 2012, compared to 9% for the twelve months ended June 30, 2012, and 13% for the full-year 2011. The annualized third quarter 2012 ROACE for the Supply & Marketing segment was 12%. Summary and outlook The ROACE for the Group for the twelve months ended September 30, 2012, was 16%, compared to 15% for the twelve months ended June 30, 2012, and 16% for the full-year 2011. Return on equity for the twelve months ended September 30, 2012, was 17.7%. In the Upstream segment, the anticipated start-ups of Angola LNG, Sulige in China, and Kashagan in Kazakhstan will contribute to production growth. Regarding Elgin, the Group has finished cementing the G4 well and is cooperating with British authorities with the goal of safely restarting production on Elgin-Franklin by year end. In Nigeria, the recent flooding has affected our installations at OML58, and these facilities stopped production on October 7. Total has established an assistance program to provide support to the local Nigerian population. In addition, the Group is appraising its recent discoveries, notably in Azerbaijan and French Guiana, and the fourth quarter includes exploration wells in several promising plays, notably in the Gulf of Mexico, Iraq, Ivory Coast, Kenya and Gabon. In Refining & Chemicals, throughput in the fourth quarter will be affected by ongoing scheduled maintenance in Normandy and unscheduled maintenance in Antwerp completed at the end of October. Finally, the Group continues to actively manage its portfolio across all segments as it executes its asset sale program of 15-20 B$ for 2012-14. The Board of Directors approved on October 30, 2012, a third quarter interim dividend of 0.59 € per share, payable on March 21, 2013. This interim dividend is unchanged versus the previous quarter and represents an increase of 3.5% compared to the third quarter 2011.
♦ ♦ ♦ To listen to CFO Patrick de la Chevardière’s conference call with financial analysts today at 15:00 (Paris time) please log on to www.total.com or call +44 (0)203 367 9455 in Europe or +1 866 907 5925 in the US (code: 419 868). For a replay, please consult the website or call +44(0)203 367 9460 in Europe or +1 877 642 3018 in the US (code: 278 506).
14
TOTAL 2, place de la Coupole La Défense 6 92 400 Courbevoie France Tel. : 33 (1) 47 44 58 53 Fax : 33 (1) 47 44 58 24 Jérôme SCHMITT Philippe HERGAUX Sandrine SABOUREAU Laurent KETTENMEYER Robert HAMMOND (U.S.) Tel. : (1) 201 626 3500 Fax : (1) 201 626 4004 TOTAL S.A Capital 5 981 907 382 euros 542 051 180 R.C.S. Nanterre www.total.com
The September 30, 2012 notes to the consolidated financial statements are available on the Total web site (www.total.com).This document may contain forward-looking statements, including within the meaning of the Private Securities Litigation Reform Act of 1995, notably with respect to the financial condition, results of operations, business, strategy and plans of TOTAL. Such statements are based on a number of assumptions that could ultimately prove inaccurate, and are subject to a number of risk factors, including currency fluctuations, the price of petroleum products, the ability to realize cost reductions and operating efficiencies without unduly disrupting business operations, environmental regulatory considerations and general economic and business conditions. Neither TOTAL nor any of its subsidiaries assumes any obligation to update publicly any forward-looking statement, whether as a result of new information, future events or otherwise. Further information on factors which could affect the company’s financial results is provided in documents filed by the Group with the French Autorité des Marchés Financiers and the U.S. Securities and Exchange Commission (“SEC”). Financial information by business segment is reported in accordance with the internal reporting system and shows internal segment information that is used to manage and measure the performance of TOTAL. Performance indicators excluding the adjustment items, such as adjusted operating income, adjusted net operating income, and adjusted net income are meant to facilitate the analysis of the financial performance and the comparison of income between periods. Adjustment items include: (i) Special items Due to their unusual nature or particular significance, certain transactions qualified as "special items" are excluded from the business segment figures. In general, special items relate to transactions that are significant, infrequent or unusual. However, in certain instances, transactions such as restructuring costs or asset disposals, which are not considered to be representative of the normal course of business, may be qualified as special items although they may have occurred within prior years or are likely to occur again within the coming years. (ii) Inventory valuation effect The adjusted results of the Downstream and Chemicals segments are presented according to the replacement cost method. This method is used to assess the segments’ performance and facilitate the comparability of the segments’ performance with those of its competitors. In the replacement cost method, which approximates the LIFO (Last-In, First-Out) method, the variation of inventory values in the statement of income is, depending on the nature of the inventory, determined using either the month-end prices differential between one period and another or the average prices of the period rather than the historical value. The inventory valuation effect is the difference between the results according to the FIFO (First-In, First-Out) and the replacement cost. (iii) Effect of changes in fair value As from January 1, 2011, the effect of changes in fair value presented as an adjustment item reflects for some transactions differences between internal measures of performance used by TOTAL’s management and the accounting for these transactions under IFRS. IFRS requires that trading inventories be recorded at their fair value using period-end spot prices. In order to best reflect the management of economic exposure through derivative transactions, internal indicators used to measure performance include valuations of trading inventories based on forward prices. Furthermore, TOTAL, in its trading activities, enters into storage contracts, which future effects are recorded at fair value in Group’s internal economic performance. IFRS precludes recognition of this fair value effect. The adjusted results (adjusted operating income, adjusted net operating income, adjusted net income) are defined as replacement cost results, adjusted for special items, excluding the effect of changes in fair value. Dollar amounts presented herein represent euro amounts converted at the average euro-dollar exchange rate for the applicable period and are not the result of financial statements prepared in dollars. Cautionary Note to U.S. Investors – The SEC permits oil and gas companies, in their filings with the SEC, to separately disclose proved, probable and possible reserves that a company has determined in accordance with SEC rules. We may use certain terms in this presentation, such as resources, that the SEC’s guidelines strictly prohibit us from including in filings with the SEC. U.S. investors are urged to consider closely the disclosure in our Form 20-F, File N° 1-10888, available from us at 2, place Jean Millier – La Défense 6 – 92078 Paris – La Défense Cedex, France, or at our Web site: www.total.com. You can also obtain this form from the SEC by calling 1-800-SEC-0330 or on the SEC’s Web site: www.sec.gov.
15
TOTAL 2, place de la Coupole La Défense 6 92 400 Courbevoie France Tel. : 33 (1) 47 44 58 53 Fax : 33 (1) 47 44 58 24 Jérôme SCHMITT Philippe HERGAUX Sandrine SABOUREAU Laurent KETTENMEYER Robert HAMMOND (U.S.) Tel. : (1) 201 626 3500 Fax : (1) 201 626 4004 TOTAL S.A Capital 5 981 907 382 euros 542 051 180 R.C.S. Nanterre www.total.com
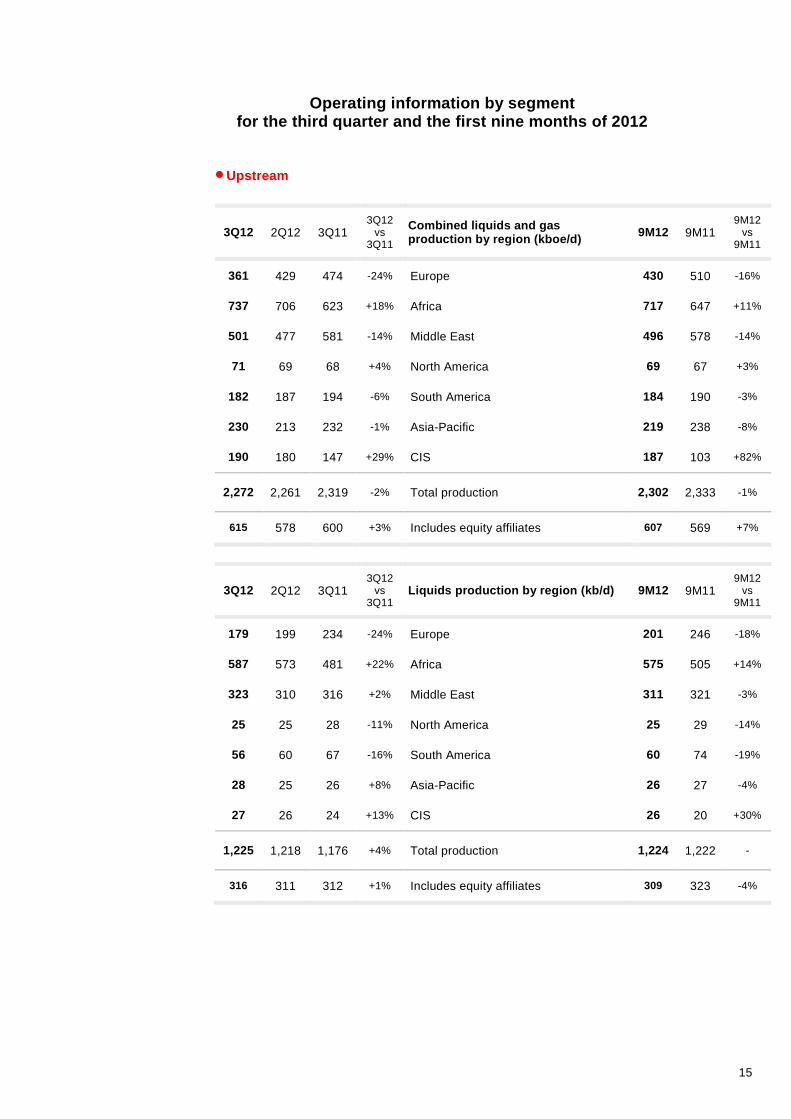
Operating information by segment
for the third quarter and the first nine months of 2012 Upstream
3Q12 2Q12 3Q11 3Q12
vs 3Q11
Combined liquids and gas production by region (kboe/d) 9M12 9M11
9M12 vs
9M11
361 429 474 -24% Europe 430 510 -16%
737 706 623 +18% Africa 717 647 +11%
501 477 581 -14% Middle East 496 578 -14%
71 69 68 +4% North America 69 67 +3%
182 187 194 -6% South America 184 190 -3%
230 213 232 -1% Asia-Pacific 219 238 -8%
190 180 147 +29% CIS 187 103 +82%
2,272 2,261 2,319 -2% Total production 2,302 2,333 -1%
615 578 600 +3% Includes equity affiliates 607 569 +7%
3Q12 2Q12 3Q11 3Q12
vs 3Q11
Liquids production by region (kb/d) 9M12 9M11 9M12
vs 9M11
179 199 234 -24% Europe 201 246 -18%
587 573 481 +22% Africa 575 505 +14%
323 310 316 +2% Middle East 311 321 -3%
25 25 28 -11% North America 25 29 -14%
56 60 67 -16% South America 60 74 -19%
28 25 26 +8% Asia-Pacific 26 27 -4%
27 26 24 +13% CIS 26 20 +30%
1,225 1,218 1,176 +4% Total production 1,224 1,222 -
316 311 312 +1% Includes equity affiliates 309 323 -4%

16
TOTAL 2, place de la Coupole La Défense 6 92 400 Courbevoie France Tel. : 33 (1) 47 44 58 53 Fax : 33 (1) 47 44 58 24 Jérôme SCHMITT Philippe HERGAUX Sandrine SABOUREAU Laurent KETTENMEYER Robert HAMMOND (U.S.) Tel. : (1) 201 626 3500 Fax : (1) 201 626 4004 TOTAL S.A Capital 5 981 907 382 euros 542 051 180 R.C.S. Nanterre www.total.com
3Q12 2Q12 3Q11 3Q12
vs 3Q11
Gas production by region (Mcf/d) 9M12 9M11 9M12
vs 9M11
1,011 1,264 1,299 -22% Europe 1,255 1,441 -13%
763 674 720 +6% Africa 722 724 -
971 916 1,430 -32% Middle East 1,010 1,392 -27%
260 253 228 +14% North America 252 219 +15%
650 759 707 -8% South America 691 643 +7%
1,135 1,019 1,173 -3% Asia-Pacific 1,076 1,194 -10%
890 837 671 +33% CIS 869 450 +93%
5,680 5,722 6,228 -9% Total production 5,875 6,063 -3%
1,618 1,445 1,560 +4% Includes equity affiliates 1,612 1,331 +21%
3Q12 2Q12 3Q11 3Q12
vs 3Q11
Liquefied natural gas 9M12 9M11 9M12
vs 9M11
2.94 2.57 ** 3.36 -13% LNG sales* (Mt) 8.77 10.08 -13%
* sales, Group share, excluding trading; 2011 data restated to reflect volume estimates for Bontang LNG in Indonesia based on the 2011 SEC coefficient ** restated number for 2Q12
Downstream (Refining & Chemicals and Supply & Marketing)
3Q12 2Q12 3Q11 3Q12
vs 3Q11
Refined product sales by region (kb/d)* 9M12 9M11 9M12
vs 9M11
1,979 2,060 2,358 -16% Europe 2,030 2,360 -14%
411 401 403 +2% Africa 401 390 +3%
535 509 474 +13% Americas 495 505 -2%
399 508 505 -21% Rest of world 497 490 +1%
3,324 3,478 3,740 -11% Total consolidated sales 3,423 3,745 -9%
539 542 453 +19% includes bulk sales 527 434 +21%
1,080 1,246 1,270 -15% includes trading 1,184 1,266 -6%
* includes share of CEPSA, through July 31, 2011, and of TotalErg

17
TOTAL 2, place de la Coupole La Défense 6 92 400 Courbevoie France Tel. : 33 (1) 47 44 58 53 Fax : 33 (1) 47 44 58 24 Jérôme SCHMITT Philippe HERGAUX Sandrine SABOUREAU Laurent KETTENMEYER Robert HAMMOND (U.S.) Tel. : (1) 201 626 3500 Fax : (1) 201 626 4004 TOTAL S.A Capital 5 981 907 382 euros 542 051 180 R.C.S. Nanterre www.total.com
Adjustment items
Adjustments to operating income
3Q12 2Q12 3Q11 in millions of euros 9M12 9M11
(1,362) (89) (326) Special items affecting operating income (1,516) (389)
(16) (48) - Restructuring charges (64) -
(1,134) - (245) Impairments (1,134) (245)
(212) (41) (81) Other (318) (144)
766 (1,384) (112) Pre-tax inventory effect : FIFO vs. replacement cost 228 1,157
(8) 11 (14) Effect of changes in fair value (22) 15
(604) (1,462) (452) Total adjustments affecting operating income (1,310) 783
Adjustments to net income (Group share)
3Q12 2Q12 3Q11 in millions of euros 9M12 9M11
(800) (323) 610 Special items affecting net operating income (Group share) (1,105) 490
202 73 1,054 Gain on asset sales 355 1,270
(33) (40) (56) Restructuring charges (73) (56)
(737) (18) (251) Impairments (775) (298)
(232) (338) (137) Other (612) (426)
524 (959) (87) After-tax inventory effect : FIFO vs. replacement cost 155 785
(6) 9 (10) Effect of changes in fair value (17) 12
(282) (1 273) 513 Total adjustments affecting net income (967) 1,287
Effective tax rates
3Q12 2Q12 3Q11 Effective tax rate* 9M12 9M11
58.8% 58.0% 63.3% Upstream 59.4% 60.7%
55.3% 56.1% 57.9% Group 57.5% 57.6%
* tax on adjusted net operating income / (adjusted net operating income - income from equity affiliates, dividends received from investments, and impairments of acquisition goodwill + tax on adjusted net operating income)

18
TOTAL 2, place de la Coupole La Défense 6 92 400 Courbevoie France Tel. : 33 (1) 47 44 58 53 Fax : 33 (1) 47 44 58 24 Jérôme SCHMITT Philippe HERGAUX Sandrine SABOUREAU Laurent KETTENMEYER Robert HAMMOND (U.S.) Tel. : (1) 201 626 3500 Fax : (1) 201 626 4004 TOTAL S.A Capital 5 981 907 382 euros 542 051 180 R.C.S. Nanterre www.total.com
Investments - Divestments
3Q12 2Q12 3Q11 3Q12
vs 3Q11
in millions of euros 9M12 9M11 9M12
vs 9M11
4,903 4,381 3,349 +46% Investments excluding acquisitions* 13,156 9,603 +36%
303 319 287 +6% • Capitalized exploration 972 746 +30%
455 231 93 x5 • Change in non-recurrent loans** 845 95 x9
294 437 445 -34% Acquisitions 2,564 6,982 -63%
5,197 4,818 3,794 +37% Investments including acquisitions* 15,720 16,585 -5%
1,416 834 4,955 -71% Asset sales 3,705 6,494 -43%
3,781 3,984 (1,161) n/a Net investments** 12,015 10,091 +19%
3Q12 2Q12 3Q11 3Q12
vs 3Q11
in millions of dollars*** 9M12 9M11 9M12
vs 9M11
6,130 5,614 4,731 +30% Investments excluding acquisitions* 16,850 13,507 +24%
379 409 405 -6% • Capitalized exploration 1,245 1,049 +19%
569 296 131 x4 • Change in non-recurrent loans** 1,082 134 x8
368 560 629 -41% Acquisitions 3,284 9,820 -67%
6,498 6,174 5,360 +21% Investments including acquisitions* 20,134 23,327 -14%
1,770 1,069 7,000 -75% Asset sales 4,745 9,134 -48%
4,727 5,105 (1,640) n/a Net investments** 15,389 14,193 +8%
* includes changes in non-current loans. ** includes net investments in equity affiliates and non-consolidated companies + net financing for
employee-related stock purchase plans. *** dollar amounts represent euro amounts converted at the average €-$ exchange rate for the period.

19
TOTAL 2, place de la Coupole La Défense 6 92 400 Courbevoie France Tel. : 33 (1) 47 44 58 53 Fax : 33 (1) 47 44 58 24 Jérôme SCHMITT Philippe HERGAUX Sandrine SABOUREAU Laurent KETTENMEYER Robert HAMMOND (U.S.) Tel. : (1) 201 626 3500 Fax : (1) 201 626 4004 TOTAL S.A Capital 5 981 907 382 euros 542 051 180 R.C.S. Nanterre www.total.com
Net-debt-to-equity ratio
in millions of euros 09/30/2012 06/30/2012 09/30/2011
Current borrowings 10,647 10,642 10,406
Net current financial assets (1,493) (1,552) (923)
Non-current financial debt 24,606 23,260 22,415
Hedging instruments of non-current debt (1,796) (1,886) (2,012)
Cash and cash equivalents (16,833) (14,998) (19,942)
Net debt 15,131 15,466 9,944
Shareholders’ equity 72,789 72,103 65,290
Estimated dividend payable (1,291) (1,299) (1,254)
Non-controlling interests 1,275 1,256 1,467
Equity 72,773 72,060 65,503
Net-debt-to-equity ratio 20.8% 21.5% 15.2%
2012 Sensitivities*
Scenario Change Impact on adjusted
operating income(e)
Impact on adjusted net operating
income(e)
Dollar 1.40 $/€ +0.1 $ per € -1.8 B€ -0.95 B€
Brent 100 $/b +1 $/b +0.25 B€ / 0.35 B$ +0.11 B€ / 0.15 B$
European refining margins (ERMI) 25 $/t +1 $/t +0.06 B€ / 0.08 B$ +0.04 B€ / 0.05 B$
* Sensitivities are revised once per year upon publication of the previous year’s fourth quarter results. The impact of the €-$ sensitivity on adjusted operating income and adjusted net operating income attributable to the Upstream segment are approximately 80% and 75% respectively.

20
TOTAL 2, place de la Coupole La Défense 6 92 400 Courbevoie France Tel. : 33 (1) 47 44 58 53 Fax : 33 (1) 47 44 58 24 Jérôme SCHMITT Philippe HERGAUX Sandrine SABOUREAU Laurent KETTENMEYER Robert HAMMOND (U.S.) Tel. : (1) 201 626 3500 Fax : (1) 201 626 4004 TOTAL S.A Capital 5 981 907 382 euros 542 051 180 R.C.S. Nanterre www.total.com
Return on average capital employed
Twelve months ended September 30, 2012
in millions of euros Upstream Refining & Chemicals
Supply & Marketing
Group
Adjusted net operating income 11,359 1,043 726 12,621
Capital employed at 09/30/2011* 49,791 14,692 7,253 72,764
Capital employed at 09/30/2012* 63,293 16,413 7,800 85,003
ROACE 20.1% 6.7% 9.6% 16.0%
Twelve months ended June 30, 2012
in millions of euros Upstream Refining & Chemicals
Supply & Marketing
Group
Adjusted net operating income 10,856 846 678 12,073
Capital employed at 06/30/2011* 45,456 16,672 7,402 72,843
Capital employed at 06/30/2012* 59,254 16,558 8,204 85,167
ROACE 20.7% 5.1% 8.7% 15.3%
Full-year 2011
in millions of euros Upstream Refining & Chemicals
Supply & Marketing
Group
Adjusted net operating income 10,602 848 813 12,045
Capital employed at 12/31/2010* 43,671 17,265 5,909 70,866
Capital employed at 12/31/2011* 57,331 15,883 6,999 81,066
ROACE 21.0% 5.1% 12.6% 15.9%
* at replacement cost (excluding after-tax inventory effect)

1
Main indicators
Chart updated around the middle of the month following the end of each quarter
€/$ European refining margin ERMI* ($/t)** Brent ($/b) Average liquids price*** ($/b) Average gas price ($/Mbtu)***
Third quarter 2012 1.25 51.0 109.5 107.6 6.00
Second quarter 2012 1.28 38.2 108.3 101.6 7.10
First quarter 2012 1.31 20.9 118.6 115.2 7.16
Fourth quarter 2011 1.35 15.1 109.3 104.3 6.79
Third quarter 2011 1.41 13.4 113.4 106.8 6.56
* European Refining Margin Indicator (ERMI) is an indicator intended to represent the margin after variable costs for a hypothetical complex refinery located around Rotterdam in Northern Europe that processes a mix of crude oil and other inputs commonly supplied to this region to produce and market the main refined products at prevailing prices in this region. The indicator margin may not be representative of the actual margins achieved by Total in any period because of Total’s particular refinery configurations, product mix effects or other company-specific operating conditions. ** 1 $/t = 0.136 $/b *** consolidated subsidiaries, excluding fixed margin contracts. Beginning with the first quarter of 2012, includes hydrocarbon production overlifting / underlifting position valued at market price.
Disclaimer : data is based on Total’s reporting, is not audited and is subject to change.

Total financial statements Third quarter 2012 consolidated accounts, IFRS

CONSOLIDATED STATEMENT OF INCOMETOTAL
(unaudited)
(M€) (a)
3rd quarter2012
2nd quarter2012
3rd quarter2011
Sales 49,890 49,135 46,163Excise taxes (4,411) (4,559) (4,638)
Revenues from sales 45,479 44,576 41,525
Purchases, net of inventory variation (30,609) (32,294) (29,018)Other operating expenses (5,528) (5,827) (5,061)Exploration costs (317) (269) (242)Depreciation, depletion and amortization of tangible assets and mineral interests (3,246) (2,028) (1,873)Other income 474 225 1,334Other expense (129) (451) (212)
Financial interest on debt (154) (170) (262)Financial income from marketable securities & cash equivalents 8 24 114
Cost of net debt (146) (146) (148)
Other financial income 141 209 108Other financial expense (135) (118) (115)
Equity in net income (loss) of affiliates 641 436 497
Income taxes (3,488) (2,701) (3,448)Consolidated net income 3,137 1,612 3,347Group share 3,066 1,585 3,314Non-controlling interests 71 27 33Earnings per share (€) 1.36 0.70 1.47 Fully-diluted earnings per share (€) 1.35 0.70 1.47 (a) Except for per share amounts.

CONSOLIDATED STATEMENT OF COMPREHENSIVE INCOME
TOTAL(unaudited)
(M€)3rd quarter
20122nd quarter
20123rd quarter
2011
Consolidated net income 3,137 1,612 3,347
Other comprehensive incomeCurrency translation adjustment (1,007) 2,360 2,309Available for sale financial assets (183) (93) (389)Cash flow hedge 33 (67) (54)Share of other comprehensive income of associates, net amount 86 (57) (131)Other (2) (7) (2)
Tax effect 37 46 82
Total other comprehensive income (net amount) (1,036) 2,182 1,815
Comprehensive income 2,101 3,794 5,162- Group share 2,061 3,718 5,077- Non-controlling interests 40 76 85

CONSOLIDATED STATEMENT OF INCOMETOTAL
(unaudited)
(M€) (a)
9 months2012
9 months2011
Sales 150,193 137,201Excise taxes (13,363) (13,609)
Revenues from sales 136,830 123,592
Purchases, net of inventory variation (94,944) (84,659)Other operating expenses (16,447) (14,567)Exploration costs (942) (680)Depreciation, depletion and amortization of tangible assets and mineral interests (7,112) (5,090)Other income 988 1,665Other expense (676) (409)
Financial interest on debt (511) (557)Financial income from marketable securities & cash equivalents 67 216
Cost of net debt (444) (341)
Other financial income 435 518Other financial expense (389) (327)
Equity in net income (loss) of affiliates 1,618 1,447
Income taxes (10,494) (10,952)Consolidated net income 8,423 10,197Group share 8,313 9,986Non-controlling interests 110 211Earnings per share (€) 3.69 4.45 Fully-diluted earnings per share (€) 3.67 4.43 (a) Except for per share amounts.

CONSOLIDATED STATEMENT OF COMPREHENSIVE INCOME
TOTAL(unaudited)
(M€)9 months
20129 months
2011
Consolidated net income 8,423 10,197
Other comprehensive incomeCurrency translation adjustment 299 (335)Available for sale financial assets (342) 41Cash flow hedge 36 (89)Share of other comprehensive income of associates, net amount 191 (234)Other (15) (4)
Tax effect 72 53
Total other comprehensive income (net amount) 241 (568)
Comprehensive income 8,664 9,629- Group share 8,562 9,433- Non-controlling interests 102 196

CONSOLIDATED BALANCE SHEETTOTAL
(M€)
September 30, 2012
(unaudited)
June 30, 2012(unaudited)
December 31, 2011
September 30, 2011
(unaudited)
ASSETS
Non-current assetsIntangible assets, net 12,964 13,847 12,413 10,280Property, plant and equipment, net 70,583 69,868 64,457 59,729Equity affiliates : investments and loans 14,413 13,911 12,995 11,455Other investments 1,181 2,222 3,674 3,767Hedging instruments of non-current financial debt 1,796 1,886 1,976 2,012Other non-current assets 5,215 4,850 4,871 4,248
Total non-current assets 106,152 106,584 100,386 91,491
Current assetsInventories, net 17,266 17,111 18,122 16,024Accounts receivable, net 20,331 19,768 20,049 18,786Other current assets 11,377 10,435 10,767 7,938Current financial assets 1,726 1,723 700 1,172Cash and cash equivalents 16,833 14,998 14,025 19,942
Total current assets 67,533 64,035 63,663 63,862
Assets classified as held for sale - - - 1,630
Total assets 173,685 170,619 164,049 156,983
LIABILITIES & SHAREHOLDERS' EQUITY
Shareholders' equityCommon shares 5,915 5,911 5,909 5,909Paid-in surplus and retained earnings 70,703 69,181 66,506 65,862Currency translation adjustment (487) 401 (988) (3,091)Treasury shares (3,342) (3,390) (3,390) (3,390)
Total shareholders' equity - Group Share 72,789 72,103 68,037 65,290
Non-controlling interests 1,275 1,256 1,352 1,467
Total shareholders' equity 74,064 73,359 69,389 66,757
Non-current liabilitiesDeferred income taxes 13,167 12,380 12,260 10,601Employee benefits 1,987 2,005 2,232 2,180Provisions and other non-current liabilities 11,170 11,264 10,909 8,920Non-current financial debt 24,606 23,260 22,557 22,415
Total non-current liabilities 50,930 48,909 47,958 44,116
Current liabilitiesAccounts payable 20,869 20,448 22,086 18,753Other creditors and accrued liabilities 16,942 17,090 14,774 16,361Current borrowings 10,647 10,642 9,675 10,406Other current financial liabilities 233 171 167 249
Total current liabilities 48,691 48,351 46,702 45,769
Liabilities directly associated with the assets classified as held for sale - - - 341
Total liabilities and shareholders' equity 173,685 170,619 164,049 156,983

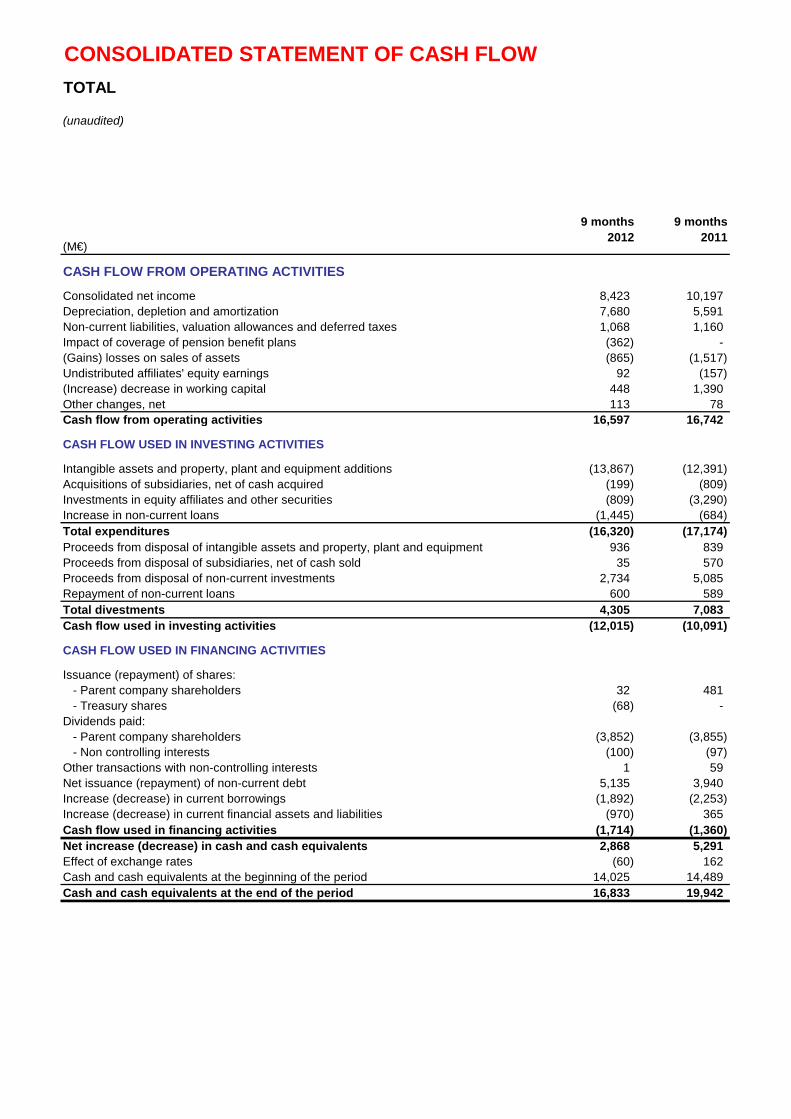
CONSOLIDATED STATEMENT OF CASH FLOWTOTAL
(unaudited)
(M€)
3rd quarter2012
2nd quarter2012
3rd quarter2011
CASH FLOW FROM OPERATING ACTIVITIES
Consolidated net income 3,137 1,612 3,347Depreciation, depletion and amortization 3,413 2,164 2,062Non-current liabilities, valuation allowances and deferred taxes 803 (99) 312Impact of coverage of pension benefit plans - (362) -(Gains) losses on sales of assets (419) (165) (1,282)Undistributed affiliates' equity earnings (135) 193 (34)(Increase) decrease in working capital (1,661) 2,783 1,501Other changes, net 25 41 58Cash flow from operating activities 5,163 6,167 5,964
CASH FLOW USED IN INVESTING ACTIVITIES
Intangible assets and property, plant and equipment additions (4,512) (4,128) (3,802)Acquisitions of subsidiaries, net of cash acquired (74) (4) 170Investments in equity affiliates and other securities (156) (455) (69)Increase in non-current loans (674) (377) (220)Total expenditures (5,416) (4,964) (3,921)Proceeds from disposal of intangible assets and property, plant and equipment 274 95 213Proceeds from disposal of subsidiaries, net of cash sold 1 - 399Proceeds from disposal of non-current investments 1,141 739 4,343Repayment of non-current loans 219 146 127Total divestments 1,635 980 5,082Cash flow used in investing activities (3,781) (3,984) 1,161
CASH FLOW USED IN FINANCING ACTIVITIES
Issuance (repayment) of shares: - Parent company shareholders 1 - 77 - Treasury shares (68) - -Dividends paid: - Parent company shareholders (1,282) (1,284) (1,283) - Non-controlling interests (2) (96) (35)Other transactions with non-controlling interests - 1 -Net issuance (repayment) of non-current debt 2,062 1,409 1,034Increase (decrease) in current borrowings (98) (693) (2,541)Increase (decrease) in current financial assets and liabilities (31) (10) 1,999Cash flow used in financing activities 582 (673) (749)Net increase (decrease) in cash and cash equivalents 1,964 1,510 6,376Effect of exchange rates (129) 158 179Cash and cash equivalents at the beginning of the period 14,998 13,330 13,387Cash and cash equivalents at the end of the period 16,833 14,998 19,942
CONSOLIDATED STATEMENT OF CASH FLOWTOTAL
(unaudited)
(M€)
9 months2012
9 months2011
CASH FLOW FROM OPERATING ACTIVITIES
Consolidated net income 8,423 10,197Depreciation, depletion and amortization 7,680 5,591Non-current liabilities, valuation allowances and deferred taxes 1,068 1,160Impact of coverage of pension benefit plans (362) -(Gains) losses on sales of assets (865) (1,517)Undistributed affiliates' equity earnings 92 (157)(Increase) decrease in working capital 448 1,390Other changes, net 113 78Cash flow from operating activities 16,597 16,742
CASH FLOW USED IN INVESTING ACTIVITIES
Intangible assets and property, plant and equipment additions (13,867) (12,391)Acquisitions of subsidiaries, net of cash acquired (199) (809)Investments in equity affiliates and other securities (809) (3,290)Increase in non-current loans (1,445) (684)Total expenditures (16,320) (17,174)Proceeds from disposal of intangible assets and property, plant and equipment 936 839Proceeds from disposal of subsidiaries, net of cash sold 35 570Proceeds from disposal of non-current investments 2,734 5,085Repayment of non-current loans 600 589Total divestments 4,305 7,083Cash flow used in investing activities (12,015) (10,091)
CASH FLOW USED IN FINANCING ACTIVITIES
Issuance (repayment) of shares: - Parent company shareholders 32 481 - Treasury shares (68) -Dividends paid: - Parent company shareholders (3,852) (3,855) - Non controlling interests (100) (97)Other transactions with non-controlling interests 1 59Net issuance (repayment) of non-current debt 5,135 3,940Increase (decrease) in current borrowings (1,892) (2,253)Increase (decrease) in current financial assets and liabilities (970) 365Cash flow used in financing activities (1,714) (1,360)Net increase (decrease) in cash and cash equivalents 2,868 5,291Effect of exchange rates (60) 162Cash and cash equivalents at the beginning of the period 14,025 14,489Cash and cash equivalents at the end of the period 16,833 19,942

CONSOLIDATED STATEMENT OF CHANGES IN SHAREHOLDERS' EQUITYTOTAL
(unaudited)
(M€) Number Amount Number Amount
As of January 1, 2011 2,349,640,931 5,874 60,538 (2,495) (112,487,679) (3,503) 60,414 857 61,271
Net income of the first nine months - - 9,986 - - - 9,986 211 10,197
Other comprehensive Income - - 45 (598) - - (553) (15) (568)
Comprehensive Income - - 10,031 (598) - - 9,433 196 9,629
Dividend - - (5,173) - - - (5,173) (97) (5,270)
Issuance of common shares 14,112,010 35 446 - - - 481 - 481
Purchase of treasury shares - - - - - - - - -
Sale of treasury shares (1) - - (113) - 2,931,034 113 - - -
Share-based payments - - 124 - - - 124 - 124
Share cancellation - - - - - - - - -
Other operations with non-controlling interests - - - 2 - - 2 57 59
Other items - - 9 - - - 9 454 463
As of September 30, 2011 2,363,752,941 5,909 65,862 (3,091) (109,556,645) (3,390) 65,290 1,467 66,757
Net income of the fourth quarter - - 2,290 - - - 2,290 94 2,384
Other comprehensive Income - - 186 2,002 - - 2,188 59 2,247
Comprehensive Income - - 2,476 2,002 - - 4,478 153 4,631
Dividend - - (1,284) - - - (1,284) (75) (1,359)
Issuance of common shares 14,372 - - - - - - - -
Purchase of treasury shares - - - - - - - - -
Sale of treasury shares (1) - - - - 2,472 - - - -
Share-based payments - - 37 - - - 37 - 37
Share cancellation - - - - - - - - -
Other operations with non-controlling interests - - (553) 101 - - (452) (180) (632)
Other items - - (32) - - - (32) (13) (45)
As of December 31, 2011 2,363,767,313 5,909 66,506 (988) (109,554,173) (3,390) 68,037 1,352 69,389
Net income of the first nine months - - 8,313 - - - 8,313 110 8,423
Other comprehensive Income - - (246) 495 - - 249 (8) 241
Comprehensive Income - - 8,067 495 - - 8,562 102 8,664
Dividend - - (3,913) - - - (3,913) (100) (4,013)
Issuance of common shares 2,151,933 6 26 - - - 32 - 32
Purchase of treasury shares - - - - (1,800,000) (68) (68) - (68)
Sale of treasury shares (1) - - (116) - 2,960,542 116 - - -
Share-based payments - - 114 - - - 114 - 114
Share cancellation - - - - - - - - -
Other operations with non-controlling interests - - 13 6 - - 19 (18) 1
Other items - - 6 - - - 6 (61) (55)
As of September 30, 2012 2,365,919,246 5,915 70,703 (487) (108,393,631) (3,342) 72,789 1,275 74,064
(1) Treasury shares related to the restricted stock grants.
Total shareholders'
equity
Shareholders' equity Group
Share
Common shares issued Treasury sharesPaid-in surplus and
retained earnings
Currency translation adjustment
Non-controlling interests

BUSINESS SEGMENT INFORMATIONTOTAL(unaudited)
3rd quarter 2012(M€)
Upstream Refining Chemicals
Supply Marketing Corporate Intercompany Total
Non-Group sales 5,001 23,260 21,574 55 - 49,890Intersegment sales 7,455 11,168 154 47 (18,824) -Excise taxes - (956) (3,455) - - (4,411)Revenues from sales 12,456 33,472 18,273 102 (18,824) 45,479Operating expenses (5,279) (31,914) (17,836) (249) 18,824 (36,454)Depreciation, depletion and amortization of tangible assets and mineral interests (2,779) (321) (136) (10) - (3,246)Operating income 4,398 1,237 301 (157) - 5,779Equity in net income (loss) of affiliates and other items 642 41 7 302 - 992Tax on net operating income (2,961) (348) (81) (119) - (3,509)Net operating income 2,079 930 227 26 - 3,262Net cost of net debt (125)Non-controlling interests (71)Net income 3,066
3rd quarter 2012 (adjustments) (a)
(M€)Upstream Refining
ChemicalsSupply
Marketing Corporate Intercompany Total
Non-Group sales (8) - - - - (8)Intersegment sales - - - - -Excise taxes - - - - -Revenues from sales (8) - - - - (8)Operating expenses 3 593 (42) - - 554Depreciation, depletion and amortization of tangible assets and mineral interests (1,134) (2) (14) - - (1,150)Operating income (b) (1,139) 591 (56) - - (604)Equity in net income (loss) of affiliates and other items - 5 33 293 - 331Tax on net operating income 327 (230) 7 (90) - 14Net operating income (b) (812) 366 (16) 203 - (259)Net cost of net debt -Non-controlling interests (23)Net income (282)
On operating income - 627 139 -On net operating income - 444 94 -
(c) Of which equity share of adjustments related to Sanofi-Aventis - - - -
3rd quarter 2012 (adjusted)(M€) (a) Upstream Refining
ChemicalsSupply
Marketing Corporate Intercompany Total
Non-Group sales 5,009 23,260 21,574 55 - 49,898Intersegment sales 7,455 11,168 154 47 (18,824) -Excise taxes - (956) (3,455) - - (4,411)Revenues from sales 12,464 33,472 18,273 102 (18,824) 45,487Operating expenses (5,282) (32,507) (17,794) (249) 18,824 (37,008)Depreciation, depletion and amortization of tangible assets and mineral interests (1,645) (319) (122) (10) - (2,096)Adjusted operating income 5,537 646 357 (157) - 6,383Equity in net income (loss) of affiliates and other items 642 36 (26) 9 - 661Tax on net operating income (3,288) (118) (88) (29) - (3,523)Adjusted net operating income 2,891 564 243 (177) - 3,521Net cost of net debt (125)Non-controlling interests (48)Ajusted net income 3,348Adjusted fully-diluted earnings per share (€) 1.48(a) Except for per share amounts.
3rd quarter 2012(M€)
Upstream Refining Chemicals
Supply Marketing Corporate Intercompany Total
Total expenditures 4,567 441 383 25 - 5,416Total divestments 401 55 41 1,138 - 1,635Cash flow from operating activities 3,457 1,036 692 (22) - 5,163
(a) Adjustments include special items, inventory valuation effect and the effect of changes in fair value.
(b) Of which inventory valuation effect

BUSINESS SEGMENT INFORMATIONTOTAL(unaudited)
2nd quarter 2012(M€)
Upstream Refining Chemicals
Supply Marketing Corporate Intercompany Total
Non-Group sales 4,977 22,592 21,519 47 - 49,135Intersegment sales 7,751 10,474 222 48 (18,495) -Excise taxes - (874) (3,686) 1 - (4,559)Revenues from sales 12,728 32,192 18,055 96 (18,495) 44,576Operating expenses (6,190) (32,646) (17,764) (285) 18,495 (38,390)Depreciation, depletion and amortization of tangible assets and mineral interests (1,513) (319) (189) (7) - (2,028)Operating income 5,025 (773) 102 (196) - 4,158Equity in net income (loss) of affiliates and other items 448 23 (14) (156) - 301Tax on net operating income (2,911) 256 (62) (14) - (2,731)Net operating income 2,562 (494) 26 (366) - 1,728Net cost of net debt (116)Non-controlling interests (27)Net income 1,585
2nd quarter 2012 (adjustments) (a)
(M€)Upstream Refining
ChemicalsSupply
Marketing Corporate Intercompany Total
Non-Group sales 11 - - - - 11Intersegment sales - - - - -Excise taxes - - - - -Revenues from sales 11 - - - - 11Operating expenses (18) (1,238) (148) (23) - (1,427)Depreciation, depletion and amortization of tangible assets and mineral interests - - (46) - - (46)Operating income (b) (7) (1,238) (194) (23) - (1,462)Equity in net income (loss) of affiliates and other items - (40) (8) (244) - (292)Tax on net operating income 9 401 47 (9) - 448Net operating income (b) 2 (877) (155) (276) - (1,306)Net cost of net debt -Non-controlling interests 33Net income (1,273)
On operating income - (1,238) (146) -On net operating income - (877) (99) -
(c) Of which equity share of adjustments related to Sanofi-Aventis - - - -
2nd quarter 2012 (adjusted)(M€) (a) Upstream Refining
ChemicalsSupply
Marketing Corporate Intercompany Total
Non-Group sales 4,966 22,592 21,519 47 - 49,124Intersegment sales 7,751 10,474 222 48 (18,495) -Excise taxes - (874) (3,686) 1 - (4,559)Revenues from sales 12,717 32,192 18,055 96 (18,495) 44,565Operating expenses (6,172) (31,408) (17,616) (262) 18,495 (36,963)Depreciation, depletion and amortization of tangible assets and mineral interests (1,513) (319) (143) (7) - (1,982)Adjusted operating income 5,032 465 296 (173) - 5,620Equity in net income (loss) of affiliates and other items 448 63 (6) 88 - 593Tax on net operating income (2,920) (145) (109) (5) - (3,179)Adjusted net operating income 2,560 383 181 (90) - 3,034Net cost of net debt (116)Non-controlling interests (60)Ajusted net income 2,858Adjusted fully-diluted earnings per share (€) 1.26(a) Except for per share amounts.
2nd quarter 2012(M€)
Upstream Refining Chemicals
Supply Marketing Corporate Intercompany Total
Total expenditures 4,227 501 212 24 - 4,964Total divestments 234 7 20 719 - 980Cash flow from operating activities 5,298 625 (140) 384 - 6,167
(a) Adjustments include special items, inventory valuation effect and the effect of changes in fair value.
(b) Of which inventory valuation effect
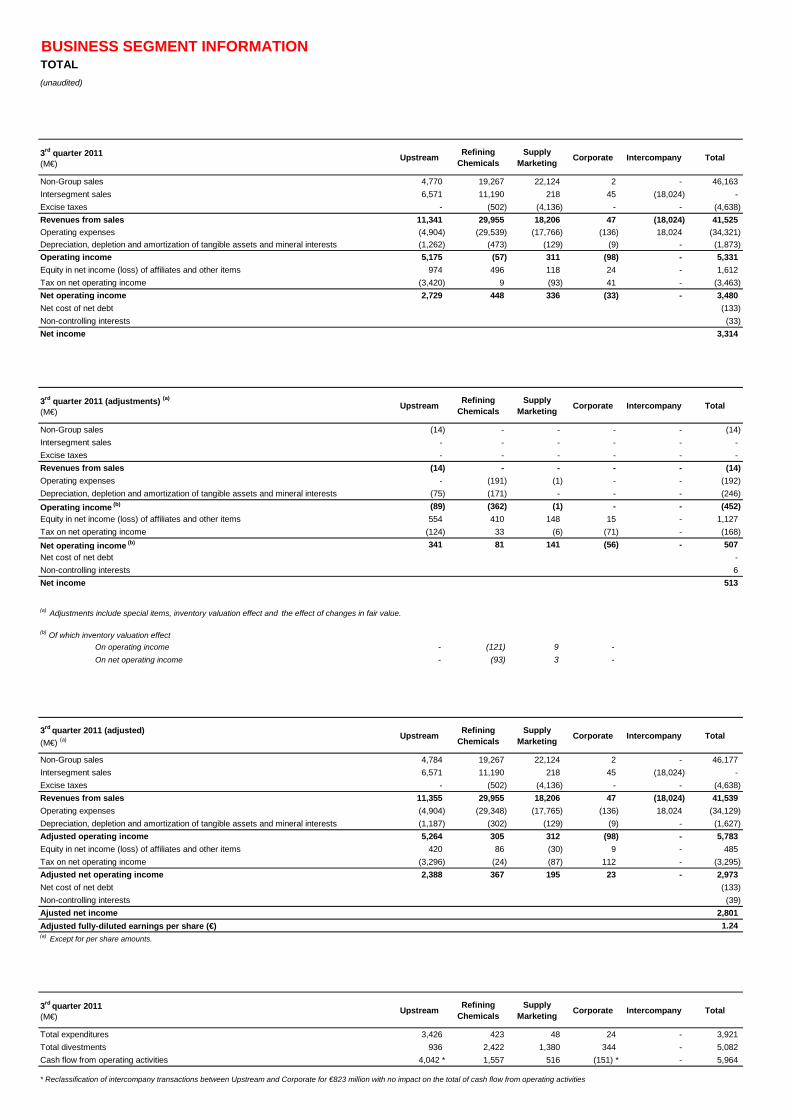
BUSINESS SEGMENT INFORMATIONTOTAL(unaudited)
3rd quarter 2011(M€)
Upstream Refining Chemicals
Supply Marketing Corporate Intercompany Total
Non-Group sales 4,770 19,267 22,124 2 - 46,163Intersegment sales 6,571 11,190 218 45 (18,024) -Excise taxes - (502) (4,136) - - (4,638)Revenues from sales 11,341 29,955 18,206 47 (18,024) 41,525Operating expenses (4,904) (29,539) (17,766) (136) 18,024 (34,321)Depreciation, depletion and amortization of tangible assets and mineral interests (1,262) (473) (129) (9) - (1,873)Operating income 5,175 (57) 311 (98) - 5,331Equity in net income (loss) of affiliates and other items 974 496 118 24 - 1,612Tax on net operating income (3,420) 9 (93) 41 - (3,463)Net operating income 2,729 448 336 (33) - 3,480Net cost of net debt (133)Non-controlling interests (33)Net income 3,314
3rd quarter 2011 (adjustments) (a)
(M€)Upstream Refining
ChemicalsSupply
Marketing Corporate Intercompany Total
Non-Group sales (14) - - - - (14)Intersegment sales - - - - - -Excise taxes - - - - - -Revenues from sales (14) - - - - (14)Operating expenses - (191) (1) - - (192)Depreciation, depletion and amortization of tangible assets and mineral interests (75) (171) - - - (246)Operating income (b) (89) (362) (1) - - (452)Equity in net income (loss) of affiliates and other items 554 410 148 15 - 1,127Tax on net operating income (124) 33 (6) (71) - (168)Net operating income (b) 341 81 141 (56) - 507Net cost of net debt -Non-controlling interests 6Net income 513
On operating income - (121) 9 -On net operating income - (93) 3 -
(c) Of which equity share of adjustments related to Sanofi - - - -
3rd quarter 2011 (adjusted)(M€) (a) Upstream Refining
ChemicalsSupply
Marketing Corporate Intercompany Total
Non-Group sales 4,784 19,267 22,124 2 - 46,177Intersegment sales 6,571 11,190 218 45 (18,024) -Excise taxes - (502) (4,136) - - (4,638)Revenues from sales 11,355 29,955 18,206 47 (18,024) 41,539Operating expenses (4,904) (29,348) (17,765) (136) 18,024 (34,129)Depreciation, depletion and amortization of tangible assets and mineral interests (1,187) (302) (129) (9) - (1,627)Adjusted operating income 5,264 305 312 (98) - 5,783Equity in net income (loss) of affiliates and other items 420 86 (30) 9 - 485Tax on net operating income (3,296) (24) (87) 112 - (3,295)Adjusted net operating income 2,388 367 195 23 - 2,973Net cost of net debt (133)Non-controlling interests (39)Ajusted net income 2,801Adjusted fully-diluted earnings per share (€) 1.24(a) Except for per share amounts.
3rd quarter 2011(M€)
Upstream Refining Chemicals
Supply Marketing Corporate Intercompany Total
Total expenditures 3,426 423 48 24 - 3,921Total divestments 936 2,422 1,380 344 - 5,082Cash flow from operating activities 4,042 * 1,557 516 (151) * - 5,964
* Reclassification of intercompany transactions between Upstream and Corporate for €823 million with no impact on the total of cash flow from operating activities
(a) Adjustments include special items, inventory valuation effect and the effect of changes in fair value.
(b) Of which inventory valuation effect

BUSINESS SEGMENT INFORMATIONTOTAL(unaudited)
9 months 2012(M€) Upstream Refining
ChemicalsSupply
Marketing Corporate Intercompany Total
Non-Group sales 16,155 68,948 64,945 145 - 150,193Intersegment sales 23,440 33,457 607 140 (57,644) -Excise taxes - (2,634) (10,729) - - (13,363)Revenues from sales 39,595 99,771 54,823 285 (57,644) 136,830Operating expenses (18,008) (97,617) (53,588) (764) 57,644 (112,333)Depreciation, depletion and amortization of tangible assets and mineral interests (5,685) (954) (447) (26) - (7,112)Operating income 15,902 1,200 788 (505) - 17,385Equity in net income (loss) of affiliates and other items 1,633 156 (76) 263 - 1,976Tax on net operating income (9,858) (306) (299) (129) - (10,592)Net operating income 7,677 1,050 413 (371) - 8,769Net cost of net debt (346)Non-controlling interests (110)Net income 8,313
9 months 2012 (adjustments) (a)
(M€)Upstream Refining
ChemicalsSupply
Marketing Corporate Intercompany Total
Non-Group sales (22) - - - - (22)Intersegment sales - - - - -Excise taxes - - - - -Revenues from sales (22) - - - - (22)Operating expenses (15) 138 (127) (88) - (92)Depreciation, depletion and amortization of tangible assets and mineral interests (1,134) (2) (60) - - (1,196)Operating income (b) (1,171) 136 (187) (88) - (1,310)Equity in net income (loss) of affiliates and other items - (12) 4 159 - 151Tax on net operating income 341 (82) 32 (106) - 185Net operating income (b) (830) 42 (151) (35) - (974)Net cost of net debt -Non-controlling interests 7Net income (967)
On operating income - 172 56 -On net operating income - 120 35 -
(c) Of which equity share of adjustments related to Sanofi-Aventis - - - -
9 months 2012 (adjusted)(M€) (a) Upstream Refining
ChemicalsSupply
Marketing Corporate Intercompany Total
Non-Group sales 16,177 68,948 64,945 145 - 150,215Intersegment sales 23,440 33,457 607 140 (57,644) -Excise taxes - (2,634) (10,729) - - (13,363)Revenues from sales 39,617 99,771 54,823 285 (57,644) 136,852Operating expenses (17,993) (97,755) (53,461) (676) 57,644 (112,241)Depreciation, depletion and amortization of tangible assets and mineral interests (4,551) (952) (387) (26) - (5,916)Adjusted operating income 17,073 1,064 975 (417) - 18,695Equity in net income (loss) of affiliates and other items 1,633 168 (80) 104 - 1,825Tax on net operating income (10,199) (224) (331) (23) - (10,777)Adjusted net operating income 8,507 1,008 564 (336) - 9,743Net cost of net debt (346)Non-controlling interests (117)Ajusted net income 9,280Adjusted fully-diluted earnings per share (€) 4.10(a) Except for per share amounts.
9 months 2012(M€) Upstream Refining
ChemicalsSupply
Marketing Corporate Intercompany Total
Total expenditures 14,100 1,371 793 56 - 16,320Total divestments 1,383 203 106 2,613 - 4,305Cash flow from operating activities 14,521 1,625 108 343 - 16,597
(a) Adjustments include special items, inventory valuation effect and the effect of changes in fair value.
(b) Of which inventory valuation effect

BUSINESS SEGMENT INFORMATIONTOTAL(unaudited)
9 months 2011(M€) Upstream Refining
ChemicalsSupply
Marketing Corporate Intercompany Total
Non-Group sales 16,079 57,741 63,367 14 - 137,201Intersegment sales 19,851 32,198 615 129 (52,793) -Excise taxes - (1,483) (12,126) - - (13,609)Revenues from sales 35,930 88,456 51,856 143 (52,793) 123,592Operating expenses (15,883) (85,997) (50,369) (450) 52,793 (99,906)Depreciation, depletion and amortization of tangible assets and mineral interests (3,602) (1,106) (356) (26) - (5,090)Operating income 16,445 1,353 1,131 (333) - 18,596Equity in net income (loss) of affiliates and other items 1,874 608 118 294 - 2,894Tax on net operating income (10,233) (444) (341) (12) - (11,030)Net operating income 8,086 1,517 908 (51) - 10,460Net cost of net debt (263)Non-controlling interests (211)Net income 9,986
9 months 2011 (adjustments) (a)
(M€)Upstream Refining
ChemicalsSupply
Marketing Corporate Intercompany Total
Non-Group sales 15 - - - - 15Intersegment sales - - - - - -Excise taxes - - - - - -Revenues from sales 15 - - - - 15Operating expenses - 785 229 - - 1,014Depreciation, depletion and amortization of tangible assets and mineral interests (75) (171) - - - (246)Operating income (b) (60) 614 229 - - 783Equity in net income (loss) of affiliates and other items 722 405 106 69 - 1,302Tax on net operating income (326) (315) (78) (73) - (792)Net operating income (b) 336 704 257 (4) - 1,293Net cost of net debt -Non-controlling interests (6)Net income 1,287
On operating income - 904 253 -On net operating income - 629 178 -
(c) Of which equity share of adjustments related to Sanofi - - - -
9 months 2011 (adjusted)(M€) (a) Upstream Refining
ChemicalsSupply
Marketing Corporate Intercompany Total
Non-Group sales 16,064 57,741 63,367 14 - 137,186Intersegment sales 19,851 32,198 615 129 (52,793) -Excise taxes - (1,483) (12,126) - - (13,609)Revenues from sales 35,915 88,456 51,856 143 (52,793) 123,577Operating expenses (15,883) (86,782) (50,598) (450) 52,793 (100,920)Depreciation, depletion and amortization of tangible assets and mineral interests (3,527) (935) (356) (26) - (4,844)Adjusted operating income 16,505 739 902 (333) - 17,813Equity in net income (loss) of affiliates and other items 1,152 203 12 225 - 1,592Tax on net operating income (9,907) (129) (263) 61 - (10,238)Adjusted net operating income 7,750 813 651 (47) - 9,167Net cost of net debt (263)Non-controlling interests (205)Ajusted net income 8,699Adjusted fully-diluted earnings per share (€) 3.86(a) Except for per share amounts.
9 months 2011(M€) Upstream Refining
ChemicalsSupply
Marketing Corporate Intercompany Total
Total expenditures 14,528 1,286 1,289 71 - 17,174Total divestments 2,192 2,451 1,428 1,012 - 7,083Cash flow from operating activities 13,497 2,795 407 43 - 16,742
(a) Adjustments include special items, inventory valuation effect and the effect of changes in fair value.
(b) Of which inventory valuation effect
* Reclassification of intercompany transactions between Upstream and Corporate for €823 million with no impact on the total of cash flow from operating activities
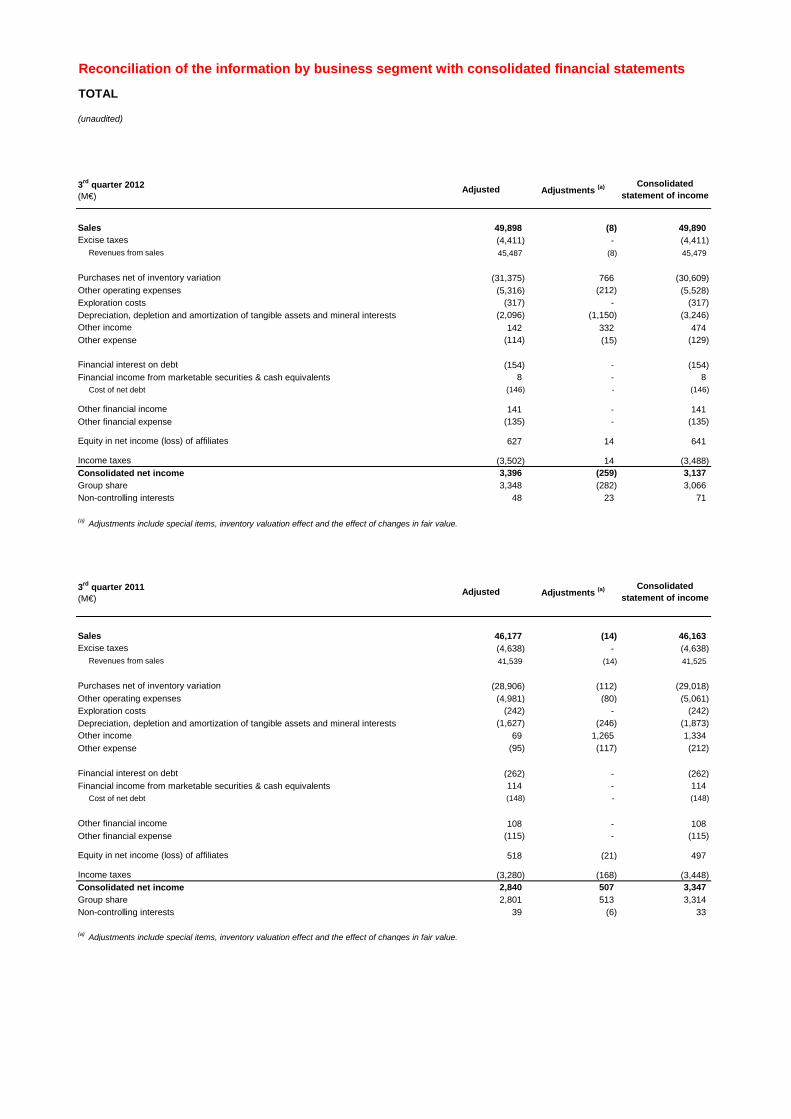
Reconciliation of the information by business segment with consolidated financial statements
TOTAL
(unaudited)
3rd quarter 2012(M€)
Adjusted Adjustments (a) Consolidated statement of income
Sales 49,898 (8) 49,890Excise taxes (4,411) - (4,411)
Revenues from sales 45,487 (8) 45,479
Purchases net of inventory variation (31,375) 766 (30,609)Other operating expenses (5,316) (212) (5,528)Exploration costs (317) - (317)Depreciation, depletion and amortization of tangible assets and mineral interests (2,096) (1,150) (3,246)Other income 142 332 474Other expense (114) (15) (129)
Financial interest on debt (154) - (154)Financial income from marketable securities & cash equivalents 8 - 8
Cost of net debt (146) - (146)
Other financial income 141 - 141Other financial expense (135) - (135)
Equity in net income (loss) of affiliates 627 14 641
Income taxes (3,502) 14 (3,488)Consolidated net income 3,396 (259) 3,137Group share 3,348 (282) 3,066Non-controlling interests 48 23 71
(a) Adjustments include special items, inventory valuation effect and the effect of changes in fair value.
3rd quarter 2011(M€)
Adjusted Adjustments (a) Consolidated statement of income
Sales 46,177 (14) 46,163Excise taxes (4,638) - (4,638)
Revenues from sales 41,539 (14) 41,525
Purchases net of inventory variation (28,906) (112) (29,018)Other operating expenses (4,981) (80) (5,061)Exploration costs (242) - (242)Depreciation, depletion and amortization of tangible assets and mineral interests (1,627) (246) (1,873)Other income 69 1,265 1,334Other expense (95) (117) (212)
Financial interest on debt (262) - (262)Financial income from marketable securities & cash equivalents 114 - 114
Cost of net debt (148) - (148)
Other financial income 108 - 108Other financial expense (115) - (115)
Equity in net income (loss) of affiliates 518 (21) 497
Income taxes (3,280) (168) (3,448)Consolidated net income 2,840 507 3,347Group share 2,801 513 3,314Non-controlling interests 39 (6) 33
(a) Adjustments include special items, inventory valuation effect and the effect of changes in fair value.

Reconciliation of the information by business segment with consolidated financial statements
TOTAL
(unaudited)
9 months 2012(M€) Adjusted Adjustments (a) Consolidated
statement of income
Sales 150,215 (22) 150,193Excise taxes (13,363) - (13,363)
Revenues from sales 136,852 (22) 136,830
Purchases net of inventory variation (95,172) 228 (94,944)Other operating expenses (16,127) (320) (16,447)Exploration costs (942) - (942)Depreciation, depletion and amortization of tangible assets and mineral interests (5,916) (1,196) (7,112)Other income 447 541 988Other expense (314) (362) (676)
Financial interest on debt (511) - (511)Financial income from marketable securities & cash equivalents 67 - 67
Cost of net debt (444) - (444)
Other financial income 435 - 435Other financial expense (389) - (389)
Equity in net income (loss) of affiliates 1,646 (28) 1,618
Income taxes (10,679) 185 (10,494)Consolidated net income 9,397 (974) 8,423Group share 9,280 (967) 8,313Non-controlling interests 117 (7) 110
(a) Adjustments include special items, inventory valuation effect and the effect of changes in fair value.
9 months 2011(M€) Adjusted Adjustments (a) Consolidated
statement of income
Sales 137,186 15 137,201Excise taxes (13,609) - (13,609)
Revenues from sales 123,577 15 123,592
Purchases net of inventory variation (85,816) 1,157 (84,659)Other operating expenses (14,424) (143) (14,567)Exploration costs (680) - (680)Depreciation, depletion and amortization of tangible assets and mineral interests (4,844) (246) (5,090)Other income 178 1,487 1,665Other expense (224) (185) (409)
Financial interest on debt (557) - (557)Financial income from marketable securities & cash equivalents 216 - 216
Cost of net debt (341) - (341)
Other financial income 518 - 518Other financial expense (327) - (327)
Equity in net income (loss) of affiliates 1,447 - 1,447
Income taxes (10,160) (792) (10,952)Consolidated net income 8,904 1,293 10,197Group share 8,699 1,287 9,986Non-controlling interests 205 6 211
(a) Adjustments include special items, inventory valuation effect and the effect of changes in fair value.