Third quarter 2016 - Microsoft · Agenda 2 1 Third quarter 2016 results 2 Hafslund’s role in the...
52
Third quarter 2016 Finn Bjørn Ruyter Oslo, 25 October 2016 Presentation to analysts
Transcript of Third quarter 2016 - Microsoft · Agenda 2 1 Third quarter 2016 results 2 Hafslund’s role in the...

Third quarter 2016
Finn Bjørn Ruyter
Oslo, 25 October 2016
Presentation to analysts

Agenda
2
1 Third quarter 2016 results
2 Hafslund’s role in the green shift
3 Appendix
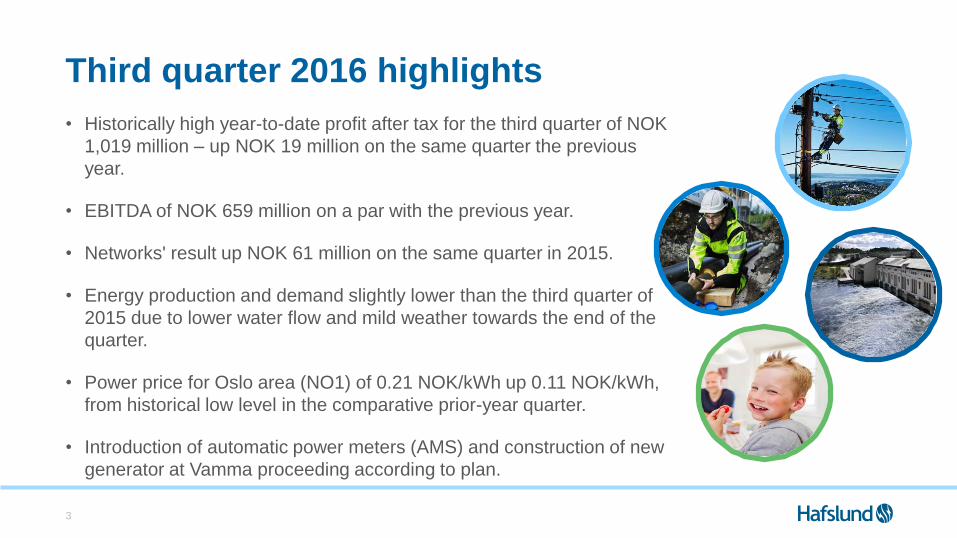
Third quarter 2016 highlights
• Historically high year-to-date profit after tax for the third quarter of NOK
1,019 million – up NOK 19 million on the same quarter the previous
year.
• EBITDA of NOK 659 million on a par with the previous year.
• Networks' result up NOK 61 million on the same quarter in 2015.
• Energy production and demand slightly lower than the third quarter of
2015 due to lower water flow and mild weather towards the end of the
quarter.
• Power price for Oslo area (NO1) of 0.21 NOK/kWh up 0.11 NOK/kWh,
from historical low level in the comparative prior-year quarter.
• Introduction of automatic power meters (AMS) and construction of new
generator at Vamma proceeding according to plan.
3
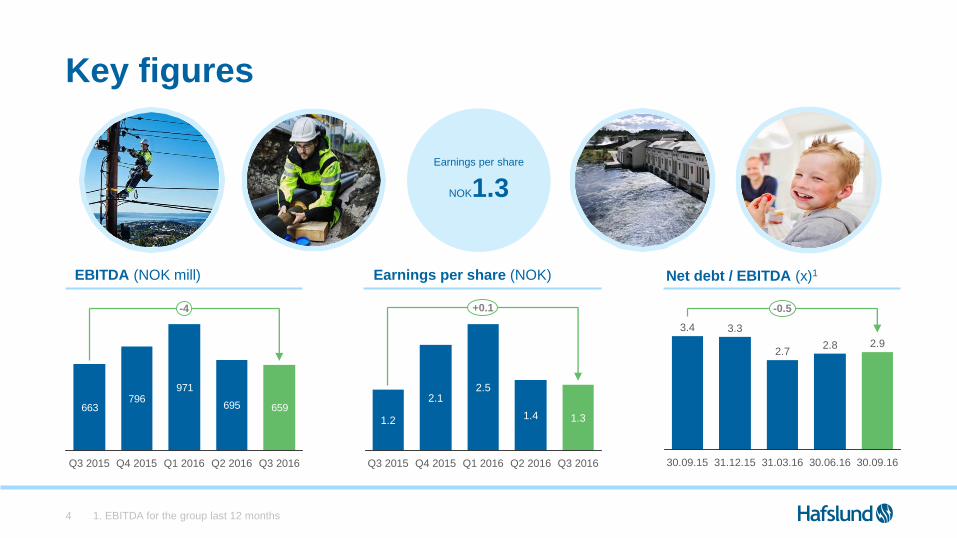
Key figures
1. EBITDA for the group last 12 months4
2.7
-0.5
30.09.16
2.92.8
31.12.15 30.06.1631.03.16
3.3
30.09.15
3.4
EBITDA (NOK mill) Earnings per share (NOK)
Earnings per share
NOK1.3
Net debt / EBITDA (x)1
663796
971
695 659
Q2 2016Q1 2016 Q3 2016
-4
Q3 2015 Q4 2015
1.4
+0.1
1.3
2.5
Q1 2016Q4 2015 Q3 2016Q2 2016
2.1
Q3 2015
1.2
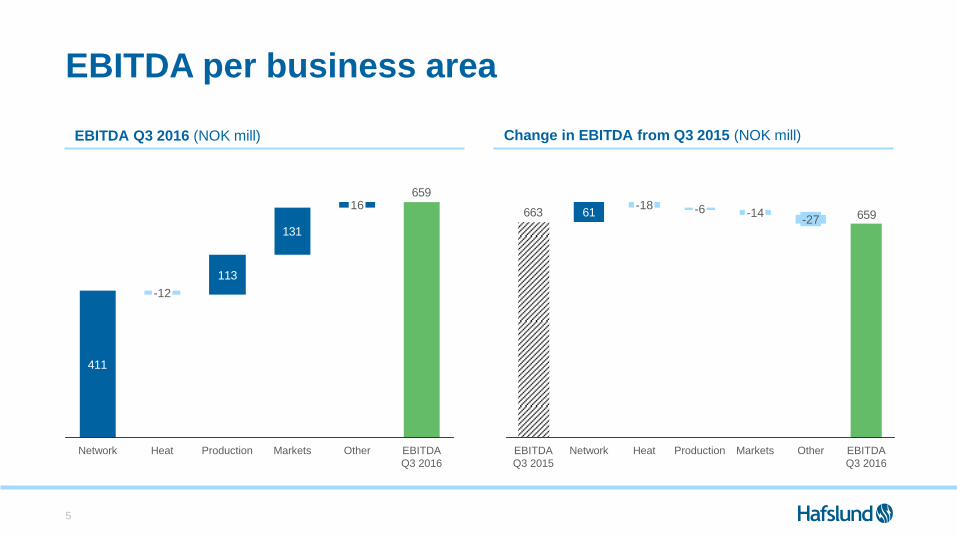
EBITDA per business area
5
411
113
131
659
Markets
16
OtherProduction EBITDA
Q3 2016
-12
Network Heat
65961663
EBITDA
Q3 2015
-27
EBITDA
Q3 2016
-14
Heat
-18
Production
-6
Markets OtherNetwork
EBITDA Q3 2016 (NOK mill) Change in EBITDA from Q3 2015 (NOK mill)

Somewhat higher number of less serious injuries since the previous report. A strong focus on
competence building and monitoring of injuries to prevent recurrence.
HSE
1 last 12 months, the total number of injuries per million manhours on own employees and suppliers in our facilities in Hafslund Group excl. Market
2 Industry average for total injuries acc. To Energy Norway's statistics for 2014, for companies in the energy industry, incl. the contractors, but without suppliers6
0injuries
Goal
9.0Injuries per million
hours (H2)
10.9Injuries per million
hours (H2)
Industry average 2Last 12 months per
30.09.2016 1

Lower production than last year due to reduced water flow, and warmer weather at the end of the
quarter reduced the energy demand
Production and distribution
7
Heat and Production (GWh)
1 050
681 618
930821
151
511 722262
136
Q3 2015 Q1 2016 Q2 2016
-244
Q4 2015 Q3 2016
ProductionHeat
Network (GWh)
Q1 2016
3.856
5.498
Q3 2015
3.302
Q2 2016
-118
6.602
Q4 2015 Q3 2016
3.184
Network

Power price development NO1
Source NordPool Spot, and Nasdaq OMX Commodities per
30.09.20168
0.15
0.10
0.05
0.20
0.30
0.25
0.00Jan JulApr JunMar May SepFeb Aug Nov DecOct
NOK/kWh
2015
2016

Rising power prices have reduced the effect hedging activity has on company results
Developments in forward prices and hedge trading
Source Nasdaq OMX Commodities, Bloomberg. Per 10.10.20169
Forward prices for 2017 (YR-17) Results from hedging activity (NOK mill)
10
15
20
25
30
35
Jan-17Jul-16Jul-12 Jan-14 Jan-16Jul-14Jan-13Jan-12 Jul-15Jan-15Jul-13
øre/kWh
Forward price
25
86
163
1513
201520142013 Ytd 20162012
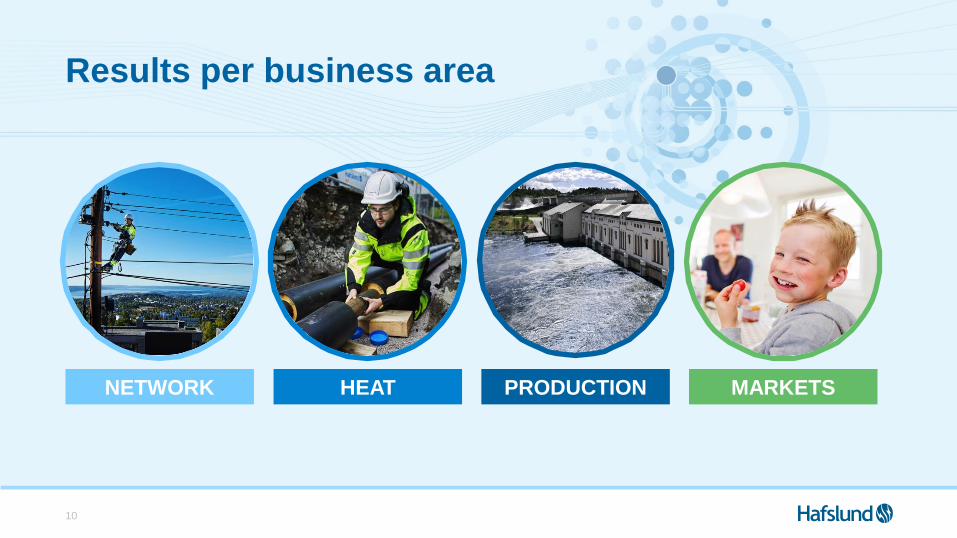
Results per business area
10
NETWORK HEAT PRODUCTION MARKETS
11
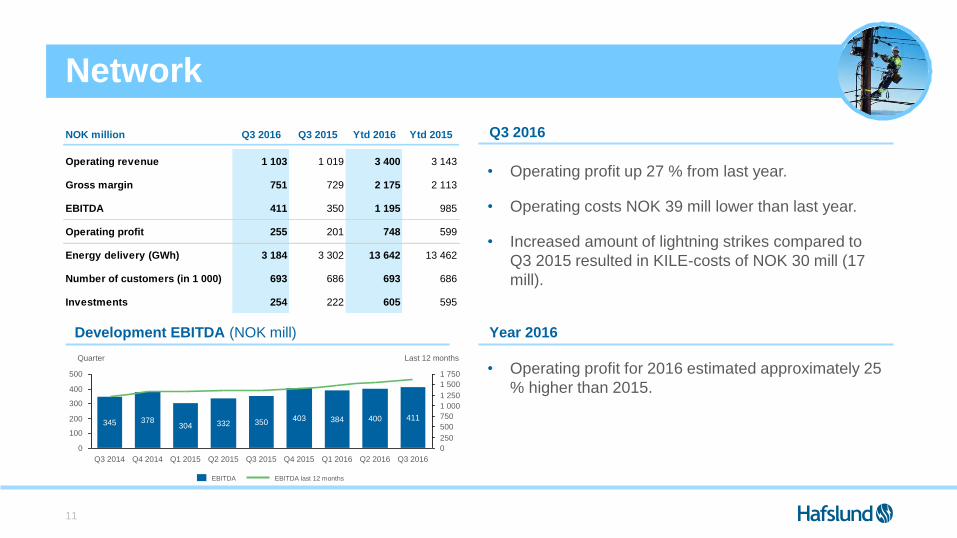
• Operating profit up 27 % from last year.
• Operating costs NOK 39 mill lower than last year.
• Increased amount of lightning strikes compared to
Q3 2015 resulted in KILE-costs of NOK 30 mill (17
mill).
0
1 250
1 000300
750
500200
250
1 750
1 500
100
0
500
400
Q1 2015Q4 2014 Q3 2016
345
Last 12 months
411400
Q3 2015
350
Q2 2015 Q2 2016Q1 2016
384
Q4 2015
Quarter
403304
378 332
Q3 2014
• Operating profit for 2016 estimated approximately 25
% higher than 2015.
Development EBITDA (NOK mill)
Q3 2016
Year 2016
Network
EBITDA last 12 monthsEBITDA
NOK million Q3 2016 Q3 2015 Ytd 2016 Ytd 2015
Operating revenue 1 103 1 019 3 400 3 143
Gross margin 751 729 2 175 2 113
EBITDA 411 350 1 195 985
Operating profit 255 201 748 599
Energy delivery (GWh) 3 184 3 302 13 642 13 462
Number of customers (in 1 000) 693 686 693 686
Investments 254 222 605 595
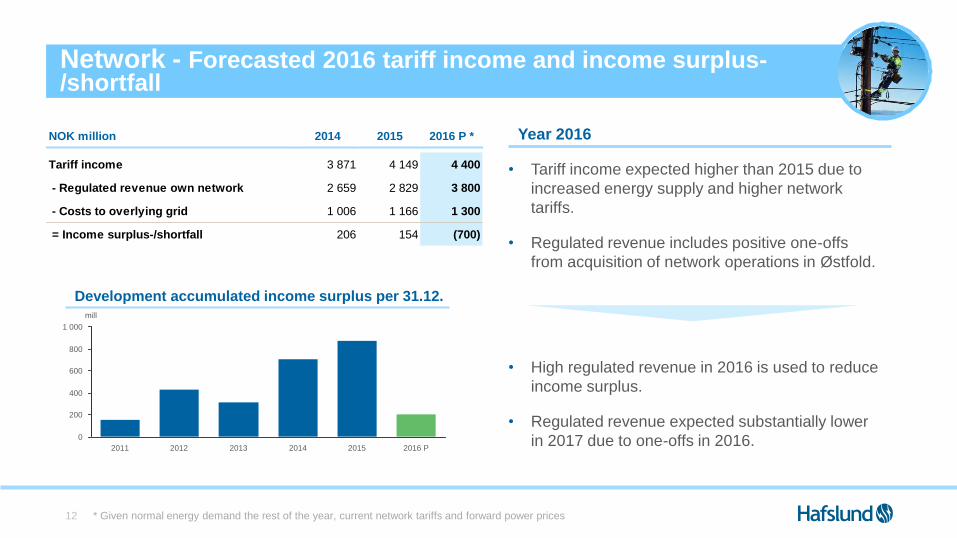
* Given normal energy demand the rest of the year, current network tariffs and forward power prices12
Year 2016
• Tariff income expected higher than 2015 due to
increased energy supply and higher network
tariffs.
• Regulated revenue includes positive one-offs
from acquisition of network operations in Østfold.
• High regulated revenue in 2016 is used to reduce
income surplus.
• Regulated revenue expected substantially lower
in 2017 due to one-offs in 2016.
Network - Forecasted 2016 tariff income and income surplus-/shortfall
800
600
400
200
0
1 000
mill
2016 P20152014201320122011
Development accumulated income surplus per 31.12.
NOK million 2014 2015 2016 P *
Tariff income 3 871 4 149 4 400
- Regulated revenue own network 2 659 2 829 3 800
- Costs to overlying grid 1 006 1 166 1 300
= Income surplus-/shortfall 206 154 (700)

Network - status AMS
13
Roll-out phase
700 000 total
power meters
August
16
• Full scale roll-out of power meters started in August.
• Accumulated investments of NOK 454 mill per
30.09.16 against total project estimate of NOK 2.4
billion.
Pilots
Sept
16
Ultimo
18
30 000
installed power
meters
Roll-out plan
H2 2016
H1 2017
H2 2017
H1 2018
H2 2018
Not Hafslund
14
300
300
250
150
200 450
100
50
0
-50
150
600
0
-12
Quarter
Q3 2015Q4 2014
116
Q3 2014 Q1 2016
5
Last 12 months
Q2 2016
285
Q4 2015
157
6
Q1 2015
201
-9 19
Q2 2015 Q3 2016
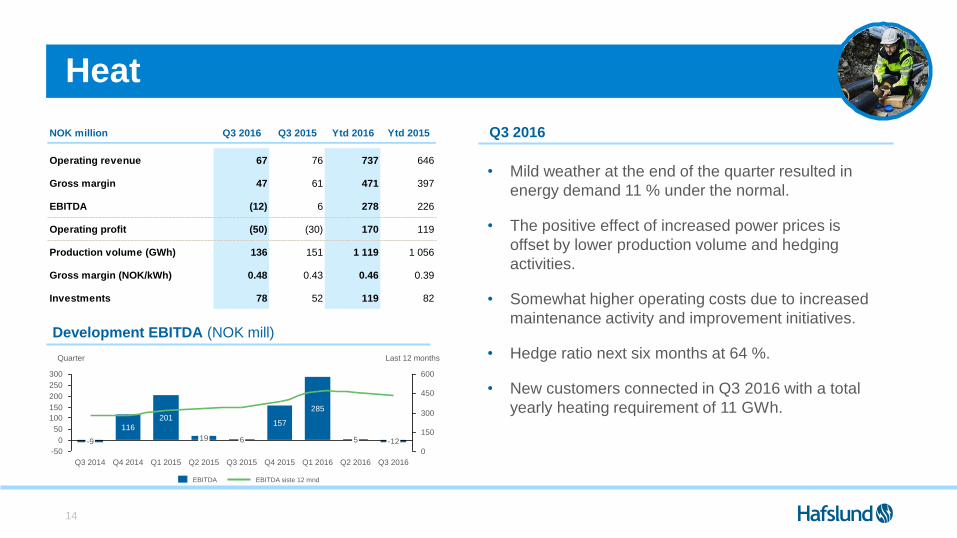
• Mild weather at the end of the quarter resulted in
energy demand 11 % under the normal.
• The positive effect of increased power prices is
offset by lower production volume and hedging
activities.
• Somewhat higher operating costs due to increased
maintenance activity and improvement initiatives.
• Hedge ratio next six months at 64 %.
• New customers connected in Q3 2016 with a total
yearly heating requirement of 11 GWh.
Development EBITDA (NOK mill)
Q3 2016
Heat
EBITDA EBITDA siste 12 mnd
NOK million Q3 2016 Q3 2015 Ytd 2016 Ytd 2015
Operating revenue 67 76 737 646
Gross margin 47 61 471 397
EBITDA (12) 6 278 226
Operating profit (50) (30) 170 119
Production volume (GWh) 136 151 1 119 1 056
Gross margin (NOK/kWh) 0.48 0.43 0.46 0.39
Investments 78 52 119 82
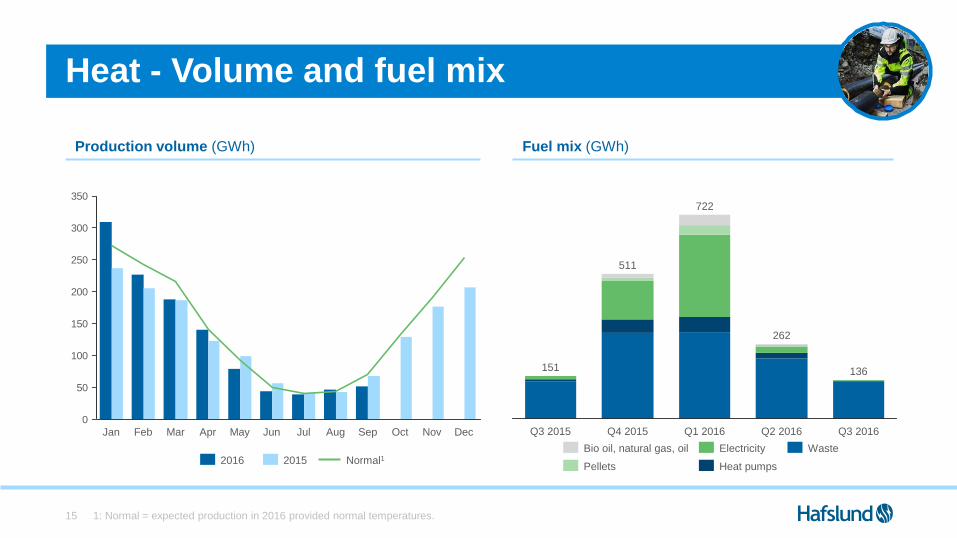
Heat - Volume and fuel mix
1: Normal = expected production in 2016 provided normal temperatures.15
0
50
100
150
200
250
300
350
JunJan NovOctAprMar May DecSepAugJulFeb
20152016 Normal1
Production volume (GWh) Fuel mix (GWh)
Q3 2016
136
722
Q3 2015 Q4 2015
511
151
Q1 2016 Q2 2016
262
Bio oil, natural gas, oil
Pellets Heat pumps
WasteElectricity

1 Normal levels for Q4 is ~690 GWh.16
150
0
120
40
300
450
80
600
0
160
147
Last 12 months
Q1 2016
95
Q4 2015
91
Q3 2015
119
Q3 2016
113
Q2 2016Q2 2015
129
65
117
Q1 2015
153
Q4 2014Q3 2014
Quarter
Development EBITDA (NOK mill)
• Production volume is 22 % below last year and 11 %
below the normal.
• Revenue (NOK/kWh) of 0.20 is NOK 0.03 higher
than last year and slightly below power price NO1.
• Hedge ratio next six months at 35 %.
• Estimated production in Q4 slightly below normal
levels1.
Q3 2016
Production
EBITDA EBITDA last 12 months
NOK million Q3 2016 Q3 2015 Ytd 2016 Ytd 2015
Operating revenue 167 176 519 503
EBITDA 113 119 355 300
Operating profit 101 107 322 266
Revenue (NOK/kWh) 0.20 0.17 0.22 0.19
Production volume (GWh) 821 1 050 2 369 2 609
Investments 52 4 179 20

Production and water flow
1: Normal production = 3100 GWh based on 10 years data adjusted for efficiency improvements.
2: Normal = Median water flow last 10 years.17
0
100
200
300
400
DecJun OctSepFebJan Aug NovMayMar Apr Jul
2016 Normal 12015
Production (GWh)
0
500
1 000
1 500
2 000
aprjan novjulmai aug desfeb jun oktmar sep
Normal 2 Max. capacity utilization20152016
Water flow and capacity utilization (m3/sec)
Q3
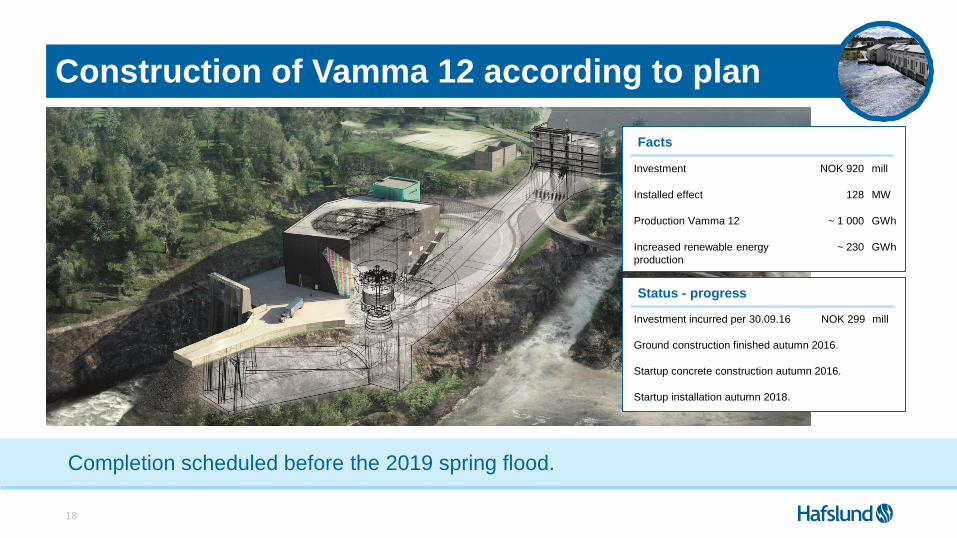
18
Facts
Investment NOK 920 mill
Installed effect 128 MW
Production Vamma 12 ~ 1 000 GWh
Increased renewable energy
production
~ 230 GWh
Completion scheduled before the 2019 spring flood.
Construction of Vamma 12 according to plan
Status - progress
Investment incurred per 30.09.16 NOK 299 mill
Ground construction finished autumn 2016.
Startup concrete construction autumn 2016.
Startup installation autumn 2018.

19
80
160
40
0
120
240 600
450
300
150
0
200
Quarter Last 12 months
Q3 2015
92
Q1 2016
208
137
Q1 2015
85
Q3 2016
153
Q4 2014 Q2 2016
131124
Q4 2015
145186
Q3 2014 Q2 2015
• Satisfying results in a quarter with low energy
demand.
• Increased volume due to 39,000 additional
customers than in Q3 2015.
• The result reflects costs related to increased
marketing activities and somewhat lower margins.
• 1,084,000 customers at the end of Q3, where
365,000 customers are outside Norway.Development EBITDA (NOK mill)
Q3 2016
Markets
EBITDA last 12 monthsEBITDA
NOK million Q3 2016 Q3 2015 Ytd 2016 Ytd 2015
Operating revenues 1 273 887 4 995 4 235
Gross margin 392 390 1 257 1 165
EBITDA 131 145 462 468
Operating profit 111 125 396 407
Number of customers (in 1 000) 1 084 1 045 1 084 1 045
Sold volume (GWh) 3 156 3 017 13 774 12 689

NETWORK HEAT PRODUCTION MARKETS
Group summary
20

Change in EBITDA, and profit after tax
21
659663
Operating
expenses
9
Gross marginEBITDA
Q3 2015
3
Gain/loss
financial items
10
EBITDA
Q3 2016
234
42
127
255
659
DepreciationEBITDA
Q3 2016
Financial
expenses
Profit after
tax Q3 2016
Tax
Earnings per
share NOK 1.31
Profit after tax Q3 2016 (NOK mill)Change in EBITDA from Q3 2015 (NOK mill)

Investments
22
Investments, excluding acquisitions (NOK bn.) Growth investments towards 2020
Vamma 12
NOK 920 mill.
+230 GWh
District heating
+260 GWh
Markets
Organic customer
growth2014
0.9
20152013
1.5
1.3
2018 P2017 P2016P
0.8
Annual investments Periodical avg. Investments
Network
AMS NOK 2.4 bn.
~10 000 new customers
annually
Average 2017P-2018P:
NOK 2.1 billion

Hafslund’s goal is to maintain a rating equivalent to BBB+
Change in net interest bearing debt
1: EBITDA for for the group last 12 months23
633
392266
659
9 045
Paid interest
and tax
Net debt
30.09.16
Investments Freed
capital
49
EBITDA Change in
working
capital etc
Net debt
30.09.16
8 896
2.7
3.3
30.06.16
3.4
30.09.15 31.12.15 31.03.16
2.8
30.09.16
2.9
36%
30.09.16
37%
30.06.1631.12.15
33% 34%
31.03.16
35%
30.09.15
Equity ratio (%)
Net debt / EBITDA (x)1Change in net debt in the quarter (NOK mill)

Outlook
• Operating profit 2016 for Network estimated about 25 % higher than for 2015.
• Profit after tax for Q4 is expected somewhat lower than last year due to positive one-offs in
2015, while 2016 as a whole is expected better than 2015.
• Increased level of investment driven by AMS and Vamma 12. Average annual investment of
NOK 2.1 billion over the next two years compared to an average of NOK 1.0 billion (ex.
acquisitions) for the previous three years and NOK 1.5 billion in 2016.
• Q4 and Q1 with seasonal high energy demand for Heat and Markets.
24
Agenda
25
1 Third quarter 2016 results
2 Hafslund’s role in the green shift
3 Appendix
Hafslund’s role in thegreen shift

For Hafslund, it is a strategic priority to offer green and renewable energy solutions
Hafslund has had a strong focus on green and
renewable solutions for many years
27
1898
Renewable
run-of-river
hydropower
production for
more than 100
years
2010 2011
Oil-fired and electric
boiler at Rodeløkka
replaced with
environmentally
friendly bioenergy
boiler (100 MW)
2013
More environmentally friendly
district heating with new
wood-pellet boiler (56 MW)
20152006
Oslo network upgraded
to supply power to
growing population with
increased electrification
Close to target of
100% renewable
district heating
New Vamma
generator (128 MW)
New Kykkelsrud
generator (40 MW)

Hafslund is green in all business areas
28
Vision:
The energy solutions of the future –
for you and for the environment
MARKETS
HEAT
PRODUCTION
Renewable energy
Renewable thermal energy
NETWORKS
Electrification
Renewable power
production
Renewable heating
Electrification
Efficient energy use

10,000 new
customers
per year
29
The electricity network will have the capacity to handle the growth in population and the
increasing demand for power as a result of increased electrification
Network: A robust electricity network is the key to electrification

30
• Within Hafslund’s grid area, 168 main
transformers supply a total of 19 TWh
of renewable energy per year.
• Hafslund’s investments in upgrading the
network is approaching NOK 1 billion
per year to supply electricity to a
growing population and increasing
electrification.
The network supplies renewable
electricity, 100% emission-free, to Oslo,
Akershus and Østfold
The network is dimensioned to handle increased electrification
Hafslund has modernised and upgraded capacity throughout the grid area
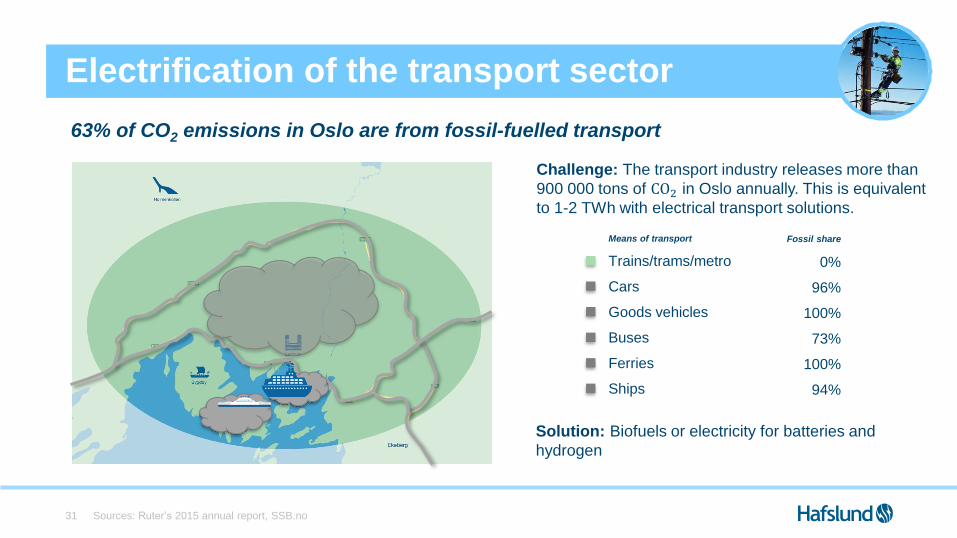
Sources: Ruter’s 2015 annual report, SSB.no 31
Fossil share
0%
96%
100%
73%
100%
94%
Electrification of the transport sector
63% of CO2 emissions in Oslo are from fossil-fuelled transport
Means of transport
Trains/trams/metro
Cars
Goods vehicles
Buses
Ferries
Ships
Solution: Biofuels or electricity for batteries and
hydrogen
Challenge: The transport industry releases more than
900 000 tons of CO2 in Oslo annually. This is equivalent
to 1-2 TWh with electrical transport solutions.

Digitalisation of the network will improve the quality of electricity supply and contribute to increased energy saving
AMS meters digitalise the network
32
700,000 meters provide 35 billion readings per year
Home
Power outage
Ground fault
Voltage
Consumption vs. production Substation
Power outage
Ground Fault
Voltage
Power out vs. in
Transformer station Operations center
Before AMS
With AMS
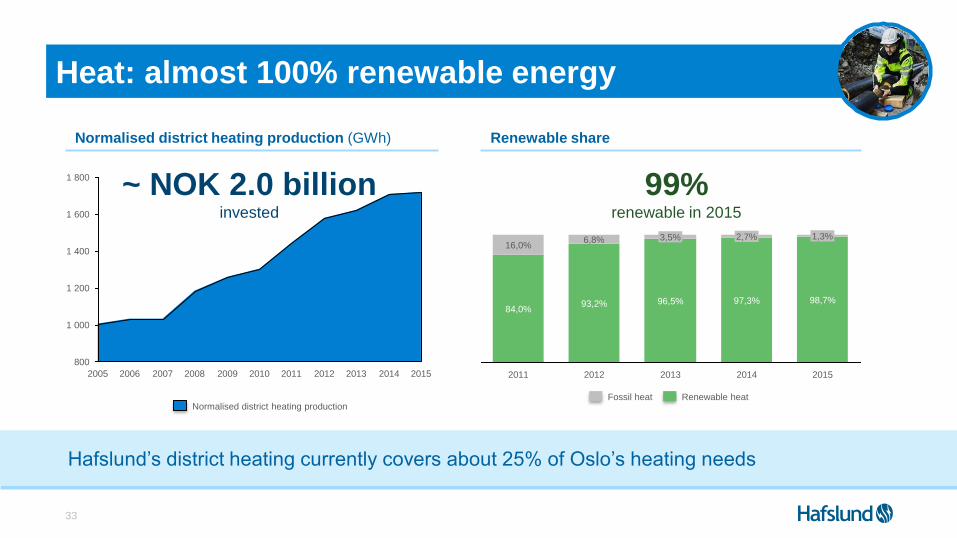
Hafslund’s district heating currently covers about 25% of Oslo’s heating needs
33
Heat: almost 100% renewable energy
800
1 000
1 800
1 400
1 600
1 200
20132012 20152011200920082006 2010 201420072005
Normalised district heating production
Renewable share
97,3%
3,5%6,8% 2,7% 1,3%
20142012 2013
93,2% 96,5% 98,7%
2011
16,0%
84,0%
2015
Fossil heat Renewable heat
Normalised district heating production (GWh)
99% renewable in 2015
~ NOK 2.0 billioninvested

34
Heating makes use of waste heat that is otherwise lost
Time in service by heating source – aiming for high share of renewable Opportunity: Heat-based ventilation cooling
Illustration: Munthers
• District heating is used to dry air, which is then
added to water molecules and cooled
• Increased utilisation of heat from waste
incineration, which would otherwise go to waste
during the summer
900
600
300
Installed
power
[MW]1,050
+2 °C
-10 °C
Price-
dependent use
Waste 161 MW
Bio-oil 259 MW
Wood pellets 56 MW
Natural gas 100 MW
Biodiesel 152 MW
Heat pumps 30 MW
Electricity 233 MW
Time in service [Hours/year]

20% of CO2 emissions relate to buildings
Sources: City of Oslo: Climate and energy strategy 201535
Renewable thermal energy replaces oil-fired heating
20% of CO2 emissions in Oslo are from fossil-fueled heating
+260 GWhnew district
heating
+240 GWhelectric heating
Challenge: 500 GWh fossil heating left in
Oslo, equivalent to roughly 270 000 tons of
CO2 emmisions.
Solution: Half can be replaced with
renewable district heating close to
Hafslund’s infrastructure, while the rest is
based on heat produced with electricity, e.g.
heat pumps

Hafslund supplies infrastructure to facilitate the
removal of fossil fuel use
36
Solutions from electrification:
- Electricity for chargers
- Electricity for hydrogen
stations
- Electricity for heating
- Electricity for heat pumps
- Shorepower to ships
Solutions from district heating:
- District heating for heating
- District heating for cooling
- District cooling

37
Production: Renewable run-of-river hydropower in Glomma
Grid area
Heat, Oslo
Power stations
Hafslund head
office
Kykkelsrud
Vamma
Sarpsborg power station area
River basin to
Hafslund’s power plant

38
New renewable energy under construction
Facts
Investment 920 MNOK
Installed capacity 128 MW
Production Vamma 12 1,000 GWh
Increased renewable production 230 GWh
Estimated completion spring 2019

39
Markets offer customer solutions for efficient energy use
20132007 2020+
Hafslund
Markets today
Big in the Nordic region
National leader
Regional player
Grønt Valg
(Green Choice)
Hafslund OnlineActive
environmental
option
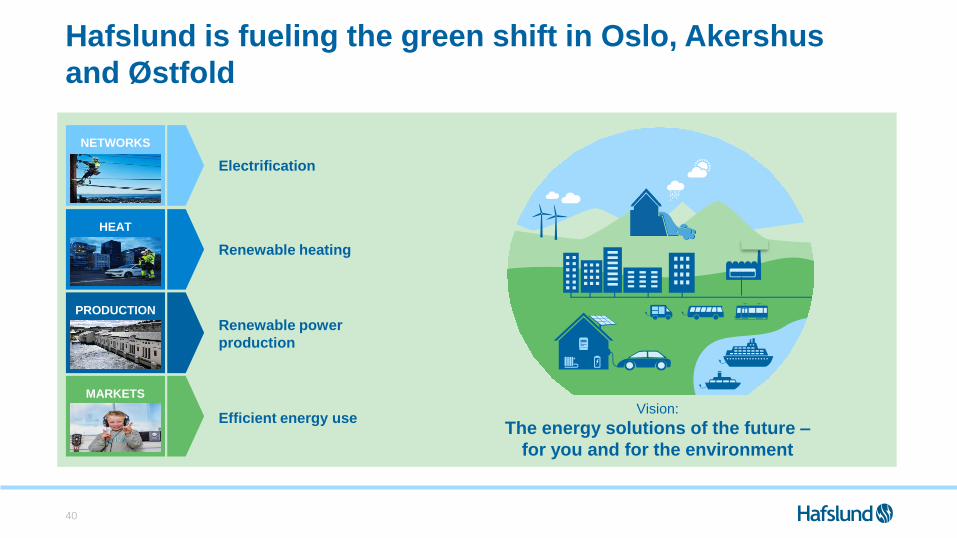
Hafslund is fueling the green shift in Oslo, Akershus
and Østfold
40
Vision:
The energy solutions of the future –
for you and for the environment
MARKETS
HEAT
PRODUCTION
Renewable energy
Renewable thermal energy
NETWORKS
Electrification
Renewable power
production
Renewable heating
Electrification
Efficient energy use

Agenda
41
1 Third quarter 2016 results
2 Hafslund’s role in the green shift
3 Appendix

Oslo price (NO1) historic and forward
Source: NordPool Spot, Nasdaq OMX
Prices per 30.09.201642
0.40
0.00
0.20
0.10
0.30
0.50
20192016 2020201520102009 2017 2018201420022000 2006200520031999 2001 2004
NOK/kWh
2007 2011 20122008 2013
Period averagePower price - Oslo price
0.21 NOK/kWh

Group profit and loss account
43
NOK million Q3 2016 Q3 2015 Ytd 2016 Ytd 2015
Operating revenue 2 580 2 158 422 9 581 8 545
Cost of energy (1 268) (836) (432) (5 310) (4 441)
Gross margin 1 312 1 322 (10) 4 271 4 104
Gain/loss financial items 28 19 9 107 78
Operating expenses (681) (678) (3) (2 054) (2 058)
EBITDA 659 663 (4) 2 324 2 124
Depreciation and write-downs (234) (236) 2 (688) (672)
Operating profit 425 427 (2) 1 636 1 452
Interest expences etc (72) (123) 51 (214) (300)
Market value change loan portfolio 30 44 (14) 57 105
Financial expenses (42) (79) 37 (157) (195)
Pre-tax profit 383 348 35 1 479 1 256
Tax (127) (111) (16) (460) (383)
Profit after tax 255 237 19 1 019 873
Earnings per share (EPS) in NOK 1,31 1,21 0,10 5,22 4,47
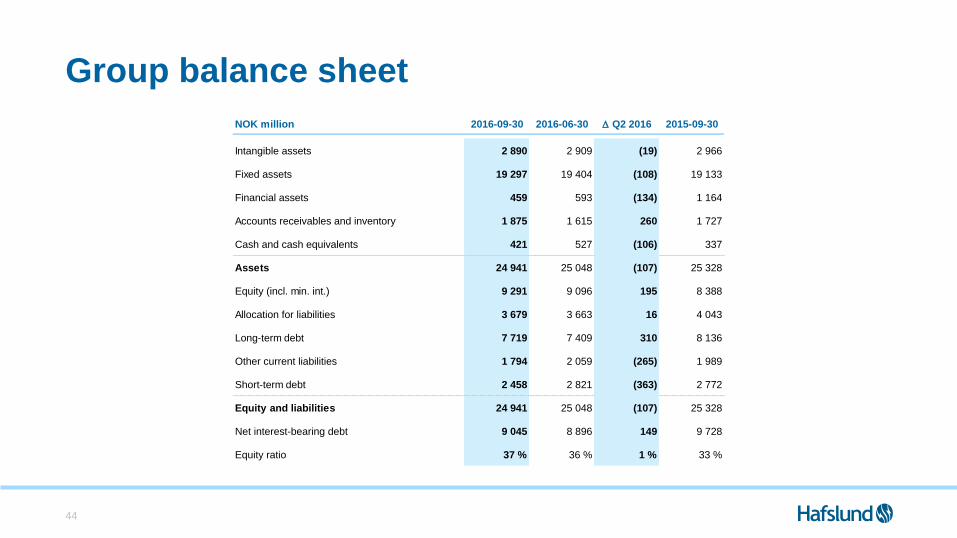
Group balance sheet
44
NOK million 2016-09-30 2016-06-30 Q2 2016 2015-09-30
Intangible assets 2 890 2 909 (19) 2 966
Fixed assets 19 297 19 404 (108) 19 133
Financial assets 459 593 (134) 1 164
Accounts receivables and inventory 1 875 1 615 260 1 727
Cash and cash equivalents 421 527 (106) 337
Assets 24 941 25 048 (107) 25 328
Equity (incl. min. int.) 9 291 9 096 195 8 388
Allocation for liabilities 3 679 3 663 16 4 043
Long-term debt 7 719 7 409 310 8 136
Other current liabilities 1 794 2 059 (265) 1 989
Short-term debt 2 458 2 821 (363) 2 772
Equity and liabilities 24 941 25 048 (107) 25 328
Net interest-bearing debt 9 045 8 896 149 9 728
Equity ratio 37 % 36 % 1 % 33 %

Group cash flow
45
NOK million Q3 2016 Q3 2015 Ytd 2016 Ytd 2015
EBITDA 659 663 (4) 2 324 2 124
Paid interests (49) (53) 4 (277) (331)
Paid tax 0 (29) 29 (362) (257)
Marketvalue changes and other liquidity adjustments (38) (40) 2 (99) (64)
Change in working capital, etc. (550) (140) (410) 314 606
Total cash flow from operations 22 401 (379) 1 900 2 078
Net operations and expansion investments (392) (296) (96) (942) (772)
Net purchase/sale of shares etc. 266 12 254 394 12
Cash flow from investments activities (126) (284) 158 (548) (760)
Cash flow to down payments and interests (104) 117 (221) 1 352 1 318
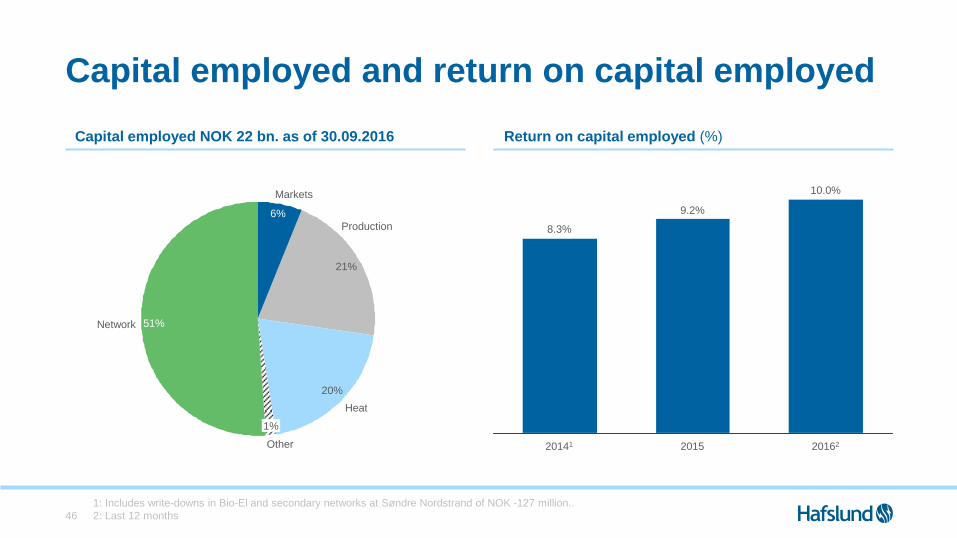
Capital employed and return on capital employed
1: Includes write-downs in Bio-El and secondary networks at Søndre Nordstrand of NOK -127 million..
2: Last 12 months46
20%
Markets
Production
21%
51%
1%
6%
Heat
Network
Other
8.3%
20141 2015 20162
9.2%
10.0%
Capital employed NOK 22 bn. as of 30.09.2016 Return on capital employed (%)

Loans – portfolio data
47
Debt maturity profileNOK million
Loans at maturity next 12 monthsNOK million
3 000
2 000
1 000
0
490
2020
972
470813
20232021
370
20222019
1 706
2018
1 189
2 010
2016
988
2017
350
2025
70
2024 2026+
Other loansBonds
800
0
600
400
200
500
700
600
488
Jul Aug SepNovOct MarFeb MayJan AprDec Jun
Other loansBonds
Q3 16 Q2 16
Bonds 73 % 76 % -3 %
Commercial paper 0 % 0 % 0 %
Other loans 27 % 24 % 3 %
NOK million Q3 16 Q2 16
Nominal value - market value of loans (160) (191) 32
Market value interest rate and fx derivatives* 33 30 3
Average interest incl. derivatives (%) 3.3 % 3.4 % -0.1 %
Loans at maturity next quarter 988 336 652
Unused drawdown facilities 3 717 3 800 (83)
*) incl. currency derivatives under hedge accounting
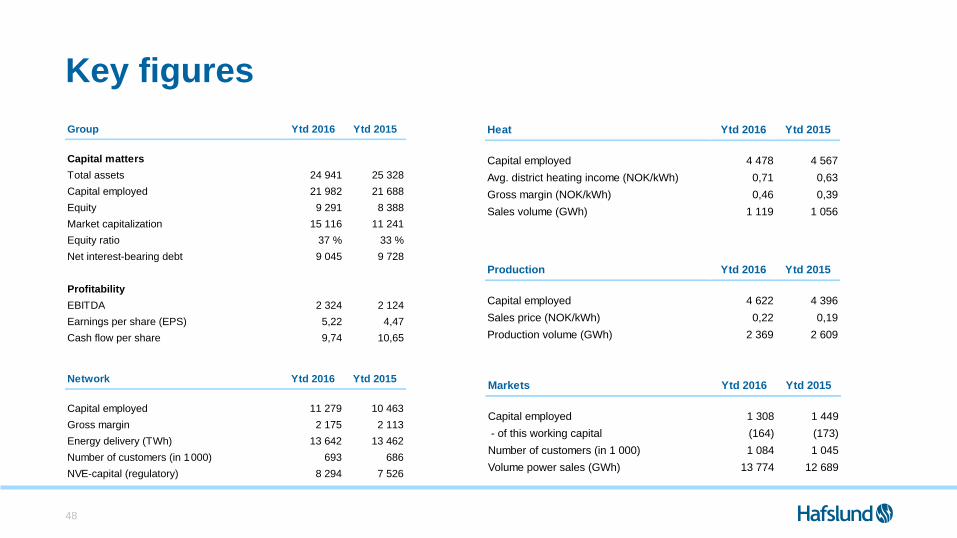
Key figures
48
Group Ytd 2016 Ytd 2015
Capital matters
Total assets 24 941 25 328
Capital employed 21 982 21 688
Equity 9 291 8 388
Market capitalization 15 116 11 241
Equity ratio 37 % 33 %
Net interest-bearing debt 9 045 9 728
Profitability
EBITDA 2 324 2 124
Earnings per share (EPS) 5,22 4,47
Cash flow per share 9,74 10,65
Production Ytd 2016 Ytd 2015
Capital employed 4 622 4 396
Sales price (NOK/kWh) 0,22 0,19
Production volume (GWh) 2 369 2 609
Heat Ytd 2016 Ytd 2015
Capital employed 4 478 4 567
Avg. district heating income (NOK/kWh) 0,71 0,63
Gross margin (NOK/kWh) 0,46 0,39
Sales volume (GWh) 1 119 1 056
Network Ytd 2016 Ytd 2015
Capital employed 11 279 10 463
Gross margin 2 175 2 113
Energy delivery (TWh) 13 642 13 462
Number of customers (in 1 000) 693 686
NVE-capital (regulatory) 8 294 7 526
Markets Ytd 2016 Ytd 2015
Capital employed 1 308 1 449
- of this working capital (164) (173)
Number of customers (in 1 000) 1 084 1 045
Volume power sales (GWh) 13 774 12 689
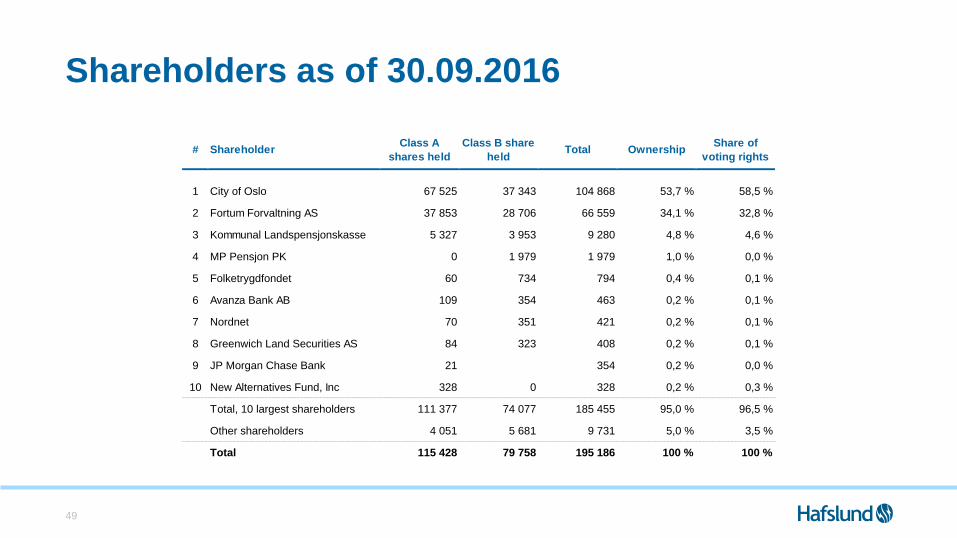
Shareholders as of 30.09.2016
49
# ShareholderClass A
shares held
Class B share
heldTotal Ownership
Share of
voting rights
1 City of Oslo 67 525 37 343 104 868 53,7 % 58,5 %
2 Fortum Forvaltning AS 37 853 28 706 66 559 34,1 % 32,8 %
3 Kommunal Landspensjonskasse 5 327 3 953 9 280 4,8 % 4,6 %
4 MP Pensjon PK 0 1 979 1 979 1,0 % 0,0 %
5 Folketrygdfondet 60 734 794 0,4 % 0,1 %
6 Avanza Bank AB 109 354 463 0,2 % 0,1 %
7 Nordnet 70 351 421 0,2 % 0,1 %
8 Greenwich Land Securities AS 84 323 408 0,2 % 0,1 %
9 JP Morgan Chase Bank 21 333 354 0,2 % 0,0 %
10 New Alternatives Fund, Inc 328 0 328 0,2 % 0,3 %
Total, 10 largest shareholders 111 377 74 077 185 455 95,0 % 96,5 %
Other shareholders 4 051 5 681 9 731 5,0 % 3,5 %
Total 115 428 79 758 195 186 100 % 100 %

Definitions
50
Group
Capital employed Equity + Net Interest-bearing debt + Net tax positions
Equity ratio (in %) (Equity incl. Minority interests / Total assets) X 100
Debt / EBITDA Net debt at the end of the quarter / EBITDA last 12 months
Earnings per share Profit after tax / Average no. of shares outstanding
Cash flow per share Net cash from operations / Average no. of shares
Return on capital employed last 12 months Operating profit last 12 months / Average capital employed last 12 months
Hedge ratio Hydro powerRatio of the estimated production portfolio hedged in the period (excluding fixed-price
contracts)
Hedge ratio District heatingRatio of the estimated net power price exposure hedged, by: Sales reduced with
electricity use and 1/3 heat pumps

Investor information
• Additional information is available from Hafslund’s website:
– www.hafslund.no
– You can subscribe to Hafslund press releases
• Group CFO, Heidi Ulmo
– Tel: + 47 909 19 325
• Head of Finance and Investor Relations, Martin S. Lundby
– Tel: +47 416 14 448
51


![Fiscal Year ending March 31, 2016 Third Quarter ... · Third Quarter Consolidated Financial Results ... owners of the company [yen] 53.32 58.97 (5.65) ‐9.6% ... 2016 Third Quarter](https://static.fdocuments.net/doc/165x107/5afee97b7f8b9a256b8dba3d/fiscal-year-ending-march-31-2016-third-quarter-quarter-consolidated-financial.jpg)