THIRD QUARTER 2015 - Wallenius Wilhelmsen Logistics ASA · but remained stable year over year and...
30
THIRD QUARTER 2015
-
Upload
vuongduong -
Category
Documents
-
view
215 -
download
1
Transcript of THIRD QUARTER 2015 - Wallenius Wilhelmsen Logistics ASA · but remained stable year over year and...
THIRD QUARTER 2015

Upcoming events 11 February Q4 2015 results and presentation13 May Q1 2016 results and presentation

Highlights for the third quarter
• Operating profit affected by a provisionof USD 200 million in connection withthe ongoing anti-trust investigations intwo of the group's joint ventures
• Drop in ocean transported volumes, bothautos and high and heavy equipment,partly seasonal
• Continued unfavourable trade- and cargomix
• Stable contribution from logisticssegment
• EUKOR renew Ocean Carrier Contractwith Hyundai Motor Group for a furtherfour years
• Unrealised loss on derivatives due tostrong USD and lower USD interest rates
Wilh. Wilhelmsen ASA group Q3 2015 Unaudited 3 of 30

WWASA group accountsTotal income and operating profit The total income for the Wilh. Wilhelmsen ASA group (WWASA) was USD 558 million, down 6% from second quarter 2015.
Operations in the third quarter was characterised by a decrease in group ocean-transported volumes, partly seasonal, leading to lower ocean profitability. The contribution from the logistics segment remained stable compared with the previous quarter.
WWASA made a provision of USD 200 million in connection with the anti-trust investigations in Wallenius Wilhelmsen Logistics (WWL) and EUKOR Car Carriers in the third quarter. The final outcome, however, is uncertain and processes will still take time. The operating loss therefore ended at USD 134 million.
Adjusted total income and operating profit Adjusted for the non-recurring items, the total income totalled USD 558 million and the operating profit USD 68 million in the third quarter compared with USD 596 million and USD 74 million respectively in the second quarter.
The shipping segment The total income from the shipping segment was USD 437 million, while the operating loss totalled USD 150 million. Less bunker compensation caused by lower bunker prices combined with pressure on freight rates explain the negative trend in total income seen over the last few quarters.
WWASA’s operating entities transported 18.1 million cubic metres (CBM) in the third quarter, a 7% decrease quarter on quarter due to seasonally lower demand for transportation of both cars and high and heavy volumes.
Net bunker costs were stable and had a marginal impact on operating profit.
Auto volumes and trades The group’s auto volumes decreased by 10% quarter on quarter, mainly driven by lower demand in North- and South America. Lower demand in China resulted in a drop in the Europe
Figure 1 Total income and EBIT (group)
Figure 2 Total income and EBIT (shipping)
Wilh. Wilhelmsen ASA group Q3 2015 Unaudited 4 of 30

to Asia trade. Volumes from Europe/North America to Oceania increased quarter on quarter, while the Atlantic trade volumes remained stable.
In key markets, auto sales decreased 7% from a strong second quarter. However, levels remained stable year over year. Sales in North America declined slightly from the strong second quarter with increased stock levels in the US. Annual sales volumes remained healthy. Chinese car sales declined compared with the last quarter. Sales in local brands developed slightly better than imported brands. Sales in Oceania were stable compared with the previous quarter, while sales in Western Europe decreased from the levels seen in the first half of the year.
Japanese exports were up 7% quarter on quarter but remained stable year over year and ended the quarter at 1 million units. Korea saw annual export figures stabilising at around 3 million units, in line with volumes reported the last few years. Production growth of Korean branded cars has mainly taken place outside Korea. Korean exports declined in the third quarter partly due to seasonality, down 0.6 million units, while levels were stable year over year.
High and heavy volumes and trades The group lifted 6% less high and heavy volumes compared with the second quarter, as the global demand for transportation of high and heavy cargo remained soft. WWL volumes from Asia to North America and in the Atlantic trade declined in the second quarter.
Global construction spending increased 2% quarter on quarter and 3% year over year. Improved housing market supported construction spending in North America. Output of construction in Europe remained challenging, though slightly better than the previous quarter. The Chinese construction market remained weak.
Request for mining equipment continued to be modest due to low commodity prices and few new mining investments.
Demand for agriculture machinery continued the declining trend in the third quarter, impacted by lower crop prices.
Shipping cargo mix With auto volumes decreasing more than high and heavy volumes, the group’s overall cargo mix improved, but the cargo composition in WWL continued to be suboptimal given the advanced fleet.
The logistics segment The total income for the logistics segment was USD 129 million, down 4%, and the operating profit of USD 18 million was on par with the previous quarter.
Contributions from both Hyundai Glovis and WWL were on par with the second quarter. As WWASA includes the net result of Hyundai Glovis one quarter in arrears, the contribution in the fourth quarter will drop substantially following reported negative currency effects in Hyundai Glovis’ third quarter.
WWASA’s shareholding in Hyundai Glovis was valued at USD 853 million on 30 September 2015.
Figure 3 Total income and EBIT (logistics segment)
Wilh. Wilhelmsen ASA group Q3 2015 Unaudited 5 of 30

Financial items Net financial expense in the third quarter amounted to USD 73 million compared to a net financial income of USD 4 million in the previous quarter. The reduction was mainly caused by unrealised losses on financial derivatives used for hedging purposes due to a stronger USD and lower USD interest rates.
Net interest expenses totalled USD 22 million, slightly lower than the second quarter.
At the end of the third quarter, the investment portfolio amounted to USD 246 million, including fixed income assets and shares. The portfolio generated a negative return caused by increased spreads in the European bond market and volatility in the equity market.
Negatively impacted by changes in medium to long-term USD interest rates, WWASA recorded an unrealised loss of USD 15 million on interest rate derivatives compared with an unrealised gain of USD 19 million in the second quarter.
During the quarter, the USD appreciated towards EUR and NOK. Net currency items for the quarter amounted to a loss of USD 15 million. Losses, mainly unrealised, incurred on hedging contracts, while gains were related to revaluation on non-USD liabilities. Revaluation losses on non-USD assets, mainly financial assets, partly offset the losses.
In connection with the termination of three tax leases, the group paid a termination fee of USD 9 million for the deferred tax inherent in the leases.
Tax The group recorded a tax expense of USD 5 million for the quarter, down from USD 7 million in second quarter, positively impacted by a stronger USD/NOK. The group recorded a tax charge of approximately USD 15 million related to increased withholding tax imposed on dividends received from EUKOR for the period 2010 to 2015. The company will appeal the decision to the National Tax Tribunal in Korea.
Net profit Net loss after tax and minority interest amounted to USD 213 million, mainly caused by non-recurring items and the development in net financial items.
Earnings per share were negative USD 0.97 for the third quarter, down from positive USD 0.32 in the second quarter.
Capital and financing Cash and cash equivalents including the investment portfolio were down from the second quarter, totalling USD 378 million (USD 669 million when including the group’s share of cash and cash equivalents in the joint ventures).
WWASA’s equity decreased from the previous quarter by USD 218 million to USD 1 588 million, representing an equity ratio of 48% based on book values for WWASA’s own account.
The group’s gross interest bearing debt amounted to USD 1 358 million (USD 2 078 million when including share of interest-bearing debt in joint ventures) at the end of the quarter, equivalent to a decrease of 4% quarter on quarter.
WWASA has secured financing for the two newbuildings to be delivered first half 2016.
The company has a dialogue with all main financial institutions and has received covenant waivers related to the provision in the third quarter.
Dividend WWASA’s board of directors have, based on an authorisation granted by the annual general meeting on 23 April 2015, resolved to pay a second dividend of NOK 0.50 per share, totalling USD 13 million. The low dividend payment reflects weaker earnings in the operating companies and the exposure the company has caused by the anti-trust investigation in WWL and EUKOR. The share trades ex dividend on Thursday 12 November. The company expects to pay dividend on or about 26 November.
Wilh. Wilhelmsen ASA group Q3 2015 Unaudited 6 of 30

Tonnage update Current fleetAt the end of the third quarter, group companies had a lifting capacity of 897 000 CEUs, slightly down quarter on quarter. With a net decrease of one vessel compared with the second quarter, the group controlled 139 vessels by the end of the third quarter equal to a 22% share of the global car carrying capacity. The global fleet totalled 758 vessels (4 million CEUs) at the end of September, a net increase of two vessels compared with the previous quarter.
Ensuring an optimal fleet given current and future transportation needs is key for WWASA. The current group fleet has the potential to cater for increased demand for shipment of both cars, high and heavy and break bulk cargoes.
Newbuildings With no newbuildings delivered during the quarter, the group’s newbuilding programme includes eight vessels (63 300 CEUs) to be delivered in 2016-17. Two of the vessels are for WWASA’s account. The group’s newbuilding programme equalled 11% of the world car carrier orderbook measured in CEUs.
Several new orders were placed in the quarter and the world orderbook counted 83 vessels (562 000 CEUs) or 14% of the total world fleet measured in CEUs. The group did not place any new orders in the third quarter.
Redeliveries No vessels were redelivered to external owners
during the quarter. The group has the flexibility to redeliver nine vessels the next 12 months.
Recycling Two vessels in the global fleet were sold for recycling in the third quarter, none for WWASA’s or the group’s account.
Company Fleet by end of Q3 Newbuilding programme by end of Q3 Yard WWL 52 vessels, 357 000 CEUs,
(57 vessels, 392 000 CEUs) Two pure car and truck carriers Post Panamax design (16 000 CEUs) for WWASA's account. Four pure car and truck carriers Post Panamax design (32 000 CEUs) not for WWASA's account.
Hyundai Samho
Xingang EUKOR 82 vessels, 509 000 CEUs
(84 vessels, 513 000 CEUs) Two pure car and truck carriers Post Panamax design (15 300 CEUs).
Hyundai Samho
ARC Five vessels, 29 000 CEUs (Five vessels, 29 000 CEUs)
Group fleet capacity Q2 140 Chartered out -1
Group fleet capacity Q3 139
Figure 6 Group operated fleet and newbuilding programme
0
5 000
10 000
15 000
20 000
25 000
0
100 000
200 000
300 000
400 000
500 000
600 000
700 000
800 000
900 000
1 000 000
Q1 Q3 Q1 Q3 Q1 Q3 Q1 Q3 Q1 Q3 Q1 Q3
2010 2011 2012 2013 2014 2015
Group Fleet Development [CEU's - Left scale]
Group Lifted volumes [CBM's - Rigth scale]
Figure 5 Group fleet capacity vs group lifted volumes
8633
20
Q3 2015(139 vessels) Owned
Long Term (> 5 years)Short Term (1-5 years)
Of 139 vessels, 29 vessels are owned by
Figure 4 Current fleet
Wilh. Wilhelmsen ASA group Q3 2015 Unaudited 7 of 30

Health, safety, environment and quality1
Fuel consumption and CO2 emissions For the third quarter, the 29 WWASA owned vessels consumed 55.9* thousand tonnes fuel and carried out 3.4* million tonne miles2 of transport work. This was equal to 16.3* gram fuel consumed per cargo tonne miles down from 16.6 gram quarter on quarter. Reduced speed and more efficient tonnage improved the transport efficiency indicator.
The emitted CO2 corresponded to 47.3* gram per cargo tonnes-miles3, down from 48.6 quarter on quarter.
Operational excellence There were no environmental incidents in the third quarter, with average off-hire per vessel below set target.
The fleet had 27 port state controls, same amount as in the second quarter. No vessels were detained, and the deficiency rate indicated that the fleet was managed according to the group’s high standards.
Lost time injury frequency (LTIF) The group’s controlled vessels recorded a LTIF ratio of 0.60 for the third quarter, on par with previous quarter and above the group’s target of zero4.
1 HSEQ reporting is based on vessels owned and controlled by WWASA. 2 Measures number of tonnes by distance transported. For sea voyage reports at noon. 3 The International Maritime Organisation measures energy efficiency as grams of CO2 per tonne nautical mile. 4 Lost time injury frequency is measured as an injury, which results in an employee being unable to return to work for a scheduled work shift on the day following the injury. Measured as injury per million working hours. * One vessel excluded due to technical server issues.
Wilh. Wilhelmsen ASA group Q3 2015 Unaudited 8 of 30

Other issuesUpdate on the anti-trust investigation The authorities in Japan (2013) and South Africa (2015) have fined WWL for anti-trust behaviour. WWL and EUKOR continue to be part of anti-trust investigations of the car carrying industry in several jurisdictions, of which the EU and US are among the bigger jurisdictions. As some of the processes are confidential, WWASA is not in a position to comment on the ongoing investigations within the respective jurisdictions. The processes are expected to continue
to take time, but further clarifications within some jurisdictions are expected during the fourth quarter 2015 and 2016.
WWASA has in the third quarter accounts made a provision of USD 200 million representing the estimated exposure in WWL and EUKOR. The final outcome, however, is uncertain and processes will still take time.
Events after the balance sheet day EUKOR has agreed with Hyundai Motor Group to carry Hyundai/KIA vehicle exports from Korea for a further four years. The new period commences January 2016 and ends 31 December 2019. The volume portion will decline from 50% in the first two years to 40% the remaining two years. Details of the contract are still be to be finalised.
In 2014, EUKOR transported approximately 4.6 million CEUs of which 1.7 million where on behalf of Hyundai and Kia.
The agreement confirms EUKOR’s strong position in Korea and is a proof of quality delivered under the existing contract. Being strategically important for the company’s profitability going forward, the agreement builds on EUKOR’s ambitions to be a global provider of quality car carrying services for a diversified customer base.
ProspectsMarket outlook Light vehicle sales decreased 7% quarter on quarter, ending on 16.3 million units. In mature markets sales are expected to drop due to lower expected sales in North America towards the end of the year. In BRIC countries, high growth is expected in China and India, however cars are mainly produced locally in those countries. In 2016 modest growth is expected for global car sales.
The global growth in construction spending has flattened out, especially in North America, while Europe shows a positive sentiment. In 2016, global construction spending is expected to grow modestly.
Declining crop prices and reduced sales of especially larger equipment is expected to continue to limit demand for transportation of agriculture units.
Demand for mining equipment is estimated to be low following weak commodity price indices for precious metals and limited investments in new projects.
Business outlook The shipping activities in WWASA are expected to remain challenging, with added pressure on margins.
Logistics activities are expected to be on par with the 2015 levels.
The board will ensure a continuous focus on operational efficiency and cost-reducing initiatives.
Lysaker, 10 November 2015 The board of directors of Wilh. Wilhelmsen ASA
Forward-looking statements presented in this report are based on various assumptions. The assumptions were reasonable when made, but are inherently subject to uncertainties and contingencies that are difficult or impossible to predict. WWASA cannot give assurances that expectations regarding the outlook will be achieved or accomplished.
Wilh. Wilhelmsen ASA group Q3 2015 Unaudited 9 of 30

Joint ventures based on proportionate method
USD mill
Q3 Q3Full
year Q3 Q3Full
year Q3 Q3Full
year Q3 Q3Full
year Q3 Q3Full
year
QUARTER 2015 2014 2014 2015 2014 2014 2015 2014 2014 2015 2014 2014 2015 2014 2014
Operating revenue 437 508 2 042 117 116 503 1 1 6 (9) (6) (25) 546 619 2 525
Other incomeShare of profit/(loss) from associates 3 9 11 27 57 12 30 66
Gain on sale of assets
Total income 437 512 2 051 129 143 560 1 1 6 (9) (6) (25) 558 650 2 592
Operating expenses
Voyage expenses (209) (268) (1 080) 7 5 19 (202) (264) (1 061)
Vessel expenses (23) (21) (82) (23) (21) (82)
Charter expenses (76) (83) (329) (76) (83) (329)
Employee benefits (30) (35) (159) (9) (11) (38) (2) (3) (40) (49) (197)
Other expenses (209) (20) (77) (101) (103) (431) (2) (1) (7) 1 1 6 (310) (123) (510)
Depreciation and impairment (39) (36) (147) (1) (7) (12) (41) (44) (160)
Total operating expenses (587) (464) (1 875) (111) (121) (482) (4) (4) (7) 9 6 25 (692) (584) (2 339)
Operating profit/(loss) (EBIT) 2 (150) 47 176 18 22 79 (2) (3) (1) (0) (0) (0) (134) 66 253
Financial income/(expenses) (41) (5) (75) (2) (1) (29) (4) (55) (73) (9) (131)
Profit/(loss) before tax (191) 42 101 15 21 77 (31) (6) (56) (0) (0) (0) (207) 57 122
Tax income/(expense) (12) (4) 23 (2) (9) 9 2 32 (5) (3) 46
Profit/(loss) (203) 38 125 13 21 68 (22) (5) (25) (0) (0) (0) (212) 55 168
Of which minority interest (1) (2) (1) (2)
Profit/(loss) after minority interest (203) 38 125 13 21 66 (22) (5) (25) (0) (0) (0) (213) 54 166
As a result of rounding adjustments, the figures in one or more columns may not add up to the total of that column.
> Logistics: Q1 - WWASA sold 187 500 shares in Hyundai Glovis. The net gain recorded in the group’s accounts amounted to USD 26 million.
> Shipping: Q2 - No material gain/(loss)
> Shipping: Q3 - Impairment loss vessel for recycling USD 2.5 million.
> Shipping: Q1 - No material gain/(loss)
> Shipping: Q2 - No material gain/(loss)
> Logistics: Q3 - Impairment loss ASL USD 5.5 million.
> Shipping: Q4 - Impairment loss vessel for recycling USD 3.5 million.
1 The report is based on the proportionate method for all joint ventures.
2 Cash settled portion of bunker hedge swaps is included in net operating profit by reduction/(increase) of voyage related expenses.
2015: Material gain/(loss) from disposal of assets and impairment charges
The equity method provides a fair presentation of the group’s financial position but the group’s internal financial reporting is based on the proportionate method. The major contributors in the shipping and logistics segments are joint ventures and hence the proportionate method gives the chief operating decision-maker a higher level of information and a better picture of the group’s operations.
2014: Material gain/(loss) from disposal of assets and impairment charges
Income statement - segment reporting 1
TotalShipping Logistics Holding Eliminations
Wilh. Wilhelmsen ASA group Q3 2015 Unaudited 10 of 30

Joint ventures based on proportionate method
USD mill
YTD YTDFull
year YTD YTDFull
year YTD YTDFull
year YTD YTDFull year YTD YTD
Full year
Year to date 2015 2014 2014 2015 2014 2014 2015 2014 2014 2015 2014 2014 2015 2014 2014
Operating revenue 1 362 1 541 2 042 361 386 503 4 4 6 (25) (20) (25) 1 702 1 912 2 525
Other incomeShare of profit/(loss) from associates 5 8 9 30 48 57 35 56 66
Gain on sale of assets 26 26
Total income 1 367 1 549 2 051 417 435 560 4 4 6 (25) (20) (25) 1 763 1 968 2 592
Operating expenses
Voyage expenses (655) (822) (1 080) 21 16 19 (634) (807) (1 061)
Vessel expenses (67) (63) (82) (67) (63) (82)
Charter expenses (239) (247) (329) (239) (247) (329)
Employee benefits (92) (131) (159) (26) (31) (38) (6) (8) (124) (171) (197)
Other expenses (233) (56) (77) (310) (328) (431) (5) (5) (7) 4 4 6 (544) (385) (510)
Depreciation and impairment (113) (108) (147) (5) (11) (12) (118) (118) (160)
Total operating expenses (1 400) (1 428) (1 875) (342) (370) (482) (10) (13) (7) 25 20 25 (1 727) (1 791) (2 339)
Operating profit/(loss) (EBIT) 2 (33) 121 176 76 64 79 (7) (9) (1) 0 (0) (0) 36 177 253
Financial income/(expenses) (65) (33) (75) (5) (1) (1) (45) (21) (55) (115) (56) (131)
Profit/(loss) before tax (98) 88 101 71 64 77 (51) (30) (56) 0 (0) (0) (78) 121 122
Tax income/(expense) (14) (10) 23 (6) (7) (9) 13 8 32 (7) (9) 46
Profit/(loss) (112) 78 125 64 57 68 (38) (23) (25) 0 (0) (0) (85) 112 168
Of which minority interest (1) (2) (2) (1) (2) (2)Profit/(loss) after minority interest (112) 78 125 63 55 66 (38) (23) (25) 0 (0) (0) (86) 111 166
> Logistics: Q1 - WWASA sold 0.5% shareholding in Hyundai Glovis. The net gain recorded in the group’s accounts amounted to USD 26 million. > Shipping: Q2 - No material gain/(loss)> Shipping: Q3 - Impairment loss vessel for recycling USD 2.5 million.
> Shipping: Q1 - No material gain/(loss)
> Shipping: Q2 - No material gain/(loss)
> Logistics: Q3 - Impairment loss ASL USD 5.5 million.
> Shipping: Q4 - Impairment loss vessel for recycling USD 3.5 million.
2015: Material gain/(loss) from disposal of assets and impairment charges
2014: Material gain/(loss) from disposal of assets and impairment charges
1/2 Comments - see previous page
Income statement - segment reporting 1
Shipping Logistics Holding Eliminations Total
Wilh. Wilhelmsen ASA group Q3 2015 Unaudited 11 of 30

Joint ventures based on proportionate method
USD mill
Q4 Q1 Q2 Q3 Q4 Q1 Q2 Q3 Q4 Q1 Q2 Q3 Q4 Q1 Q2 Q3
QUARTER 2014 2015 2015 2015 2014 2015 2015 2015 2014 2015 2015 2015 2014 2015 2015 2015
Operating revenue 500 458 467 437 117 121 123 117 1 1 1 1 613 573 583 546
Other incomeShare of profit/(loss) from associates 1 2 3 9 7 11 11 10 9 14 12
Gain on sale of assets 26 26
Total income 502 460 470 437 126 155 134 129 1 1 1 1 624 609 596 558
Operating expenses
Voyage expenses (258) (221) (224) (209) (255) (215) (217) (202)
Vessel expenses (19) (23) (22) (23) (19) (23) (22) (23)
Charter expenses (82) (79) (84) (76) (82) (79) (84) (76)
Employee benefits (27) (31) (31) (30) (7) (9) (9) (9) 8 (1) (2) (2) (26) (41) (42) (40)
Other expenses (21) (11) (13) (209) (103) (104) (106) (101) (2) (1) (1) (2) (124) (115) (119) (310)
Depreciation and impairment (40) (36) (38) (39) (2) (2) (2) (1) (41) (38) (40) (41)
Total operating expenses (447) (401) (412) (587) (111) (115) (116) (111) 6 (3) (4) (4) (547) (511) (523) (692)
Operating profit/(loss) (EBIT) 2 55 59 58 (150) 14 40 18 18 8 (2) (2) (2) 76 98 73 (134)
Financial income/(expenses) (41) (14) (10) (41) (1) (1) (1) (2) (34) (31) 15 (29) (75) (46) 4 (73)
Profit/(loss) before tax 13 46 48 (191) 14 39 17 15 (26) (33) 13 (31) 1 52 77 (207)
Tax income/(expense) 33 (2) (12) (3) (2) (2) (2) 24 9 (5) 9 55 5 (7) (5)
Profit/(loss) 47 44 48 (203) 11 37 14 13 (2) (24) 8 (22) 56 57 70 (212)
Of which minority interest
Profit/(loss) after minority interest 47 44 48 (203) 11 37 14 13 (2) (24) 8 (22) 55 56 70 (213)
Income statement - segment reporting 1
Total incl eliminationShipping Logistics Holding
1/2 Comments - see previous page
Wilh. Wilhelmsen ASA group Q3 2015 Unaudited 12 of 30
Joint ventures based on proportionate method
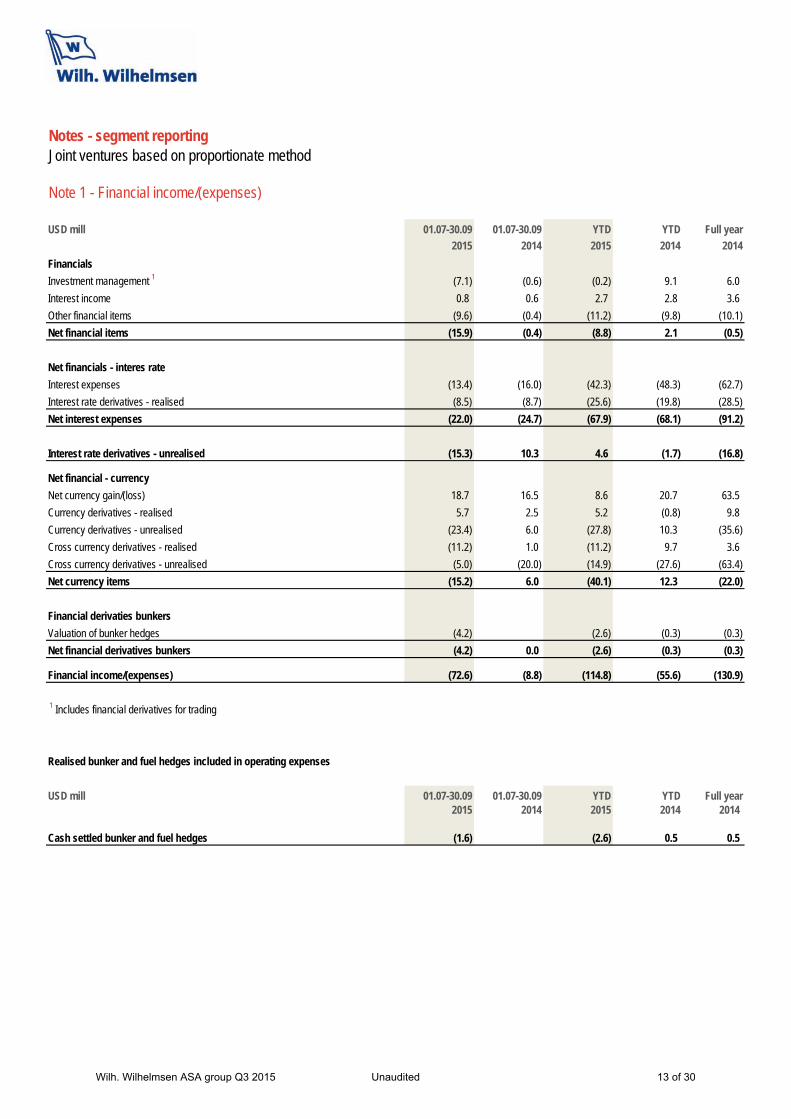
Note 1 - Financial income/(expenses)
USD mill 01.07-30.09 01.07-30.09 YTD YTD Full year
2015 2014 2015 2014 2014
Financials
Investment management 1 (7.1) (0.6) (0.2) 9.1 6.0
Interest income 0.8 0.6 2.7 2.8 3.6
Other financial items (9.6) (0.4) (11.2) (9.8) (10.1)
Net financial items (15.9) (0.4) (8.8) 2.1 (0.5)
Net financials - interes rate
Interest expenses (13.4) (16.0) (42.3) (48.3) (62.7)
Interest rate derivatives - realised (8.5) (8.7) (25.6) (19.8) (28.5)
Net interest expenses (22.0) (24.7) (67.9) (68.1) (91.2)
Interest rate derivatives - unrealised (15.3) 10.3 4.6 (1.7) (16.8)
Net financial - currency
Net currency gain/(loss) 18.7 16.5 8.6 20.7 63.5
Currency derivatives - realised 5.7 2.5 5.2 (0.8) 9.8
Currency derivatives - unrealised (23.4) 6.0 (27.8) 10.3 (35.6)
Cross currency derivatives - realised (11.2) 1.0 (11.2) 9.7 3.6
Cross currency derivatives - unrealised (5.0) (20.0) (14.9) (27.6) (63.4)
Net currency items (15.2) 6.0 (40.1) 12.3 (22.0)
Financial derivaties bunkers
Valuation of bunker hedges (4.2) (2.6) (0.3) (0.3)
Net financial derivatives bunkers (4.2) 0.0 (2.6) (0.3) (0.3)
Financial income/(expenses) (72.6) (8.8) (114.8) (55.6) (130.9)
1 Includes financial derivatives for trading
Realised bunker and fuel hedges included in operating expenses
USD mill 01.07-30.09 01.07-30.09 YTD YTD Full year2015 2014 2015 2014 2014
Cash settled bunker and fuel hedges (1.6) (2.6) 0.5 0.5
Notes - segment reporting
Wilh. Wilhelmsen ASA group Q3 2015 Unaudited 13 of 30

THIRD QUARTER 2015
Wilh. Wilhelmsen ASA group Q3 2015 Unaudited 14 of 30

Report for the third quarter of 2015, comments based on equity method
• Operating profit affected by a provisionof USD 200 million in connection withthe ongoing anti-trust investigations intwo of the group's joint ventures
• Drop in ocean transported volumes, bothautos and high and heavy equipment,partly seasonal
• Continued unfavourable trade- and cargomix
• Stable contribution from logisticssegment
• EUKOR renew Ocean Carrier Contractwith Hyundai Motor Group for a furtherfour years
• Unrealised loss on derivatives due tostrong USD and lower USD interest rates
WWASA group accounts The market for transportation of auto and high and heavy volumes continued to be challenging. The third quarter was characterised by a decrease in ocean transportation volumes, partly seasonal, and stable underlying contributon from the logistics segment.
WWASA made a provision of USD 200 million in connection with the anti-trust investigations in Wallenius Wilhelmsen Logistics (WWL) and EUKOR Car Carriers in the third quarter. The final outcome is uncertain and processes will still take time. This lead to an operating loss of USD 147 million based on a negative total income of 95 million, down from profit of USD 65 million and profit of USD 119 million respectively in the second quarter.
The group recorded a tax expense of USD 2 million for the quarter, down from USD 4 million in second quarter, positively impacted by a stronger USD/NOK. The group further recorded a tax charge of approximately USD 15 million related to increased withholding tax imposed on dividends received from EUKOR for the period 2010 to 2015. The company will appeal the decision to the National Tax Tribunal in Korea.
The net loss after tax ended at USD 213 million, mainly caused by the non-recurring items and the development in net financial items. For 2015, year to date, the group recorded a tax income of USD 1 million, still leading to a net loss of USD 86 million (profit of USD 111 million for the same period last year).
Financial items Financial expenses for the quarter amounted to USD 64 million, substantially down from an income of USD 9 million, negatively impacted by unrealised losses on interest rate- and currency derivatives in the third quarter, caused by a stronger USD and lower long-term USD interest rates.
Year to date, the financial expense totalled USD 90 million, down from an expense of USD 41 million for the same period last year.
Net interest expenses in the third quarter totalled USD 16 million, on par with the second quarter. Year to date 2015 and 2014 net interest expenses amounted to approximately USD 51 million and USD 53 million respectively.
Wilh. Wilhelmsen ASA group Q3 2015 Unaudited 15 of 30

Net currency items for the quarter amounted to a loss of USD 12 million against an income of USD 10 million in the previous quarter. Year to date 2015 and 2014, the similar figures were loss of USD 32 million and gain of USD 13 million respectively.
WWASA has secured financing for the two newbuildings to be delivered first half 2016.
The company has a dialogue with all main financial institutions and has received covenant waivers related to the provision in the third quarter.
Dividend WWASA’s board of directors have, based on an authorisation granted by the annual general meeting on 23 April 2015, resolved to pay a second dividend of NOK 0.50 per share, totalling USD 13 million. The low dividend payment reflects weaker earnings in the operating companies and the exposure the company has caused by the anti-trust investigation in WWL and EUKOR. The share trades ex dividend on Thursday 12 November. The company expects to pay dividend on or about 26 November.
Update on the anti-trust investigation The authorities in Japan (2013) and South Africa (2015) have fined WWL for anti-trust behaviour. WWL and EUKOR continue to be part of anti-trust investigations of the car carrying industry in several jurisdictions, of which the EU and US are among the bigger jurisdictions. As some of the processes are confidential, WWASA is not in a position to comment on the ongoing investigations within the respective jurisdictions. The processes are expected to continue to take time, but further clarifications within some jurisdictions are expected during the fourth quarter 2015 and 2016.
WWASA has in the third quarter accounts made a provision of USD 200 million representing the exposure in WWL and EUKOR. The final outcome, however, is uncertain and processes will still take time.
Events after the balance sheet date EUKOR has agreed with Hyundai Motor Group to carry Hyundai/KIA vehicle exports from Korea for a further four years. The new period commences January 2016 and ends 31 December 2019. The volume portion will decline from 50% in the first two years to 40% the remaining two years. Details of the contract are still be to be finalised.
In 2014, EUKOR transported approximately 4.6 million CEUs of which 1.7 million where on behalf of Hyundai and Kia.
The agreement confirms EUKOR’s strong position in Korea and is a proof of quality delivered under the existing contract. Being strategically important for the company’s profitability going forward, the agreement builds on EUKOR’s ambitions to be a global provider of quality car carrying services for a diversified customer base.
Market outlook Light vehicle sales decreased 7% quarter on quarter, ending on 16.3 million units. In mature markets sales are expected to drop due to lower expected sales in North America towards the end of the year. In BRIC countries, high growth is expected in China and India, however cars are mainly produced locally in those countries. In 2016 modest growth is expected for global car sales.
The global growth in construction spending has flattened out, especially in North America, while Europe shows a positive sentiment. In 2016, global construction spending is expected to grow modestly.
Declining crop prices and reduced sales of especially larger equipment is expected to continue to limit demand for transportation of agriculture units.
Demand for mining equipment is estimated to be low following weak commodity price indices for precious metals and limited investments in new projects.
Wilh. Wilhelmsen ASA group Q3 2015 Unaudited 16 of 30

Business outlook The shipping activities in WWASA are expected to remain challenging, with added pressure on margins.
Logistics activities are expected to be on par with the 2015 levels.
The board will ensure a continuous focus on operational efficiency and cost-reducing initiatives.
Lysaker, 10 November 2015 The board of directors of Wilh. Wilhelmsen ASA
Forward-looking statements presented in this report are based on various assumptions. The assumptions were reasonable when made, but are inherently subject to uncertainties and contingencies that are difficult or impossible to predict. WWASA cannot give assurances
that expectations regarding the outlook will be achieved or accomplished.
Wilh. Wilhelmsen ASA group Q3 2015 Unaudited 17 of 30

Income statement - financial reportJoint ventures based on equity method
USD mill Notes 01.07-30.09 01.07-30.09 YTD YTD Full year
2015 2014 2015 2014 2014
Operating revenue 77 71 231 210 285
Other income
Share of profit/(loss) from joint ventures and associates (172) 46 (98) 123 152
Gain on sale of assets 2 26
Total income (95) 117 160 333 437
Operating expenses
Vessel expenses (11) (11) (34) (36) (47)
Charter expenses (6) (6) (16) (17) (23)
Employee benefits (13) (16) (39) (60) (63)
Other expenses (3) (3) (8) (10) (13)
Depreciation and impairment 4 (20) (19) (60) (57) (80)
Total operating expenses (52) (56) (157) (181) (225)
Operating profit/(loss) (EBIT) (147) 61 2 152 211
Financial income/(expenses) 5 (64) (5) (90) (41) (108)
Profit/(loss) before tax (211) 56 (88) 110 104
Tax income/(expense) (2) (2) 1 62
Profit/(loss) for the period attributable to the owners of the parent (213) 54 (86) 111 166
Basic and diluted earnings per share (USD)* (0.97) 0.25 (0.39) 0.50 0.75
* EPS is calculated based on 220 000 000 shares.
Statement of comprehensive income - financial reportJoint ventures based on equity method
USD mill Notes 01.07-30.09 01.07-30.09 YTD YTD Full year2015 2014 2015 2014 2014
Profit/(loss) for the period (213) 54 (86) 111 166
Other comprehensive income
Items that will be reclassified to income statement
Reclassification of revaluation of previously held interest in Norwegian Car Carriers ASA 0 5 5
Cash flow hedges in joint venture, net of tax (4) (1) (3)
Currency translation differences in joint venture (2) (3) (4) (3) (5)
Items that will not be reclassified to income statement
Remeasurement postemployment benefits, net of tax (19)
Other comprehensive income, net of tax (6) (3) (6) 2 (22)
Total comprehensive income attributable to owners of the parent (218) 51 (92) 113 144
The above consolidated income statement and comprehensive income should be read in conjunction with the accompanying notes.
Wilh. Wilhelmsen ASA group Q3 2015 Unaudited 18 of 30

Balance sheet - financial reportJoint ventures based on equity method
USD mill Notes 30.09.2015 30.09.2014 31.12.2014
Non current assets
Deferred tax assets 38 25
Goodwill and other intangible assets 4 6 6 6
Investments in vessels and other tangible assets 4 1 844 1 777 1 760
Investments in joint ventures and associates 1 011 1 204 1 164
Other non current assets 1 1
Total non current assets 2 900 2 988 2 955
Current assets
Current financial investments 246 246 235
Other current assets 24 54 23
Cash and cash equivalents 132 219 140
Total current assets 402 520 398
Total assets 3 302 3 507 3 353
Equity
Share capital 7 30 30 30
Retained earnings and other reserves 1 557 1 679 1 677
Total equity attributable to owners of the parent 1 588 1 709 1 707
Non current liabilities
Pension liabilities 48 56 56
Deferred tax liabilities 40
Non current interest-bearing debt 9 1 239 1 309 1 236
Other non current liabilities 227 131 208
Total non current liabilites 1 513 1 536 1 500
Current liabilities
Current income tax liabilities 15 2
Public duties payable 1 1
Other current liabilities 185 259 145
Total current liabilities 201 262 145
Total equity and liabilities 3 302 3 507 3 353
The above consolidated balance sheet should be read in conjunction with the accompanying notes.
Wilh. Wilhelmsen ASA group Q3 2015 Unaudited 19 of 30
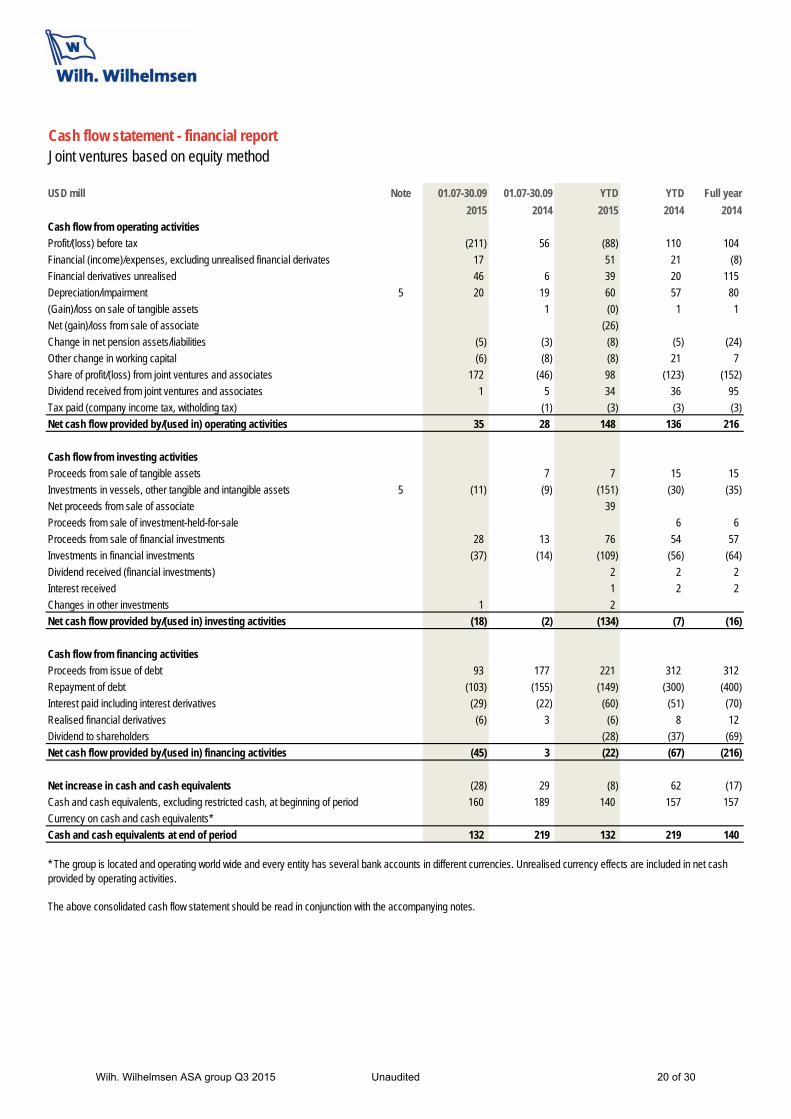
Cash flow statement - financial reportJoint ventures based on equity method
USD mill Note 01.07-30.09 01.07-30.09 YTD YTD Full year
2015 2014 2015 2014 2014
Cash flow from operating activities
Profit/(loss) before tax (211) 56 (88) 110 104
Financial (income)/expenses, excluding unrealised financial derivates 17 51 21 (8)
Financial derivatives unrealised 46 6 39 20 115
Depreciation/impairment 5 20 19 60 57 80
(Gain)/loss on sale of tangible assets 1 (0) 1 1
Net (gain)/loss from sale of associate (26)
Change in net pension assets/liabilities (5) (3) (8) (5) (24)
Other change in working capital (6) (8) (8) 21 7
Share of profit/(loss) from joint ventures and associates 172 (46) 98 (123) (152)
Dividend received from joint ventures and associates 1 5 34 36 95
Tax paid (company income tax, witholding tax) (1) (3) (3) (3)
Net cash flow provided by/(used in) operating activities 35 28 148 136 216
Cash flow from investing activities
Proceeds from sale of tangible assets 7 7 15 15
Investments in vessels, other tangible and intangible assets 5 (11) (9) (151) (30) (35)
Net proceeds from sale of associate 39
Proceeds from sale of investment-held-for-sale 6 6
Proceeds from sale of financial investments 28 13 76 54 57
Investments in financial investments (37) (14) (109) (56) (64)
Dividend received (financial investments) 2 2 2
Interest received 1 2 2
Changes in other investments 1 2
Net cash flow provided by/(used in) investing activities (18) (2) (134) (7) (16)
Cash flow from financing activities
Proceeds from issue of debt 93 177 221 312 312
Repayment of debt (103) (155) (149) (300) (400)
Interest paid including interest derivatives (29) (22) (60) (51) (70)
Realised financial derivatives (6) 3 (6) 8 12
Dividend to shareholders (28) (37) (69)
Net cash flow provided by/(used in) financing activities (45) 3 (22) (67) (216)
Net increase in cash and cash equivalents (28) 29 (8) 62 (17)
Cash and cash equivalents, excluding restricted cash, at beginning of period 160 189 140 157 157
Currency on cash and cash equivalents*
Cash and cash equivalents at end of period 132 219 132 219 140
* The group is located and operating world wide and every entity has several bank accounts in different currencies. Unrealised currency effects are included in net cash provided by operating activities.
The above consolidated cash flow statement should be read in conjunction with the accompanying notes.
Wilh. Wilhelmsen ASA group Q3 2015 Unaudited 20 of 30

Statement of changes in equity - financial reportJoint ventures based on equity method
Statement of changes in equity - Year to date
USD mill Share capital Other reserves Retained earnings Total equity
Balance at 31.12.2014 30 (24) 1 700 1 707
Profit/(loss) for the period (86) (86)
Other comprehensive income (6) (6)
Total comprehensive income 0 (6) (86) (92)
Paid dividends to shareholders (28) (28)
Balance 30.09.2015 30 (30) 1 587 1 588
Balance at 31.12.2013 30 (3) 1 603 1 632
Profit/(loss) for the period 111 111
Other comprehensive income 2 2
Total comprehensive income 0 2 111 113
Paid dividends to shareholders (37) (37)
Balance 30.09.2014 30 (0) 1 677 1 709
Statement of changes in equity - Full year 2014
USD mill Share capital Other reserves Retained earnings Total equity
Balance at 31.12.2013 30 (3) 1 602 1 632
Profit/(loss) for the year 166 166
Other comprehensive income (22) (22)
Total comprehensive income 0 (22) 166 144
Paid dividends to shareholders (69) (69)
Balance 31.12.2014 30 (24) 1 700 1 707
The above consolidated statement of changes in equity should be read in conjunction with the accompanying notes.
Wilh. Wilhelmsen ASA group Q3 2015 Unaudited 21 of 30

Joint ventures based on equity method
Note 1 - Accounting principles
Note 2 - Significant acquisitions and disposals
Note 3 - Employee benefits/pension cost
USD mill 2014
Employee benefits (excluding pension cost) (10)
Pension cost (3)
Gain related to termination of defined benefit plan for Norwegian employees 11
Employee benefits (income statement) (3)
Pension cost (3)
Gain related to termination of defined benefit plan for Norwegian employees 11
Other comprehensive income pension, before tax (20)
Net equity effect of pension cost, before tax (parent and subsidaries) (12)
Shipping Holding Total 2014
Effect on operating profit 2014 Q4 Q4 Q4 YTD
Operating profit 42 8 60 211
Gain related to termination of defined benefit plan for Norwegian employees (included in employee benefit) (1) (10) (11) (11) Gain related to termination of defined benefit plan for Norwegian employee (Share of profit from joint ventures and associates) (6) (6) (6)
Total gain from termination of defined benefit plan for Norwegian employees (7) (10) (17) (17) Operating profit excluding gain from termination of defined benefit plan for Norwegian employees 35 (2) 43 195
Notes - financial report
This consolidated interim financial report has been prepared in accordance with International Accounting Standards (IAS 34), "interim financial reporting". The consolidated interim financial reporting should be read in conjunction with the annual financial statements for the year end 31 December 2014 for Wilh.Wilhelmsen ASA group (WWASA), which has been prepared in accordance with IFRS's endorsed by the EU.
The accounting policies implemented are consistent with those of the annual financial statements for WWASA for the year end 31 December 2014.
There are no new standards or amendments to standards released during 2015.
As a result of rounding adjustments, the figures in one or more columns may not add up to the total of that column.
Termination of defined benefit pension plan.Up to 31 December 2014 WWASA had two pension schemes for employees in Norway; a defined benefit scheme closed for new members and a defined contribution scheme. Due to changes in the national pension scheme and changes in the pension market in general, the Board of WWASA decided to
follow the recommendations from the pension committee to terminate the defined benefit pension scheme 31 December 2014. Effective 1 January 2015 all employees entered into a defined contribution pension scheme with improved saving rates.
In the first quarter of 2015, WWASA sold 187 500 shares in Hyundai Glovis with net proceeds of approximately USD 39 million. The net gain recorded in the 2015 group’s accounts amounted to USD 26 million. There has not been any other
significant acquisitions or disposals during the first three quarters of 2015.There has not been any significant acquisitions or disposals during 2014.
Wilh. Wilhelmsen ASA group Q3 2015 Unaudited 22 of 30

Joint ventures based on equity method
Note 4 - Vessels, other tangible and intangible assets
USD mill
Other tangible assets
Vessels & Newbuilding
contractsTotal tangible
assetsIntangible
assets
2015 - Year to date
Cost price at 01.01 2 2 400 2 401 7
Additions 151 151
Disposal (81) (81)
Cost price at 30.09 1 2 469 2 471 7
Accumulated depreciation and impairment losses at 01.01 (1) (640) (642) (1)
Depreciation (60) (60)
Disposal 75 75
Accumulated depreciation and impairment losses at 30.09 (1) (626) (628) (1)
Carrying amounts at 30.09 0 1 844 1 844 6
2014 - Year to date
Cost price 01.01 2 2 467 2 469 7
Additions 30 30
Disposal (99) (100)
Cost price 30.09 2 2 398 2 399 7
Accumulated depreciation and impairment losses 01.01 (1) (647) (649) (1)
Depreciation (57) (57)
Disposal 82 83
Accumulated depreciation and impairment losses 30.09 (1) (622) (624) (1)
Carrying amounts 30.09 1 1 776 1 777 6
2014 - Full year 2014
Cost price at 01.01 2 2 467 2 469 7
Additions 35 35
Disposal (1) (103) (103)
Cost price at 31.12 2 2 400 2 401 7
Accumulated depreciation and impairment losses at 01.01 (1) (647) (649) (1)
Depreciation (76) (76)
Disposal 86 86
Impairment (4) (4)
Accumulated depreciation and impairment losses at 31.12 (1) (640) (642) (1)
Carrying amounts at 31.12 0 1 759 1 760 6
Notes - financial report
Wilh. Wilhelmsen ASA group Q3 2015 Unaudited 23 of 30

Joint ventures based on equity method
Note 5 - Financial income/(expenses)
USD mill 01.07-30.09 01.07-30.09 YTD YTD Full year
2015 2014 2015 2014 2014
Financials
Investment management 1 (7.5) (0.6) (0.9) 8.9 5.7
Interest incomes 0.2 0.3 0.9 1.7 2.0
Other financial items (9.6) (0.4) (11.3) (9.7) (10.2)
Net financial items (16.9) (0.7) (11.3) 0.9 (2.5)
Net financials - interes rate
Interest expenses (8.3) (11.5) (26.9) (35.5) (45.4)
Interest rate derivatives - realised (7.9) (8.1) (23.7) (17.9) (26.0)
Net interest expenses (16.2) (19.6) (50.5) (53.3) (71.4)
Interest rate derivatives - unrealised (13.8) 9.3 6.2 (2.0) (16.4)
Net financial - currency
Net currency gain/(loss) 21.5 18.5 17.2 22.8 70.0
Currency derivatives - realised 5.7 2.1 5.2 (1.3) 8.0
Currency derivatives - unrealised (23.4) 4.9 (27.8) 9.4 (35.6)
Cross currency derivatives - realised (11.2) 1.0 (11.2) 9.7 3.6
Cross currency derivatives - unrealised (5.0) (20.0) (14.9) (27.6) (63.4)
Net financial - currency (12.4) 6.5 (31.5) 13.1 (17.4)
Financial derivatives bunkers
Valuation of bunker hedges (4.2) (2.6)
Net financial derivatives bunkers (4.2) 0.0 (2.6) 0.0 0.0
Financial income/(expenses) (63.5) (4.5) (89.7) (41.3) (107.6)
1 Includes financial derivatives for trading
Note 6 - Tax
Note 7 - Shares
The company's share capital is as follows:Number of shares NOK mill USD mill
Share capital 220 000 000 220 30
Notes - financial report
Third quarter tax payable is impacted by a notice from Korea Tax Authorities whereas they disregard Wilhelmsen Ships Holding Malta Ltd as the beneficial owner of dividends from EUKOR. The notice is for the period 2010-2014 with an increased withholding tax from 5% to 15%. Korea Tax Authorities claim Wilh. Wilhelmsen ASA being the beneficial owner of the dividend with the consequence of 15% withholding tax according to tax treaty Norway-Korea. EUKOR has withheld 5% on dividends paid according to the Malta-Korea tax treaty. Total increased withholding tax and penalty (10%) for the period 2010-2015 amounts to approximately USD 15 million. The company will appeal the decision to the National Tax Tribunal in Korea.
WWASA’s subsidiary Wilhelmsen Lines Shipowning (WLS) commenced legal proceedings before the Oslo City Court based on the tax appeal board's decision to turn down the application for tonnage tax. The basis for the proceedings was that the transition rule valid for companies that exited the old tonnage tax regime (abolished in 2007) into ordinary taxation was in breach with The Constitution of Norway, article 97. A letter has recently been sent to Oslo City court asking for the litigation process to start. Until the company is faced with the final outcome of the litigation process, the issue will have no impact on the income statement or balance sheet for the group.
The effective tax rate for the group will, from period to period, change dependent on the group gains and losses from investments inside the exemption method and
Wilh. Wilhelmsen ASA group Q3 2015 Unaudited 24 of 30

Joint ventures based on equity method
Note 8 - Paid/ proposed dividend
Note 9 - Interest-bearing debt
USD mill 30.09.2015 30.09.2014 31.12.2014
Non current interest-bearing debt 1 239 1 309 1 236
Current interest-bearing debt 120 176 90
Total interest-bearing debt 1 358 1 485 1 325
Cash and cash equivalents 132 219 140
Current financial investments 246 246 235
Net interest bearing debt 980 1 020 951
Net interest bearing debt in Joint Ventures (group's share) 30.09.2015 30.09.2014 31.12.2014
Non current interest-bearing debt 643 582 620
Current interest-bearing debt 77 78 85
Total interest-bearing debt 720 660 705
Cash and cash equivalents 291 216 223
Current financial investments
Net interest bearing debt 429 444 482
Specification of interest-bearing debt 30.09.2015 30.09.2014 31.12.2014
Interest-bearing debt
Mortgages 1 078 948 924
Leasing commitments 86 82
Bonds 280 451 319
Total interest-bearing debt 1 358 1 485 1 325
Repayment schedule for interest-bearing debt
Due in year 1 31 108 90
Due in year 2 188 91 185
Due in year 3 106 200 91
Due in year 4 281 91 280
Due in year 5 and later 752 995 680
Total interest-bearing debt 1 358 1 485 1 325
Notes - financial report
Dividend for fiscal year 2014 of NOK 1.00 per share, total of approximately USD 28 million, was paid to the shareholders in May 2015.The dividend had effect on retained earnings in the second quarter of 2015.
Dividend for fiscal year 2013 was NOK 1.00 per share paid in May 2014 (effect on retained earnings in the second quarter of 2014) and NOK 1.00 per share paid in November 2014 (effect on retained earnings in the fourth quarter of 2014).
Based on the company's distributable equity as of 31 December 2014 (less dividend paid in the first half of 2015), the board will propose to pay an additional dividend of NOK 0.50 per share.The dividend will have effect on retained earnings and other reserves in fourth quarter of 2015.
Wilh. Wilhelmsen ASA group Q3 2015 Unaudited 25 of 30

Joint ventures based on equity method
Note 10 - Financial level
Total financial instruments and short term financial investments:
USD mill Level 1 Level 2 Level 3 Total
Financial assets at fair value
Financial derivatives 7 7
Equities 73 73
Bonds 173 173
Total financial assets 30.09.2015 246 7 0 253
Financial liabilities at fair value
Financial derivatives 260 260
Total financial liabilities 30.09.2015 0 260 0 260
Financial assets at fair value
Financial derivatives 8 8
Equities 75 75
Bonds 142 17 159
Total financial assets 31.12.2014 217 25 0 242
Financial liabilities at fair value
Financial derivatives 222 222
Total financial liabilities 31.12.2014 0 222 0 222
2015 2014
Changes in level 3 instruments
Opening balance 01.01 0 0
Closing balance 0 0
Notes - financial report
Fair value estimationThe fair value of financial instruments traded in an active market is based on quoted market prices at the balance sheet date. The fair value of financial instruments that are not traded in an active market (over-the-counter contracts) are based on third party quotes.These quotes use the maximum number of observable market rates for price discovery. Specific valuation techniques used to value financial instruments include:- Quoted market prices or dealer quotes for similar instruments- The fair value of interest rate swaps is calculated as the present value of the estimated future cash flows based on observable yield curves- The fair value of interest rate swap option (swaption) contracts is determined using observable volatility, yield curve and time-to-maturity parameters at the balance sheet date, resulting in a swaption premium- The fair value of forward foreign exchange contracts is determined using forward exchange rates at the balance sheet date, with the resulting value discounted back to present value and- The fair value of foreign exchange option contracts is determined using observable forward exchange rates, volatility, yield curve and time-to-maturity parameters at the balance sheet date, resulting in an option premium.
The carrying value less impairment provision of trade receivables and payables are assumed to approximate their fair values. The fair value of financial liabilities
for disclosure purposes is estimated by discounting the future contractual cash flows at the current market interest rate that is available to the group for similar financial instruments.
The fair value of financial instruments traded in active markets is based on quoted market prices at the balance sheet date. A market is regarded as active if quoted prices are readily and regularly available from an exchange, dealer, broker, industry group, pricing service, or regulatory agency, and those prices represent actual and regularly occurring market transactions on an arm's length basis.
The quoted market price used for financial assets held by the group is the current mid price. These instruments are included in level 1. Instruments included in level 1 are listed equities and liquid investment grade bonds.
The fair value of financial instruments that are not traded in an active market are based on third-party quotes (Mark-to-Market). These quotes use the maximum number of observable market rates for price discovery. The different valuation techniques typically applied by financial counterparties (banks) were described above. These instruments - FX and IR derivatives - are included in level 2.
If one or more of the significant inputs is not based on observable market data, the instrument is in level 3. Primarily illiquid investment funds and structured notes are included in level 3.
Wilh. Wilhelmsen ASA group Q3 2015 Unaudited 26 of 30

Joint ventures based on equity method
Note 11 - Segments
USD mill
Q3 Q3Full
year Q3 Q3Full
year Q3 Q3Full
year Q3 Q3Full
year Q3 Q3Full
year
QUARTER 2015 2014 2014 2015 2014 2014 2015 2014 2014 2015 2014 2014 2015 2014 2014
Operating revenue 77 71 285 1 1 6 (1) (1) (5) 77 71 285
Share of profit/(loss) from joint
ventures and associates 1 (184) 25 86 13 21 66 (172) 46 152
Gain on sale of assets
Total income (108) 96 371 13 21 66 1 1 6 (1) (1) (5) (95) 117 437
Primary operating profit (138) 62 226 13 21 66 (2) (3) (1) (127) 80 291
Depreciation and impairment (20) (19) (79) (20) (19) (80)
Operating profit/(loss) (EBIT) (157) 43 147 13 21 66 (2) (3) (1) 0 (0) 0 (147) 61 211
Financial income/(expense) (35) (1) (53) (29) (4) (55) (64) (5) (108)
Profit/(loss) before tax (192) 42 94 13 21 66 (31) (6) (56) 0 (0) 0 (211) 56 104
Tax income/(expenses) (11) (4) 30 9 2 32 (2) (2) 62Profit/(loss) for the period attributable to the owners of the parent (203) 38 125 13 21 66 (22) (5) (25) 0 (0) 0 (213) 54 166
USD mill
YTD YTDFull year YTD YTD
Full year YTD YTD
Full year YTD YTD
Full year YTD YTD
Full year
Year to date 2015 2014 2014 2015 2014 2014 2015 2014 2014 2015 2014 2014 2015 2014 2014
Operating revenue 231 210 285 4 4 6 (4) (4) (5) 231 210 285
Share of profit/(loss) from joint
ventures and associates 1 (135) 67 86 37 55 66 (98) 123 152
Gain on disposal of assets 26 26
Total income 96 277 371 63 55 66 4 4 6 (4) (4) (5) 160 333 437
Primary operating profit 5 162 226 63 55 66 (6) (9) (1) 62 209 291
Depreciation and impairment (60) (57) (79) (60) (57) (80)
Operating profit/(loss) (EBIT) (55) 105 147 63 55 66 (7) (9) (1) (0) (0) 0 2 152 211
Financial income/(expenses) (45) (20) (53) (45) (21) (55) (90) (41) (108)
Profit/(loss) before tax (100) 85 94 63 55 66 (51) (30) (56) 0 (0) 0 (88) 110 104
Tax income/(expense) (12) (7) 30 13 8 32 1 62Profit/(loss) for the period attributable to the owners of the parent (112) 78 125 63 55 66 (38) (23) (25) 0 (0) 0 (86) 111 166
Holding Eliminations Total
1 Cash settled portion of bunker hedge swaps is included in net operating profit by reduction/(increase) of voyage related expenses.
Shipping Logistics
Notes - financial report
TotalShipping Logistics Holding Eliminations
Wilh. Wilhelmsen ASA group Q3 2015 Unaudited 27 of 30

Joint ventures based on equity method
Note 12 - Related party transactions
Note 13 - Contingencies
Note 14 - Events occurring after the balance sheet date
Notes - financial report
Wilh. Wilhelmsen Holding ASA (WWH) delivers services to the WWASA group related to inter alia human resources, accounting services, tax, communication, treasury and legal services (“Shared Services”) and in-house services such as canteen, post, switchboard and rent of office facilities. Generally, Shared Services are priced using a cost plus 5% margin calculation, in accordance with the
principles set out in the OECD Transfer Pricing Guidelines and are delivered according to agreements that are renewed annually.In addition, WWASA group has several transactions with associates. The contracts governing such transactions are based on commercial market terms and mainly relate to the chartering of vessels on short and long term charters.
Update on anti-trust investigations The authorities in Japan (2013) and South Africa (2015) have fined WWL for anti-trust behaviour. WWL and EUKOR continue to be part of anti-trust investigations of the car carrying industry in several jurisdictions, of which the EU and US are among the bigger jurisdictions. As some of the processes are confidential, WWASA is not in a position to comment on the ongoing investigations within the respective jurisdictions. The processes are expected to continue to take time, but
further clarifications within some jurisdictions are expected during the fourth quarter 2015 and 2016.
WWASA has in the third quarter accounts made a provision of USD 200 million representing the estimated exposure in WWL and EUKOR. The final outcome, however, is uncertain and processes will still take time.
No material events occurred between the balance sheet date and the date when the accounts were presented providing new information about conditions prevailing on the balance sheet date.
Wilh. Wilhelmsen ASA group Q3 2015 Unaudited 28 of 30

BLANK
Wilh. Wilhelmsen ASA group Q3 2015 Unaudited 29 of 30

Wilh. Wilhelmsen ASA PO Box 33 NO-1324 Lysaker, NORWAY Tel: +47 67 58 40 00 http://www.wilhelmsenasa.com/
Follow us on Twitter | Facebook | LinkedIn | Instagram | YouTube
Org no 995 216 604 MVA