Third Quarter 2014 - NASDAQfiles.shareholder.com/downloads/AMDA-I4AG4/0x0x779018/0D5076FD … ·...
26
Company Presentation Third Quarter 2014
Transcript of Third Quarter 2014 - NASDAQfiles.shareholder.com/downloads/AMDA-I4AG4/0x0x779018/0D5076FD … ·...

Company Presentation Third Quarter 2014
2
Cautionary Statements
Forward-Looking Statements
This presentation may include forward-looking statements. These statements reflect the current views of the Company’s senior management with respect to future events and financial performance. These statements include forward-looking statements with respect to the Company’s business and industry in general. Statements that include the words “expect,” “intend,” “plan,” “believe,” “project,” “forecast,” “estimate,” “may,” “should,” “anticipate” and similar statements of a future or forward-looking nature identify forward-looking statements for purposes of the federal securities laws or otherwise. Forward-looking statements address matters that involve risks and uncertainties. Accordingly, there are or will be important factors that could cause the Company’s actual results to differ materially from those indicated in these statements. The statements made herein speak only as of the date of this presentation.
Non-GAAP Financial Measures
This presentation contains certain non-GAAP financial measures. A “non-GAAP financial measure” is defined as a numerical measure of a company’s financial performance that excludes or includes amounts so as to be different than the most directly comparable measure calculated and presented in accordance with GAAP in the statements of income, balance sheets or statements of cash flow of the company. The Company has provided a reconciliation of non-GAAP financial measures to the most directly comparable financial measure in the Appendix to this presentation. The non-GAAP financial measures used within this presentation are Adjusted EBITDA and Restaurant-Level EBITDA. These measures are presented because management uses this information to monitor and evaluate financial results and trends and believes this information to also be useful for investors. For additional information about our non-GAAP financial measures, see our earnings releases and filings with the Securities and Exchange Commission.
2

3
Senior Management Presenters
Steve Hislop President and Chief Executive Officer
Jon Howie Vice President and
Chief Financial Officer
3

4
“If you’ve seen one Chuy’s, you’ve seen one Chuy’s!”
Leave the cookie cutters to the other guys. Each Chuy’s has genuine character: a noisy, sprawling Tex Mex hacienda full of feel-good drinks and home-cooked foods.
Chuy’s is Tex Mex Unchained!
4
Red Dash in Tex Mex?, Quotations for title
“mexican hacienda” ICR Comment - incorporated

5
Chuy’s Highlights
5
Considerable Dining Value with Broad Customer Appeal
Flexible Business Model with Industry Leading Unit Economics
Deep Rooted and Inspiring Company Culture
Upbeat Atmosphere Coupled with Irreverent Brand Helps Differentiate Concept
Highly Experienced Management Team
Fresh, Authentic Mexican and Tex Mex Inspired Cuisine

6 0.0%
Targeted Growth Metrics
Industry Leading Historical and Targeted Results
2010 - 2013 Unit CAGR
2010 - 2013 Revenue CAGR
30.0%
0.0%
40.0%
0.0%
40.0%
2010 - 2013 Adj. EBITDA
CAGR
0.0%
Targeted Cash-on-Cash Return
2014 Unit Growth (2)
30.0%
Long-Term EPS Growth
14.6%
27.2%
12.2%*
12.3%**
6.2%
20.0%
19.1%
13.8%
20.0%
13.9%
Historical Growth Metrics Operating Metrics
12.9%
10.6%
6.7%
NA
7.3%**
16.0
27.6% 28.9%
8.8%
24.5%
9.0%*
NA
1.4%
29.3%
2013 RL EBITDA Margin
25.0%
0.0%
17.5%
18.4%
17.9%
9.4%
15.8%
19.1%
2013 Average Unit Volume (1)
$6.0
$0.0
$4.8
$5.7
$2.9
$4.3
$3.6
$3.4
$4.9
25.0%
0.0%
10.2%
8.6%
6.5%
5.1%
5.6%
22.9% ~20%-25%
Source: Company financials and press releases, equity research estimates and Bloomberg. Note: RL = Restaurant Level. (1) Dollars in millions. (2) Represents Company guidance and system-wide units. IRG excludes Macaroni Grill units. TXRH unit growth represents Company-owned unit growth. (3) Represents Company guidance except for IRG, TXRH and BJRI for which Company guidance was unavailable and is based on equity research. * TXRH has 53 operating weeks in 2013. ** Does not include Macaroni Grill which was acquired by IRG in 2013.
45.0%
25.0%
25.0%
26.0%
27.9%
~40.0%
25.0%
35.0%
2014 EPS Growth(3)
25.0%
0.0%
NA
20.0%
15.6%*
NA
1.3%
11.6%

7
Industry Leading Average Unit Volumes
• Track record of high average unit volumes
– LTM comparable restaurants generated average unit volumes of $4.9 million
– Highest volume restaurant generated $8.4 million
– Serve approximately 360,000 customers per location per year, on average
– Sales per square foot of approximately $640
• Strong average LTM restaurant-level EBITDA margins at comparable restaurants of 21.4%
Source: Company Filings and 2013 Technomic Industry Report as of most recent available fiscal year. Chuy’s based on latest filed LTM period.
Average Unit Volume ($Millions)
$6.3
$4.9 $4.2
$3.5 $3.2 $2.7
$5.7
$4.6 $4.4 $4.3
$0.0
$2.0
$4.0
$6.0
$8.0
$10.0
7
Full-Service Mexican Concepts Select Best-in-Class Concepts

8
Restaurants Currently Open
Restaurant to be Opened in 2011
Proven Concept with 30-Year History
8
Restaurants Currently Open
Restaurant to be Opened in 2011
49 new restaurants opened and 13
new states entered during the last 77
months
Pre-2008 Restaurants Restaurants Opened Since 2008
1982 Founded in Austin
2006 Acquired by Goode Partners in Nov. 2006
2008 Onset of growth
initiatives
2009 Opened first
location outside Texas (Nashville, TN)
2010 Opened in AL, KY and
TN
2011 Opened in IN, KY, TN
and GA
2007 Steve Hislop
joined as President and CEO
2013 Opened in AR, FL, VA, NC, SC, MO
and OH
Chuy’s Historical
Financials File
2012 Opened in FL, OK, TN
and KY
1 8 8
12 17
23 31
39
48
Total Restaurants at End of Period
57
August 2014
Opened in AR, IN, FL,
NC, VA and GA

9
Fresh, Authentic Mexican Cuisine
• Offer authentic Mexican food using only the freshest ingredients
• Recipes and cooking techniques originated from friends and family of our founders, who are from Mexico, New Mexico and Texas
• Commitment to made-from-scratch, freshly prepared cooking
• Generous portions support value priced offering
• Customizable food offering is core to the Chuy’s concept
9

10
We Take One Thing Seriously: Our Food!
Homemade Sauces
Tex Mex
Ranchero
Hatch Green Chile
Green Chile
Tomatillo
Deluxe Tomatillo
Creamy Jalapeno
10
“Big As Yo’ Face” Burritos
• A homemade, 12” flour tortilla stuffed with refried beans, cheese and choice of beef or chicken. Served with choice of sauce & choice of Mexican or green chile rice
• Price: $8.29 - $9.79
Chicka-Chicka Boom-Boom
• Freshly-roasted, hand-pulled chicken & cheese with Boom-Boom sauce, made with cheese, roasted New Mexican green chiles, tomatillos, green onions, cilantro and lime juice. Served with choice of Mexican or green chile rice & refried or charro beans
• Price: $9.99
Texas Martini
• Served “shaken, not stirred,” this south-of-the-border martini features tequila, Patrón Citrónge, fresh lime juice and a jalapeño-stuffed olive
• Three drinks for the price of one
• Price: $8.50
Note: Prices above represent menu prices in Texas and Oklahoma as of June 29, 2014, which may vary from prices in other states.

11
Exceptional Dining Value
$12.44 $13.60 $14.00 $15.80 $16.50
$19.70 $20.32 $20.50
$24.39 $24.87
$0.0
$5.0
$10.0
$15.0
$20.0
$25.0
$30.0
Source: Company filings as of most recent available fiscal year end and equity research. Chuy’s based on LTM period. (1) Applies to our tier 1 menu as of June 29, 2014 which is in place at 28 of our 54 restaurants as of that date.
Average Check
Significant value proposition to
customers
Only 3 out of 49 menu items priced
over $10.00
Average check of $13.34 is lower
than most casual dining competitors
11
• Significant value proposition to customers
• Only 3 out of 49 menu items priced over $10.00(1)
• Average check of $13.60

12
Full Service Dining
56 Total Restaurants in 14 U.S. States
23.1% 2013 Unit Growth
$13.60 Average Check (18.5% Alcohol Mix)
Sample Offerings:
Entrée: “Big As Yo Face” Burrito – Oven-Roasted Chicken $9.49
Includes a side of Rice & Beans Chips & Salsa: Unlimited & Complimentary
Total: $9.49
Chipotle vs. Chuy’s
Fast Casual Dining
1,656 Total Restaurants in 45 U.S. States
11.5% 2013 Unit Growth
~$10.00 Average Check (~1.0% Alcohol Mix)
Sample Offerings:
Entrée: Chicken Burrito $6.50
Chips & Salsa: $1.95
Total: $8.45
+
12
Note: Chipotle and Chuy’s sample offerings represent menu items and prices from restaurants in the same geographic region. Source: Company data, public filings and equity research as of June 29, 2014.
13.0% per JEF
research

13
Upbeat Atmosphere and Appealing, Irreverent Brand
13

14
Growth Opportunities

15
New Restaurant Development Strategy
15
“Hub” Locations
• Pursue development in established and adjacent markets
• Flexible real estate strategy
– Conversions and new prototype construction
• Proven ability to open successful new restaurants
– 8 restaurants in 2011
– 8 restaurants in 2012
– 9 restaurants in 2013
– 11 restaurants planned for 2014 (9 opened YTD)
• Targeted annual restaurant growth of 20%
Pre-2008
2008
2009
2010
2011
2012
2013
Note: Map as of August 2014.
2014

16
New Unit Growth Comparison
27.6%
12.9% 10.6%
7.3% 7.8%
6.7%
13.6%
6.9%
22.9%
10.2% 8.6%
5.1% 5.6% 6.5%
12.2%
7.0%
0%
8%
16%
24%
32%
40%
2010 - 2013 CAGR Projected 2014
Source: Company data, public filings and equity research. Note: Total restaurants as of most recent public filings. Projected unit growth represents company guidance where available. represents Company-owned unit growth. IRG excludes Macaroni Grill units.
16 Net Restaurant
Openings 2010-2013 25 511 75
Casual Dining Fast Casual
30
Total Restaurants
324
1777 1595 420 156
22
108
46
147
261
993
57

17
Industry Leading New Unit Economics
• Target a cash-on-cash return beginning in the third operating year of 40.0% and a sales to investment ratio of 2:1
– On average, returns on units opened since 2001 have exceeded target returns in the second year of operations
Source: Public filings and equity research estimates. Note: Cash-on-Cash Return defined as Restaurant-Level EBITDA divided by Net Cash Investment excluding Pre-Opening Expense. (1) Represents targeted Year 1 Average Unit Volume. (2) Represents Average Cash Investment based on historical new restaurant openings. (3) Estimated as target Average Unit Volume divided by FY 2013 Average Check. (4) Represents targeted Year 1 Sales: Investment Ratio. (5) Represents targeted Year 3 Cash-on-Cash Return. (6) BBRG unit economics based on average of targeted Bravo and Brio Unit Economics. (7) Based on actual data per most recent filing. AUV based on average weekly sales multiplied by 52 weeks. (8) Represents average of BJRI new unit prototype designs.
New Unit Economics ($000s) LTM Comparable
Restaurants Target
Average Unit Volume $4,897 $4,200 (1) $3,900 $4,200 $3,900 $6,050 $2,932
Restaurant-Level EBITDA 1,049 700 709 800 1,260 540
% Margin 21.4% 17.9% 16.9% 20.5% 20.8% 18.4%
Average Cash Investment $1,800 (2) $2,100 $2,000 $2,540 $3,100 $3,900 $2,200
Customers Served Per Year (3) ~360,000 173,000 266,000 160,000 432,000 236,000
Sales to Investment Ratio 2.0x (4) 2.0x 1.7x 1.3x 1.6x 1.3x
Cash-on-Cash Return 40.0% (5) 35.0% 27.9% 25.0% 32.3% 24.5%
17
Targeted New Unit Economics (7) (6) (8)

18
Financial Summary

19
Demonstrated Revenue and Unit Growth
$51.9 $69.4
$94.9
$130.6
$172.6
$204.4
$100.1 $119.2
$0.0
$40.0
$80.0
$120.0
$160.0
$200.0
2008 2009 2010 2011 2012 2013 YTD Q2 2013 YTD Q2 2014
12 17
23
31
39
48 44
54
0
10
20
30
40
50
2008 2009 2010 2011 2012 2013 YTD Q2 2013 YTD Q2 2014
Revenue ($Millions)
Total Restaurants
19

20
2.9%
(2.0%)
0.7%
3.1% 2.2% 2.3%
3.2%
(3.1%)
(5.6%)
(0.6%)
1.5% 0.6%
(1.4%) (1.4%)
(8.0%)
(4.0%)
0.0%
4.0%
8.0%
2008 2009 2010 2011 2012 2013 YTD Q2 2014
Chuy's KNAPP-TRACK™
Strong Comparable Restaurant Sales Momentum
Note: KNAPP-TRACK is a monthly sales and guest count tracking service for the full service restaurant market in the United States. Source: KNAPP-TRACK and Company data. (1) Adjusted to remove impact of the 53rd week and extra 1.5 operating days in fiscal 2012.
20
Number of Comparable Restaurants
8 8 18 24 13
Cumulative Outperformance of KNAPP-TRACK 6.0% 9.6% 12.5% 14.1% 10.9%
(1)
32
17.8%
38
22.4%

21
27.8%
26.2% 27.0%
27.7% 26.9% 27.4%
27.2%
28.1%
20.0%
22.5%
25.0%
27.5%
30.0%
32.5%
35.0%
2008 2009 2010 2011 2012 2013 YTD Q22013
YTD Q22014
Consistent Cost of Sales Management
Cost of Sales (% of Revenue)
TO BE UPDATED FOR Q2
30.8% 31.2%
30.5%
29.0% 29.6% 29.7%
30.3%
20.0%
23.0%
26.0%
29.0%
32.0%
2006 2007 2008 2009 2010 YTD Q1 2010 YTD Q1 2011
21

22
$10.9 $14.7 $18.3
$25.0
$34.8 $39.1
$20.4 $21.8
20.9% 21.2% 19.3% 19.2% 20.2% 19.1% 20.3% 18.3% 0.0%
15.0%
30.0%
45.0%
60.0%
75.0%
$0.0
$10.0
$20.0
$30.0
$40.0
2008 2009 2010 2011 2012 2013 YTD Q2 2013 YTD Q2 2014
Restaurant-Level EBITDA
% Margin
$7.3 $10.3
$13.4
$18.9
$25.5 $29.1
$15.1 $15.9
$0.0
$10.0
$20.0
$30.0
2008 2009 2010 2011 2012 2013 YTD Q2 2013 YTD Q2 2014
Increasing Restaurant-Level and Adjusted EBITDA
Restaurant-Level EBITDA ($Millions)
Adjusted EBITDA ($Millions)
Total Restaurants: 12
Note: Restaurant-Level EBITDA represents net income plus the sum of general and administrative expenses, the advisory agreement termination fee, the settlement with our former director, offering costs, restaurant pre-opening costs, depreciation and amortization, interest and taxes. Note: Adjusted EBITDA represents net income before interest, taxes, depreciation and amortization plus the sum of restaurant pre-opening costs, deferred compensation, the advisory agreement termination fee, the settlement with our former director, offering costs, management fees and expenses and special one-time bonus payment.
Note: Adjusted EBIT reflects
22
17 23 31 39 48 44 54

23
Key Performance Targets
~20% New Unit and Revenue Growth
1.5% – 2.0% Same Store Sales Growth
G&A and Operating Leverage
~20% - 25%
Long-Term EPS Growth
23

24
Appendix
25
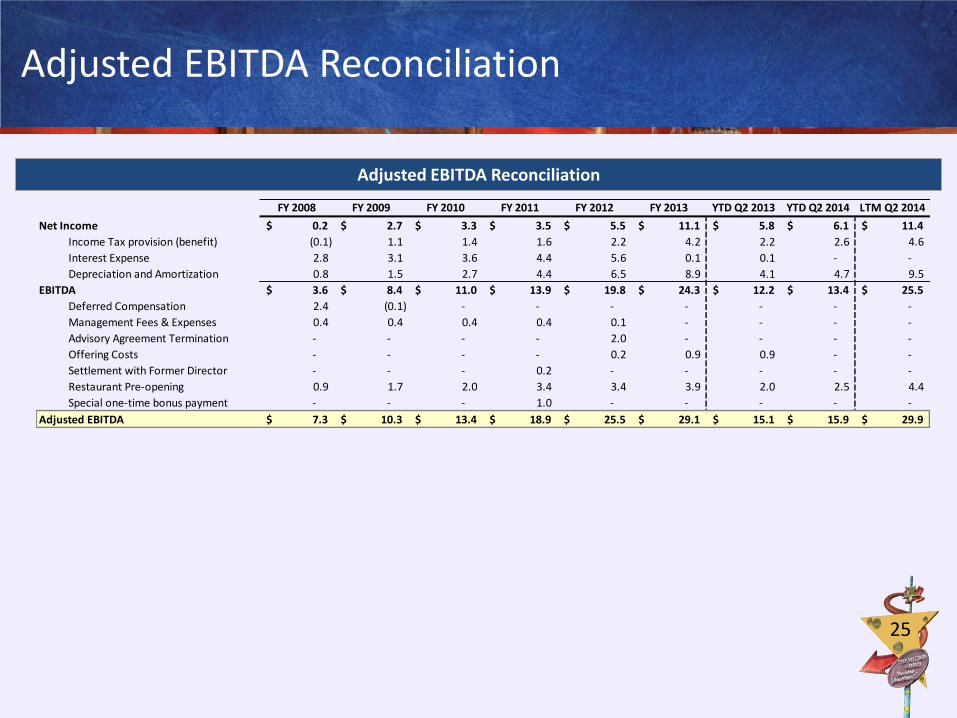
Adjusted EBITDA Reconciliation
Adjusted EBITDA Reconciliation
FY 2008 FY 2009 FY 2010 FY 2011 FY 2012 FY 2013 YTD Q2 2013 YTD Q2 2014 LTM Q2 2014
Net Income 0.2$ 2.7$ 3.3$ 3.5$ 5.5$ 11.1$ 5.8$ 6.1$ 11.4$
Income Tax provision (benefit) (0.1) 1.1 1.4 1.6 2.2 4.2 2.2 2.6 4.6
Interest Expense 2.8 3.1 3.6 4.4 5.6 0.1 0.1 - -
Depreciation and Amortization 0.8 1.5 2.7 4.4 6.5 8.9 4.1 4.7 9.5
EBITDA 3.6$ 8.4$ 11.0$ 13.9$ 19.8$ 24.3$ 12.2$ 13.4$ 25.5$
Deferred Compensation 2.4 (0.1) - - - - - - -
Management Fees & Expenses 0.4 0.4 0.4 0.4 0.1 - - - -
Advisory Agreement Termination - - - - 2.0 - - - -
Offering Costs - - - - 0.2 0.9 0.9 - -
Settlement with Former Director - - - 0.2 - - - - -
Restaurant Pre-opening 0.9 1.7 2.0 3.4 3.4 3.9 2.0 2.5 4.4
Special one-time bonus payment - - - 1.0 - - - - -
Adjusted EBITDA 7.3$ 10.3$ 13.4$ 18.9$ 25.5$ 29.1$ 15.1$ 15.9$ 29.9$

26
Restaurant-Level EBITDA Reconciliation
Restaurant-Level EBITDA Reconciliation
FY 2008 FY 2009 FY 2010 FY 2011 FY 2012 FY 2013 YTD Q2 2013 YTD Q2 2014 LTM Q2 2014
Net Income 0.2$ 2.7$ 3.3$ 3.5$ 5.5$ 11.1$ 5.8$ 6.1$ 11.4$
Income Tax provision (benefit) (0.1) 1.1 1.4 1.6 2.2 4.2 2.2 2.6 4.6
Interest Expense 2.8 3.1 3.6 4.4 5.6 0.1 0.1 - -
General and Administration 6.3 4.6 5.3 7.5 9.4 10.0 5.3 5.9 10.6
Advisory Agreement Termination - - - - 2.0 - - - -
Offering Costs - - - - 0.2 0.9 0.9 - -
Settlement with Former Director - - - 0.2 - - - - -
Restaurant Pre-opening 0.9 1.7 2.0 3.4 3.4 3.9 2.0 2.5 4.4
Depreciation and Amortization 0.8 1.5 2.7 4.4 6.5 8.9 4.1 4.7 9.5
Restaurant-Level EBITDA 10.9$ 14.7$ 18.3$ 25.0$ 34.8$ 39.1$ 20.4$ 21.8$ 40.5$