Third Edition Growth, Capital Accumulation, and the...
61
MODERN PRINCIPLES OF ECONOMICS Third Edition Growth, Capital Accumulation, and the Economics of Ideas Growth, Capital Accumulation, and the Economics of Ideas Chapter 8
Transcript of Third Edition Growth, Capital Accumulation, and the...

MODERN PRINCIPLES OF ECONOMICSThird Edition
Growth, Capital
Accumulation, and the
Economics of Ideas
Growth, Capital
Accumulation, and the
Economics of Ideas
Chapter 8

Outline
� The Solow Model and Catching-Up Growth
� The Investment Rate and Conditional Convergence
� New Ideas and Cutting-Edge Growth
� The Economics of Ideas
� The Future of Economic Growth
2

Introduction
� In 2010:
• U.S. GDP per capita grew by 2.3%.
• China’s GDP per capita grew by 10%.
� The U.S. has never grown as fast as the Chinese economy is growing today.
� China is growing much faster than the U.S. because:
• The U.S. economy is on the cutting edge.
• The Chinese economy is catching up.
3

Definition
Catching-up growth:
Growth due to capital accumulation.
4
Cutting-edge growth:
Growth due to new ideas.

The Solow Model and Catching-Up Growth
� The Solow model begins with a production function.
� The total output of an economy (Y) depends on:
• Physical capital (K)
• Human capital, or education x Labor (eL)
• Ideas (A)
� A production function expresses a relationship between output and the factors of production:
5
eL)K,F(A,Y =

The Solow Model
� If we assume that A, e, and L are constant, then we can simplify our expression for output as:
� More capital (K) should produce more output (Y) but at a diminishing rate.• Because L is constant, an increase in K always
implies an increase in the amount of capital per
worker, K/L, and an increase in Y is also always an
increase in output per worker, Y/L.
6
( )KFY =

Self-Check
7
Catching-up growth is growth due to:
a. New ideas.
b. Capital accumulation.
c. Adoption of new technologies.
Answer: b – capital accumulation.

Definition
Marginal product of capital:
The increase in output caused by the addition of one more unit of capital. The marginal product of capital diminishes as more and more capital is added.
8

The Solow Model:
Capital, Production and Diminishing Returns
� More capital (K) should produce more output (Y) but at a diminishing rate.
� The MPK diminishes because the first unit of capital is applied where it is most productive, the second where it is slightly less productive, and so on.
� The following graph shows the production function Y = F (K )
� In this case, output is the square root of the capital input:
If K = 4, then Y = = 2If K increases to 16, then Y = = 4 9
4
K=
16

Diminishing Returns
10
Creates a lot
of output
Capital, K
Output, Y
0 1 2 3 4 5 6 7 8 9 10 11 12
KY=
1
33.2
0
The first unit
of inputThe tenth unit
of input
Creates just
a little output
Growth in China and the United States
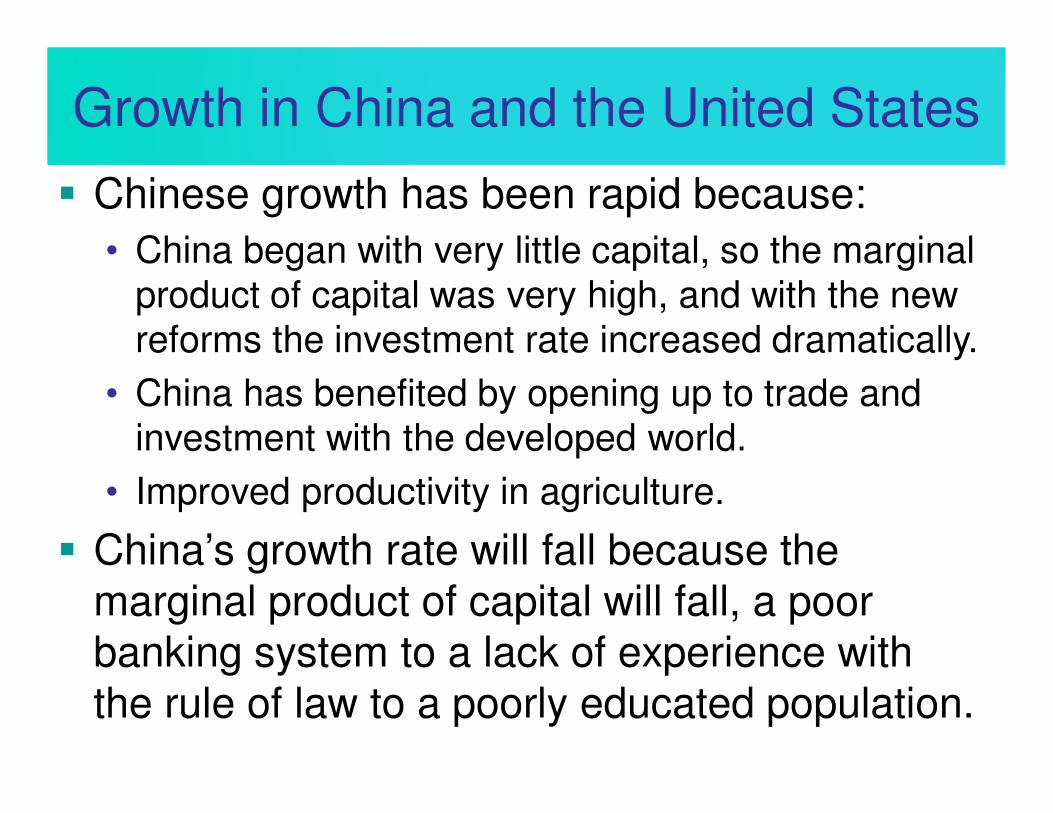
� Chinese growth has been rapid because:
• China began with very little capital, so the marginal product of capital was very high, and with the new reforms the investment rate increased dramatically.
• China has benefited by opening up to trade and investment with the developed world.
• Improved productivity in agriculture.
� China’s growth rate will fall because the
marginal product of capital will fall, a poor
banking system to a lack of experience with
the rule of law to a poorly educated population.

Capital and Investment
� Capital is output that is saved and invested rather than consumed.
� For example, out of 10 units produced, 7 are consumed and 3 are invested in new capital.
� We write the fraction of output that is invested in new capital as gamma (g), and in the example just given, g = 3/10 = 0.3
� Capital also depreciates, or wears out.
� For example, if there are 100 units of capital, 2 units might depreciate, leaving 98 for the next period.
12

Self-Check
13
Output that is invested rather than consumed is called:
a. Capital.
b. Depreciation.
c. Marginal product.
Answer: a – output that is invested is called capital.

Consumption and Investment
Capital K
Output Y
0 100 200 300 400
15
10
5
3
0
Investment
= 0.3Y
Consumption = (1- 0.3) x 10 = 7
Investment = (0.3) x 10 = 3
When K = 100,
Output = 10KY =
14
N28

Slide 14
N28 Disposition of Slide: To maintain the subject flow this slide can be moved upward, below slide 12.Nawshaba, 5/8/2015

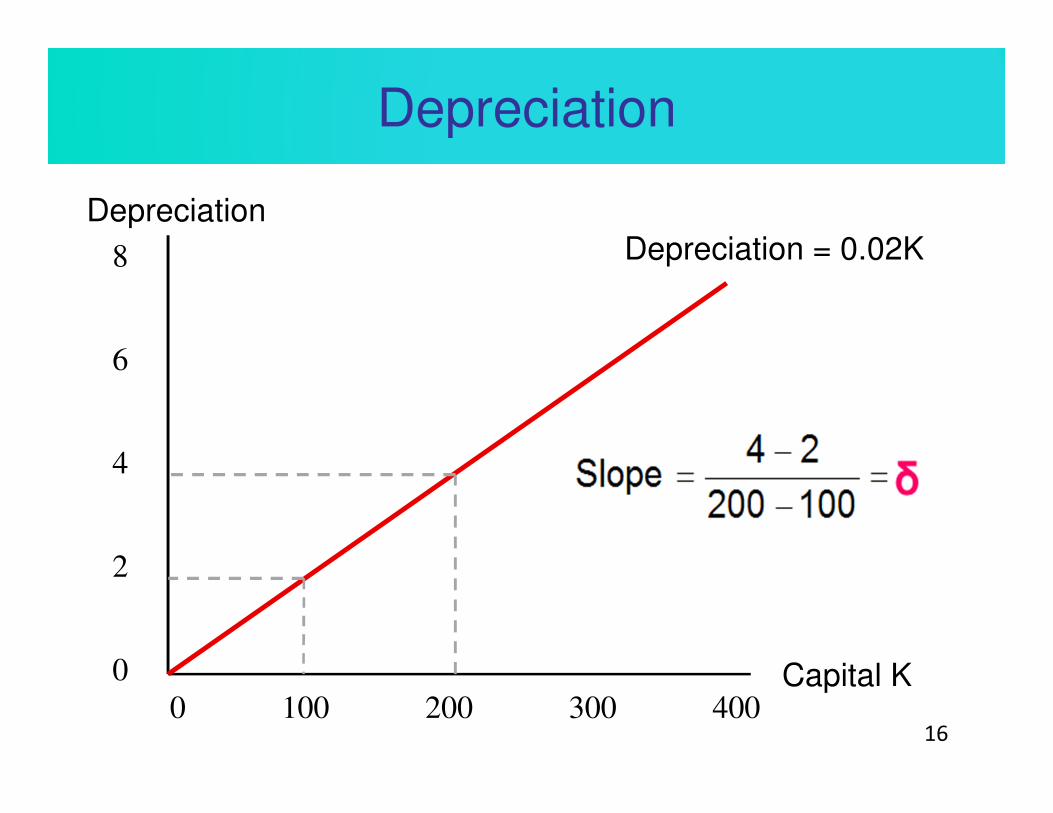
Capital and Depreciation
� Capital also depreciates, or wears out.
� For example, if there are 100 units of
capital, 2 units might depreciate, leaving
98 for the next period.
� We write the fraction of capital that wears
out or depreciates as delta (δ ); in the
example just given, δ = 2/100 = 0.02.
� capital depreciation increases the greater
the capital stock—this will turn out to place
another constraint on economic growth15
16
Capital K0 100 200 300 400
Depreciation
Depreciation = 0.02K8
6
4
2
0
Depreciation
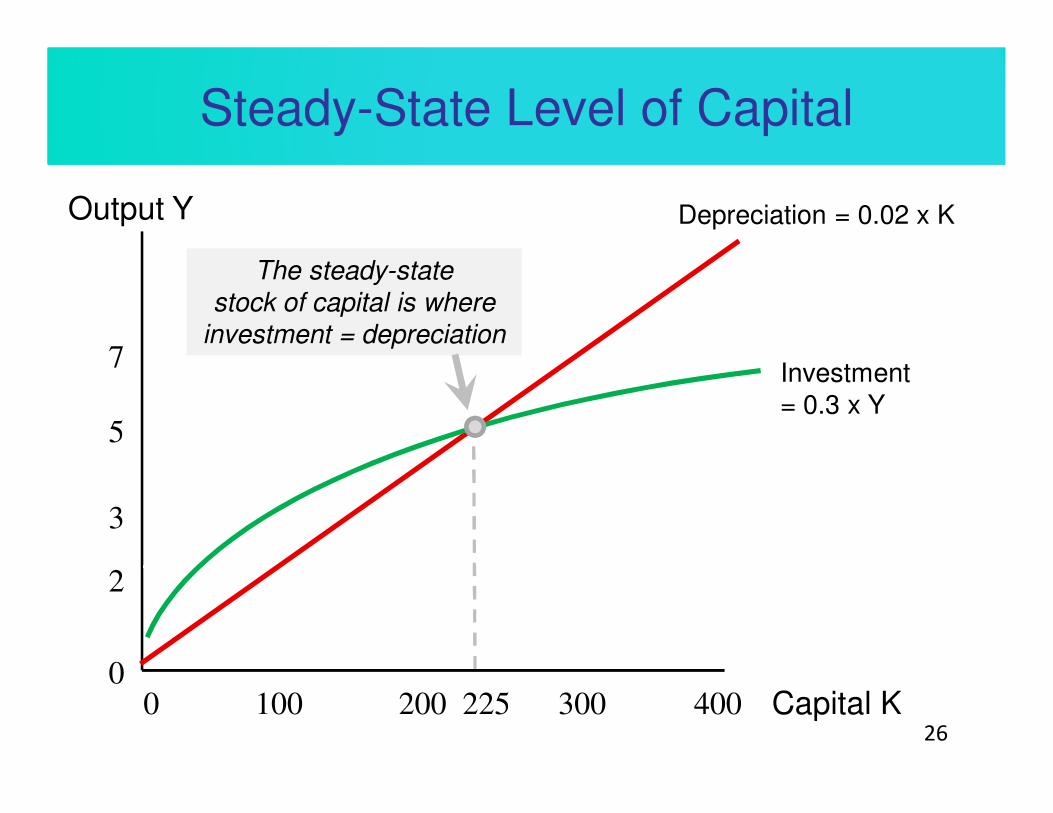
Steady-State Level of Capital
� At some point, the capital stock will reach a level such
that every unit of investment is needed just to replace
the capital that depreciates in that period.
� When investment just covers capital depreciation, the
capital stock stops growing, and when the capital stock
stops growing, output stops growing as well.
� Investment > Depreciation— The capital stock grows
and output next period is bigger.
� Investment = Depreciation— The capital stock and
output are constant(the steady state).
� Investment < Depreciation— The capital stock shrinks
and output next period is smaller.
17

Steady-State Level of Capital
18
Capital K0 100 200 225 300 400
GDP Y Depreciation = 0.02 x K
Investment
= 0.3 x Y
At K = 100,
investment > depreciation
→ increase in K
At K = 100,
investment > depreciation
→ increase in K7
5
3
2
0

Steady-State Level of Capital
19
Capital K0 100 200 225 300 400
GDP Y
7
5
3
2
0
Depreciation = 0.02 x K
Investment
= 0.3 x Y
At K = 300,
investment < depreciation
→ decrease in K
At K = 300,
investment < depreciation
→ decrease in K

Steady-State Level of Capital
20
Capital K0 100 200 225 300 400
GDP Y
7
5
3
2
0
Depreciation = 0.02 x K
Investment
= 0.3 x Y
The steady-state
stock of capital is where
investment = depreciation

Steady-State Level of Capital
21
Check the Math
• At K = 100, Y =√100 = 10• Depreciation = 0.02·100 = 2• Investment = 0.3x10 = 3• Investment > DepreciationResult: K and Y grow.
Check the Math
• At K = 400, Y =√400 = 20• Depreciation = 0.02x400 = 8• Investment = 0.3x20 = 6• Investment < Depreciation
Result: K and Y decrease.
Check the Math
• At K = 225, Y =√225 =15• Depreciation = 0.02x225 =
4.5• Investment = 0.3x15 = 4.5• Investment = Depreciation
Result:1. Investment = Depreciation2. K and Y are constant.
This is steady state.

Steady-State Level of Capital
22
� As the capital stock gets larger, investment increases but at a diminishing rate.
� Depreciation, however, increases with the capital stock at a linear (constant) rate.
� At some point investment = depreciation.
� This is the steady-state level of capital.
� There is no new (net) investment and economic growth stops.

Steady-State Level of Capital
23
The logic of diminishing returns means that eventually capital and output will cease growing.
Therefore, other factors must be responsible for long run economic growth.
Consider:
Human capital: knowledge, skills, experience
Technological knowledge: better ideas
Catching-up Growth
24
� Long-run economic growth cannot be due to capital accumulation.
� Diminishing returns mean that eventually capital and output will cease growing.
� The logic of diminishing returns applies to human capital as well.
� Changes in the capital stock drive output, so when Investment = Depreciation and K is at its steady-state level, then so is output.

Definition
Steady-state level of capital:
Where the capital stock is neither increasing nor decreasing.
25
Steady-State Level of Capital
26
Capital K0 100 200 225 300 400
Output Y
7
5
3
2
0
Depreciation = 0.02 x K
Investment
= 0.3 x Y
The steady-state
stock of capital is where
investment = depreciation
The steady-state
stock of capital is where
investment = depreciation
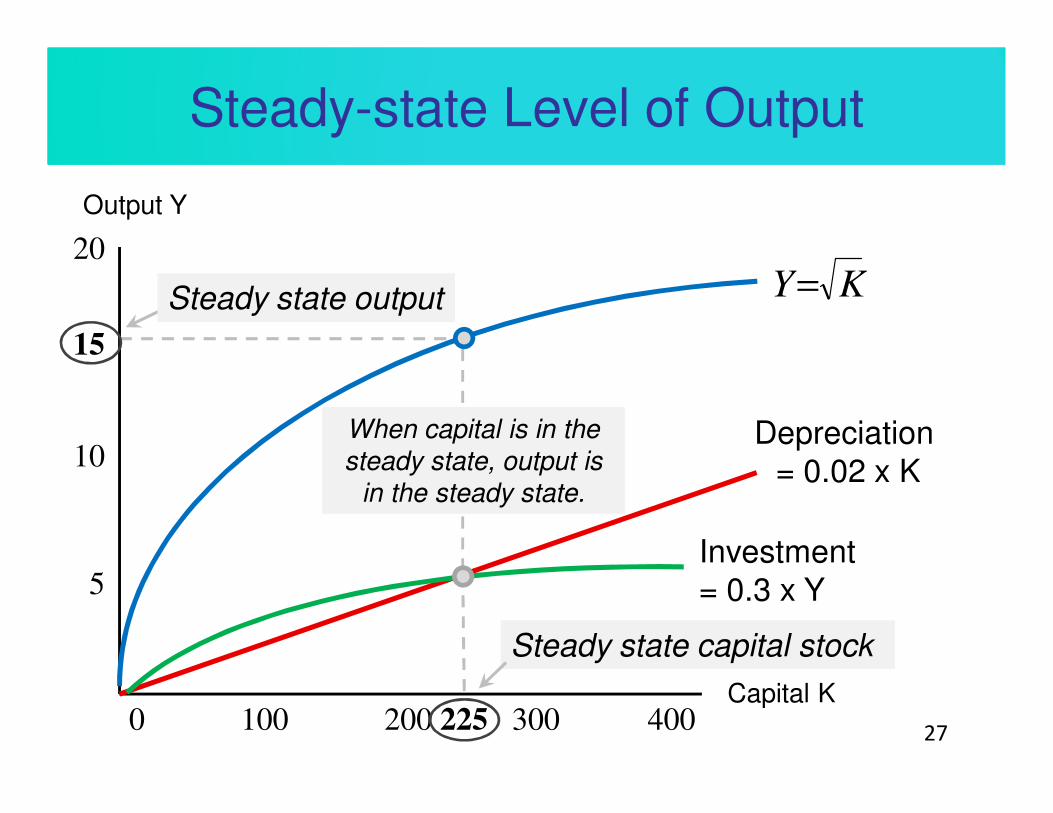
Steady-state Level of Output
270 100 200 300 400
Output Y
Depreciation
= 0.02 x K
5
10
15
Steady state capital stock Steady state capital stock
20
225
KY=
Investment
= 0.3 x Y
Capital K
Steady state outputSteady state output
When capital is in the
steady state, output is
in the steady state.
When capital is in the
steady state, output is
in the steady state.

List of Equations
� Output: Y = F (K )
� Investment: I = gY = g *
� Depreciation: D = δ * K
� Capital Stock in Year T: KT = KT-1 + I – D
� Where g is the savings rate, δ is the depreciation rate
28

Self-Check
29
If investment is greater than depreciation, the stock of capital K will:
a. increase.
b. decrease.
c. remain the same.
Answer: a – the stock of capital will increase.
The Investment Rate
30
� In the Solow model, a greater investment rate means more capital, which means more output.
� This increases a country’s steady-state level of GDP.
� Thus the Solow model predicts that countries with higher rates of investment will be wealthier.
� The level of the capital stock determines the output level but not its growth rate, at least not in the very long run.

Steady-state Level of Output
310 100 200 300 400
Output Y
Depreciation = 0.02K
5
10
15
20
225
KY=
Investment = 0.3Y
Capital K
Investment = 0.4Y
Increased investment
raises steady-state output
Increased investment
raises steady-state output

Investment and GDP
32
GDP per Capita Is Higher in Countries with Higher Investment Rates

Self-Check
33
A higher rate of investment will:
a. Increase capital but decrease output.
b. Decrease capital but increase output.
c. Increase both capital and output.
Answer: c – higher investment will increase both capital and output.

Definition
Conditional convergence:
The tendency—among countries with similar steady-state levels of output—for poorer countries to grow faster than richer countries and thus for poor and rich countries to converge in income.
34

Conditional Convergence
35The poorer the country was in 1950, the faster growth was between 1960 – 2000.
This figure is using data from 18 of the 20 founding members of the OECD (Organisation for Economic Co-operation and Development).
This figure is using data from 18 of the 20 founding members of the OECD (Organisation for Economic Co-operation and Development).
Over time the OECD countries have converged to a similar level of GDP per capita.
Over time the OECD countries have converged to a similar level of GDP per capita.

Cutting-edge Growth
36
� The simplest form of the Solow model predicts zero economic growth in the long run.
� The United States, however, has been growing for more than 200 years.
� Better ideas can keep the economy growing even in the long run.
� A computer today has about the same amount of silicon and labor input as 20 years ago, but today’s computer is much better.
� The difference is ideas.
Cutting-edge Growth
� A stand for ideas that increase productivity,
our production function is:
Y = A √Κ
� Better ideas or technological knowledge—
as represented by increases in A—
increases output even while holding K
constant, that is, an increase in A
represents an increase in productivity.

Cutting-edge Growth
An Increase in A Increases Output Holding KConstant
Conclusion:
Technological knowledge / better ideas
are the key to long run economic growth.
Solow estimated that better ideas are
responsible for ¾ of our increased
standard of living.

Cutting-edge Growth
39
Capital K
Output Y
225
15
33
506
a
b
Better ideasBetter ideas
27
Investmentold
Depreciation
Outputold
Outputnew
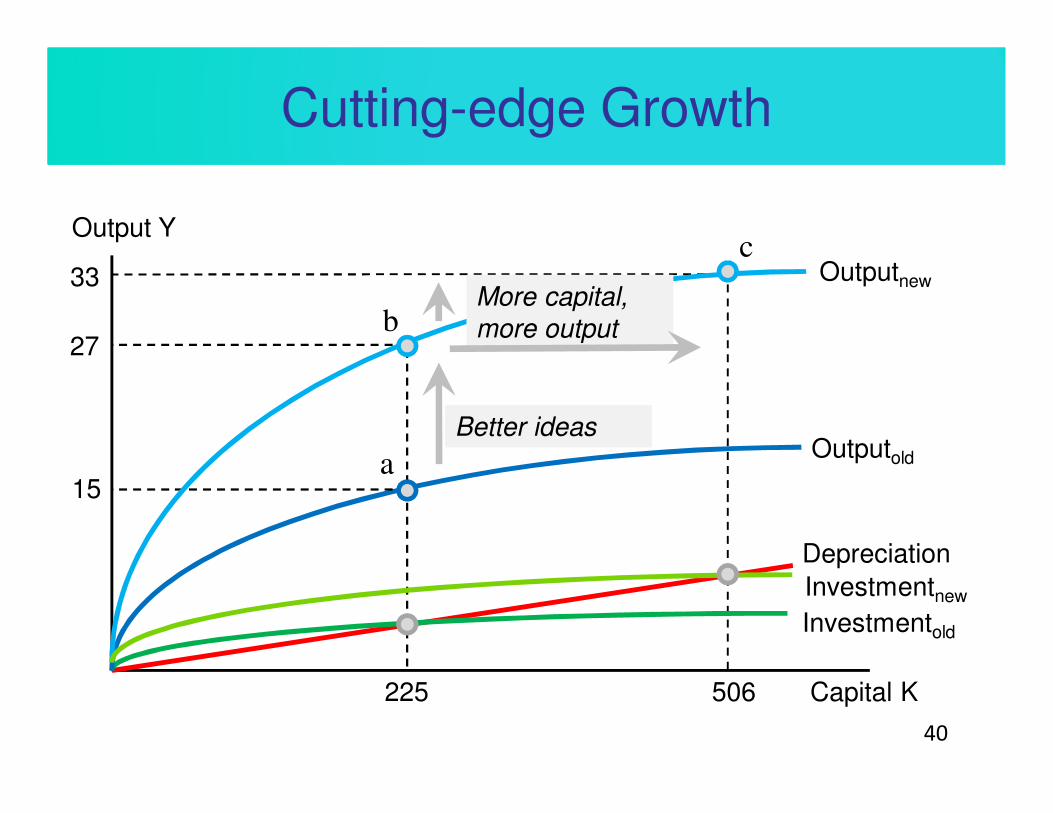
Cutting-edge Growth
40
Capital K
Output Y
225
15
33
506
27
Outputold
Outputnew
Depreciation
Investmentold
Investmentnew
Better ideasBetter ideas
More capital,
more output
More capital,
more output
a
b
c

Self-Check
41
Long-run economic growth is largely due to:
a. Better ideas.
b. Lower depreciation.
c. Higher investment.
Answer: a – long-run growth is largely due to better ideas.
The Economics of Ideas
42
1. Ideas for increasing output are primarily researched, developed, and implemented by profit-seeking firms.
2. Ideas can be freely shared, but spillovers mean that ideas are underprovided.
3. Government has a role in improving the production of ideas.
4. The larger the market, the greater the incentive to research and develop new ideas.
1. Research for Profit
43
� Institutions and incentives drive the generation of technological knowledge.
� These institutions include:
• A setting that helps innovators to connect with capitalists.
• Intellectual property rights.
• A high-quality educational system.
� The U.S. has a very good cultural and commercial infrastructure for supporting new ideas and their commercialization.

1. Research for Profit
44
• All kinds of people come up with new ideas.
• Business culture and institutions are also important.
• Ideas without financial backers are dead.
• The U.S. is good at connecting innovators with businessmen and venture capitalists.
• American culture supports entrepreneurs.

1. Research for Profit
45
Patents
� New processes, products, and methods can be copied by competitors.
� Imitators have lower costs and tend to drive innovators out of the market unless barriers prevent quick imitation.
� Patents give innovators temporary monopoly rights, typically 20 years.

1. Research for Profit
46
Patents
� Patents increase the incentive to develop new products, but they also increase monopoly power.
� Monopoly power raises prices and slows the spread of innovations throughout the economy.
� The trade-off between creating incentives for R&D while avoiding too much monopoly power is one of the trickiest in economic policy.

1. Research for Profit
47
John Kay (1704-1780) invented the “flying shuttle” used in cotton weaving, the single most important invention launching the industrial revolution.
Kay was rewarded for his efforts by having his house destroyed by “machine breakers,” afraid of job loss. He died a poor man.
John Kay, “destroyer of
jobs.”
John Kay, “destroyer of
jobs.”
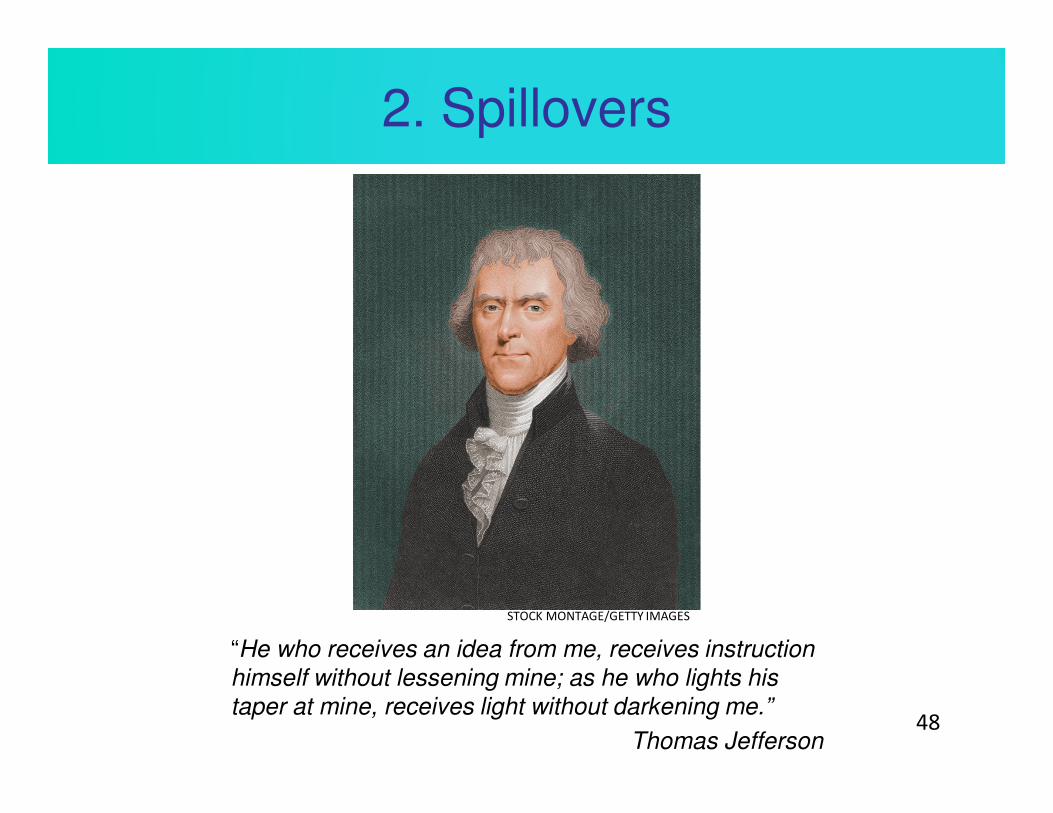
2. Spillovers
48
“He who receives an idea from me, receives instruction
himself without lessening mine; as he who lights his
taper at mine, receives light without darkening me.”
Thomas Jefferson
STOCK MONTAGE/GETTY IMAGES

Definition
Non-rivalrous:
When one person’s consumption of a good does not limit another person’s consumption.
49

2. Spillovers
50
� Even with patents, ideas tend to spill over and benefit other firms and consumers.
� Since ideas are non-rivalrous and many can be shared at low cost, they should be shared.
� However, if the originator doesn’t get enough of the benefits, ideas will be underprovided.
� Economists know that idea spillovers are good, they also know that spillovers mean that too few good ideas are produced in the first place.

2. Spillovers
3. Government’s Role
52
� The Government can increase the incentive to produce new ideas through patents.
� The government could also encourage the production of new ideas through subsidies or tax breaks.
� Universities train the scientists who research and develop new products.
� The large spillovers to basic science suggest a role for government subsidies to universities.

3. Government’s Role
53
� The Government can increase the incentive to produce new ideas through patents.
� The government could also encourage the production of new ideas through subsidies or tax breaks.
� Universities train the scientists who research and develop new products.
� The large spillovers to basic science suggest a role for government subsidies to universities.

Self-Check
54
Governments should play a role in encouraging new ideas because new ideas provide:
a. Non-rivalry.
b. Spillovers.
c. Market power.
Answer: b – governments should encourage new ideas because of spillover effects.

4. Market Size
55
� Larger markets mean increased incentives to invest in research and development.
� Innovations like pharmaceuticals, new computer chips, software, and chemicals require large R&D expenditures.
� Companies will avoid investing in innovations with small potential markets.
� As countries become wealthier, companies will increase their worldwide R&D investments.
The Future of Economic Growth
56
� Growth in per capita world GDP has been increasing.
� Worldwide per capita GDP is currently growing by a little over 3% per year.
� The number of new ideas is a function of the number of people, the incentives to innovate, and the number of ideas per hour that each person has.
A(ideas) = Population × Incentives × Ideas per hour

The Future of Economic Growth
57
� The number of people is increasing.
� As the world gets richer, the number of people whose job it is to produce new ideas is increasing.
� Because of spillovers, these ideas will benefit everyone.
� Increased consumer wealth and integrated markets boost the incentive to innovate.
� Economic growth might be even faster in the future than it has been in the past.

The Future of Economic Growth
58
Many people say that if people save too much, the economy will be hurt. They often refer to the fact that consumer spending is two-thirds of GDP to make this point. This is sometimes called the “paradox of thrift.”
Do you agree with the “paradox of thrift” for long-run growth?
a) Yes, since a high savings rate makes a country poorer in the long run.
b) No, since a high savings rate makes a country richer in the long run.

Takeaway
� The Solow model tells us that:
• Countries that devote a larger share of output to investment will be wealthier.
• Growth will be faster the farther away a country’s capital stock is from its steady-state.
• Capital accumulation cannot explain long-run economic growth.
� New ideas are the driving force behind long-run economic growth.
59
Takeaway
� Ideas can be easily copied, so the originator of a new idea won’t receive all the benefits and the incentive to produce ideas will be too low.
� Governments can play a role in supporting the production of new ideas.
� There is a trade-off between providing incentives to produce new ideas and providing incentives to share new ideas.
60