TheStructureofNegativeSocialTiesinRural VillageNetworks · = 2.6), with a range of 0 to 29; 86.7...
22
Citation: Isakov, Alexander, James H. Fowler, Edoardo M. Airoldi, and Nicholas A. Chris- takis. 2019. “The Structure of Negative Social Ties in Rural Vil- lage Networks.” Sociological Sci- ence 6: 197-218. Received: January 16, 2019 Accepted: February 10, 2019 Published: March 6, 2019 Editor(s): Jesper Sørensen, Delia Baldassarri DOI: 10.15195/v6.a8 Copyright: c 2019 The Au- thor(s). This open-access article has been published under a Cre- ative Commons Attribution Li- cense, which allows unrestricted use, distribution and reproduc- tion, in any form, as long as the original author and source have been credited. cb The Structure of Negative Social Ties in Rural Village Networks Alexander Isakov, a James H. Fowler, b Edoardo M. Airoldi, c,d Nicholas A. Christakis a a) Yale University; b) University of California, San Diego; c) Temple University; d) Harvard University Abstract: Negative (antagonistic) connections have been of longstanding theoretical importance for social structure. In a population of 24,696 adults interacting face to face within 176 isolated villages in western Honduras, we measured all connections that were present, amounting to 105,175 positive and 16,448 negative ties. Here, we show that negative and positive ties exhibit many of the same structural characteristics. We then develop a complete taxonomy of all 138 possible triads of two-type relationships. Consistent with balance theory, we find that antagonists of friends and friends of antagonists tend to be antagonists; but, in an important empirical refutation of balance theory, we find that antagonists of antagonists also tend to be antagonists, not friends. Finally, villages with comparable levels of animosity tend to be geographically proximate. Similar processes, involving social contact, give rise to both positive and negative social ties in rural villages, and negative ties play an important role in social structure. Keywords: negative ties; antagonistic ties; animosity; enemies; social networks; network structure A NIMOSITY in social relations may provide a sort of repulsive force, pushing other people in groups together. And so negative ties may affect the surround- ing network structure based on friendship. A basic theoretical conceptualization of this was codified by Georg Simmel a century ago (Simmel 1950) and advanced by Heider (1946) and Cartwright and Harary (1956). In considering very small groups composed of just three people, they proposed that certain kinds of triads can be seen as balanced or stable and others as unbalanced or unstable (Figure 1). Simply stated, friends should have the same friends and also the same “enemies.” Your friend’s antagonist cannot be your friend in a stable triad (Davis 1963). In graph-theoretic terms, this translates to requiring the product of the signs in a triangle to be positive; triangles that violate this property are deemed unbalanced. “Balance theory” thus postulates that agents seek to balance the valence in their local social systems. This can happen either by a change in sentiment, such as coming to see a friend as an antagonist, or by a change in structure, such as forming or cutting a tie (Rawlings and Friedkin 2017). Over time, it is theorized, one’s friends’ friends will tend to become one’s friends, one’s antagonists’ friends will tend to become one’s antagonists, one’s friends’ antagonists will tend to become one’s antagonists, and one’s antagonists’ antagonists will tend to become one’s friends (Rapoport 1963; Davis 1967). Friendship and animosity are thus intertwined in human social networks, and such adages are found in many cultures (Rawlings and Friedkin 2017). But balance theory also has implications for larger networks that surpass just three people (when indeed such networks afford both positive and 197
Transcript of TheStructureofNegativeSocialTiesinRural VillageNetworks · = 2.6), with a range of 0 to 29; 86.7...

Citation: Isakov, Alexander,James H. Fowler, Edoardo M.Airoldi, and Nicholas A. Chris-takis. 2019. “The Structure ofNegative Social Ties in Rural Vil-lage Networks.” Sociological Sci-ence 6: 197-218.Received: January 16, 2019Accepted: February 10, 2019Published: March 6, 2019Editor(s): Jesper Sørensen,Delia BaldassarriDOI: 10.15195/v6.a8Copyright: c© 2019 The Au-thor(s). This open-access articlehas been published under a Cre-ative Commons Attribution Li-cense, which allows unrestricteduse, distribution and reproduc-tion, in any form, as long as theoriginal author and source havebeen credited.cb
The Structure of Negative Social Ties in RuralVillage NetworksAlexander Isakov,a James H. Fowler,b Edoardo M. Airoldi,c,d NicholasA. Christakisa
a) Yale University; b) University of California, San Diego; c) Temple University; d) Harvard University
Abstract: Negative (antagonistic) connections have been of longstanding theoretical importancefor social structure. In a population of 24,696 adults interacting face to face within 176 isolatedvillages in western Honduras, we measured all connections that were present, amounting to 105,175positive and 16,448 negative ties. Here, we show that negative and positive ties exhibit many of thesame structural characteristics. We then develop a complete taxonomy of all 138 possible triadsof two-type relationships. Consistent with balance theory, we find that antagonists of friends andfriends of antagonists tend to be antagonists; but, in an important empirical refutation of balancetheory, we find that antagonists of antagonists also tend to be antagonists, not friends. Finally,villages with comparable levels of animosity tend to be geographically proximate. Similar processes,involving social contact, give rise to both positive and negative social ties in rural villages, andnegative ties play an important role in social structure.
Keywords: negative ties; antagonistic ties; animosity; enemies; social networks; network structure
ANIMOSITY in social relations may provide a sort of repulsive force, pushingother people in groups together. And so negative ties may affect the surround-
ing network structure based on friendship. A basic theoretical conceptualization ofthis was codified by Georg Simmel a century ago (Simmel 1950) and advanced byHeider (1946) and Cartwright and Harary (1956). In considering very small groupscomposed of just three people, they proposed that certain kinds of triads can beseen as balanced or stable and others as unbalanced or unstable (Figure 1). Simplystated, friends should have the same friends and also the same “enemies.” Yourfriend’s antagonist cannot be your friend in a stable triad (Davis 1963).
In graph-theoretic terms, this translates to requiring the product of the signs ina triangle to be positive; triangles that violate this property are deemed unbalanced.“Balance theory” thus postulates that agents seek to balance the valence in their localsocial systems. This can happen either by a change in sentiment, such as comingto see a friend as an antagonist, or by a change in structure, such as forming orcutting a tie (Rawlings and Friedkin 2017). Over time, it is theorized, one’s friends’friends will tend to become one’s friends, one’s antagonists’ friends will tend tobecome one’s antagonists, one’s friends’ antagonists will tend to become one’santagonists, and one’s antagonists’ antagonists will tend to become one’s friends(Rapoport 1963; Davis 1967). Friendship and animosity are thus intertwined inhuman social networks, and such adages are found in many cultures (Rawlingsand Friedkin 2017). But balance theory also has implications for larger networksthat surpass just three people (when indeed such networks afford both positive and
197

Isakov et al. Structure of Negative Social Ties
Figure 1: Experimental observations of balance theory. The first column shows the expected balanced triadsfrom traditional balance theory. In the top triangle, we expect the friend of your friend to be your friend(dashed gray line). In the next two triangles, we expect the antagonist of your friend and the friend of yourantagonist to be your antagonist (dashed red line). Finally, balance theory predicts that the antagonist ofyour antagonist is expected to be your friend (dashed gray line) rather than your antagonist. The secondcolumn shows results in a large data set of 105,175 positive and 16,448 negative ties. The inset numbersindicate the relative probability of the observed tie compared to chance. The smaller numbers represent the99.5 percent confidence interval. Column 3 shows that we validate the first three rules of balance theory butthat the fourth rule is not empirically confirmed. Rather, in reality, “the enemy of my enemy is my enemy.”
sociological science | www.sociologicalscience.com 198 March 2019 | Volume 6
Isakov et al. Structure of Negative Social Ties
negative interactions), and fundamental empirical questions arise regarding thegeodesic location and role of negative ties within social networks in ways that movebeyond triads. Recent work on the structure of negative social ties has expandedthis context to workplaces, classrooms, the Internet, and the natural world.
Antagonism in humans is an old and deeply studied topic. Classic ethnographieshave highlighted the importance of antagonistic interactions between groups andbetween pairs of individuals, including as an explanation for homicide (Chagnon1988). But the actual sociocentric mapping of negative ties in parallel with positiveties in social networks is uncommon (Everett and Borgatti 2014; Offer and Fischer2017), especially compared to the many thousands of empirical articles examiningsocial networks based on positive ties. One study examined negative ties in 129people in a sample of 31 urban communes in the United States from the 1970s(Rawlings and Friedkin 2017), and a classic study by Sampson (1969) on 18 novitiatemonks collected information about members of the group who were disliked.Studies have also mapped helpful and adversarial relationships in classrooms(Mouttapa et al. 2004; Huitsing and Veenstra 2012; Huitsing et al. 2012) andworkplaces (Labianca and Brass 2006; Xia, Yuan, and Gay 2009; Gerbasi et al. 2015),typically involving samples from a dozen to a few hundred people. In the contextof the workplace, negative interactions can affect performance (de Jong, Curseu,and Leenders 2014), and not always adversely (Marineau, Labianca, and Kane2016). And negative ties may be a particular problem in social situations that peoplecannot easily escape, such as workplaces or rural villages.
Other recent work has examined negative ties in the networks formed by wildmammals (Lea et al. 2010; Ilany et al. 2013) or online interactions (Facchetti, Iacono,and Altafini 2011). One important study of 18,819 players in a massive onlinegame involving artificial interactions found that positive ties (such as sendinga private message) substantially outnumbered negative ones (such as placing atargeted bounty) and that positive ties were reciprocated much more often thannegative ties (Szell, Lambiotte, and Thurner 2010). Studies of websites focusedon social interactions around product reviews (Massa and Avesani 2005; Guhaet al. 2014) or controversial opinions (Brzozowski, Hogg, and Szabo 2008) foundthat explicitly adding the ability to “distrust” (dislike) content offered by othersenhanced the performance of prediction algorithms. In some circumstances, onlineusers can even designate other users as “friends” or “foes,” and one study of thispractice provided support for multiplicative transitivity (“the enemy of my enemyis my friend”; Kunegis, Lommatzsch, and Bauckhage 2009). More generally, therehas been increasing interest in understanding the structure of negative ties bothempirically and algorithmically through mining signed networks from social media(for an overview, see Tang et al. 2016). Of course, the online environment is differentfrom face-to-face communities, as there is no practical limit on nominating enemiesor friends, and the underlying contexts of empirical studies are typically highlyspecific.
Models of network formation, which often build on assumptions about myopicagents interacting, also only rarely include negative interactions (Antal, Krapivsky,and Redner 2005; Kossinets and Watts 2006; Ludwig and Abell 2007; Christakis etal. 2010; Marvel et al. 2011). In such models, global network structure at any point
sociological science | www.sociologicalscience.com 199 March 2019 | Volume 6

Isakov et al. Structure of Negative Social Ties
in time is seen as emerging from the dynamic local decision rules of individualagents. For instance, if agents tend to attach to more popular actors, scaling canemerge in the degree distribution of the graph (Barabasi and Albert 1999); if peoplegenerally form connections with people who are similar, homophily is apparent(McPherson, Smith-Lovin, and Cook 2001), or if people choose to form ties withfriends’ friends, they close sets of previously open triads (Davis 1963; Louch 2000).Some of these properties, such as triadic closure and degree assortativity (thetendency of people with similar numbers of connections to be connected), have beentheorized to play a role in human evolution, as they may affect the ability of groupsto coordinate activities or resist epidemics (Fowler, Dawes, and Christakis 2009).Recently, researchers have used such structural insights to motivate new algorithmsfor predicting negative ties and generating signed networks (Derr, Aggarwal, andTang 2018; Wang et al. 2018).
But much less is theorized or known about the fundamental properties ofantagonistic networks. For instance, one might think that pairs of individualswho report negative interactions should be dissimilar (not similar) to each otheror that people with many friends should have few antagonists. Also, in principle,negative ties also need not share the same structural properties of positive ties.This is especially likely to be the case if antagonistic ties served a different overallpurpose than friendship ties over the course of human evolution (Hruschka 2010;Apicella et al. 2012; Christakis and Fowler 2014). Still, the extent and geodesiclocation of negative ties is important to human groups because negative ties mayaffect the structure of social networks, possibly affecting the ways people circulateinformation, maintain cohesion, or produce and distribute resources.
Rural villages—especially if they are isolated—provide an appealing laboratoryin which to study the prevalence, properties, and role of negative ties in socialnetworks. These are face-to-face communities, and villagers typically reside forlong periods with others in one place, can come to know everyone personally,and cannot escape unpleasant interactions. Social-network structure may also beespecially relevant to collective action in such small-scale, demanding settings,such as the ability of villagers to adopt new practices related to public health or tomaintain resources held in common (such as a health outpost).
Results
Here, we performed a large-scale, comprehensive, sociocentric network study of24,696 people aged 12 to 93 years in 176 geographically isolated villages in westernHonduras (see online supplement Table S1 for summary statistics; see Shakya et al.[2017] for additional details). We measured both positive (friendly) and negative(antagonistic) ties among all the residents within each village, also allowing subjectsto offer no opinion of each other (and hence to be “strangers”). By design, allthe networks were solely within-village networks (see the Methods section). Thevillages varied in size from 42 to 512 participants (mean = 140.3; SD = 85.6).
We ascertained 105,175 positive ties and 16,448 negative ties; hence, the overallprevalence of negative ties was 15.6 percent (measured as the number of negativeties to all ties). Figure 2 shows whole network graphs for 6 sample villages, includ-
sociological science | www.sociologicalscience.com 200 March 2019 | Volume 6

Isakov et al. Structure of Negative Social Ties
Figure 2: Six village networks of varying size and levels of antagonism. Friend ties are gray, and antagonisticties are red. The top row represents three smaller villages (N = 86, 87, and 87 from left to right), and thebottom row represents three larger villages (N = 204, 188, and 184) chosen from the 176 villages. The leftcolumn shows villages with low animosity (8.5–9.6 percent), the middle column shows villages with mediumanimosity (17.2–21.6 percent), and the right column shows villages with high animosity (40.0–32.2 percent)as measured by the ratio of negative ties to positive ties in the villages.
ing both positive and negative ties. On average, people nominated 4.3 friends (SD= 2.6), with a range of 0 to 29; 86.7 percent had between one and seven friends,and 2.4 percent reported having no friends. On the other hand, on average, peopleidentified just 0.7 other people they did not like (SD = 1.2), and a total of 65.4 percentof the subjects reported having no antagonistic ties. Although the majority of peoplereported not disliking anyone, 31.9 percent of these people actually were dislikedby others.
Interestingly, negative ties share many important structural characteristics withpositive ties. Degree distributions for both positive and negative ties across allvillages are skewed, and they have a similar shape (Figure 3A). The primary differ-ence is a leftward shift in the antagonistic distributions, reflecting the substantiallylower overall incidence of negative ties. We also found that the antagonistic tiedistributions in the villages exhibit greater variance than friendship ties, usinga procedure that conditions on the mean in a simple linear regression or usingan alternative procedure involving a simulation in which we randomly deleted
sociological science | www.sociologicalscience.com 201 March 2019 | Volume 6

Isakov et al. Structure of Negative Social Ties
Figure 3: Properties of positive and negative ties. (A) Degree distribution of friend and antagonistic ties across176 villages with 105,175 positive and 16,448 negative ties. Transparent lines represent observed cumulativedegree distributions for friends (gray) and antagonists (red) for each symmetrized village network. Solidlines represent the average distribution. Axes are log scale. (B) Increase in the odds of the ego naming thealter as an antagonist (friend) given that the alter named the ego as an antagonist (friend) based on estimatesfrom a dyadic model with fixed effects (see the Methods section). (C) Increase in the odds of an outgoing tie(x axis) based on dyadic models of social ties indicate how much a one-unit change in homophily (similarity)in each of the variables shown (y axis) is associated with increased odds of a social tie. Gray circles indicatefriends, and red squares indicate antagonists. Black lines around estimates indicate 99.5 percent confidenceintervals (see the online supplement). Both friends and antagonists show homophily on the indicated traits.(D) Pearson correlations with respect to the network degree of connected individuals. Red bars correspondto similarity in antagonist degree, and gray bars correspond to similarity in friend degree for the given socialrelationship (x axis) between pairs of nodes. Among pairs of friends, the number of friends and antagonistsis correlated, as it is among pairs of antagonists.
sociological science | www.sociologicalscience.com 202 March 2019 | Volume 6

Isakov et al. Structure of Negative Social Ties
friendship ties until they matched the number of negative ties (see Figure S1 andTable S14 in the online supplement). This suggests that the environmental, social,or biological forces affecting the formation of positive ties may generate greaterconformity than those affecting negative ties.
Both friendly and antagonistic ties exhibit reciprocity, with an observed probabil-ity of reciprocation of 33.6 percent and 5.1 percent, respectively. In model estimates(see the online supplement), the odds of an individual naming a person as a friendif they were also named as a friend by that person increased by 24.5 times (99.5percent confidence interval [CI]: 23.9, 25.1), and the odds increased by 7.9 times(99.5 percent CI: 7.0, 8.8) for a person naming another as an antagonist if they werealso named as an antagonist by that person (Figure 3B; see online supplement TableS2). In other words, people’s odds of reciprocating friendship were three timeshigher than their odds of reciprocating antagonism; this may relate to the fact thatpeople typically tell each other when they like each other but not when they dislikeeach other.
Negative ties also exhibit homophily (Figure 3C). People tend to dislike peoplewho are similar, not dissimilar. For example, using logistic regression models (seethe online supplement), individuals’ odds of being antagonists with someone of thesame sex increased 3.4 times (99.5 percent CI: 3.2, 3.7), of being antagonists withsomeone of the same health status increased 0.1 times (99.5 percent CI: 0.0, 0.2), andof being antagonists with someone for each year of similarity in age increased 0.04times (99.5 percent CI: 0.04, 0.04) (see online supplement Tables S3–S8). Thus, theprocesses that bring people of similar traits into greater contact may generate notjust friendship ties but antagonistic ties as well (Fu et al. 2012).
Positive ties and negative ties are also similar with respect to degree assortativity.People with more friends tend to be friends with one another (Pearson correlationρ = 0.263) but also antagonistic with one another, too (ρ = 0.168). Antagonisticties also exhibit assortativity within the negative-tie network itself; people withmany negative ties were preferentially likely to be antagonists with each other (ρ =0.078), but also, people with more negative ties tend to be friends with each another(Pearson correlation ρ = 0.151; Figure 3D).
The similarity in the foregoing aspects of positive and negative ties may relateto an underlying propensity to social activity. A person who never interacts withothers will have neither positive nor negative ties, so the tendency to be sociallyactive might drive the formation of both types of ties. We find evidence for this inregression models of tie presence (see online supplement Tables S9 and S10). Eachadditional friendship nomination a person gives increases the odds that they willalso name an antagonist by 0.1 times (99.5 percent CI: 0.1, 0.12).
In spite of the similarity between positive and negative ties, graphs of suchties differ in one important respect: transitivity. As predicted by balance theory,we find that positive ties are much more transitive than negative ties. Across allobservations, the transitivity in friends is 0.228, consistent with past work (Apicellaet al. 2012), but transitivity in enemies is 0.038. Due solely to chance, these twonumbers would be 0.074 (99.5 percent CI: 0.072, 0.075) and 0.016 (99.5 percent CI:0.012, 0.020), respectively (see the Methods section).
sociological science | www.sociologicalscience.com 203 March 2019 | Volume 6
Isakov et al. Structure of Negative Social Ties
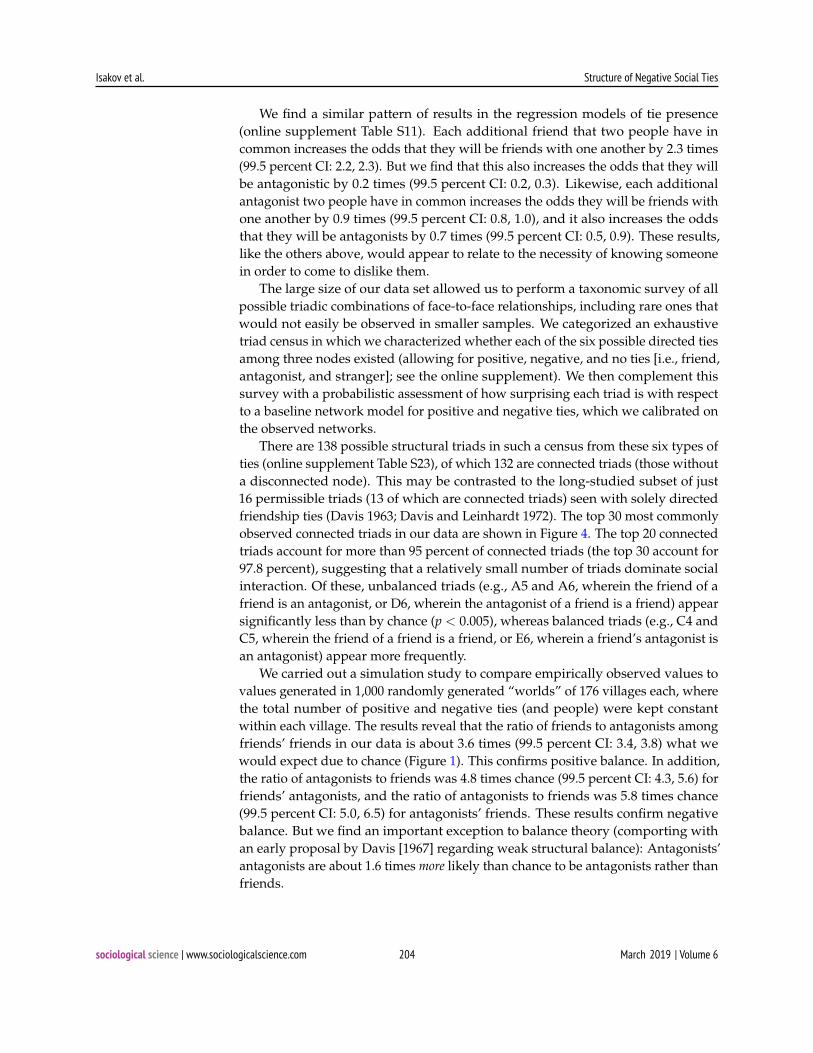
We find a similar pattern of results in the regression models of tie presence(online supplement Table S11). Each additional friend that two people have incommon increases the odds that they will be friends with one another by 2.3 times(99.5 percent CI: 2.2, 2.3). But we find that this also increases the odds that they willbe antagonistic by 0.2 times (99.5 percent CI: 0.2, 0.3). Likewise, each additionalantagonist two people have in common increases the odds they will be friends withone another by 0.9 times (99.5 percent CI: 0.8, 1.0), and it also increases the oddsthat they will be antagonists by 0.7 times (99.5 percent CI: 0.5, 0.9). These results,like the others above, would appear to relate to the necessity of knowing someonein order to come to dislike them.
The large size of our data set allowed us to perform a taxonomic survey of allpossible triadic combinations of face-to-face relationships, including rare ones thatwould not easily be observed in smaller samples. We categorized an exhaustivetriad census in which we characterized whether each of the six possible directed tiesamong three nodes existed (allowing for positive, negative, and no ties [i.e., friend,antagonist, and stranger]; see the online supplement). We then complement thissurvey with a probabilistic assessment of how surprising each triad is with respectto a baseline network model for positive and negative ties, which we calibrated onthe observed networks.
There are 138 possible structural triads in such a census from these six types ofties (online supplement Table S23), of which 132 are connected triads (those withouta disconnected node). This may be contrasted to the long-studied subset of just16 permissible triads (13 of which are connected triads) seen with solely directedfriendship ties (Davis 1963; Davis and Leinhardt 1972). The top 30 most commonlyobserved connected triads in our data are shown in Figure 4. The top 20 connectedtriads account for more than 95 percent of connected triads (the top 30 account for97.8 percent), suggesting that a relatively small number of triads dominate socialinteraction. Of these, unbalanced triads (e.g., A5 and A6, wherein the friend of afriend is an antagonist, or D6, wherein the antagonist of a friend is a friend) appearsignificantly less than by chance (p < 0.005), whereas balanced triads (e.g., C4 andC5, wherein the friend of a friend is a friend, or E6, wherein a friend’s antagonist isan antagonist) appear more frequently.
We carried out a simulation study to compare empirically observed values tovalues generated in 1,000 randomly generated “worlds” of 176 villages each, wherethe total number of positive and negative ties (and people) were kept constantwithin each village. The results reveal that the ratio of friends to antagonists amongfriends’ friends in our data is about 3.6 times (99.5 percent CI: 3.4, 3.8) what wewould expect due to chance (Figure 1). This confirms positive balance. In addition,the ratio of antagonists to friends was 4.8 times chance (99.5 percent CI: 4.3, 5.6) forfriends’ antagonists, and the ratio of antagonists to friends was 5.8 times chance(99.5 percent CI: 5.0, 6.5) for antagonists’ friends. These results confirm negativebalance. But we find an important exception to balance theory (comporting withan early proposal by Davis [1967] regarding weak structural balance): Antagonists’antagonists are about 1.6 times more likely than chance to be antagonists rather thanfriends.
sociological science | www.sociologicalscience.com 204 March 2019 | Volume 6

Isakov et al. Structure of Negative Social Ties
Figure 4: Illustration of the top 30 empirically observed connected triads. This shows the 30 most numerous ofthe 132 possible directed connected triads (those without a completely disconnected node) across all villagesordered by the total number of observations. Gray ties represent friendship; red ties represent antagonism.Total counts are shown below each triad as well as their percentage representation among connected triads.Comparison to simulated random networks (N = 1,000) is shown at the bottom of each cell; “higher” meansthat the triad appears in villages more often, and “lower” means that the triad appears in villages lessoften than is due to chance alone (p < 0.005). Letters A through E (top row) and numbers 1 through 6 (leftcolumn) are guides for easier cell identification. The full Heterogenous Triad Census is shown in the onlinesupplement (Table S23).
sociological science | www.sociologicalscience.com 205 March 2019 | Volume 6

Isakov et al. Structure of Negative Social Ties
Although balance is observed for both positive and negative ties, we find astronger effect for friends. Subjects are 1.42 times more likely to form any kind ofrelationship (positive or negative) with their friends’ social contacts than with theirantagonists’ social contacts, and this value lies outside the 99.5 percent confidenceinterval of the randomly permuted networks (mean = 0.98; 99.5 percent CI: 0.93,1.02). These results suggest that there are two mechanisms promoting positivebalance in human social networks: (1) an attentional mechanism, whereby subjectspay more attention to their friends’ social contacts; and (2) an affective mechanism,whereby subjects are more likely to like their friends’ friends than to dislike theirfriends’ antagonists.
Given the evidence for the existence of positive and negative balance in thesevillage networks, we evaluated the structural location of negative ties not only intriadic relationships but also in higher-order network features, such as networkcommunities within each village. We used a fast-greedy community-detectionalgorithm to partition each village network based on their positive ties alone. Wethen studied the location of antagonistic ties relative to these communities (for anexample, see Figure 5). Negative ties are about 3.0 times more likely to lie betweencommunities than within communities, suggesting that antagonistic connectionsmay contribute to fissures within networks (or vice versa). However, that ratio isless than we would expect due to chance. In 1,000 randomly permuted networks,antagonists were 5.5 times (99.5 percent CI: 5.1, 5.9) more likely to exist betweencommunities than within them. In other words, although the great majority ofantagonistic ties are between groups, the probability that a given tie within agroup is negative is higher than the probability between groups. This result isconsistent with the finding that antagonistic ties exhibit homophily and depend onsocial interactions, and it gives still more credence to the adage “familiarity breedscontempt.” A sensitivity analysis using additional community-detection methods(see the online supplement) confirms that our substantive results are not sensitiveto the method used (Clauset, Newman, and Moore 2004; Newman and Girvan 2004;Blondel et al. 2008).
Next, we studied whether two individuals are likely to be in the same networkcommunity if one of them is named as a social contact by the other’s social contacts.We find that the friend of a friend is 3.0 times (99.5 percent CI: 2.9, 3.1) more likelyto be to be in the same community than expected due to chance. However, thenumbers are much lower for any set of relations containing a negative tie. Thefriend of an antagonist is only 1.5 times (99.5 percent CI: 1.4, 1.5) more likely thanby chance to be in the same community, the antagonist of a friend is 1.5 times (99.5percent CI: 1.5, 1.6) more likely, and the antagonist of an antagonist is 1.8 times (99.5percent CI: 1.7, 1.9) more likely. This may help to explain why the only two-degreerelationship that is associated with a friendship is the friend of a friend. We findour friends and our antagonists in the same network communities.
Finally, whereas the mean percentage of negative ties (i.e., the number of an-tagonistic ties divided by the number of friendship ties) was 16.0 percent, thepercentage of antagonism varied substantially across villages, from 1.1 percent to40.0 percent. A topographical map of the villages is shown in Figure 6A (colorsrepresent the prevalence of animosity: red = higher than median, black = lower than
sociological science | www.sociologicalscience.com 206 March 2019 | Volume 6

Isakov et al. Structure of Negative Social Ties
Figure 5: Illustration of between-community versus within-community ties. In this network from one village(N = 162 people), node colors represent distinct communities detected by a fast-greedy algorithm, grayties represent friendship, light-red ties represent between-community antagonistic ties, and dark-red tiesrepresent within-community antagonistic ties. In the observed data, there are three times more antagonisticties between communities than within communities. But this is less than we would expect due to chance,suggesting that frequent social contact within communities may contribute to the formation of antagonisticties. The inset shows the real mean ratio (left bar) compared to the mean and 99.5 percent confidence intervalof more than 1,000 sets of 176 random networks of villages (right bar; see the Methods section).
median; point sizes correspond to village size: smallest = <150 people, medium =150–300 people, and large = >300 people). Most villages (68 percent) have the sameprevalence level of animosity (defined as the ratio of negative ties divided by allties) as their nearest neighbor, which is significantly more than due to chance (p <
0.005). In 1,000 randomly permuted networks, on average, 50 percent of villageshad the same level of animosity (99.5 percent CI: 37.2 percent, 63.3 percent). A set ofmodels evaluating village-level variables (such as population, population density,elevation, wealth, infrastructure, and the prevalence of antagonism in the closestneighboring village; Figure 6B and online supplement Tables S15–S22) shows thatonly nearest-village antagonism has a statistically significant association with thelevel of antagonism (p < 0.005), including in multivariate models. However, there is
sociological science | www.sociologicalscience.com 207 March 2019 | Volume 6

Isakov et al. Structure of Negative Social Ties
Figure 6: Analysis of village-level antagonism prevalence. (A) Topographical map of villages by size andprevalence of antagonism (N = 176 villages). Colors represent the prevalence of antagonism (ratio of negativeties to positive-plus-negative ties; red = higher than median, and black = lower than median; namely, 12.8percent). Point sizes correspond to village size (from smallest to largest: <150 people, 150–300 people,and >300 people). The inset shows the observed percentage of villages (67.6 percent) that have the sameantagonism prevalence (low or high) as their nearest geographic neighbor (“as the crow flies”) compared toa simulation in which antagonism levels are randomly permuted among villages (N = 1,000 simulations);the black bar represents a 99.5 percent confidence interval. There is significant geographic clustering ofantagonism prevalence (p < 0.005). (B) Percentage increase in antagonism prevalence (x axis) based onbivariate models of village-level variables indicating how much a one–standard-deviation change in each ofthe variables shown (y axis) is associated with an increased prevalence of antagonism from an ordinary leastsquares (OLS) estimate. A one-unit change is shown for factor variables (e.g., wealth and electricity). Theestimate for elevation includes a squared term, and the change is calculated from an elevation centered onthe maximum of the parabola, so only the effect of the squared term is shown. Black lines around estimatesindicate 99.5 percent confidence intervals (see the online supplement).
some evidence that villages at an intermediate elevation have the highest prevalenceof antagonism, even after controlling for the antagonism of the closest neighboringvillage (p < 0.05).
Discussion
Real social networks manifest friendship and antagonism concurrently. People canform positive and negative (or no) sentiments regarding people with whom theyinteract, and antagonistic relations are important determinants of individual andgroup behavior (Labianca and Brass 2006). Villages in the developing world (such asour setting in Honduras) offer an especially appealing natural laboratory to evaluatethe structure of negative ties because they are relatively closed social systems where
sociological science | www.sociologicalscience.com 208 March 2019 | Volume 6

Isakov et al. Structure of Negative Social Ties
people cannot easily avoid others whom they may come to dislike. In this setting,we find that apparently similar underlying social processes (based on sustained andrepeated interactions) result in positive and negative ties having generally similarstructural properties, qualitatively speaking. Nevertheless, negative ties are alsodifferent; quantitatively, they are less common, somewhat less homophilous, andless often reciprocated.
In addition, we find that people with more friends also have more antagonists.And we find substantial empirical support, on a large scale, for certain (but notall) aspects of balance theory long theorized to affect triadic social interactions andthe networks that they give rise to. People tend to have negative ties with theirfriends’ antagonists and their antagonists’ friends, and they avoid negative tieswith their friends’ friends. People also tend to form numerically more negative tieswith members of other network communities rather than members of their own,which is in keeping with theories about social cohesion (Kawachi and Berkman2000). These phenomena suggest that negative ties play a role in the structure ofnetworks otherwise based solely on positive ties.
Despite their possible implications, less work has been done to ascertain antagonistic-relationship frequency in real social networks, and estimates can vary accordingto how the ties are ascertained (White 1961; Labianca and Brass 2006, Leskovec,Huttenlocher, and Kleinberg 2010; Szell et al. 2010; Offer and Fischer 2017). Wefind that negative ties are not uncommon (16.0 percent on average, expressed as thefraction of negative ties to positive ties). We also find that this percentage variedwidely across villages (from 1.1 percent to 40 percent). The prevalence of antagonis-tic ties seems to vary geographically, with nearby villages showing similar levelsof antagonism. Assessing how the frequency and, possibly, structural location ofnegative ties varies according to environmental circumstances or according to theweight of the ties (e.g., whether someone “hates” or merely “does not get alongwith” another person) is an important area for future work.
Social networks based on positive ties—from diverse settings ranging fromforagers (Apicella et al. 2012) to agropastoralists (Glowacki et al. 2016) to villagers(Banerjee et al. 2013; Kim et al. 2015) to city dwellers (Barabasi and Albert 1999;Onnela et al. 2007; Palla, Barabasi, and Vicsek 2007; Bond et al. 2012)—sharestructural similarities. This similarity has led to the proposition that their formationdepends on fundamental properties of humans and their interactions and that itis shaped by natural selection in ways that affect a diverse set of human socialbehaviors and our evolved psychology (Tooby and Cosmides 1996; Hruschkaand Henrich 2006; Christakis and Fowler 2014). Evolutionary forces may thusalso have shaped how we think and feel about, and how we pick, our enemies.Individuals and groups might possibly benefit from these properties if, for instance,the community structure of the networks around individuals is relevant to theiroutcomes.
In principle, negative ties could serve a valuable purpose in social networks,just as they do in situations far beyond social networks; for instance, they are crit-ical component for the proper functioning and synchronization of brain patterns(Bargmann and Marder 2013; Isakov and Mahadevan 2014) and in deep learningalgorithms (Marblestone, Wayne, and Kording 2016). One purpose might be to
sociological science | www.sociologicalscience.com 209 March 2019 | Volume 6

Isakov et al. Structure of Negative Social Ties
play a role in structuring networks for some sort of social optimality, such as thatinvolving cooperation. A shared antagonist may not only foster cohesion amongmembers of groups as a whole but also among pairs of individuals. For instance, Amay be more likely to cooperate with B if they have C as a common enemy ratherthan as a common friend. Prior experimental work has shown that people cut tiesto those who take advantage of them in cooperative interactions and that this kindof “decentralized ostracism” helps stabilize cooperation (Rand, Arbesman, andChristakis 2011). Possibly, having antagonists could work analogously, stabilizingcooperation. Future experiments could shed light on this. Furthermore, future workassessing the relationship of negative ties to subsequent village-level collective ac-tion (such as the maintenance of property held in common), exploiting longitudinaldata, would also shed light on why some developing-world villages fare better thanothers during development initiatives; possibly, an in-between level of antagonismmight be optimal in this regard.
The theorized psychological mechanism underlying balance theory is cognitivedissonance: the state of mental stress a person experiences while holding twoconflicting beliefs, ideas, or values. The theory postulates that it imposes toohigh a cognitive load to see both the good and bad in others, and so people aredichotomized into two categories (Festinger 1962). Balance may be preferred byhumans simply because it is easier to encode balanced social relations into memory(Brashears and Brashears 2016). Structural balance may therefore reflect the social-psychological interdependencies that strain cognitive consistency (Heider 1946;Cartwright and Harary 1956; Rawlings and Friedkin 2017). Our work comportswith these theories of the evolved psychology of antagonistic ties. Still, we did notascertain actual mechanisms for ties forming or breaking nor subjects’ beliefs aboutnotions of balance. Moreover, we did not have longitudinal information about thenetwork. The empirical dynamics of signed social networks is another importantarea for future work.
Social conflict is ubiquitous, and not just in rural villages. Our networks and ourpsychology reflect this. But antagonistic ties might actually be constructive, playinga crucial role in the structure of social relations in human groups.
Methods
Data
Data were collected in the Copan province of western Honduras in 2016. The samplepopulation included only people older than age 12 years in 176 villages. We wereable to census 30,820 of these people in the target villages (94 percent), and of these,24,696 (81 percent) participated in our full survey and in detailed geographic andsociocentric mapping. We used our custom Trellis software platform (available attrellis.yale.edu) and tablet-based surveys administered face to face in order to collectdetailed social-network information with three name generators to determine (oftenoverlapping) positive ties (“Who do you spend your free time with?” “Who is yourclosest friend?” and “Who do you discuss personal matters with?”) and one namegenerator for negative ties (“Who are the people with whom you do not get along
sociological science | www.sociologicalscience.com 210 March 2019 | Volume 6

Isakov et al. Structure of Negative Social Ties
well?”). People could, and sometimes did, name their siblings for these ties (10.2percent and 0.6 percent of all positive and negative ties, respectively). Because thevillages were small and were sociocentrically mapped, unnamed individuals withwhom the respondent had no particular relationship could be labelled as strangersin the sense that they were neither friends nor antagonists. By design, all ties werediscerned within each village (in any case, only a minority of meaningful ties wereoutside the villages).
There are various questions that could be used to tap into different sorts orlevels of antagonism, such as “hatred” or “annoyance,” but we decided that generalnegative affect is most epitomized by “do not like” (in Spanish) and that this wouldalso be more frequent than many alternatives. One problem with self-reportedantagonistic ties in general is that people display a reticence to speak negativelyof other people in their communities because of social desirability (see the onlinesupplement). And although observing friendship via proxies, such as spendingtime together, is feasible, it is harder to discern the difference between enemies andstrangers without directly asking subjects.
The social networks were drawn with Cytoscape (Shannon et al. 2003) usinga force-directed layout algorithm. Edge colors indicate relationship status (gray =friends; red = antagonists). Arrows indicate the nomination direction.
Approval for this study was obtained from the Ministry of Health in Hondurasand from the Yale University Institutional Review Board. Informed consent wasobtained from all participants. Full code and a sample of data for 11 villages areavailable on our lab website.
Heterogenous Triad Census and Social Rules
We performed an exhaustive search to determine the full triad census on a net-work with directed ties (both positive and negative). We also calculated thetotal number of times each of the following social rules was true for each ego(the number of triads of the form “the X of my Y is my Z,” where X, Y, Z ∈{ f riend, antagonist, stranger}). See the online supplement for additional details.
Comparisons to Empirically Calibrated Random Networks
We generated random worlds wherein each world consisted of the full set of 176permuted village networks. Each village network had random rewiring of friendand antagonistic ties, ensuring that the total number of each tie type remainedconstant, which is the same as in the observed networks. Additionally, we testedbalance with exponential random graph models (ERGMs) using XPNet (Wang,Robins, and Pattison 2009) and found qualitatively similar results, although thismethod presented significant convergence issues.
Statistical Modeling
To explore associations between the structure of networks with negative ties, we fitgeneralized linear models with a logit link function to the data in order to estimate
sociological science | www.sociologicalscience.com 211 March 2019 | Volume 6

Isakov et al. Structure of Negative Social Ties
the association between the existence of social ties in a village and various networkcharacteristics. The basic model at the dyad level is
E[Yego,alter
]= µ = g−1(α + β1xego + β2xalter + β3
(−∣∣xego − xalter
∣∣)+ γv)
g (µ) = ln(
µ
1− µ
).
Here, Yego,alter is 1 if ego i nominates alter j as a friend (antagonist), xego is avector of characteristics for ego, xalter is a vector of characteristics for alter, and|xego − xalter | is the absolute difference in characteristics between the ego and alter.The coefficients β1 and β2 indicate how much a unit change in the independentvariable is associated with an increase in the log odds of the existence of a tie,and β3 indicates how much homophily (ego–alter similarity) on the independentvariable is associated with the corresponding increase in the log odds. The signsare chosen such that higher values correspond to people with social ties that aremore similar to one another than people without social ties. To account for potentialdifferences attributable to the particular village where the ego and alter live, weinclude village fixed effects (γv). Here, α is a constant, which we drop when fixedeffects are included.
To compare friendly and antagonistic ties, we measured their propensity to existbetween ego–alter pairs. Measured personal characteristics (including ego and alterage, sex, whether they identify with a religion, indigenous status, a dichotomizedmeasure of household wealth, and a dichotomized measure of health) and networkcharacteristics (in-degree, out-degree, reciprocity, and the number of commonfriends and/or antagonists) were tested for association with the probability of apositive or negative tie in bivariate models without controls (see online supplementTable S1 for summary statistics). These models include a measurement for theego, alter, and similarity between them (see online supplement Tables S2–S11).Throughout, we used a significance value of p < 0.005 (Benjamin et al. 2018).
To make comparisons, we used the models to estimate the percentage increasesin the odds of forming a social tie associated with changing the independent variableby one unit and holding all other variables constant.
To explore what village-level characteristics may contribute to the prevalence ofnegative ties, we fit linear regressions to the data. The basic model at the villagelevel is
E [Yi] = α + βxi,
where the dependent variable Yi is the prevalence of antagonism (the ratio ofthe number of negative ties to the number of all ties [i.e., the sum of positiveand negative ties]) in village i, xi is a vector of village characteristics, and β is avector of coefficients that indicate the degree of association with each characteristic.Measured village-level characteristics are village size, population density (measuredas the average distance between households), village elevation, a wealth index,level of infrastructure (measured as whether there is electricity), and prevalence ofanimosity in the closest neighboring village. Again, we used a significance value
sociological science | www.sociologicalscience.com 212 March 2019 | Volume 6

Isakov et al. Structure of Negative Social Ties
of p < 0.005. To make comparisons at the village level, we used the models toestimate the increase in the prevalence of animosity associated with changing theindependent variable by one standard deviation (one unit for factor variables) andholding all other variables constant.
References
Antal, Tibor, Pavel L. Krapivsky, and Sidney Redner. 2005. “Dynamics of Social Balanceon Networks.” Physical Review E 72:036121. https://doi.org/10.1103/PhysRevE.72.036121.
Apicella, Coren L., Frank W. Marlowe, James H. Fowler, and Nicholas A. Christakis. 2012.“Social Networks and Cooperation in Hunter-Gatherers.” Nature 481:497. https://doi.org/10.1038/nature10736.
Banerjee, Abhijit, Arun G. Chandrasekhar, Esther Duflo, and Matthew O. Jackson. 2013. “TheDiffusion of Microfinance.” Science 341:1236498. https://doi.org/10.1126/science.1236498.
Barabasi, Albert-Laszlo, and Reka Albert. 1999. “Emergence of Scaling in Random Networks.”Science 286:509–12. https://doi.org/10.1126/science.286.5439.509.
Bargmann, Cornelia I., and Eve Marder. 2013. “From the Connectome to Brain Function.”Nature Methods 10:483. https://doi.org/10.1038/nmeth.2451.
Benjamin, Daniel J., James O. Berger, Magnus Johannesson, Brian A. Nosek, E. J. Wagenmak-ers, Richard Berk, Kenneth A. Bollen, Bjorn Brembs, Lawrence Brown, Colin Camerer,David Cesarini, Christopher D. Chambers, Merlise Clyde, Thomas D. Cook, Paul DeBoeck, Zoltan Dienes, Anna Dreber, Kenny Easwaran, Charles Efferson, Ernst Fehr, FionaFidler, Andy P. Field, Malcolm Forster, Edward I. George, Richard Gonzalez, StevenGoodman, Edwin Green, Donald P. Green, Anthony Greenwald, Jarrod D. Hadfield,Larry V. Hedges, Leonhard Held, Teck Hua Ho, Herbert Hoijtink, James Holland Jones,Daniel J. Hruschka, Kosuke Imai, Guido Imbens, John P. A. Ioannidis, Minjeong Jeon,Michael Kirchler, David Laibson, John List, Roderick Little, Arthur Lupia, EdouardMachery, Scott E. Maxwell, Michael McCarthy, Don Moore, Stephen L. Morgan, MarcusMunafó, Shinichi Nakagawa, Brendan Nyhan, Timothy H. Parker, Luis Pericchi, MarcoPerugini, Jeff Rouder, Judith Rousseau, Victoria Savalei, Felix D. Schönbrodt, ThomasSellke, Betsy Sinclair, Dustin Tingley, Trisha Van Zandt, Simine Vazire, Duncan J. Watts,Christopher Winship, Robert L. Wolpert, Yu Xie, Cristobal Young, Jonathan Zinman, andValen E. Johnson. 2018. “Redefine Statistical Significance.” Nature Human Behavior 2:6.
Blondel, Vincent D., Jean-Loup Guillaume, Renaud Lambiotte, and Etienne Lefebvre. 2008.“Fast Unfolding of Communities in Large Networks.” Journal of Statistical Mechanics2008:P10008. https://doi.org/10.1088/1742-5468/2008/10/P10008.
Bond, Robert M., Christopher J. Fariss, Jason J. Jones, Adam D. I. Kramer, Cameron Mar-low, Jaime E. Settle, and James H. Fowler. 2012. “A 61-Million-Person Experiment inSocial Influence and Political Mobilization.” Nature 489:295. https://doi.org/10.1038/nature11421.
Brashears, Matthew E., and Laura Aufderheide Brashears. 2016. “The Enemy of My FriendIs Easy to Remember: Balance as a Compression Heuristic.” Pp. 1–31 in Advances inGroup Processes, edited by S. R. Thye and E. J. Lawler. Bingley, United Kingdom: EmeraldPublishing Group Limited.
sociological science | www.sociologicalscience.com 213 March 2019 | Volume 6
Isakov et al. Structure of Negative Social Ties
Brzozowski, Michael J., Tad Hogg, and Gabor Szabo. 2008. “Friends and Foes: IdeologicalSocial Networking.” Proceedings of the SIGCHI Conference on Human Factors in ComputingSystems 817–20. https://doi.org/10.1145/1357054.1357183.
Cartwright, Dorwin, and Frank Harary. 1956. “Structural Balance: A Generalization ofHeider’s Theory.” Psychological Review 63:277. https://doi.org/10.1037/h0046049.
Chagnon, Napoleon A. 1988. “Life Histories, Blood Revenge, and Warfare in a TribalPopulation.” Science 239:985–92. https://doi.org/10.1126/science.239.4843.985.
Christakis, Nicholas A., and James H. Fowler. 2014. “Friendship and Natural Selection.”Proceedings of the National Academy of Sciences 111:10796–801. https://doi.org/10.1073/pnas.1400825111.
Christakis, Nicholas A., James H. Fowler, Guido W. Imbens, and Karthik Kalyanaraman. 2010.“An Empirical Model for Strategic Network Formation.” National Bureau of EconomicResearch, Working Paper w16039. https://ssrn.com/abstract=1617041.
Clauset, Aaron, Mark E. J. Newman, and Cristopher Moore. 2004. “Finding CommunityStructure in Very Large Networks.” Physical Review E 70:066111. https://doi.org/10.1103/PhysRevE.70.066111.
Davis, James A. 1963. “Structural Balance, Mechanical Solidarity, and Interpersonal Rela-tions.” American Journal of Sociology 68:444–62. https://doi.org/10.1086/223401.
Davis, James A. 1967. “Clustering and Structural Balance in Graphs.” Human Relations20:181–7. https://doi.org/10.1177/001872676702000206.
Davis, James A., and Samuel Leinhardt. 1972. “The Structure of Positive Inter-PersonalRelations in Small Groups.” Pp. 218–51 in Sociological Theories in Progress, edited by J.Berger, M. Zelditch, and B. Anderson. Boston, MA: Houghton Mifflin.
de Jong, Jeroen P., Petru L. Curseu, and Roger Th. A. J. Leenders. 2014. “When Do BadApples not Spoil the Barrel? Negative Relationships in Teams, Team Performance, andBuffering Mechanisms.” Journal of Applied Psychology 99:514. https://doi.org/10.1037/a0036284.
Derr, Tyler, Charu Aggarwal, and Jiliang Tang. 2018. “Signed Network Modeling Based onStructural Balance Theory.” Proceedings of the 27th ACM International Conference on Informa-tion and Knowledge Management 557–66. https://doi.org/10.1145/3269206.3271746.
Everett, Martin G., and Stephen P. Borgatti. 2014. “Networks Containing Negative Ties.”Social Networks 38:111–20. https://doi.org/10.1016/j.socnet.2014.03.005.
Facchetti, Giuseppe, Giovanni Iacono, and Claudio Altafini. 2011. “Computing GlobalStructural Balance in Large-Scale Signed Social Networks.” Proceedings of the NationalAcademy of Sciences 108:20953–8. https://doi.org/10.1073/pnas.1109521108.
Festinger L. 1962. A Theory of Cognitive Dissonance. Vol. 2. Stanford, CA: Stanford UniversityPress.
Fowler, James H., Christopher T. Dawes, and Nicholas A. Christakis. 2009. “Model of GeneticVariation in Human Social Networks.” Proceedings of the National Academy of Sciences106:1720–4. https://doi.org/10.1073/pnas.0806746106.
Fu, Feng, Martin A. Nowak, Nicholas A. Christakis, and James H. Fowler. 2012. “The Evolu-tion of Homophily.” Scientific Reports 2:845. https://doi.org/10.1038/srep00845.
Gerbasi, Alexandra, Christine L. Porath, Andrew Parker, Gretchen Spreitzer, and Rob Cross.2015. “Destructive De-energizing Relationships: How Thriving Buffers Their Effect onPerformance.” Journal of Applied Psychology 100:1423–33. https://doi.org/10.1037/apl0000015.
sociological science | www.sociologicalscience.com 214 March 2019 | Volume 6

Isakov et al. Structure of Negative Social Ties
Glowacki, Luke, Alexander Isakov, Richard W. Wrangham, Rose McDermott, James H.Fowler, and Nicholas A. Christakis. 2016. “Formation of Raiding Parties for IntergroupViolence Is Mediated by Social Network Structure.” Proceedings of the National Academy ofSciences 113:12114–9. https://doi.org/10.1073/pnas.1610961113.
Guha, Ramanthan, Ravi Kumar, Prabhakar Raghavan, and Andrew Tomkins. 2014. “Propa-gation of Trust and Distrust.” Proceedings of the 13th International Conference on World WideWeb 403–12.
Heider, Fritz. 1946. “Attitudes and Cognitive Organization.” Journal of Psychology 21:107–12.https://doi.org/10.1080/00223980.1946.9917275.
Hruschka, Daniel J. 2010. Friendship: Development, Ecology, and Evolution of a Relationship.Berkeley, CA: University of California Press. https://doi.org/10.1525/california/9780520265462.001.0001.
Hruschka, Daniel J., and Joseph Henrich. 2006. “Friendship, Cliquishness, and the Emergenceof Cooperation.” Journal of Theoretical Biology 239:1–15. https://doi.org/10.1016/j.jtbi.2005.07.006.
Huitsing, Gijs, and René Veenstra. 2012. “Bullying in Classrooms: Participant Roles froma Social Network Perspective.” Aggressive Behavior 38:494–509. https://doi.org/10.1002/ab.21438.
Huitsing, Gijs, Marijtje A. J. van Duijn, Tom A. B. Snijders, Peng Wang, Miia Sainio, ChristinaSalmivalli, and René Veenstra. 2012. “Univariate and Multivariate Models of Positive andNegative Networks: Liking, Disliking, and Bully–Victim Relationships.” Social Networks34:645–57. https://doi.org/10.1016/j.socnet.2012.08.001.
Ilany, Amiyaal, Adi Barocas, Lee Koren, Michael Kam, and Eli Geffen. 2013. “StructuralBalance in the Social Networks of a Wild Mammal.” Animal Behavior 85:1397–405. https://doi.org/10.1016/j.anbehav.2013.03.032.
Isakov, Alexander, and Lakshminarayanan Mahadevan. 2014. “Synchronization in a Stochas-tic Hebbian Network of Phase Oscillators.” Cornell University. https://arxiv.org/abs/1404.2328.
Kawachi, Ichiro, and Lisa Berkman. 2000. “Social Capital, Social Cohesion, and Health.” Pp.174 in Social Epidemiology, edited by L. Berkman, I. Kawachi, and M. Glymour. New York,NY: Oxford University Press.
Kim, David A., Alison R. Hwong, Derek Stafford, D. Alex Hughes, A. James O’Malley, JamesH. Fowler, and Nicholas A. Christakis. 2015. “Social Network Targeting to MaximisePopulation Behaviour Change: A Cluster Randomised Controlled Trial.” Lancet 386:145–53. https://doi.org/10.1016/S0140-6736(15)60095-2.
Kossinets, Gueorgi, and Duncan J. Watts. 2006. “Empirical Analysis of an Evolving SocialNetwork.” Science 311:88–90. https://doi.org/10.1126/science.1116869.
Kunegis, Jerome, Andreas Lommatzsch, and Christian Bauckhage. 2009. “The SlashdotZoo: Mining a Social Network with Negative Edges.” Proceedings of the 18th internationalConference on World Wide Web 741–50. https://doi.org/10.1145/1526709.1526809.
Labianca, Giuseppe, and Daniel J. Brass. 2006. “Exploring the Social Ledger: NegativeRelationships and Negative Asymmetry in Social Networks in Organizations.” Academyof Management Review 31:596–614. https://doi.org/10.5465/amr.2006.21318920.
Lea, Amanda J., Daniel T. Blumstein, Tina W. Wey, and Julien G. A. Martin. 2010. “HeritableVictimization and the Benefits of Agonistic Relationships.” Proceedings of the NationalAcademy of Sciences 107:21587–92. https://doi.org/10.1073/pnas.1009882107.
sociological science | www.sociologicalscience.com 215 March 2019 | Volume 6

Isakov et al. Structure of Negative Social Ties
Leskovec, Jure, Daniel Huttenlocher, and Jon Kleinberg. 2010. “Signed Networks in SocialMedia.” Proceedings of the SIGCHI Conference on Human Factors in Computing Systems1361–70. https://doi.org/10.1145/1753326.1753532.
Louch, Hugh. 2000. “Personal Network Integration: Transitivity and Homophily in Strong-Tie Relations.” Social Networks 22:45–64. https://doi.org/10.1016/S0378-8733(00)00015-0.
Ludwig, Mark, and Peter Abell. 2007. “An Evolutionary Model of Social Networks.” EuropeanPhysical Journal B 58:97–105. https://doi.org/10.1140/epjb/e2007-00200-x.
Marblestone, Adam H., Greg Wayne, and Konrad P. Kording. 2016. “Toward an Integrationof Deep Learning and Neuroscience.” Frontiers in Computational Neuroscience 10:94. https://doi.org/10.3389/fncom.2016.00094.
Marineau, Joshua E., Giuseppe Joe Labianca, and Gerald C. Kane. 2016. “Direct andIndirect Negative Ties and Individual Performance.” Social Networks 44:238–52. https://doi.org/10.1016/j.socnet.2015.09.003.
Marvel, Seth A., Jon Kleinberg, Robert D. Kleinberg, and Steven H. Strogatz. 2011.“Continuous-Time Model of Structural Balance.” Proceedings of the National Academyof Sciences 108:1771–6. https://doi.org/10.1073/pnas.1013213108.
Massa, Paolo, and Paolo Avesani. 2005. “Controversial Users Demand Local Trust Metrics:An Experimental Study on Epinions.com Community.” AAAI 121–6.
McPherson, Miller, Lynn Smith-Lovin, and James M. Cook. 2001. “Birds of a Feather: Ho-mophily in Social Networks.” Annual Review of Sociology 27:415–44. https://doi.org/10.1146/annurev.soc.27.1.415.
Mouttapa, Michele, Tom Valente, Peggy Gallaher, Louise Ann Rohrbach, and Jennifer B.Unger. 2004. “Social Network Predictors of Bullying and Victimization.” Adolescence39:315.
Newman, Mark E. J., and Michelle Girvan. 2004. “Finding and Evaluating Community Struc-ture in Networks.” Physical Review E 69:026113. https://doi.org/10.1103/PhysRevE.69.026113.
Offer, Shira, and Claude S. Fischer. 2017. “Difficult People: Who Is Perceived to Be De-manding in Personal Networks and Why Are They There?” American Sociological Review83:111–42. https://doi.org/10.1177/0003122417737951.
Onnela, Jukka-Pekka., Jari Saramaki, Jorkki Hyvönen, Gyorgy Szabo, David Lazer, KimmoKaski, Janos Kertesz, and Albert-Laszlo Barabasi. 2007. “Structure and Tie Strengthsin Mobile Communication Networks.” Proceedings of the National Academy of Sciences104:7332–6. https://doi.org/10.1073/pnas.0610245104.
Palla, Gergely, Albert-Laszlo Barabasi, and Tamas Vicsek. 2007. “Quantifying Social GroupEvolution.” Nature 446:664–7. https://doi.org/10.1038/nature05670.
Rand, David G., Samuel Arbesman, and Nicholas A. Christakis. 2011. “Dynamic SocialNetworks Promote Cooperation in Experiments with Humans.” Proceedings of the NationalAcademy of Sciences 108:19193–8. https://doi.org/10.1073/pnas.1108243108.
Rapoport, Anatol. 1963. “Mathematical Models of Social Interaction.” Pp. 493–580 inHandbook of Mathematical Sociology, edited by R. A. Galanter, R. R. Lace, and E. Bush. NewYork, NY: Wiley.
Rawlings, Craig M., and Noah E. Friedkin. 2017. “The Structural Balance Theory of SentimentNetworks: Elaboration and Test.” American Journal of Sociology 123:510–48. https://doi.org/10.1086/692757.
sociological science | www.sociologicalscience.com 216 March 2019 | Volume 6

Isakov et al. Structure of Negative Social Ties
Sampson, Samuel F. 1969. “Crisis in a Cloister.” PhD dissertation, Department of Sociology,Cornell University.
Shakya, Holly B., Derek Stafford, D. Alex Hughes, Thomas Keegan, Rennie Negron, JaiBroome, Mark McKnight, Liza Nicoll, Jennifer Nelson, Emma Iriarte, Maria Ordonez, EdoAiroldi, James H. Fowler, and Nicholas A. Christakis. 2017. “Exploiting Social Influenceto Magnify Population-Level Behaviour Change in Maternal and Child Health: StudyProtocol for a Randomised Controlled Trial of Network Targeting Algorithms in RuralHonduras.” BMJ Open 7:e012996. https://doi.org/10.1136/bmjopen-2016-012996.
Shannon, Paul, Andrew Markiel, Owen Ozier, Nitin S. Baliga, Jonathan T. Wang, DanielRamage, Nada Amin, Benno Schwikowski, and Trey Ideker. 2003. “Cytoscape: ASoftware Environment for Integrated Models of Biomolecular Interaction Networks.”Genome Research 13:2498–504. https://doi.org/10.1101/gr.1239303.
Simmel, George. 1950. The Sociology of Georg Simmel. New York, NY: Simon and Schuster.
Szell, Michael, Renaud Lambiotte, and Stefan Thurner. 2010. “Multirelational Organizationof Large-Scale Social Networks in an Online World.” Proceedings of the National Academyof Sciences 107:13636–41. https://doi.org/10.1073/pnas.1004008107.
Tang, Jiliang, Yi Chang, Charu Aggarwal, and Huan Liu. 2016. “A Survey of Signed NetworkMining in Social Media.” ACM Computing Surveys 49:42. https://doi.org/10.1145/2956185.
Tooby, John, and Leda Cosmides. 1996. “Friendship and the Banker’s Paradox: OtherPathways to the Evolution of Adaptations for Altruism.” Proceedings of the British Academy88:119–43.
Wang, Peng, Garry Robins, and Philippa Pattison. 2009. “PNet Software.” Melbourne Schoolof Psychological Sciences, The University of Melbourne. http://www.melnet.org.au/pnet/.
Wang, Hongwei, Fuzheng Zhang, Min Hou, Xing Xie, Minyi Guo, and Qi Liu. 2018. “SHINE:Signed Heterogeneous Information Network Embedding for Sentiment Link Prediction.”Proceedings of the Eleventh ACM International Conference on Web Search and Data Mining592–600. https://doi.org/10.1145/3159652.3159666.
White, Harrison. 1961. “Management Conflict and Sociometric Structure.” American Journalof Sociology 67:185–99. https://doi.org/10.1086/223084.
Xia, Ling, Connie Y. Yuan, and Geri Gay. 2009. “Exploring Negative Group Dynamics:Adversarial Network, Personality, and Performance in Project Groups.” ManagementCommunication Quarterly 23:32–62. https://doi.org/10.1177/0893318909335416.
sociological science | www.sociologicalscience.com 217 March 2019 | Volume 6

Isakov et al. Structure of Negative Social Ties
Acknowledgments: We thank Emily Erikson, Dan Gilbert, David Rand, Yongren Shi, HiroShirado, Maggie Traeger, Tom Snijders, Gijs Huitsing, and Arnav Tripathy for theirhelpful comments. We are also grateful to the data collection and software teams forthe Honduras project, including Rennie Negron, Liza Nicoll, and Mark McKnight.This research was supported by a grant from the Bill and Melinda Gates Foundation,the Tata Group, the National Institute on Aging of the National Institutes of Health(grant P30-AG034420), the National Science Foundation (grant IIS-1409177), and theOffice of Naval Research (grants N00014-17-1-2131). The authors declare no competinginterests.
Alexander Isakov: Yale Institute for Network Science, Yale University; Department ofSociology, Yale University. E-mail: [email protected].
James H. Fowler: Department of Medicine, University of California, Sand Diego; Polit-ical Science Department, University of California, San Diego. E-mail: [email protected].
Edoardo M. Airoldi: Department of Statistical Science, Fox School of Business, TempleUniversity; Department of Statistics and Institute for Quantitative Social Sciences,Harvard University. E-mail: [email protected].
Nicholas A. Christakis: Department of Ecology and Evolutionary Biology, Yale University;Department of Statistics and Data Science, Yale University.E-mail: [email protected].
sociological science | www.sociologicalscience.com 218 March 2019 | Volume 6